the design of a novel mother wavelet that is tailor-made ... content/finalized...
TRANSCRIPT

Measurement 110 (2017) 176–191
Contents lists available at ScienceDirect
Measurement
journal homepage: www.elsevier .com/locate /measurement
The design of a novel mother wavelet that is tailor-made for continuouswavelet transform in extracting defect-related features from reflectedguided wave signals
http://dx.doi.org/10.1016/j.measurement.2017.06.0380263-2241/� 2017 Elsevier Ltd. All rights reserved.
Abbreviations: CWT, Continuous Wavelet Transform; DWT, Discrete WaveletTransform; FFT, Fast Fourier Transforms; PZT, Piezoelectric Transducers; NDT, Non-destructive Testing; SNR, Signal to Noise Ratio; TFR, Time-FrequencyRepresentation.⇑ Corresponding author.
E-mail addresses: [email protected] (J. Chen), [email protected](J. Rostami), [email protected] (P.W. Tse), [email protected] (X. Wan).
Jingming Chen ⇑, Javad Rostami, Peter W. Tse, Xiang WanDepartment of Systems Engineering and Engineering Management, City University of Hong Kong, Tat Chee Avenue, Kowloon, Hong Kong, China
a r t i c l e i n f o
Article history:Received 22 April 2016Received in revised form 19 June 2017Accepted 27 June 2017Available online 29 June 2017
Keywords:Non-destructive testingUltrasonic guided wavesWall-covered pipesCorrosion detectionContinuous wavelet transform (CWT)Design of wavelet
a b s t r a c t
Guided waves are increasingly being researched and applied for use in defect detection. Because differentguided wave mode conversions and noise are inevitably generated by wall-covered sections of pipe, thereceived signals that contain the defect information are often overwhelmed by these undesired distur-bances. Hence, the received signals must be analysed by an effective signal processing method so thatthe critical defect information can be extracted from the blurred received signals. Researchers have useddifferent signal processing methods, such as continuous wavelet transform (CWT), to filter out theunwanted part of the received signals. Different filter bands can be generated from the mother waveletof the CWT. The selection of a suitable mother wavelet can minimise the levels of noise and unwantedmodes. However, the selection of the mother wavelet is an intensive trial and error process. In this paper,a new approach for selecting the most suitable mother wavelet for the inspection process was developed.Instead of using the Morlet wavelet as the mother wavelet, as suggested by other researchers, here pro-pose the use of the emitted tone-burst signal as the mother wavelet for generating different filter bandsof CWT. This type of novel mother wavelet is called the tone-burst wavelet. To verify its effectiveness,tone-burst wavelet was tested via simulation and in field tests. Simulated models of pipes were builtusing the finite element analysis tool to investigate the propagation characteristics of guided waves alongthe inspected pipes, especially on the wall-covered section. After the successful completion of the simu-lation, laboratory tests were conducted using building pipes that had corroded areas in the wall-coveredsections. Finally, field tests were conducted using in-service building pipes erected in a tall building. Theproposed tone-burst wavelet de-noising method was found to be effective in extracting the defect-related signals. Hence, the location and severity of the corrosion were successfully determined.Moreover, the results showed that the tone-burst wavelet was superior to the conventional Morlet wave-let when used as the mother wavelet of CWT. With the help of the proposed method, the likelihood ofpipe ruptures that can trigger gas leakage and explosions can be minimised.
� 2017 Elsevier Ltd. All rights reserved.
1. Introduction
Pipes are crucial infrastructural components. Pipes are com-monly used to provide natural gas and water to households in tallbuildings. These pipes are called risers in the public utilities andbuilding services sector. Risers are short pipes that connect the
external piping system erected on the outside wall of a tall buildingto each kitchen or bathroom through the building’s concrete walls.The section of the pipes that is covered by the wall is prone to cor-rosion as a result of rain water leaking through the wall. Tradi-tional non-destructive testing (NDT)-based inspection methods,such as eddy current testing [1,2], ultrasonic inspection technology[3,4] and magnetic flux leakage [5], fail to detect the corrosioneffectively because most of the corroded areas are located at thesection of the pipe that is covered by the wall. The pipe may rup-ture, triggering a gas leak and ultimately a gas explosion, if the cor-rosion is ignored. Thus, ensuring the safety of the pipe is a primeconcern in cities that have building piping systems.

J. Chen et al. /Measurement 110 (2017) 176–191 177
In recent years, the guided wave inspection technique has beenwidely investigated in NDT [6–11]. Inspection using guided waveshas multiple distinguishing features, including long distanceinspection with less energy attenuation and the use of a singletransducer to launch and receive the guided wave signals. Thistechnique is able to identify different defects in straight pipes, suchas notches, rust patches and cracks [12–16]. Carandente and Caw-ley [12] used a torsional mode T (0, 1) to study the influence ofthree-dimensional defects in different pipe shapes on the reflectedwave. Their results showed that the determination of the maxi-mum depth of a complex discontinuity is feasible in practice.Demma et al. [9] used a torsional mode T (0, 1) to investigate thereflections from cracks and notches of varying depths, circumfer-ences and axial extents in pipes. Their results demonstrated thatas the depth increased, the reflection coefficient from axisymmet-ric cracks monotonically increased at all frequencies. Moreover, atany given depth, as the frequency increased, the reflection coeffi-cient increased. In a different study, Wang et al. [13] found that areflection from an artificial notch could be separated into twowaves, namely, a front-edge wave and a back-edge wave. Thesetwo waves can also be used to evaluate the axial length of artificialnotches in pipes and could potentially be used to measure the cor-rosion area of practical corroded pipes. Nishino and Ogura [14]used a piezoelectric transducer to generate and receive guidedwave signals and confirmed that it was sensitive to defects in thestraight pipes of a nuclear power plant. Cheong et al. [15] proposeda circumferential guided wave technique to quantify axial flaws,and this guided wave-based technique was effective in detectingstraight pipe flaws and the sizes of the defects in feeder pipes. Inaddition to the investigations of straight pipes, the guided wavetechnique has been used to inspect elbow and U-bend pipes.Verma et al. [17] used finite element (FE) simulation to investigatethe fundamental axisymmetric L(0,2) propagation across bendswith different bend angles. Their results showed that as the bendangle reduced, the effects of mode-conversion on the transmissionand velocities of axisymmetric L (0, 2) increased. For the guidedwave propagation in embedded or buried structures. Beard andLowes [18] studied the rock bolts embedded in solid limestone,and had proved that the guided wave is capable of identifyingdefect in different frequency modes. Leinov et al. [19] studied theattenuation behaviour of the guided wave propagation in pipe bur-ied in sand. The comparison results of the guided wave modespropagation and attenuation study had proved that the L (0, 2)mode was lower attenuation then T (0,1) mode for the sand cov-ered pipe study. Others studies mainly focused on the cylinderstructure with different coating materials for the guided wavedetection and attenuation [20–24]. Most of the guided wave-based inspection methods for non-destructive evaluation and test-ing are limited to industrial plant-in-service pipes and are notapplicable to the building pipes used in civilian infrastructure[25–28]. Gas pipes that are covered by concrete walls have seldombeen studied in the use of guided wave to inspect corrosion,especially for those exist and in-service gas pipes that are installedin apartment buildings. This is because tremendous resources arerequired to set up the on-site testing platform in buildingsand because it is difficult to determine the effect on guided waveof a concrete wall that has partially covered the in-servicegas pipes.
Compared to the numerical investigation of guided waves inwhich encounter very clear signals for structures with simplegeometries, real experimental signals are generally more compli-cated. In this paper, the targeted research work is to find effectivesignal processing techniques to filter out the noise and undesiredguided wave modes. Once these disturbances have been removed,the signals reflected from the corroded parts of the pipe can beoptimised and extracted. The physical extent of each corroded area
can then be correctly determined. A number of advanced signalprocessing techniques were investigated and tested on a pipeunder a laboratory environment. The general practice in signal pro-cessing is to utilise time-frequency representation (TFR). Unlikethe Fourier transform, which gives general information about thefrequency contents of a signal, TFR presents local frequency com-ponents in time [14,15]. However, if the signal is narrowband withmany overlapping modes in very close frequency components, theconventional TFR methods may not provide promising results. Thereflected signals are further complicated when the transducers areunable to excite a pure non-dispersive wave mode. The complica-tions deepen with the reflections from undesired wave modes andnoise. In this regard, a good signal processing technique must beable to separate the critical information of a signal that has beenoverwhelmed by unwanted components and should subsequentlyincrease the signal to noise ratio (SNR). Of the many signal process-ing techniques proposed for wave separation, a wavelet transformthat has the capacity to localise time-frequency atoms and de-noise with some modifications can facilitate signal interpretationfor defect detection proposes.
The propagation of guided wave in metallic structures normallygenerate non-stationary responses due to its dispersive phe-nomenon [29]. In previous study, the guided wave inspectionmethod also had been proved that this technique is able to distin-guish between a normal and a corroded pipe even they were cov-ered by a concrete wall [30]. But the complication of geometrystructure deepens with the reflections from undesired wave modesand noise. Therefore, it is necessary to use an advanced signal pro-cessing method to separate the critical information from the rawsignals that have been overwhelmed by many unwanted compo-nents. Niethammer et al. [31] introduced the empirical modedecomposition (EMD) method into NDT, combined with theHilbert-Huang transform (HHT) [32], but they failed to extractthe desired mode while the multi-modes were using the same fre-quency band. In addition, as stated above, many signal processingtechniques and useful methods also had been proposed for guidedwave separation [33–36]. In this regard, continuous wavelet trans-form (CWT) was introduced, because its capacity of localizingtime-frequency atoms and de-noise with some modifications canfacilitate signal interpretation for defect detection purposes. How-ever, in the real world, improper selection of the mother waveletwill significantly affect the usefulness of this method in extractingdefect information from the reflected signals. According to litera-ture review, a number of researchers have used the Morlet andGabor wavelets to analyse the defect detection signal [37–40]. InHoon’s study, a designed input waveform based on the Morletwavelet was excited in the specimen for damage detection, andthe damage detection algorithm was found to be practicable evenin varying boundary conditions and environmental temperatures[38,41,29]. In a crack identification method using CWT, the Gaborwavelet was used to analyse the guided wave signals to separatean appropriate frequency component to evaluate the crack. Theappointed wave mode was successfully extracted from the multi-mode and dispersive signals [42]. In these two mother wavelets,the real-valued wave shapes (about five cycles) are similar. How-ever, in the real case, the resemblance of the signals decreases ifthe excited tone-burst signal varies. To deal with this problem, anew mother wavelet family was designed based on the excitedtone-burst signal to locate the pulse-echo signal from the defect.In this case, only reflected signals that had a shape similar to theselected mother wavelet were extracted. As a result, the noiseand undesired wave mode could be filtered out from the rawsignals.
Most of the guided wave-based inspection methods for non-destructive evaluation and testing are limited to industrial plant-in-service pipes and are not applicable to the building pipes used

178 J. Chen et al. /Measurement 110 (2017) 176–191
in civilian infrastructure [25–28]. The typical building pipe used todeliver natural gas in Hong Kong is designed according to the Bri-tish Standard. The nominal size and thickness series of the pipeinvestigated in this study are given in Table 1.
The roadmap of the research study is as follows. First, FE-based simulations were conducted to experimentally investigatethe capability of the guided wave technique in detecting pipecorrosion. COMSOL [43] software was used to simulate theguided waves propagating in a regular pipe and a pipe thatwas partially covered by a concrete wall. The characteristicsof the reflected signals from these pipes were revealed throughsimulation. In this part, the effects of the guided wavetechnique when propagating along the pipes, both enclosed inthe wall and fully outside of the wall, were modelled andsimulated.
Inspired by the simulation results, several experiments wereconducted in laboratory tests to validate the capability of theguided wave technique in detecting real corrosion in pipes usingcorroded pipes provided by a gas company in Hong Kong. It isworth noting here that the corrosion was naturally formed ratherthan artificially produced in laboratory. The normal and corrodedpipes were partially covered by a concrete wall and tested inlaboratory.
Encouraged by the results from the laboratory tests, field testswere conducted on partially wall-covered pipes installed in a realhousehold of a tall building. The field tests were conducted intwo phases. In the first phase, an in-service pipe with real corro-sion in the wall-covered section was inspected using guided waves.Then, the pipe was uninstalled from the concrete wall, and the sizeof the corroded area in the wall-covered section was measured andrecorded. In the second phase, a new pipe was installed in the walland then inspected using guided waves. The temporal waveformsof the reflected signals were compared with those of the originalcorroded pipe to determine the effectiveness of the guided wavesin detecting the corrosion occurring in the wall-covered sectionof the pipes. The above works and results prove that this researchwork provides significant contribution and new insights in theguided wave inspection technique.
The rest of this paper is organised as follows. In Section 2,the tone-burst wavelet is introduced. In Section 3, the develop-ment of the simulation models and set the parameters of theFE analysis for guided waves in wall-covered pipes were dis-cussed. The experimental results on guided wave propagationin pipes with and without concrete covered sections werereported. In addition, the characteristics of the signals reflectedby the pipes were revealed through the help of simulation. InSection 4, the experimental set-up platform for conducting thetests on pipes both inside and outside the concrete wall wasdescribed. The experimental results obtained from laboratoryusing real pipes were also reported. In Section 5, experimentalsetup for the field tests were summarized with the details. Theeffectiveness of guided waves with the tone-burst wavelet ininspecting the real corrosion occurring in the wall-covered sec-tion of an in-service pipe was also detailed in this section.Finally, concluding remarks and areas for future improvementwere given in Section 6.
Table 1The geometrical parameters of the building pipe that was investigated.
Outside diameter(mm)
Thickness(mm)
Mass of black tube
Plain end(kg/m)
Screwed and socketed(kg/m)
33 4 1.87 1.88
2. Continuous wavelet transform using the excited tone-burstas the mother wavelet
Unlike the FE-based simulation of guided waves, experimentaldata obtained either in the lab or field tests contain manyunwanted components. Theoretically, the obtained signals musthave the same frequency components as the excited signals, asshown in Fig. 1.
Wavelet transform [44] is a powerful tool that decomposes sig-nals with respect to their frequency components. The decomposi-tion of a signal S(t) is implemented by finding the signalcorrelation with the mother wavelet w(t):
WTw a; bð Þ ¼ 1ffiffiffia
pZ 1
�1S tð Þw t � b
a
� �dt ð1Þ
where w⁄(t) denotes the complex conjugate of the mother waveletw(t), a is the dilation parameter (scale) and b is the translation. Themother wavelet must be chosen such that it has the maximumresemblance with the excitation signal. Narrowband tone-burst sig-nals are typically used to excite the guided wave. Tone-burst signalsare simply sine waves modulated by windows such as the Ham-ming window [45,46]:
S tð Þexcitation ¼ sin xt þ hð Þ 0:08þ 0:46 1� cosxtN
� �� �� �ð2Þ
where t, x, h and N are the time, circular central frequency, phaseand number of cycles, respectively. Theoretically, the excited guidedwave should have the same frequency components as shown inFig. 1. The figure shows a typical hamming windowed tone-burstwith 5-cycles at a centre frequency of around 180 kHz (Fig. 1(a))and its corresponding frequency spectrum (Fig. 1(b)). The frequencyband can be easily altered by changing the number of cycles. Thenarrower band signals can be obtained by increasing the numberof cycles in the tone-burst signals (Fig. 1).
In this case, if the excitation signal is a 5-cycle tone-burst, forexample, the Morlet wavelet could be a good choice. However, thisresemblance decreases if the number of cycles in the excitationtone-burst signal is altered. Alternatively, the excitation signalcan be considered the mother wavelet. In this case, CWT can helpto decompose the reflected signals with regard to their frequencycomponents. The decomposition is implemented by finding a sig-nal correlation with the selected mother wavelet. Because whenused the excited tone-burst signal as the mother wavelet (calledthe tone-burst wavelet), only the reflected signals that had a shapesimilar to the excited tone-burst mode (with a high correlationvalue with the mother wavelet of CWT) could be extracted fromthe received and defect-related signals. Any noise and undesiredmodes that did not have a shape similar to the shape of the excitedtone-burst mode (with a low correlation value with the motherwavelet of CWT) were removed from the raw and reflected signals.Hence, the largest value of the wavelet coefficients facilitated the
Fig. 1. Hamming windowed, 5-cycle tone-burst at 180 kHz centre frequency and itsspectrum.

J. Chen et al. /Measurement 110 (2017) 176–191 179
exposure of a probable small defect signal in a highly contaminatedsignal.
3. Finite element-based simulation for corrosion detection inpipes
The FE-based simulation was used to investigate the propaga-tion characteristics of guided waves in a variety of pipes that wereboth open to the air and covered by concrete walls. This was nec-essary to determine whether the excited guided waves were ableto travel through the parts of the pipes that were covered by thewall. The simulation was also used to observe the effects of thereflected guided waves after they encountered defects in the pipes.The parameters used in the simulation process are tabulated inTable 2.
3.1. Procedure of the finite element-based simulations
The central frequency needed to be determined prior to thegeneration of the guided wave. The studied pipe was 33 mm inouter diameter and 4 mm in thickness. The dispersion curves forthe pipe were drawn using the Disperse software [47] and areshown in Fig. 2(a) and (b). The guided wave modes in a hollowcylinder were labelled F(m,n), L(0,n) and T(0,n) are respectivelyrefer to flexural, longitudinal, and torsional modes, the wavesbehaviours were illustrated by Wang [46]. A frequency range of50 kHz–500 kHz was considered due to its less dispersive nature.In this study, the emitted tone-burst signal was generated alongthe z-axis. Therefore an axisymmetric L mode was predominatelypropagating along the tested pipe. The L (0,2) mode was chosenbecause it can be excited in relatively high propagation speedbut has less dispersive behaviour within the excited centre fre-quency range. Furthermore, the L(0,2) mode also can be generatedselectively by defined geometry of PZT (the other modes have anamplitude many times lower) [48]. Consequently, the L(0,2) modewas predominately emitted in this study within the centre fre-quency range of 100–200 kHz.
It must be noted that although the less dispersive area of theguided wave dispersion curves was selected, mode superposition[49] or conversion [50] may also occur due to the interaction withdefects or complex geometrical features [51] such as corner,curved surface and end. In Fig. 2(c), the simulated guided wave sig-nals were plotted by Disperse software [47] to explain the phe-nomenon of modes superposition that may happen during realpipe inspection. For the case of PZTs were mounted at the leftend of pipe as the actuator and the sensor by using the pulse-echo mode. Fig. 2(c) shows that when the emitted wave is super-posing with the reflected wave, it may increase of the number ofemitted wave cycles. The pink waveform on Fig. 2(c) is the emittedguided wave, whilst the blue waveform is the guided wave signalreflected by the nearby end of the pipe. The original emitted signalhas 5 cycles. Due to summation of the emitted and reflected sig-nals, the superimposed signal has 6 cycles as shown in the bottomdiagram of Fig. 2(c). Furthermore, when the guided wave signalsencountered the interface between two materials, defect or end,the numerous reflections and refractions resulted in a complicatedsignal.
Table 2The parameters used in the simulations.
Material Density (q)kg=m3 Young’s modulus (E)GPa Poisson’s ratio (k)
Steel 7800 200 0.33Concrete 2300 25 0.10
Fig. 3 shows the traveling paths of the guided wave signals invarious pipes that had different health conditions and were locatedboth inside and outside of the concrete wall. Here, the simulatedpipes were modeled by COMSOL [43] with the same parametersas those generally used for building pipes in Hong Kong. The sim-ulation models were created because after the completion of thefield test, authors found that the corrosion in the real tested pipestarted before entering the wall-covered section. That is, the designof the different pipe models and their simulations were not arbi-trary but designed according to the real situations of the pipes usedin the laboratory experiments and field tests. Two of the simulatedpipes were in normal health condition (Fig. 3(a) and (b)), with oneof them covered by a concrete wall (Fig. 3(b)). The remaining twopipes were both defective and covered by the concrete wall. Thedefects in the two defective pipes were located in different areas.As shown in Fig. 3(c), the defect was located in the middle of a pipesection that was covered by the wall. As shown in Fig. 3(d), thedefect started before the entry to the concrete wall and extendedinside the wall-covered section. The defect areas were simulatedas notches with different lengths.
In this study, a Hamming windowed tone-burst as the excitedsignal was used. The excitation signal was performed by imposingthe prescribed displacement, which consisted of a five cycle tem-poral waveform with a centre frequency at 180 kHz. The excitationguided wave was built using Eq. (2).
The boundary conditions for the simulation were set as theright ends of the pipes were fixed and the inner and outer surfacesof the pipes were free. This study was based on the assumptions oflinear elasticity. Hence, the general equations of motion in matrixform are given as [51]:
M€uþ C _uþ Ku ¼ Fa ð3Þwhere M is the structural mass matrix; C is the structural dampingmatrix; K is the structural stiffness matrix; Fa refers to the vector ofapplied loads; and u, _u and €u are the displacement vectors and theirtime derivatives, respectively. The damping effect was not consid-ered in this study [51].
To obtain adequate accuracy and high resolution, the properelement size and time step should be selected. In general, a densermesh will give a more accurate result, but will also increase therequired computational time and resources. Authors adopted themaximum element size, DI and time step, Dt to ensure accuracyfrom references [52,51] as follows:
DI ¼ kmin
20ð4Þ
Dt ¼ 120fmax
ð5Þ
where kmin and fmax denote the shortest wavelength and the highestfrequency of interest used in the FE simulation, respectively.
According to Eqs. (4) and (5), the calculated element size andtime step for the 180 kHz excitation signal are 0.695 mm and0.28 ls. Thus, a mesh size of 0.4 mm and a time step of 0.2 lsshould be sufficient to ensure accuracy. Fig. 4(a)–(d) show the sim-ulated results from emitting L (0, 2) mode from excitation point Aand then allowing them to propagate along the pipes under fourdifferent situations. Fig. 4(a) and (b) show the propagation ofguided wave signals along the normal pipes with and without cov-erage from the concrete wall, respectively. Here, the different col-ours represent different amplitudes of the signals. It should benoted that the amplitudes of the guided wave signals were atten-uated when they went through the concrete wall. Moreover, theamplitudes of the guided wave signals were axis-symmetric.Fig. 4(c) and (d) illustrate the amplitude variances of the signalswhen they met the defects located in the middle section of the wall

Fig. 2. Multi-guided wave modes in the tested pipe.
180 J. Chen et al. /Measurement 110 (2017) 176–191
covered pipes and at the entry of the wall with the extension insidethe wall covered section, respectively.
3.2. Finite element analysis-based simulations
The pulse-echo mode was used in this study. The guided wavesignals reflected by different pipes under different conditions areplotted in Fig. 5(a)–(d). As shown in Fig. 5(a) and (b), the concretewall creates some effects to the propagation of the guide wavesthat attenuated the propagating energy. The emitted guided wavewas propagating along the pipe as a wave packet until it encoun-tered a discontinuity existed in the tested pipe. This discontinuitycan be the end of the pipe, intrusion of other material or a defect.The existence of discontinuity will reflect the wave packet thatcontains the information of location, size or type of discontinuity[48]. Fig. 5(a) shows the reflected wave collected from a simulatednormal pipe without covered by the concrete wall. However, thetrue reflected wave is inevitably contaminated by other unwantedmodes and noise [53,54]. Moreover, the propagation of guidedwave is inherently dispersive. Hence, it may cause the wave packetto spread in space and time and consequently change the original
shape of the emitted waveform after it has been propagating alonga certain distance of the tested pipe [55,48]. In comparison withFig. 5(a), and (b) shows two reflected signals from both sides ofthe concrete wall. The simulation results proved that the guidedwave technique was able to penetrate the concrete wall and reachthe other end of the inspected pipe. Fig. 5(c) and (d) show that thesignals were reflected from the pipe defects. Hence, the resultsdemonstrate that the guided wave technique was able to identifythe locations of the defects even when they were embedded in aconcrete wall. Moreover, as shown in Fig. 5(c) and (d), althoughthe same defect sizes were used in the simulations, the amplitudeof the guided wave signals reflected from the defect located at theentry of the concrete wall was larger than that in the middle of theconcrete wall. In the process of interaction of guided wave with adefective area and the concrete section, the emitted wave modemay be converted into other undesired modes that are also propa-gating along the pipe at different velocities depended on the typeof mode converted. The phenomenon of mode conversionoccurred in the reflection of L(0,2) mode which has been provedand demonstrated by Lowe et al. [56]. In Fig. 5(d), the amplitudeof the guided wave signals reflected from the defect, which was

Fig. 3. Schematic illustrations of the simulated normal and defective pipes.
J. Chen et al. /Measurement 110 (2017) 176–191 181
located at the entry of the concrete wall was larger than that of theother cases because they were both in the same location as illus-trated in Fig. 3(d). Therefore, an effective signal processing methodmust be employed, such as the employment of the excited tone-burst based wavelet analysis to extract the true guided wave sig-nals reflected by the defect that may overwhelmed by the signalscreated by other wave mode conversion.
3.3. Application of CWT for defect detection of a noisy signal
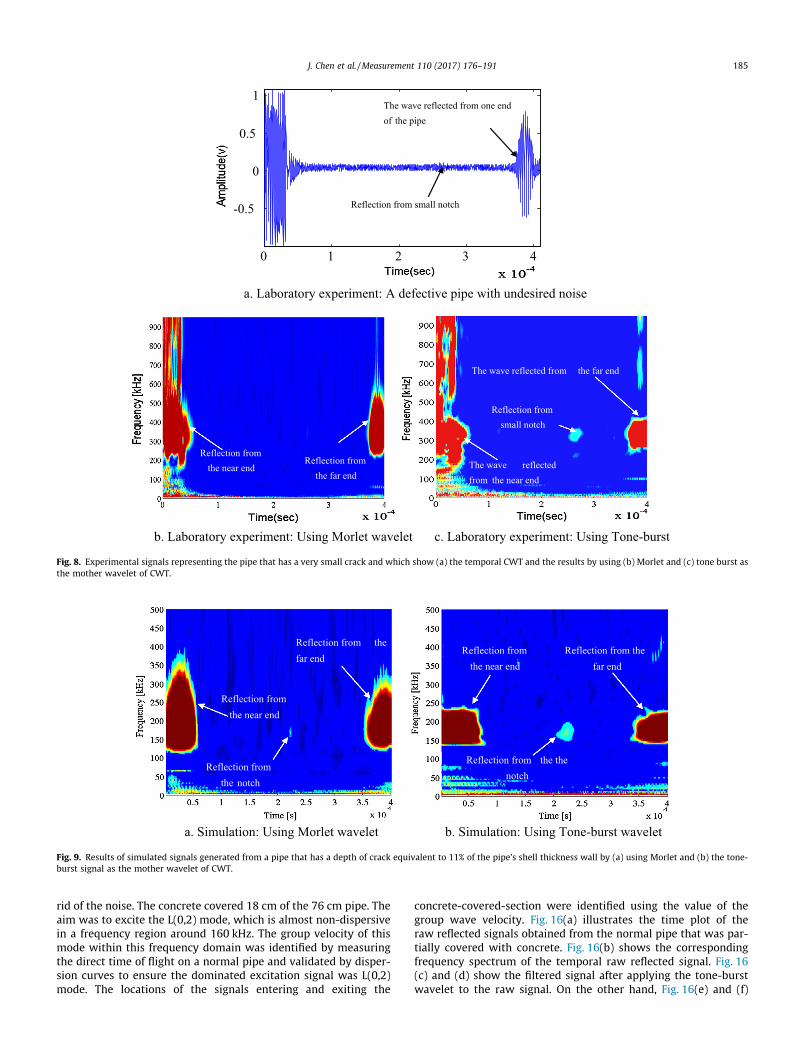
Unlike the short-time Fourier transform, which gives generallocal feature information of a defect signal in fixed windows [57],CWT has more choices of basis function to match a defect signal.Localising time-frequency atoms and de-noising with some modi-fications can facilitate signal interpretation for NDT proposes[58,59]. However, in the real world, improper selection of themother wavelet will affect the accuracy of CWT in extracting defectinformation from the reflected signals. Thus, for ease of compar-ison, the 10-cycles tone-burst and Morlet wavelets of CWT areshown in Fig. 6(a) and (b). As can be seen from the results obtainedfrom the simulation, the defects were notches with 5% and 30%depth of shell thickness in the simulation and 5% depth of shellthickness in the laboratory experiment. Fig. 7(a)–(c) illustrate theguided wave signals of the defective pipes obtained from the sim-ulation. It must be noted that in real experiments, the acquired sig-nals tend to be polluted as a result of the noise and imperfectionsof the experiment. In that case, if the structure has a very smalldefect, its detection will be challenging. The difficulty comes fromthe lower energy in the defect signal that can be hidden by thenoise. As shown in Fig. 8(a) and (b), by using the Morlet wavelet,the small crack, which was tested in the laboratory experiment,can hardly be seen due to the overwhelming noise. In contrast,
as shown in Fig. 8(c), by using the tone-burst wavelet, the smallcrack can be seen in the time-frequency diagram.
As can be seen in Fig. 8(b), the small crack in the laboratoryexperiment is still hidden in the noise after the application of theMorlet wavelet. As abovementioned, because the tone-burstmother wavelet has the maximum resemblance with the excita-tion signal, it will generate larger wavelet coefficients. As a result,while the Morlet wavelet couldn’t expose the smaller defect ineither the simulation or the laboratory experiment, the tone-burst wavelet reveals the hidden defect signal that was concealedin the noise. As the excitation signal was a tone burst signal, a goodchoice for the mother wavelet which is the most similar to theexcitation signal. Thus, the tone-burst wavelet was preferred overother available mother wavelets for the investigation of the guidedwave signals.
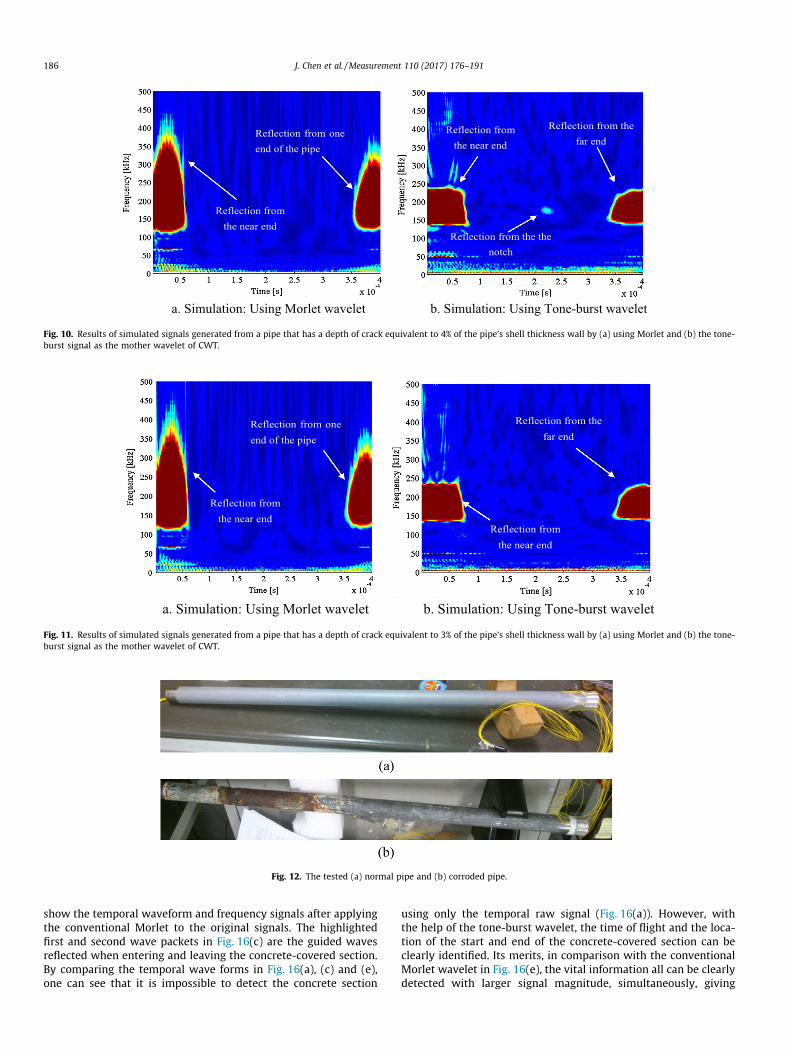
To verify the effectiveness of tone-burst wavelet, quantitativecomparisons have been done in different defects depths (11%, 4%and 3% of the pipe’s shell thickness) with undesired noises, the per-formance of the proposed methods using the tone-burst waveletand the conventional Morlet wavelet as the mother wavelet withthe results shown in Figs. 9–11 respectively.
The comparison results indicated that the minimum depth ofcrack that can be revealed by Morlet and the tone-burst waveletare 11% and 4% of the pipe’s shell thickness respectively. For thecase of having a depth equivalent to 3% of the pipe’s shell thick-ness, both the Morlet and the tone-burst wavelet were failed toreveal the hidden crack.
4. Experimental verification in laboratory scale
To prove the feasibility of detecting pipe corrosion using theguided wave technique, several experiments have conducted in

Fig. 4. A 2.5D visualisation of the emitted guided waves propagation amplitudes when traveling along (a) the normal pipe, (b) the wall covered part of the normal pipe, (c) adefect located in the middle of the wall covered section and (d) a defect starting at the entry of the wall and extending into the wall-covered section.
182 J. Chen et al. /Measurement 110 (2017) 176–191
laboratory. The corrosion was naturally formed and the pipes wereprovided by the sole gas supplier in Hong Kong. Piezoelectric sen-sors were circumferentially installed on the pipe. Pipes with differ-ent health conditions were then investigated using the guidedwave technique.
4.1. Laboratory experimental setup and results
4.1.1. The experimental setup of the fully exposed pipesTo validate the results provided by the FE simulations, here first
investigated two steel pipes. Fig. 12 shows a normal pipe with alength of 76 cm and a corroded pipe with a length of 78 cm. Bothpipes were in-service, manufactured with the same materials andof the same size. These experiments were conducted using piezo-electric transducer (PZT) to excite a 5-cycle Hamming windowedtone burst. The PZTs were manufactured by Bao Ding Hong ShengAcoustics Electron Apparatus Co., Ltd. [60].
The diagram and dimensions of one of the PZT are shown onFig. 13. This figure depicts the scheme of PZT’s structure with itslength, width and thickness for generating the desired guided wavemode. PZT is a device that uses the piezoelectric effect [61], whichby applied an external electric field across two of its faces to phys-ically changes shape to generation ultrasonic guide wave. In thiscase, the PZT can be used to excite longitudinal mode into theinspected pipes.
The tone burst was generated by an RITEC 4000 pulser andreceiver (RITEC Inc., USA). The exciter was applied symmetricallywith eight strips of PZT materials. The second experiment was per-formed with the pipes partially covered by the concrete wall.
The experiment was conducted using pulse-echo mode. Thecorrosion information can be observed by comparing the reflectedsignals collected from the normal pipe to those collected from thecorroded pipe, as shown in Fig. 14. However, the capacity for detec-tion may depend on the severity of the corrosion. Minor corrosion

(c) The reflected wave signals collected from a simulated pipe that has a defect located in the middle of the wall covered section.
(a) The reflected wave collected from a simulated normal building pipe without the concrete wall.
-01
-0.08
-0.06
-0.04
-0.02
0
0.02
0.04
0.06
0.08
0.1The waves reflected from the end of the pipe
Time (sec)
Dis
plac
emen
t fie
ld, Z
co
mpo
nent
(mm
)
0.5 1 × 10 -4
1.5 2
-0.1
-0.05
0
0.05
0.1 The wave reflected from the left side of the concrete wall
The wave reflected from the right side of the concrete wall
The wave reflected from the end of the pipe
Time (sec)
Dis
plac
emen
t fie
ld, Z
co
mpo
nent
(mm
)
0.5 1 1.5 2 × 10 -4
-0.1
-0.08
-0.06
-0.04
-0.02
0
0.02
0.04
0.06
0.08
0.1
The wave reflected from the left side of the concrete wall
The wave reflected from the right side of the concrete wall
The wave reflected from the end of the gas pipe riser
Time (sec)
Dis
plac
emen
t fie
ld, Z
co
mpo
nent
(mm
)
The wave reflected from the defect
1 0.5 1.5
× 10 -4
(b) The reflected wave collected from a simulated normal pipe partially covered by a wall.
(d) The reflected wave signals collected from a simulated pipe that has a defect located at the entry of the wall and then extends further inside the wall covered section.
-0.1
-0.05
0
0.05
0.1 The wave reflected from the defect
The wave reflected from the right side of the concrete wall
The wave reflected from the end of the pipe
Time (sec)
Dis
plac
emen
t fie
ld, Z
co
mpo
nent
(mm
)
The wave reflected from the left side of the concrete wall
0.5 1 1.5 2 × 10 -4
2
Fig. 5. The results generated by the simulation under different pipe conditions.
J. Chen et al. /Measurement 110 (2017) 176–191 183

time(ms) time(ms)
Amplitude
Amplitude
Fig. 6. (a) 10-cycle tone-burst and (b) Morlet wavelet of CWT.
Reflection from the near end
Reflection from larger notch
Reflectio n from small notch
a. Simulation:Adefective pipe with undesired noise
c. Simulation: Using Tone-burst waveletb. Simulation: Using Morlet wavelet
Reflection from the far end
Reflection fr om larger notch
Reflection from the near end
Reflection from the far end
Reflection from the near end
Reflection from larger notch
Reflection from the far end
Reflection from small notch
Fig. 7. Simulation signals representing the pipe that has large and small cracks which show (a) the temporal CWT and the results by using (b) Morlet and (c) tone-burst as themother wavelet of CWT.
184 J. Chen et al. /Measurement 110 (2017) 176–191
or a small corroded area may not be clearly observable from thereceived signals.
4.1.2. The experimental setup of pipes partially covered by concreteAfter completing the laboratory experiments on the fully
exposed pipes, then partially covered both pipes with concrete.Fig. 15(a) shows the normal pipe, which has a length of 76 cmand an outer diameter of 23.6 mm, the portion of the pipe that iscovered by concrete and the dimensions of the covered area.Fig. 15(b) shows the corroded pipe with a length of 78 cm andsame outer diameter as the normal pipe. However, the concrete
covered section is different than that of the normal pipe asresearcher intentionally positioned the corroded area inside thewall-covered section.
4.1.3. The results for pipes that were partially covered by concrete andde-noising by the tone-burst wavelet
The temporal guided wave signal received by transducer A inpulse echo mode for the normal pipe is shown in Fig. 16. The sig-nals decomposed and reconstructed by the tone-burst waveletand their unwanted frequency components were filtered out.Thresholding was then applied to the wavelet coefficients to get
0 1 2 3 4
-0.5
0
0.5
1The wave reflected from one end of the pipe
Reflection from small notch
b. Laboratory experiment: Using Morlet wavelet c. Laboratory experiment: Using Tone-burst
Reflection from the near end
Reflection from the far end
The wave reflected from the near end
The wave reflected from the far end
a. Laboratory experiment: A defective pipe with undesired noise
Reflection from small notch
Fig. 8. Experimental signals representing the pipe that has a very small crack and which show (a) the temporal CWT and the results by using (b) Morlet and (c) tone burst asthe mother wavelet of CWT.
b. Simulation: Using Tone-burst waveleta. Simulation: Using Morlet wavelet
Reflection from the notch
Reflection from the far end
Reflection from the far end
Reflection from the the notch
Reflection from the near end
Reflection from the near end
Fig. 9. Results of simulated signals generated from a pipe that has a depth of crack equivalent to 11% of the pipe’s shell thickness wall by (a) using Morlet and (b) the tone-burst signal as the mother wavelet of CWT.
J. Chen et al. /Measurement 110 (2017) 176–191 185
rid of the noise. The concrete covered 18 cm of the 76 cm pipe. Theaim was to excite the L(0,2) mode, which is almost non-dispersivein a frequency region around 160 kHz. The group velocity of thismode within this frequency domain was identified by measuringthe direct time of flight on a normal pipe and validated by disper-sion curves to ensure the dominated excitation signal was L(0,2)mode. The locations of the signals entering and exiting the
concrete-covered-section were identified using the value of thegroup wave velocity. Fig. 16(a) illustrates the time plot of theraw reflected signals obtained from the normal pipe that was par-tially covered with concrete. Fig. 16(b) shows the correspondingfrequency spectrum of the temporal raw reflected signal. Fig. 16(c) and (d) show the filtered signal after applying the tone-burstwavelet to the raw signal. On the other hand, Fig. 16(e) and (f)
b. Simulation: Using Tone-burst wavelet a. Simulation: Using Morlet wavelet
Reflection from the near end
Reflection from oneend of the pipe
Reflection from the far end
Reflection from the the notch
Reflection from the near end
Fig. 10. Results of simulated signals generated from a pipe that has a depth of crack equivalent to 4% of the pipe’s shell thickness wall by (a) using Morlet and (b) the tone-burst signal as the mother wavelet of CWT.
b. Simulation: Using Tone-burst waveleta. Simulation: Using Morlet wavelet
Reflection from oneend of the pipe
Reflection from the far end
Reflection from the near end
Reflection from the near end
Fig. 11. Results of simulated signals generated from a pipe that has a depth of crack equivalent to 3% of the pipe’s shell thickness wall by (a) using Morlet and (b) the tone-burst signal as the mother wavelet of CWT.
Fig. 12. The tested (a) normal pipe and (b) corroded pipe.
186 J. Chen et al. /Measurement 110 (2017) 176–191
show the temporal waveform and frequency signals after applyingthe conventional Morlet to the original signals. The highlightedfirst and second wave packets in Fig. 16(c) are the guided wavesreflected when entering and leaving the concrete-covered section.By comparing the temporal wave forms in Fig. 16(a), (c) and (e),one can see that it is impossible to detect the concrete section
using only the temporal raw signal (Fig. 16(a)). However, withthe help of the tone-burst wavelet, the time of flight and the loca-tion of the start and end of the concrete-covered section can beclearly identified. Its merits, in comparison with the conventionalMorlet wavelet in Fig. 16(e), the vital information all can be clearlydetected with larger signal magnitude, simultaneously, giving

Thickness 0.5mm
Length 20 mm
Width: 5mm
Positive electrode
Negative electrode
1mm1mm
Fig. 13. The layout and dimension of the PZT.
J. Chen et al. /Measurement 110 (2017) 176–191 187
defect and concrete section signals with high signal-to-noise ratio(SNR). Moreover, one can observe the signal reflected by the end ofthe pipe, which is the third labelled wave packet as shown inFig. 16(c). Fig. 16(d) is the corresponding frequency spectrum ofthe filtered temporal signal in Fig. 16(c).
In contrast to Fig. 16, which shows the reflected signals gener-ated by the normal pipe in the time and frequency domains, Fig. 17(a) and (b) depict the reflected signals acquired from a similar typeof pipe with real corrosion within the concrete-covered section. Ascan be seen in Fig. 17(a), the temporal raw signals have multipleoverlapped wave packets, which were generated by numerousreflections from the concrete, the corroded area, the end of thepipe, and the noise and other undesired modes. After applyingthe tone-burst wavelet to filter the raw signals, as shown inFig. 17(c), hence it able to identify the reflected signals generatedby the start and the end of the concrete-covered section, the cor-roded area and the end of the pipe. Fig. 17(d) is the correspondingfrequency spectrum of the filtered temporal signal shown in Fig. 17(c). As can be seen in the raw signal, there were multiple over-lapped wave packages, which represent the numerous refractionsfrom the irregular real corrosion inside the pipe. Fig. 17(e) and (f)show the temporal waveform and frequency signals after applyingthe conventional Morlet to the original signals to compare theeffects of two different wavelets methods. By comparing the recon-structed signal with tone-burst wavelet, one can observed that thecorroded and concrete areas were very difficult to be detected.After the application of the tone-burst wavelet, the defect signalinside the concrete was exposed.
0 1 2 3 4x 10⁻⁴
-1
-0.5
0
0.5
1
Time(sec)
Amplitude(V)
The wave reflected from one end of the pipe
Normal pipe without concrete
76 cm
Transducer A
(a)
Fig. 14. The measured temporal signals reflected from
5. On-site test verification using in-service pipes
5.1. Experimental setup for the field tests
To further verify the effectiveness of the guided wave techniquewhen applied to civilian infrastructure, field tests were conductedat an occupied apartment located in a residential complex in HongKong. The experimental setup and theoretical practice were mostlybased on the methods discussed in the previous sections. Fig. 18(a)shows a portion of pipe inside the kitchen (indoor portion). Somerust is evident on the portion of the pipe surface located just priorto the entry to the concrete wall. A set of transducers, which wereused to emit the necessary guided waves into the pipe, weremounted on the pipe portion after the elbow at the kitchen side(the indoor portion of the pipe). The transducers, which were oper-ated in a pulse-echo mode, were used to emit the desired guidedwave mode and receive the reflected guided wave signals. First,the field test was conducted on a corroded pipe. The tested pipehad varying degrees of rust, as shown in Fig. 18(b). The rust wasscattered along the portion of the pipe located just prior to theentry to the concrete wall and then extended all the way to theportion of pipe that was covered by the concrete wall. Fig. 19shows a schematic diagram of the rust found, starting at the por-tion of the pipe before entering the concrete wall and then extend-ing all the way to the point where the pipe is covered by theconcrete wall. After completing the data collection process, thein-service corroded pipe was replaced with a new and normal pipe.
5.2. Field test data analysis and results
This section first focused on the analysis of the received signalscollected from the newly installed normal pipe. Because the pipewas partially covered by concrete, it was necessary to investigatethe influence of the concrete wall on the reflected signals. Similarto the laboratory tests, the field test was initially conducted withtwo transducers operating at pitch-catch mode to calculate thewave velocity. The group velocity of the guided wave was calcu-lated as 5055 m/s. After obtaining the actual group velocity ofthe wave, the pulse-echo mode was used with only transducer A.It must be noted that in practice, installing another transducer out-doors would have been labour intensive and difficult, and that itwas much more practical to use the pulse-echo mode and installthe transducer array indoors.
The dimensions and length of the different guided wave signalstraveling along the tested rust pipe are shown in Fig. 19. Thedimension of each targeted location was measured after the rustedpipe was removed from the wall. Noting the group velocity of
0 1 2 3 4x 10⁻⁴
-1
-0.5
0
0.5
1
Amplitude(V)
The wave reflectedfrom corrosion
The wave reflected from end
Corroded pipe without concrete
78 cm
Transducer A CorrodedArea
(b)
Time(sec)
(a) the normal pipe and (b) the corroded pipe.

18 cm 19 cm
Transducer A
39 cm
Concrete
(a)
48 cm
Concrete
20 cm 10 cm
Transducer A
(b)
Fig. 15. The concrete-covered section and the locations of the concrete wall and defects of the (a) normal pipe and (b) corroded pipe.
Fig. 16. Signals obtained from a normal pipe that was partially covered by aconcrete wall in the laboratory test: (a) original temporal waveform and (b) its FFTspectrum; reconstructed signals by the tone-burst wavelet in its (c) temporalwaveform and (d) FFT spectrum; reconstructed signal by the Morlet wavelet in its(e) temporal waveform and (f) FFT spectrum.
Fig. 17. Signals obtained from a corroded pipe that was partially covered by aconcrete wall in the laboratory test: (a) original temporal waveform and (b) its FFTspectrum; reconstructed signals by the tone-burst wavelet in its (c) temporalwaveform and (d) FFT spectrum; reconstructed signal by the Morlet wavelet in its(e) temporal waveform and (f) FFT spectrum.
188 J. Chen et al. /Measurement 110 (2017) 176–191
5055 m/s, the locations of the corroded areas and the concrete-covered section of the pipe were able to determined.
During the field tests, the acquired reflected signals were inevi-tably contaminated by noise and disturbance. Hence, it was neces-sary to apply the tone-burst wavelet to filter out thesedisturbances. Fig. 20(a) and (b) show the temporal raw signals col-
lected from a normal pipe during the field tests and the corre-sponding frequency spectrum, respectively. Fig. 20(e) and (f)show the temporal waveform and frequency signals after applyingthe conventional Morlet to the original signals for comparison withtone-burst wavelet method. As shown in Fig. 20(c), applying the

Fig. 18. The in-service pipe used for the field test: (a) the indoor portion of the pipe with rust starting at the entry of the concrete wall and (b) the corroded pipe with rustafter being dissembled from the concrete wall.
Path A (18 cm)
Path B (23 cm)
Path C (52 cm)
Path D (64 cm)
Transducer
11 cm
32 cm
13.5 cm
16.5 cm 5 cm
2 cm
WallRust Rust
Fig. 19. Schematic illustration of the corroded pipe covered by the concrete wall and the lengths of the various guided waves traveling along the corroded pipe.
Fig. 20. Reflected signals obtained from a normal pipe that was partially covered byconcrete in the field test: (a) original temporal waveform and (b) FFT spectrum;reconstructed signals by the tone-burst wavelet in its (c) temporal waveform (d)FFT spectrum; reconstructed signal by the Morlet wavelet in its (e) temporalwaveform and (f) FFT spectrum.
J. Chen et al. /Measurement 110 (2017) 176–191 189
tone-burst wavelet to the raw temporal signal to filter the noiseand disturbance, the reflected signals generated by the beginningof the concrete-covered section and the end elbow can be clearlyseen. Fig. 20(d) shows the corresponding frequency plot with asmooth profile after filtering the signals by the tone-burst wavelet.Note that the signal reflected by the end of the concrete wall is notthat clear in Fig. 20(c). In this case, the wave energy that leakedinto the concrete wall during the field tests was propagated a verylong distance and eventually dissipated all of its energy in the wallwithout reflecting the wave. In contrast, during the laboratory test,the concrete wall had a defined and physical boundary. Thus, thewave energy coming from the guided wave signals that leaked intothe concrete were reflected backward and received by the trans-ducers. During the field tests, the concrete wall was treated as ifit had infinite length and was without any physical boundary.Thus, part of the wave energy leaked into the wall was continu-ously propagating and the wave energy that was reflected by thewall was too weak to be detected by the transducers. Nonetheless,parts of the signals that penetrated the wall-covered section of thepipe were reflected back by the end elbow of the pipe. Hence, thewave packet reflected by the elbow can be seen in Fig. 20(c). Basedon the calculated wave velocity, the locations of the start of theconcrete wall and the end elbow can be accurately determined.
The rusted pipe used in the field test had two corroded areas.The first corroded area was located before the entry of the concretewall and then extended inside the concrete wall section. The sec-ond smaller corroded area was located near the portion of the pipethat exited the concrete wall. The temporal and raw signals andtheir corresponding frequency spectrum collected from the rustedpipe are shown in Fig. 21(a) and (b), respectively.

Fig. 21. Reflected signals obtained from a corroded pipe that was partially coveredby concrete in the field test: (a) original temporal waveform and (b) FFT spectrum;reconstructed signals by the tone-burst wavelet in its (c) temporal waveform (d)FFT spectrum; reconstructed signal by the Morlet wavelet in its (e) temporalwaveform and (f) FFT spectrum.
190 J. Chen et al. /Measurement 110 (2017) 176–191
Fig. 21(c) and (d) show that the temporal plot and frequencyspectrum of the tone-burst wavelet filtered signals, respectively.The first signal package reflected from the first corrosion and theconcrete wall section, hence, a big reflection can be observed asshown in Fig. 21(c). At the location where the pipe exits the con-crete wall, there was another obvious reflection generated by thesecond smaller corroded area, as shown in the second wave packetin Fig. 21(c). The last reflected wave packet was caused by theelbow of the corroded in-serviced pipe. For the rusted pipe, thelocation of the first corrosion can be calculated as
s ¼ v � Dt2
¼ 0:5055cm=ls� ð41:8ls� 0Þ2
¼ 10:5cm
Similarly, by using the above formula, the location of the secondcorroded area and the end elbow of the pipe can be calculated as ataround 27.2 cm and 32.1 cm away from the transducer, respec-tively. These locations closely match half of path C (26 cm) andpath D (32 cm), as shown in Fig. 19. Last but not least, through ana-lysing the result obtained by the Morlet wavelet method in Fig. 21(e) and (f), one can see the defects signals were revealed with lessamplitudes while comparing with tone-burst wavelet method inFig. 21(c), and the elbow of pipe was contaminated by undesirednoise. These results proved that the guided wave in conjunctionwith the tone-burst wavelet inspection technique could success-fully differentiate a corroded pipe from a normal pipe, even whenthey were both partially covered by concrete walls. Moreover, thelocation of each corroded area could be determined from the tem-poral waveform of the reflected guided wave signals with reason-able accuracy after filtering the raw signals by CWT, which usedthe excitation tone-burst as its mother wavelet.
6. Conclusions
In this paper, authors examined the applicability of using theguided wave technique to detect corrosion in wall covered pipes
and presented the results of experiments. First, the FE-based sim-ulations were conducted to illustrate guided wave propagation inpipes with and without concrete coverage. In terms of the signalscollected from the simulated defective pipe and the reflectionsfrom the different defect locations, they were experimentally pro-ven that even if the defects were located in the concrete coveredsection, they could be detected using the guided wave techniquein conjunction with tone-burst wavelet signal processing. Second,the laboratory tests demonstrated that guided waves could pene-trate the entire pipe even when it was partially covered by con-crete. Moreover, the comparison study of the simulated pipesand the real pipes tested in the laboratory proved that the concretewall did attenuate the guided wave energy. The pitch-catch modewas first used to calculate the actual group velocity of the propa-gating wave. The pulse-echo mode was then used to detect thelocations of the defects because of the practical limitations ofinstalling transducers onsite. Third, based on the promising resultsobtained from the simulation and laboratory experiments, fieldtests were conducted on in-service pipes that deliver natural gasto the household units of residential buildings. Pipes with no cor-rosion and pipes with rust in the concrete wall-covered zone weretested. They were demonstrated that the application of thedesigned tone-burst wavelet method on the experimental datagreatly improved SNR and facilitated the interpretation of the sig-nals. Different mother wavelets were investigated for the signalsand the tone-burst wavelet was found to provide the best resultsin locating defects and corrosion. Analysis of the field test resultsshown that the location of the corroded areas of the pipes couldbe accurately detected using the calculated group velocity of theguided wave. By comparing the temporal waveforms of the normalpipe with those of the corroded pipe, the reflections generated bythe corrosion were easily observed and detected.
Acknowledgments
The work described in this paper was fully supported by a grantfrom the Research Grants Council (Project No. CityU 11201315)and a grant from the Innovation and Technology Commission(ITC) (Project No. ITS/061/14FP) of the Government of the HongKong Special Administrative Region (HKSAR), China. Any opinions,findings, conclusions or recommendations expressed in this mate-rial/event (or by members of the project team) do not reflect theviews of the Government of the HKSAR, the ITC or the Panel ofAssessors for the Innovation and Technology Support Programmeof the Innovation and Technology Fund.
References
[1] A. Lopes Ribeiro, H. Geirinhas Ramos, O. Postolache, A simple forward directproblem solver for eddy current non-destructive inspection of aluminumplates using uniform field probes, Measurement 45 (2) (2012) 213–217, http://dx.doi.org/10.1016/j.measurement.2011.03.029.
[2] R. Grimberg, A. Savin, E. Radu, S. Chifan, Eddy current sensor for non-destructive evaluation of metallic wires, bars and pipes, Sens. Actuators A:Phys. 81 (1) (2000) 224–226.
[3] M.H. Park, I.S. Kim, Y.K. Yoon, Ultrasonic inspection of long steel pipes usingLamb waves, NDT & E Int. 29 (1) (1996) 13–20.
[4] Y.B. Chong, A. Bennecer, F. Hagglund, S. Siddiqi, V. Kappatos, C. Selcuk, T.-H.Gan, A new synthetic training environment system based on an ICT-approachfor manual ultrasonic testing, Measurement 71 (2015) 11–22, http://dx.doi.org/10.1016/j.measurement.2015.04.013.
[5] E. Altschuler, A. Pignotti, Nonlinear model of flaw detection in steel pipes bymagnetic flux leakage, NDT & E Int. 28 (1) (1995) 35–40.
[6] M.J. Lowe, D.N. Alleyne, P. Cawley, Defect detection in pipes using guidedwaves, Ultrasonics 36 (1) (1998) 147–154.
[7] J.J. Ditri, Utilization of guided elastic waves for the characterization ofcircumferential cracks in hollow cylinders, J. Acoust. Soc. Am. 96 (6) (1994)3769–3775.
[8] J.L. Rose, Y. Cho, M.J. Avioli, Next generation guided wave health monitoring forlong range inspection of pipes, J. Loss Prevent. Process Ind. 22 (6) (2009) 1010–1015.

J. Chen et al. /Measurement 110 (2017) 176–191 191
[9] A. Demma, P. Cawley, M. Lowe, A. Roosenbrand, The reflection of thefundamental torsional mode from cracks and notches in pipes, J. Acoust. Soc.Am. 114 (2) (2003) 611–625.
[10] F. Benmeddour, F. Treyssède, L. Laguerre, Numerical modeling of guided waveinteraction with non-axisymmetric cracks in elastic cylinders, Int. J. SolidsStruct. 48 (5) (2011) 764–774.
[11] V.Y. Senyurek, Detection of cuts and impact damage at the aircraft wing slat byusing Lamb wave method, Measurement 67 (2015) 10–23, http://dx.doi.org/10.1016/j.measurement.2015.02.007.
[12] R. Carandente, P. Cawley, The effect of complex defect profiles on the reflectionof the fundamental torsional mode in pipes, NDT & E Int. 46 (2012) 41–47.
[13] X. Wang, P.W. Tse, C.K. Mechefske, M. Hua, Experimental investigation ofreflection in guided wave-based inspection for the characterization of pipelinedefects, NDT & E Int. 43 (4) (2010) 365–374.
[14] H. Nishino, K. Ogura, T. Komatsu, K. Yoshida, Defect detection of a pipe using aguided wave generated by an efficient transduction with a reflector, Japan. J.Appl. Phys. 48 (9R) (2009) 094501.
[15] Y.-M. Cheong, D.-H. Lee, H.-K. Jung, Ultrasonic guided wave parameters fordetection of axial cracks in feeder pipes of PHWR nuclear power plants,Ultrasonics 42 (1) (2004) 883–888.
[16] Y. Jiangong, W. Bin, H. Cunfu, Guided circumferential waves in orthotropiccylindrical curved plate and the mode conversion by the end-reflection, Appl.Acoust. 68 (5) (2007) 594–602, http://dx.doi.org/10.1016/j.apacoust.2006.03.007.
[17] B. Verma, T.K. Mishra, K. Balasubramaniam, P. Rajagopal, Interaction of low-frequency axisymmetric ultrasonic guided waves with bends in pipes ofarbitrary bend angle and general bend radius, Ultrasonics 54 (3) (2014) 801–808.
[18] M. Beard, M. Lowe, Non-destructive testing of rock bolts using guidedultrasonic waves, Int. J. Rock Mech. Mining Sci. 40 (4) (2003) 527–536.
[19] E. Leinov, M.J. Lowe, P. Cawley, Investigation of guided wave propagation andattenuation in pipe buried in sand, J. Sound Vib. 347 (2015) 96–114.
[20] J.N. Barshinger, J.L. Rose, Guided wave propagation in an elastic hollowcylinder coated with a viscoelastic material, IEEE Trans. Ultrason., Ferroelectr.,Freq. Control 51 (11) (2004) 1547–1556.
[21] W. Luo, J.L. Rose, Phased array focusing with guided waves in a viscoelasticcoated hollow cylinder, J. Acoust. Soc. Am. 121 (4) (2007) 1945–1955.
[22] J. Mu, J.L. Rose, Guided wave propagation and mode differentiation in hollowcylinders with viscoelastic coatings, J. Acoust. Soc. Am. 124 (2) (2008) 866–874.
[23] H. Kwun, S. Kim, M. Choi, S. Walker, Torsional guided-wave attenuation incoal-tar-enamel-coated, buried piping, NDT & E Int. 37 (8) (2004) 663–665.
[24] R. Kirby, Z. Zlatev, P. Mudge, On the scattering of longitudinal elastic wavesfrom axisymmetric defects in coated pipes, J. Sound Vib. 332 (20) (2013)5040–5058.
[25] M.E. El-Alej, M. Corsar, D. Mba, Monitoring the presence of water and water–sand droplets in a horizontal pipe with acoustic emission technology, Appl.Acoust. 82 (2014) 38–44, http://dx.doi.org/10.1016/j.apacoust.2014.02.012.
[26] A. Mostafapour, S. Davoudi, Analysis of leakage in high pressure pipe usingacoustic emission method, Appl. Acoust. 74 (3) (2013) 335–342, http://dx.doi.org/10.1016/j.apacoust.2012.07.012.
[27] W. Zhou, F.-G. Yuan, T. Shi, Guided torsional wave generation of a linear in-plane shear piezoelectric array in metallic pipes, Ultrasonics 65 (2016) 69–77,http://dx.doi.org/10.1016/j.ultras.2015.10.021.
[28] S. Ma, Z. Wu, Y. Wang, K. Liu, The reflection of guided waves from simple dentsin pipes, Ultrasonics 57 (2015) 190–197, http://dx.doi.org/10.1016/j.ultras.2014.11.012.
[29] L. Ambrozinski, T. Stepinski, P. Packo, T. Uhl, Self-focusing Lamb waves basedon the decomposition of the time-reversal operator using time–frequencyrepresentation, Mech. Syst. Signal Proces. 27 (2012) 337–349.
[30] P.W. Tse, J. Chen, X. Wan, D.E. Chimenti, L.J. Bond, Guided-waves technique forinspecting the health of wall-covered building risers. in: AIP ConferenceProceedings, 2015. vol. 1. AIP, pp 676-685.
[31] M. Niethammer, L.J. Jacobs, J. Qu, J. Jarzynski, Time-frequency representationsof Lamb waves, J. Acoust. Soc. Am. 109 (5) (2001) 1841–1847.
[32] N.E. Huang, Z. Shen, S.R. Long, M.C. Wu, H.H. Shih, Q. Zheng, N.-C. Yen, C.C.Tung, H.H. Liu, The empirical mode decomposition and the Hilbert spectrumfor nonlinear and non-stationary time series analysis, Proc. Royal Soc. LondonSer. A: Math., Phys. Eng. Sci. 454 (1971) (1998) 903–995, http://dx.doi.org/10.1098/rspa.1998.0193.
[33] P.W. Tse, X. Wang, Characterization of pipeline defect in guided-waves basedinspection through matching pursuit with the optimized dictionary, NDT & EInt. 54 (2013) 171–182, http://dx.doi.org/10.1016/j.ndteint.2012.10.003.
[34] R. Ajay, E.S.C. Carlos, Guided-wave signal processing using chirplet matchingpursuits and mode correlation for structural health monitoring, Smart Mater.Struct. 16 (2) (2007) 355.
[35] C.-Y. Kim, K.-J. Park, Mode separation and characterization of torsional guidedwave signals reflected from defects using chirplet transform, NDT & E Int. 74(2015) 15–23, http://dx.doi.org/10.1016/j.ndteint.2015.04.006.
[36] J.E. Michaels, S.J. Lee, J.S. Hall, T.E. Michaels, TE Multi-mode and multi-frequency guided wave imaging via chirp excitations. In, 2011. pp 79840I-79840I-79811.
[37] H. Chen, M.J. Zuo, X. Wang, M.R. Hoseini, An adaptive Morlet wavelet filter fortime-of-flight estimation in ultrasonic damage assessment, Measurement 43(4) (2010) 570–585, http://dx.doi.org/10.1016/j.measurement.2010.01.001.
[38] H. Sohn, G. Park, J.R. Wait, N.P. Limback, C.R. Farrar, Wavelet-based activesensing for delamination detection in composite structures, Smart Mater.Struct. 13 (1) (2003) 153.
[39] L. Angrisani, L. Bechou, D. Dallet, P. Daponte, Y. Ousten, Detection and locationof defects in electronic devices by means of scanning ultrasonic microscopyand the wavelet transform, Measurement 31 (2) (2002) 77–91, http://dx.doi.org/10.1016/S0263-2241(01)00032-X.
[40] M. Demetgul, V.Y. Senyurek, R. Uyandik, I.N. Tansel, O. Yazicioglu, Evaluationof the health of riveted joints with active and passive structural healthmonitoring techniques, Measurement 69 (2015) 42–51, http://dx.doi.org/10.1016/j.measurement.2015.03.032.
[41] P. Avanesians, M. Momayez, Wave separation: application for arrival timedetection in ultrasonic signals, Ultrasonics 55 (2015) 15–25.
[42] Y. Liu, Z. Li, K. Gong, Detection of a radial crack in annular structures usingguided circumferential waves and continuous wavelet transform, Mech. Syst.Signal Proces. 30 (2012) 157–167.
[43] R.W. Pryor, Multiphysics Modeling using COMSOL: a First Principles Approach.Jones & Bartlett Publishers, 2009.
[44] M.H.S. Siqueira, C.E.N. Gatts, R.R. da Silva, J.M.A. Rebello, The use of ultrasonicguided waves and wavelets analysis in pipe inspection, Ultrasonics 41 (10)(2004) 785–797, http://dx.doi.org/10.1016/j.ultras.2004.02.013.
[45] X. Wang, W.T. Peter, A. Dordjevich, Evaluation of pipeline defect’scharacteristic axial length via model-based parameter estimation inultrasonic guided wave-based inspection, Measur. Sci. Technol. 22 (2) (2011)025701.
[46] X. Wang, Quantitative characterization of defect in ultrasonic guided waves-based pipeline inspection, 2011.
[47] B. Pavlakovic, M. Lowe, Disperse Software Manual Version 2.0. 1 6B. ImperialCollege, London, UK, 2003.
[48] W. Ostachowicz, P. Kudela, M. Krawczuk, A. Zak, Guided Waves in Structuresfor SHM: the Time-Domain Spectral Element Method, John Wiley & Sons,2011.
[49] J. Rose, S. Pelts, M. Quarry, A comb transducer model for guided wave NDE,Ultrasonics 36 (1–5) (1998) 163–169.
[50] Y. Cho, Estimation of ultrasonic guided wave mode conversion in a plate withthickness variation, IEEE Trans. Ultrason., Ferroelectr., Freq. Control 47 (3)(2000) 591–603.
[51] F. Moser, L.J. Jacobs, J. Qu, Modeling elastic wave propagation in waveguideswith the finite element method, Ndt & E Int. 32 (4) (1999) 225–234.
[52] X. Wan, Q. Zhang, G. Xu, P.W. Tse, Numerical simulation of nonlinear Lambwaves used in a thin plate for detecting buried micro-cracks, Sensors 14 (5)(2014) 8528–8546, http://dx.doi.org/10.3390/s140508528.
[53] J. Li, J.L. Rose, Implementing guided wave mode control by use of a phasedtransducer array, IEEE Trans. Ultrason., Ferroelectr., Freq. Control 48 (3) (2001)761–768.
[54] J. Hou, K.R. Leonard, M.K. Hinders, Automatic multi-mode Lamb wave arrivaltime extraction for improved tomographic reconstruction, Inverse Probl. 20 (6)(2004) 1873.
[55] P.D. Wilcox, A rapid signal processing technique to remove the effect ofdispersion from guided wave signals, IEEE Trans. Ultrason., Ferroelectr., Freq.Control 50 (4) (2003) 419–427.
[56] M. Lowe, D. Alleyne, P. Cawley, Mode conversion of guided waves by defects inpipes. in: Review of Progress in Quantitative Nondestructive Evaluation.Springer, 1997, pp 1261-1268
[57] J. Chen, Z. Li, J. Pan, G. Chen, Y. Zi, J. Yuan, B. Chen, Z. He, Wavelet transformbased on inner product in fault diagnosis of rotating machinery: a review,Mech. Syst. Signal Proces. 70–71 (2016) 1–35, http://dx.doi.org/10.1016/j.ymssp.2015.08.023.
[58] A. Klepka, An application of wavlet transform for nonlinearities detection.Diagnostyka, 2008, pp 107–112.
[59] Z. Su, L. Ye, Y. Lu, Guided Lamb waves for identification of damage incomposite structures: a review, J. Sound Vib. 295 (3) (2006) 753–780.
[60] Bao Ding Hong Sheng Acoustics Electron Apparatus Co., Ltd. http://www.bdhongsheng.com/productAvalue.asp?cid=56&lmid=39&fid=94.
[61] B. Jaffe, Piezoelectric Ceramics, vol. 3, Elsevier, 2012.