the dental industry 2018 staffing, brexit and the dentist ... · dentists during 2017, of which c....
TRANSCRIPT

THE DENTAL INDUSTRY2018 Staffing, Brexit and
The Dentist Shortage

2 | 2018 christie.com 2 | 2018 christie.com
The UK dental market is a unique and dynamic sector which has seen significant growth and investor activity over recent years. The sector’s appeal is driven by a combination of long-term NHS contracts and a lucrative private pay market. Income streams are underpinned by the National Health Service and a nation caring more than ever about its dental health. Predictable, robust cash flow generation, strong profit potential and a highly fragmented market explain why the sector is so attractive to a wide range of UK and overseas investors.
Christie & Co has been at the forefront of this growth, working alongside a wide range of operators, banks and investors on a vast array of projects, ranging from single asset and portfolio sales mandates through to major due diligence assignments. This has given us a unique insight into the dental sector which is renowned for its lack of credible market information.
Over the last four years, Christie & Co has produced market leading research on workforce challenges impacting the adult social care sector. We are now delighted to publish our first report on workforce challenges in the dental sector with the objective of bridging the information gap in relation to one of the most widely acknowledged issues; the shortage of dental associates. Broadly, this report will explore key workforce trends, the nuances of the dentist shortage and related topics including the impact of Brexit.
We very much hope that you find this report to be of interest and acknowledge with thanks the support we have received from the dental sector in compiling the research.
Michael HodgesHead of Consultancy, Healthcare
We are proud to launch our first dental sector market insight report
Broadly, this report will explore key
workforce trends, the nuances of the
dentist shortage and related topics
including the impact of Brexit

Key Workforce Trends

4 | 2018 christie.com
The UK Dental Industry
dental practices in the UK
Source: General Dental Council Reports, Christie & Co Research and Analysis
Market Structure
kof UK dental practices (c. 1.5k) are owned by
large corporate operators, with MyDentist and Bupa being the largest, collectively
owning just over 1.1k practices
practices are owned by small groups
kmultiple practice
owners feeding industry consolidation
The Workforce
Registered dental professionals in the UKk Dentistsk

2018 christie.com | 5
The UK Dental Workforce
GDC Registrants by Dental Grouping 2017
Age Profile of UK Dentists
Source: General Dental Council, Annual Report 2017
3,684Therapists
6,447Technicians
7,123Hygienists
41,705Dentists
57,214Dental Nurses
20%
30%
24%
19%
4% 3%
22-30 31-40 41-50 51-60 61-65 Over 65
The majority of the 116.2k registered dental professionals in the UK are dental nurses (49%) with the next largest group being dentists (36%)
This represents 1 dentist per 1,600 of the UK population as at 2016
92% of non-dentist dental care professionals (DCPs) are female, 8% male
The majority of dentists are aged 31-40 years with only 7% aged 61 years and over
51% of dentists are male
49% are female

6 | 2018 christie.com
Growth in Registered Dentists
Growth in UK dentists registered with the GDC has exceeded population growth since 2010, whilst this is a positive trend for the sector, legacy dental shortages may require a greater increase in new registrations
Note: the number of registered dentists is not provided on a ‘full-time equivalent’ basis, however growth in total registrations is assumed to be highly correlated with total hours worked and therefore this metric is considered to be a relevant indicator. These figures could be influenced by trends towards dentists working flexible or part-time hours with increases in total dentists not necessarily contributing towards proportional increases in the total hours worked by dentists on a UK-level basis.
UK POPULATION GROWTH (2010-17):
7 Year CAGR*: 0.73%
NUMBER OF UK DENTISTS (2010-17):
7 Year CAGR*: 1.2%*Compound annual growth rate
Number of UK Dentists (2010-17)
Source: General Dental Council, Annual Reports 2010-2017; ONS; July 2017
2010
2011
2012
2013
2014
2015
2016
2017
38,379
39,307
39,894
40,423
41,038
41,095
41,483
41,705

UK Dental Workforce 2017: Country Level Benchmarks
The adjacent figures reflect the number of dentists compared to the population in different parts of the UK.
Within the UK, the supply of dentists is most under pressure in Wales where there is 1 dentist per 1.9k people. England is the next most pressured area from a supply perspective with 1 dentist per 1.7k of the population. Scotland and Northern Ireland have a higher level of dentists, with one dentist per 1.4k and 1.2k of the country’s population, respectively.
In terms of DCPs, England and Wales report similar supply levels on a population basis with 1 DCP per c. 1k of the population. Scotland and Northern Ireland report higher supply levels on a population density basis with 1 DCP per every 800 people.
Quantity of Dentists Quantity of Dental Care Professionals (DCPs)
England 32.4k Dentists1 dentist per 1.7k people
54.6k DCPs1 DCP per c. 1k people
Scotland 4.0k Dentists 1 dentist per 1.4k people
7.0k DCPs1 DCP per c. 800 people
Wales 1.7k Dentists1 dentist per 1.9k people
3.2k DCPs1 DCP per c. 1k people
Northern Ireland 1.6k Dentists1 dentist per 1.2k people
2.2k DCP 1 DCP per c. 800 people
Source: General Dental Council 2016, FOI Request; Census Data; Population UK; Christie & Co Research & Analysis
2018 christie.com | 7

8 | 2018 christie.com
Dentist Workforce Trends & Brexit Impact

2018 christie.com | 9
Dentist Workforce Trends & Brexit Impact
Where Do Dentists Qualify?
The pie chart shows the region of qualification for the full GDC register of dentists (41.7k) as at the end of 2017.
The majority of dentists (72.2%) who are currently registered to work in the UK also qualified in the UK. The next largest group is dentists who qualified in the EEA (16.3%). The remaining dentists qualified overseas, outside of the EEA.
In terms of trends over time (see page 10), the number of UK qualified dentists has grown year on year since 2014. For the same period, the number of EEA registered dentists fell for three consecutive years from 2014 to 2016 stabilising in 2017 with the total number of EEA dentists remaining flat at around 6.8k.
There have also been ongoing reductions in the total number of dentists who qualified overseas albeit this group represents a smaller proportion of dentists. In contrast, the number of registered dentists who qualified by the UK overseas exam has increased year on year since 2014.
UK Dentists Region of Qualification (%)
Source: General Dental Council, Annual Report 2017
UK Qualified
EEA Qualified
Overseas Qualified
UK Overseas Exam
72.2
16.3
7.83.7

GDC Register 2017: Region of Qualification Trends
Note: Figures are stated as at 31 December 2017 and include new dentist registrations during the year
UK Dentists Region of Qualification (2014-2017)
10 | 2018 christie.com
++4.4%
++0.4%
++0.9%
YoY Change 2016 vs. 2017
UK Overseas Exam
--12.4%
Overseas Qualified
EEA Qualified
UK Qualified
1,846 1,778 1,771 1,551
Overseas Qualified
2,820 2,957 3,120 3,257
UK Overseas Exam
6,946 6,819 6,756 6,785
EEA Qualified
29,426 29,541 29,836 30,112
UK Qualified
2014 2015 2016 2017

2018 christie.com | 11
2017 GDC New Registrations
There were c. 1.8k dentists and c. 5.5k DCP’s added to the GDC register during 2017 although the GDC only reported a net increase in registrations of 222 dentists and c. 2k DCPs.
These figures imply that a number of professionals also left the register which to some extent will be related to dentists retiring or taking career breaks, but will also be due to factors such as Brexit and dentists choosing to leave the UK. Unfortunately, the GDC annual report does not provide information on the ‘outflow’ of dentists, therefore, we are not able to provide further comment.
Of the 1,751 newly registered dentists during 2017, the majority qualified in the UK (see page 12). The next largest area for qualification is within the EEA. In 2017, 409 newly registered dentists (23%) qualified in the EEA which represents a 19% drop off in new registrations compared to 2016 and a 39% reduction in growth over 2 years.
The overall impact of Brexit will be important for the dental sector where staffing is already a widespread challenge, this will be on the radar particularly for the larger corporate operators who employ a higher percentage of non-UK trained dentists.
Total GDC Registered Dentists
Source: General Dental Council, Annual Report 2016-17
41,483 41,705 + 222 Dentists(Net Increase)
2016 2017
Additions to GDC Register during 2017
317Therapists
202Technicians
370Hygienists Dentists Dental Nurses
1,751 4,686
Overseas Qualified

12 | 2018 christie.com
Source: General Dental Council, Annual Reports 2013-2017
New Dentist Registrations 2017
While the total number of dentists continues to grow on a net basis, there has been reduced growth in dentist registrations over the past two years in actual terms, most notably from dentists who qualified in the UK and EEA.
Region of Qualification
79 45 73 27
Overseas Qualified
73 227 164 215 170
UK Overseas Exam
194
646 669 507 409
EEA Qualified
666 1,311 1,693 1,460 1,245
UK Qualified
1,279
2013 2014 2015 2016 2017

Dentist Trends: Brexit Impact Summarised
The latest GDC data is relatively positive and suggests an increase of 1.8k dentists during 2017, of which c. 23% (409 dentists) were from the EEA. These figures are not immaterial for the sector, however, the net increase in dentists was materially lower, showing an increase of only 222 dentists, of which 29 qualified within the EEA. Historically, the EEA has been a key source of supply for the UK dental sector. However, over recent years, these figures appear to be falling and Brexit is likely to be a contributing factor to 380 EEA dentists leaving the register in 2017.
Whilst the above 2017 snapshot appears relatively bleak, these figures should be considered in the context of prior trends. The number of EEA qualified dentists working in the UK (page 10) was actually falling prior to the announcement of Brexit (see 2014 vs. 2015). This trend has remained broadly flat since the announcement of Brexit, despite the reduction in new registrations from the EEA over the comparable period (page 12). Notably, these figures suggest that the outflow of EEA dentists working in the UK already has slowed i.e. there are less EEA dentists leaving the register since the Brexit announcement than in the two years prior. This explains why the slowing of growth in new registrations over the past two years has not materially impacted the total number of EEA registered dentists in the UK since the Brexit announcement.
Whilst Brexit has appeared to make the UK less attractive to new EEA qualified dentists, and this could become increasingly problematic should negative growth trends continue, the overall
supply of dentists from the EEA did not fall in actual terms during 2017, with only a slight dip in 2016. As the Brexit process accelerates, it will be important to monitor new EEA dentist registrations and also EEA dentist outflows given they represent the second largest part of the UK dentist workforce.
2018 christie.com | 13

14 | 2018 christie.com
Dentistry Undergraduates
Other Workforce Trends Impacting the Supply of Dentists
For newly qualified dentists, the preference has been to become an associate, whereby individuals complete their dentist duties but do not own the business (known as principal dentists). This creates fluidity in the job market as dentists are able to move more freely between practices thus facilitating higher staff turnover.
There has been recent growth in the private sector and many dentists are choosing to treat private patients and/or provide private treatment in addition or as an alternative to NHS care for NHS patients. Therefore, the impact of any increase in the supply of dentists will be dependent on the willingness of dentists to undertake NHS treatments. Staffing is the key issue cited for why operators are not able to meet NHS targets. Any Government efforts to improve the supply of dentists require careful consideration to ensure dentists support the NHS.
In addition, there has been a trend towards dentists working fewer hours. This in part is due to the proportional increase in female dental graduates (see below graph) over the past 10 years. Furthermore, dentists tend to earn well above the UK average wage which allows some flexibility around working hours.
There are a number of options available to dentists after graduation. Typically, an associate will work in NHS dentistry for a period of time before moving into private practice or, often, both. There are numerous specialisms into which one can move with further training and qualification. Dentistry is one of the most demanding professions and there is an increasing recognition of the effects that its demands can have on the clinician in the longer term.
Number of Dentistry Undergraduates (UCAS Acceptances)
Source: UCAS, Christie and Co Research & Analysis
2007 2008 2009 2010 2011 2012 2013 2014 2015 2016 2017
42.5% 42.6% 41.2% 41.0% 42.7%39.3%
38.8%35.9% 37.4%
39.1%36.6%
57.5% 57.4% 58.8% 59.0% 57.3% 60.7% 61.2% 64.1% 62.6% 60.9% 63.4%
1,195 1,205 1,2151,275
1,195 1,195 1,1851,100 1,095 1,095 1,140
Men Women

2018 christie.com | 15
Source: General Dental Council, Annual Reports 2013-2017
Increasing Scope for Hygienists and Therapists
Given the improving dental health of the younger generations, a focus on prevention reflects the vision of the contract reform programme. This creates a pathway for the greater role of hygienists and therapists, which has been a practical solution considered by the profession for many years. However, there is possibly more that hygienists and therapists can contribute beyond the current status quo.
Research reports and a high profile review have previously highlighted the considerable potential for the delegation of work being undertaken by dentists to hygienists and therapists (Evans, Chestnutt & Chadwick, 2007; Steele, 2009) and suggested that the potential of a “team-based” training approach requires further attention.
Positively, the supply of hygienists and therapists registered with the GDC has risen year on year since 2013. The increasing role of hygienists and therapists represents a key part of the solution to the dental associate shortage as described further in the next section. This has practical implications because significant, ongoing demand increases for hygienists and therapists will only be met if there is a sufficient supply of practitioners. This creates a need for accessible and affordable training schemes to attract a sufficient number of new entrants. Furthermore, changes to public perceptions, as well as those who work in the sector are needed to ensure there is no stigma associated with these important roles.
References:Evans, Chestnutt & Chadwick (2007). British Dental Journal; 203 (12), 695-699
ReferencesSteele, J. (2009). NHS dental services in England. Independent ReviewEvans, C., Chestnutt, I.G., & Chadwick, B.L. (2007). The potential for delegation of clinical care in general dental practice. British Dental Journal, 203(11), 695-699
2013 2014 2015 2016 2017
Dental hygienists Dental therapists
6,3336,573 6,753
6,9317,123
2,230 2,4812,708 2,897
3,684

16 | 2018 christie.com
Dentist Shortages: Potential Solutions
The industry is calling for a greater supply of dentists, and based on the latest GDC data, significant increases in supply do not appear to be immediately forthcoming. Like any market where supply and demand do not find a natural equilibrium, particularly when public health is at stake, this requires interventions to inspire
labour market changes. Positively, there are various potential solutions to improve the availability of dentists in the UK, and whilst these all have their own complexities, they all have practical applications. Some examples are briefly noted below:
Increase training places for therapists and hygienists, developing common training pathwaysA common strategy highlighted by industry reports has been to improve the availability and quality of training for therapists and hygienists to reduce the ever increasing workload on dentists. It has been widely noted that a substantial amount of work undertaken by dentists could be undertaken by suitably trained therapists.
Delay the retirement of existing dentistsReducing the outflow of the largest group of dentists (UK qualified) could be an effective strategy to increase the supply of experienced dentists. Government incentives to delay retirement for those with an NHS commitment could be explored as an intervention.
Increase undergraduate training places in the UKThe UK remains the leader in terms of providing qualified dentists to work domestically. Ensuring that adequate foundation training places are available to UK undergraduate dental students should, therefore, be prioritised. Positively, the number of applicants to dental schools is consistently high.
Ensure dentists are appropriately recognised in any agreements made with the EU as part of BrexitAs already detailed, the EEA is the second most critical source of dentists and their skill sets need to be recognised accordingly as part of the Brexit agreements, both to ensure existing EEA dentists feel secure and also to attract new EEA dentists to the UK.
Reduce barriers for individuals outside of the EEA to working in the UK dental sector The only group which saw a net outflow of dentists in 2017 related to overseas dentists who qualified outside of the EEA. This group of individuals represents a smaller but important part of the workforce and there has been an overall reduction in the total number in the UK during 2017. It will be important to address the factors influencing this adverse trend.

2018 christie.com | 17
Regional Workforce Dynamics

18 | 2018 christie.com
This part of the report aims to consider regional differences in the supply of associates working in NHS and mixed practices across the country with reference to pay rate differentials.
The extent of work undertaken by individual practices on behalf of the NHS varies as do pay rates for dentists who carry out NHS dentistry. Pay rates are assessed on a “per UDA” (Unit of Dental Activity) basis with our pay rate analysis in this part of the report relating to associates (as opposed to principal dentists).
In this section, regional differences in associate shortage trends are primarily considered using pay scale data to facilitate an understanding of associate supply dynamics. Firstly, we explore how the number of dental practices varies across the regions after accounting for population density. Next, we consider regional differences in pay rates in order to understand high-level associate supply dynamics across the country. Finally, we consider how associate pay rates vary based on affluence and urbanicity factors.
We obtained financial data from over 500 dental practices and undertook a survey of operators across the country to support the associate pay
rate analysis. In addition, we utilised census, house price and CQC data to consider wider factors associated with pay scales and therefore the supply of associates across the UK.
Christie & Co has analysed pay
rate data from across England
& Wales
Christie & Co Analysis: Regional Associate Shortage

2018 christie.com | 19
Regional Variation in Dental Practices
London has the greatest supply of dental practices in England after accounting for population density.
The table shows how practices are distributed across England and Wales and also considers these figures in the context of population density for each region. Academic and public health reports across the western world tend to adopt “best standard” benchmarks, quantified on a “practice per number of the population” basis and we have therefore used this methodology for comparison to the wider literature.
London has the largest number of dental practices registered with the CQC compared to the other regions. On a population basis, London also has the greatest supply, thus shown by the lowest number of individuals per practice (c. 4.3k). The South and South East of England similarly benefit from a relatively high proportion of dental practices, translating on a population level, to be on average c. 4.7k-4.9k patients per practice.
The North and East of England have a lower supply of dental practices on average and also have a greater number of patients per practice on average. The weakest supply on a population density basis is the Midlands, the West and East Midlands both service over 6,000 patients per practice on average which is the highest across England.
Source: Census, CQC, Christie & Co Research & Analysis
No of CQC Practices
One practice per population of
London 2,074 4,265
South East 1,026 4,659
South 1,763 4,862
South West 606 5,148
North West 1,291 5,608
Eastern 728 5,968
Yorkshire & North East 1,276 6,091
West Midlands 950 6,146
East Midlands 668 6,530

20 | 2018 christie.com
Regional Supply of Dental Practices Weighted by Population Density
High supply of dental practices1 practice per c. 4.3k population
Low supply of dental practices1 practice per c. 6.5k population
London
South
East of England
North West
Yorkshire & North East
South West
Wales
West Midlands
East Midlands
Scotland
South East

2018 christie.com | 21
Associate Pay Scales: Regional Trends
In order to understand dentist supply and demand dynamics from another perspective, we considered how associate pay rates vary by region. Christie & Co’s analysis found that pay scales, as measured by average associate rates per UDA, vary significantly by region ranging from £10.01 to £11.19. The overall average for England & Wales was found to be £10.44. We have adopted a basic supply-demand theory, assuming that higher pay scales will be required to attract dentists to areas with poorer supply and vice versa.
The regions with the highest pay scales were the South West, Wales and the East of England. Operators have identified these regions as being particularly challenging areas for recruitment and, therefore, it would suggest these higher rates are required to attract labour.
Associates in the West Midlands appear to be paid the lowest rates on average. However, our operator survey suggested that the Midlands represents a mixed picture and for some operators, this represents a relatively difficult area to recruit. The survey showed relatively high rates being paid by some operators, but not others, suggesting this is an area where recruitment experiences vary significantly for employers and the reported average should be interpreted accordingly. Interestingly, London is the second lowest paid region.
It is acknowledged that whilst higher rates are paid in parts of the country in order to attract demand, issues around the quality of staffing are not necessarily solved by these higher rates. Quality remains a key issue for operators.
Source: Christie & Co Research & Analysis
Wes
t M
idla
nds
Lond
on
Sout
h
Sout
h Ea
st
Nor
th W
est
York
shire
&
Nor
th E
ast
East
Mid
land
s
East
of E
ngla
nd
Wal
es
Sout
h W
est
Associate Rate per UDA
C&Co England & Wales Average:
£10.01
£10.20£10.29
£10.35£10.45
£10.50 £10.54
£10.84
£11.00
£11.19

22 | 2018 christie.com
Associate UDA Rates: Regional Trends
Low pay rates per UDA
£10.00
High pay rates per UDA
£11.20London
South
East of England
North West
Yorkshire & North East
South West
Wales
West Midlands
East Midlands
Scotland
South East
2018 christie.com | 23
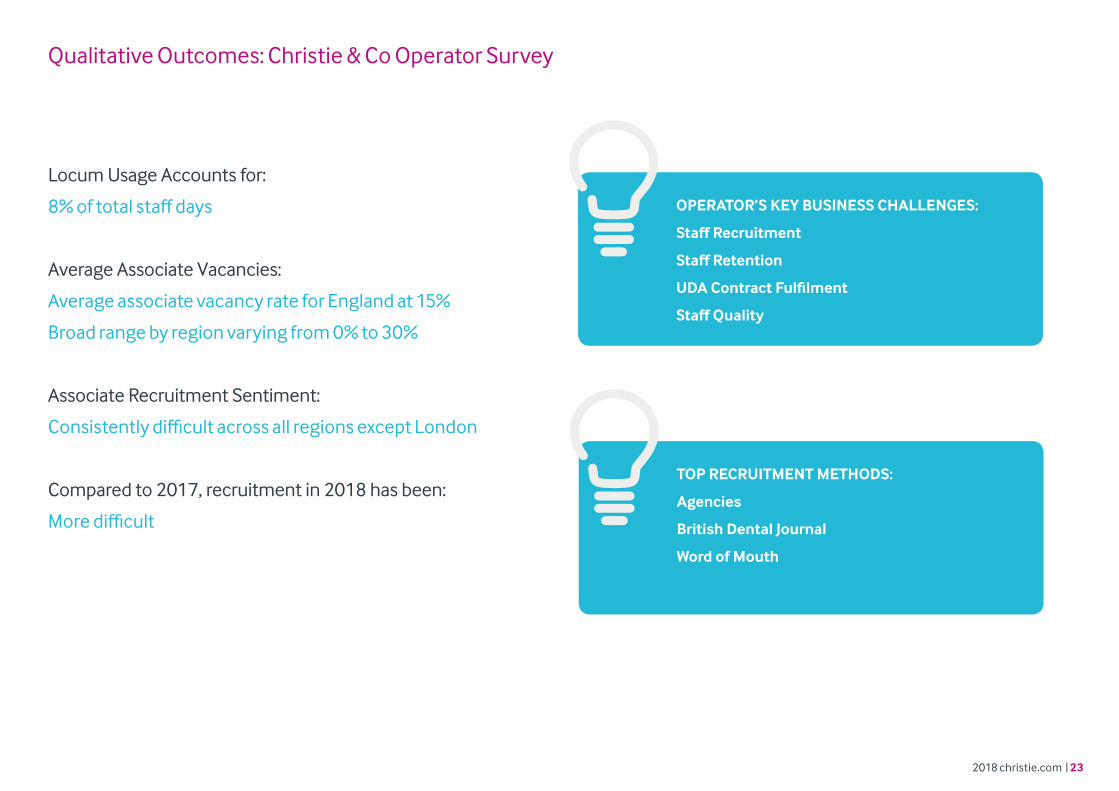
Qualitative Outcomes: Christie & Co Operator Survey
Locum Usage Accounts for:
8% of total staff days
Average Associate Vacancies:
Average associate vacancy rate for England at 15%
Broad range by region varying from 0% to 30%
Associate Recruitment Sentiment:
Consistently difficult across all regions except London
Compared to 2017, recruitment in 2018 has been:
More difficult
OPERATOR’S KEY BUSINESS CHALLENGES:
Staff Recruitment
Staff Retention
UDA Contract Fulfilment
Staff Quality
TOP RECRUITMENT METHODS:
Agencies
British Dental Journal
Word of Mouth

24 | 2018 christie.com
Associates are Paid Less per UDA in Higher Affluence Areas
As anticipated, associate rates did not conform to the usual salary trends in terms of correlating with the cost of living for a given area. The graph below shows average house prices for the areas surrounding the practices in our dataset by region. Counter-intuitively, rather than higher pay scales being evident in more affluent areas (far right regions on the graph), for many regions the opposite trend emerges; for example, the lower salaries are paid in London and the South East where house prices are the highest.
The data broadly suggests that dentists choose to work and live in affluent areas, the impact of which is an oversupply of dentists which in turn depresses associate rates. This suggests that the associate supply may be influenced by a number of factors, and potentially dentists prefer to live in desirable parts of the UK, as indicated by average house prices, despite the opportunity to achieve a higher level of remuneration in other parts of the country (where property is also cheaper).
Source: Land Registry, Christie & Co Research & Analysis
Wales Yorkshire & North East
NorthWest
East Midlands
West Midlands
East of England
South West
SouthEast
South London
£600,000
£500,000
£400,000
£300,000
£200,000
£100,000
£0
Average House Price Data Associate Rate per UDA
£11.00
£10.50 £10.45£10.54
£10.01
£10.84
£11.19
£10.35£10.29 £10.20
Associate Pay Rate Per UDA vs. Average House Prices - Regional Analysis

2018 christie.com | 25
Do Associates Gravitate Towards Cities?
It is widely reported that associates tend to gravitate towards big towns and cities and therefore we considered whether, on average, associate pay rates tend to be lower within urban areas, reflecting higher levels of workforce supply. In order to investigate this, we considered associate UDA rates based on urban, semi-urban and rural settings. These ‘settings’ were established based on population density data.
When we considered pay rates across England and stratified this by urbanicity groupings, we found that rural areas had the highest pay rates and urban areas had the lowest. We also considered how many practices on average were within a short radius of the practices in our dataset (bottom right) for each urbanicity grouping. Despite a large number of competitor dental practices in urban areas compared to rural areas, employers are still able to meet their demand for associates and pay lower rates in urban areas. This emphasises the vast number of dentists gravitating towards urban settings.
The UK is not alone in the shortage of dentists in rural settings; other Western countries including the US have also raised issues around dental shortages being experienced with difficulties in attracting dentists to rural areas (Pourat & Choi, 2008). It has been suggested that to improve this, there is a need to recruit dentists with a willingness to work in areas where shortages exist, albeit in practice this is likely to be difficult.
Reference: Pourat, N., & Choi, K.M. (2014). Trends in the Supply of Dentists in California. UCLA Centre for Health Policy Research; http://healthpolicy.ucla.edu/publications/Documents/PDF/2014/dentistspb-mar2014.pdf
Source: CQC, Census data, Christie & Co Research & Analysis
Urban
Urban Semi urban Rural
Semi urban
Rural
£10.20 £10.25 £10.30 £10.35 £10.40 £10.45 £10.60£10.55£10.50
£10.43
£10.35
23
9
2
£10.56
England Average Associate UDA Rate by Practice Urbanicity
Average Number of Dental Practices within 2.5km

26 | 2018 christie.com
Summary
Our report has identified a number of key themes and issues although, importantly, when compared to challenges in other parts of the UK healthcare system, such as the shortage of nurses, there are several positives.
In terms of the macro environment, our findings show that the growth in UK registered dentists has exceeded population growth since 2010 with the number of UK qualified dentists growing year on year since 2014. However, maintaining and increasing the homegrown supply pipeline of new dentists is important, particularly given uncertainties associated with Brexit and the pressure on existing resource if a greater proportion of the population were to visit a dentist more regularly.
With reference to the main challenges, we draw specific attention to our analysis of the GDC data which shows that for 2017, the net growth in the number of registered dentists was modest, with the implication being that there is a steady “outflow” of dentists leaving the UK register. This is an area which requires further investigation.
Another key issue is the distribution of the dental workforce and, specifically, the supply of good quality dental associates across all areas of the UK.
Our report highlights regional wage differences for associate dentists, whilst showing that these primary trends are also affected by other demographic and urbanicity factors suggesting there are various nuances to dentist shortages. This research provides evidence that dentists prefer to work in affluent areas, gravitate towards cities and are willing to be paid less in order to satisfy these preferences. Such trends create pressure points in other less affluent areas with a key knock on impact being the ability of dental operators to achieve NHS targets.
Whilst there are opportunities to alleviate pressure points through, for example, greater use of hygienists and therapists, a wider solution is needed to ensure there is a sufficient supply of dental associates, hygienists and therapists in all areas of the UK. Given the ongoing and widely reported pressures in the NHS and adult social care sector, it is important that Government recognizes that whilst there are some common issues, the dental sector has specific nuances which require more bespoke policy solutions.
Positively, despite these headwinds, the needs driven and highly fragmented nature of the dental sector ensures that the transactional market environment remains vibrant. Maintaining this confidence moving forward is important to preserve onward investment and, in this regard, it is necessary that solutions are found.
We hope you found this report informative and we welcome any questions or follow-ups with our team at Christie & Co should you wish to discuss further.
26 | 2018 christie.com

2018 christie.com | 27
Christie & Co Contacts
Simon Hughes - Managing Director - Medical
T: +44 20 7227 0749E: [email protected]
Simon joined Christie & Co in 1987 working across all of our trade sectors and various regions of the UK as an agency specialist. After several years in management, Simon helped set up the Christie & Co Medical Team in 2013 to lead the company’s expansion into the pharmacy, dentistry, GP and other ‘white coat’ sectors -spearheading the brokerage side of the business.
His speciality now is the dental sector in which Christie & Co has sold and advised on over £1.5bn of dental projects. Fast becoming well known and sought out for honest and practical advice in the market, Simon leads an expanding multi-disciplinary team of agents and advisors and works across the UK.
Christopher Vowles - Head of Valuation – Medical
T: +44 121 452 3703E: [email protected]
Chris joined Christie & Co in 2008 and was appointed Director in 2010. Chris has overall responsibility for valuation work undertaken across our medical business with particular expertise in the GP, pharmacy and dental sectors.
With a client base of leading corporate and independent operators together with key banks and lending institutions, Chris has been integrally involved in all of Christie & Co’s major medical advisory instructions since joining the business and is frequently invited to speak at industry events and conferences.
Sophie Cooper - Consultant
T: +44 20 7227 0718E: [email protected]
Sophie is a Consultant in Christie & Co’s Healthcare team. She holds a degree in Mathematics from the University of Reading and specialises in statistical modelling and data analysis. Sophie is integrally involved in most of our major assignments covering both transactional and advisory mandates and assisting with the further development of our data analysis systems and outputs.
Michael Hodges - Head of Consultancy - Healthcare
T: +44 20 7227 0784E: [email protected]
Michael was appointed a Director of Christie & Co in 2005 and is a qualified Chartered Surveyor with 21 years’ experience in the healthcare sector, providing consultancy, valuation and landlord and tenant advice to substantial portfolios and single asset properties. His market knowledge spans elderly and specialist care as well as childcare, dental and pharmacy businesses in the UK and also Germany. Michael established and leads Christie & Co’s healthcare consultancy business with a client base which includes a number of leading private equity companies, hedge funds, institutional investors, operators and developers.
Eloise Crush - Senior Consultant
T: +44 20 7227 0773 E: [email protected]
Eloise joined Christie & Co’s Consultancy Team 6 years ago where she has worked on advisory projects across the healthcare and medical sectors. Prior to that, Eloise worked at RBS where she spent several years as a Relationship Manager in the Restructuring and Corporate Banking teams, working on corporate debt transactions for commercial businesses through to large FTSE 100 companies. Eloise recently concluded a Psychology PhD at King’s College London which she completed alongside her work with Christie & Co, Eloise predominantly now works on research projects for the Healthcare Consultancy team at Christie & Co.

28 | 2018 christie.com