the decline and fall of the response rate: the fightback · · 2015-05-12the decline and fall of...
TRANSCRIPT
Worldwide Readership Research Symposium 2009 Session 4.4
THE DECLINE AND FALL OF THE RESPONSE RATE: THE FIGHTBACK Andrew Green, Simon Staplehurst and Richard Windle, Ipsos MediaCT
287
‘There is nothing that is a more certain a sign of insanity than to do the same thing over and over and expect the results to be different.’
Albert Einstein.
‘By labelling a bundle of problems with a single conceptual label, we make dealing with that problem easier – provided we are not interested in solving it.’
Dietrich Dorner, The Logic of Failure.
Overview
Tackling response rates is neither a new nor even a particularly sexy topic. Thirty-four papers on the subject are posted on the Readership Symposium’s on-line database. Is there really any more that we can learn or do about them?
The answer has to be yes. Response rates are amongst the research industry’s most pressing challenges, especially amongst hard to reach groups such as businessmen and the young. And they are a moving target. Some ways that improve response in one market have no effect in others.
For all these reasons, the Business Elite survey, which has run across multiple territories for more than 35 years and aims to speak to some of the most elusive and hard-to-reach people in any country, is an excellent place to test different approaches to improving response.
Our paper will share some findings from recent experiments we have carried out with the BE samples in Asia and Europe, looking at areas such as respondent incentives, questionnaire length and appearance. We will examine results in different markets and amongst different segments of our target respondent.
Introduction
Gorczyca, McDonald and Birti outlined the response rate challenges on the European Business Readership Survey (EBRS) in 1999.
They described tests undertaken in the 1990s looking at the impact on postal response of different forms of postage, various levels of incentive and follow-up techniques on across different countries in Europe.
Their main conclusions were that:
• Managing postal response on a multi-country, high status business audience survey is a complex business. It is not possible to apply the same formula across countries. Each country must be treated individually and at each stage of the survey if we are to determine the most appropriate strategy for maximising response.
• Secondly, it is worth using higher value incentives earlier in certain low response countries. This may mean fewer mailings are required and cost and timing efficiencies are maximised.
• Third, it takes time and multiple reminder mailings just to maintain response rates.
The points above remain as true today as they were then. It is vital to the success of the Business Elite (BE) survey that response rates are maximised. This was the starting point of our recent rounds of incentive tests undertaken across Europe and Asia.
Best practice
Considerable literature exists covering procedures to maximise response rates for postal surveysii. These include:
• The use of covering letters addressed to named individuals (identified at the screening stage) rather than job functions;
• Letters to stress the importance and elite nature of the universe being addressed;
• Incentives to be included with the questionnaire rather than promised on completion;
• Questionnaires should be professionally designed and printed in the respondent’s own language.
More recently, respondents have been offered the option of completing the survey on-line.
Factors contributing to response and non response have been well documented and include those both outside and within the control of researchers.

Session 4.4 Worldwide Readership Research Symposium 2009
288
There is nothing researchers can do, for example, about the attitudes and characteristics of the respondents themselves (which, as we shall see, vary quite considerably by country), about the rules and regulations of the companies they work for or about the environment generally.
On the other hand, the sorts of design factors listed above are very much within our control. As Gorczyca et al noted with respect to the European Business Survey, decisions such as the types of postage used, the value and form of the incentive offered, the length of the questionnaire and how initial approaches are followed up are all crucial.
The other side of the equation is, of course, the commercial imperative. Clients need more and more information about the people they are targeting – and they have less and less money to spend on getting that information. Striking the right balance between these demands and the realities of respondent time and willingness to spend it taking part in research, is often a delicate process.
Brief History of the Business Elite Surveys (formerly EBRS and ABRS)
BE targets the most influential business decision-makers globally, a group that is notoriously difficult to reach. The challenge is, as it always has been, to keep the survey relevant, interesting and convenient to respondents. Business Elite: Europe (17 countries), Asia (8 countries) and the USA provides coverage of most of the major global markets relevant to business (with pilots also having been undertaken in India and China last year). The survey has been running for over thirty-five years in Europe, twenty four years in Asia and four years in the USA. The surveys are syndicated amongst media owner and agency clients including the Financial Times, the Wall Street Journal, the Economist, Time, Fortune, Newsweek, Forbes and CNN. In the past, their interests have been primarily focused on particular regions; more recently they have been interested in looking at audiences at a global level. The BE remains an important sales tool for each of the above brands, as it is the only survey offering access to this niche audience. They will, of course, only support the survey tool if it is credible and useful to them - now more so than ever before. Methodology We use a three stage survey design across all markets starting with appropriate and reputable business lists, followed by a telephone establishment survey and then a self completion questionnaire. Sampling is undertaken in two stages: the first involves selecting a representative sample of eligible establishments from appropriate directories in each country; the second involves telephoning each establishment and randomly identifying pre selected core job functions and obtaining the names of senior business executives with pre-selected responsibilities. The sample of individuals selected is sent a questionnaire by post, and for the last three rounds of surveys they are given the opportunity to complete the survey on-line if they prefer. The self completion questionnaire is mailed to the potential respondent at his or her work place accompanied by a covering letter in English or in the local language. A small cash incentive is included. For many years this was a crisp new US$1 bill. In 2004 this was increased to €5 (or £2 in the UK) and US$2 across Asia. We also undertook additional telephone chases in Asia and offering upto €/£/US$10 or equivalent on receipt of questionnaire on subsequent mailings across both regions. The questionnaire covers media consumption, business travel, ownership of luxury products and influence in purchase decisions amongst other things. Available budget plays a considerable part of the process determining use of incentives. Media, business and technology landscape The business landscape has changed dramatically since 1973 when Ipsos ran the first Businessman Readership Survey across Europe; working practices, the pace of business lives and economic structures continue to evolve through the influence of globalisation and technology developments. For example; in 1973 the Financial Times was only printed in the UK with no more than 12% of its circulation from other countries and just one advertising edition available. By 2009 the FT brand has become a fully integrated communications group, covering a newspaper, website, magazine publishing group, online recruiter, conference division and specialist information provider. The newspaper is printed in 23 cities and available in 140 countries.

Worldwide Readership Research Symposium 2009 Session 4.4
289
Pre 1980’s just about everyone in mature economies across the world was using a landline telephone, maps, electronic typewriters, analogue radios, antennae based television sets and their nearest neighbourhood mailbox. We all now live in a multimedia world of mobile phones, global positioning systems (GPS), computers, iPods, digital natives, Blackberrys, Apple iPhones, Kindles etc.. Changes in survey design
In order for these surveys to remain relevant to respondents and to our industry as a credible multi-media sales and planning tool, the questionnaire has had to evolve to reflect these changes. Tables 1 and 2, below, summarise the changes to the BE: Europe and Asia surveys since their inception. They show the achieved sample size and the number of countries included. The table also shows how the size of the questionnaire has increased over time and how the return rate for the postal questionnaire has changed. Table 1: Evolution of Business Elite: Europe
Year No. of. Countries
No. of
questionnaire
sides
Financial
incentive Postal response rate
1973 12 2 - 35%
1975 14 2 - 52%
1978 14 2 - 48%
1980 16 2 - 50%
1982 16 2 - 54%
1984 17 2 - 58%
1986 17 2 - 58%
1989 17 4 US$1 54%
1991 17 4 US$1 53%
1993 17 4 US$1 51%
1996 17 4 US$1 45%
1998 17 4 US$1 43%
2000 17 4 US$1 43%
2002 17 4 €2 42%
2004 17 6 €2 40%
2006 17 5 €5 31%
2008 17 6 €5 25%
Session 4.4 Worldwide Readership Research Symposium 2009
290
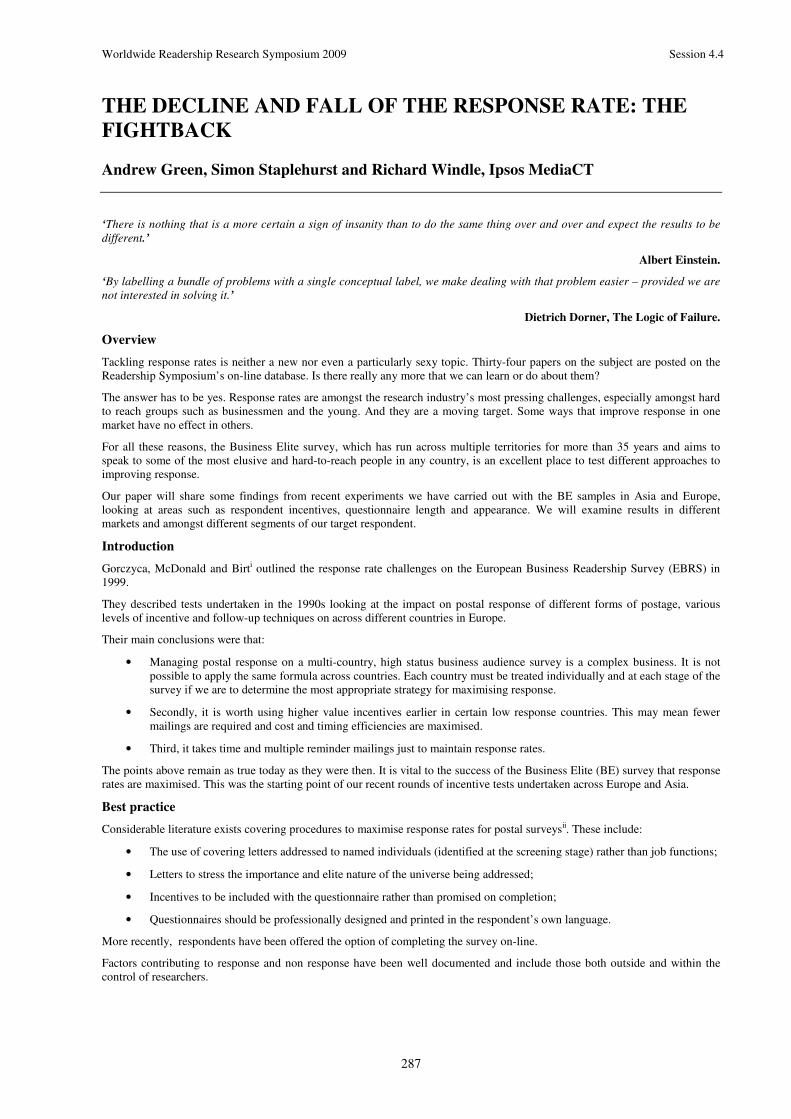
Table 2: Evolution of Business Elite: Asia
Year No. of
Countries
No. of
questionnaire
sides
Financial
incentive Postal response rate
1985 9 5 - 50%
1989 8 4 - 44%
1992 8 4 - 42%
1995 8 4 US$1* 46%
1997 8 4 US$1 42%
1999 8 4 US$1 43%
2001 8 4 US$2 41%
2004 8 4 US$2 42%
2006 8 6 US$5 37%
2008 8 6 US$5 30%
*Incentivised first mailing only.
Questionnaire development
In order for these surveys to remain relevant to respondents and to our industry as a credible multi-media sales and planning tool, the questionnaire has had to evolve to reflect these changes. The tables above show how the European and Asian questionnaires have increased in length over time due to the demands of survey users. After numerous tests, the European survey was born in 1973, as a two sided questionnaire, covering 12 markets. Asian business survey began in 1985, following a similar tailored methodology. By 1996 the two colour typeset questionnaire had expanded to four sides of A4. Additional questions were mainly concerned with gathering further details about the respondent’s areas of responsibility, in particular for purchasing business materials or equipment. It soon become apparent that printed media could not be measured in isolation. High status executives across Europe were able to watch business-related TV channels such as CNN, CNBC or Bloomberg, either at home or while travelling. They also had access to information via the internet. All the sponsors of the survey had a web presence and they needed to know how their internet offering was being used alongside other media. In 2004 the Europe and Asia questionnaires were expanded to six sides. Questions were asked about qualitative engagement attributes, TV and business related web consumption and digital content. The need for ever greater amounts of information resulted in the task required of respondents growing in both size and complexity. Response rates For BE, the response rate is, as described above, a two stage process. Non-response can occur at the recruitment stage if the switchboard operator(s) refuse to provide any information about the company’s senior executives, even after recalls. In general this is not a problem. The response rate for this component has been in the range 85-90% outside the US ever since the survey started. Most companies are quite willing to provide callers with details of their senior management team. The main component of non-response comes at the postal stage. A low response was achieved for the very first survey, but lessons were learned and this increased to 50-60%, where it stayed until the mid 1990s. By 1996 it had dropped to 45%, followed by a steady decline to 40% by 2004 and, more worryingly, to 31% in 2006 and 25% in 2006. In Asia the drop over the same period has been from 42% in 1997 to 37% in 2006 and 30% in 2008. There does not appear to have been a direct link between the questionnaire length and response - when the length was increased it was not accompanied by an immediate decrease in the return rate. We will return to this issue later.

Worldwide Readership Research Symposium 2009 Session 4.4
291
Over the course of the BE series, several techniques have been employed to improve response, including use of different postage mechanisms, cash incentives, and subsequently multiple values of incentives across different markets and at different postal waves. Increasing in some instances to €5 or €10, it would be forwarded to respondents on receipt of a completed questionnaire during subsequent mailings. In fact, we found there was little difference in response between €5 and €10, suggesting that there is no benefit in increasing the incentive beyond a certain point. That said, country response rates continue to decline at varying rates across markets.
Postal Response Rate (%)
2000 2002 2004 2006 2008
UK 42.0 42.0 38.0 37.0 29.0
France 32.0 46.0 33.0 27.0 22.0
Spain 40.0 45.0 40.0 32.0 23.0
Sweden 45.0 55.0 39.0 30.0 34.0
1999 2001 2004 2006 2008
Hong Kong 36.0 38.0 38.0 28.0 19.3
Singapore 41.0 35.0 34.0 25.0 23.6
Taiwan 45.0 43.0 42.0 33.0 39.3
South Korea 44.0 48.0 52.0 54.0 36.4
Douglas and Napior noted in 1999iii that response rates for many companies across America who measure newspapers and local market radio on an ad hoc or syndicated basis were in the 25% to 35% range. They went on to argue that if the average was below 30% we were probably in a lot of trouble. In those heady days EBRS response was well above the danger zone. This danger zone is now far closer, suggesting that plenty of work remains to be done although, again, the challenge is not uniform between markets. Non-response We cannot know whether the attitudes, or indeed media consumption behaviour, of non-respondents differ in some way from those of respondents. But using the BE sample we can look at the profile of non-respondents in terms of job title and industry, overall and by individual countries. In the Netherlands, for example, where response is particularly difficult to obtain across the board, medium sized industrial commercial companies proved most responsive. In some ways these findings make the issue of non-response easier to cope with since there is no clear pattern to it, particularly on a country by country basis. However, it does mean that each country must be monitored individually in order not to misrepresent any industry within it. As we demonstrate later, when assessing response by job title one might hypothesise that the higher up the business ladder they are, the less likely people are to respond. Overall, Chief Executives are less likely than the average to respond, but this is not true in all markets, Examples of this over the last two surveys are in France and Spain. This is partly due to the differing number of respondents by specific job title in each country. Previous findings In 1999, when the Research Development Foundation looked into the factors affecting participation in surveys amongst business people in the UK, they found the main factor to be time. For many, the decision on whether or not to take part correlates strongly with how busy people are at the time of contact.
Session 4.4 Worldwide Readership Research Symposium 2009
292
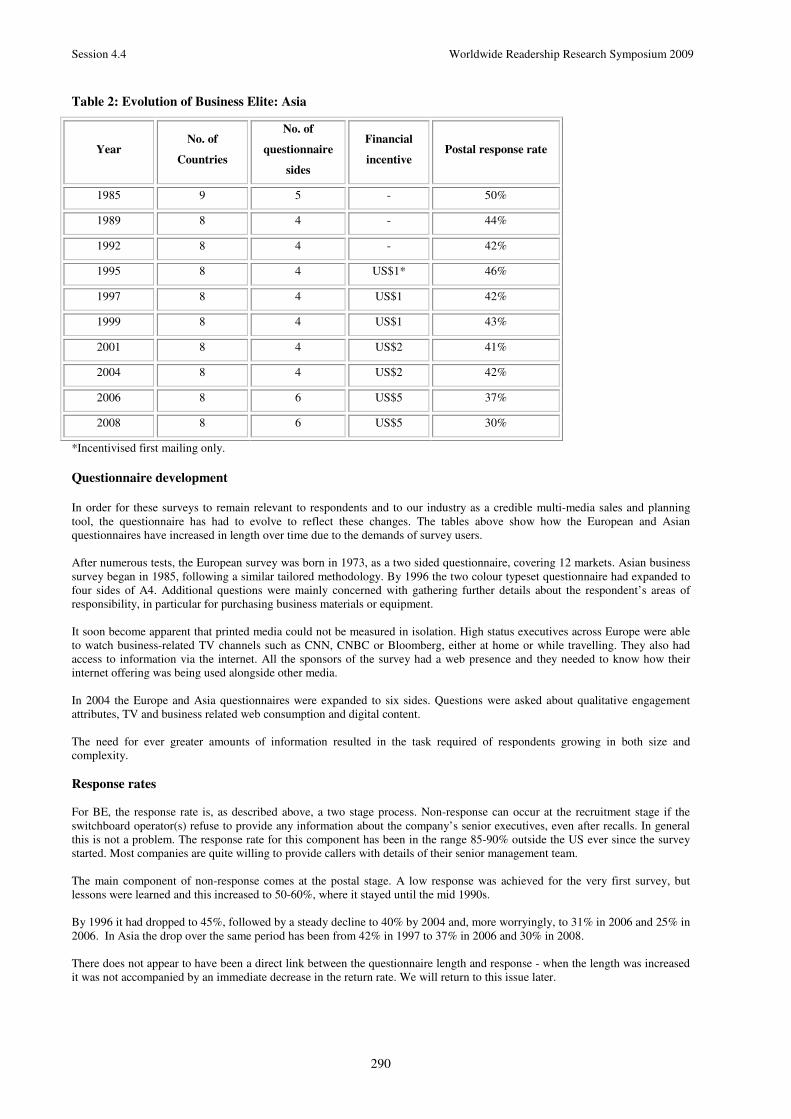
We wanted to test this assumption further. It is clear that this is a key consideration for non-response across markets, but what other reasons were there for respondents not to respond and how does this potentially vary by market? So, in 2008, we asked a selection of non-respondents via telephone across a number of markets in Europe this question. Unsurprisingly, lack of time remained a key consideration in all markets, but it was not the sole reason. There were also other reasons for non response, ranging from ‘Company Policy’ to ‘Receiving too many questionnaires.’ Ipsos European follow up questions for reasons for non response in 2008
France
(208)
Germany
(612)
Holland
(67)
Switzerland
(90)
Italy
(191)
No Time 90% 54% 56% 54% 57%
Company policy 0% 18% 14% 18% 19%
Receive too many questionnaires 1% 13% 8% 16% 5%
Do not take part in surveys 1% 2% 3% 0% 3%
Questionnaire too daunting 0% 1% 1% 1% 1%
Questions not applicable 1% 1% 1% 2% 1%
Cash incentive is seen as a bribe 0% 3% 0% 1% 3%
Company policy not to accept cash 0% 0% 1% 0% 1%
Other 5% 8% 9% 8% 5%
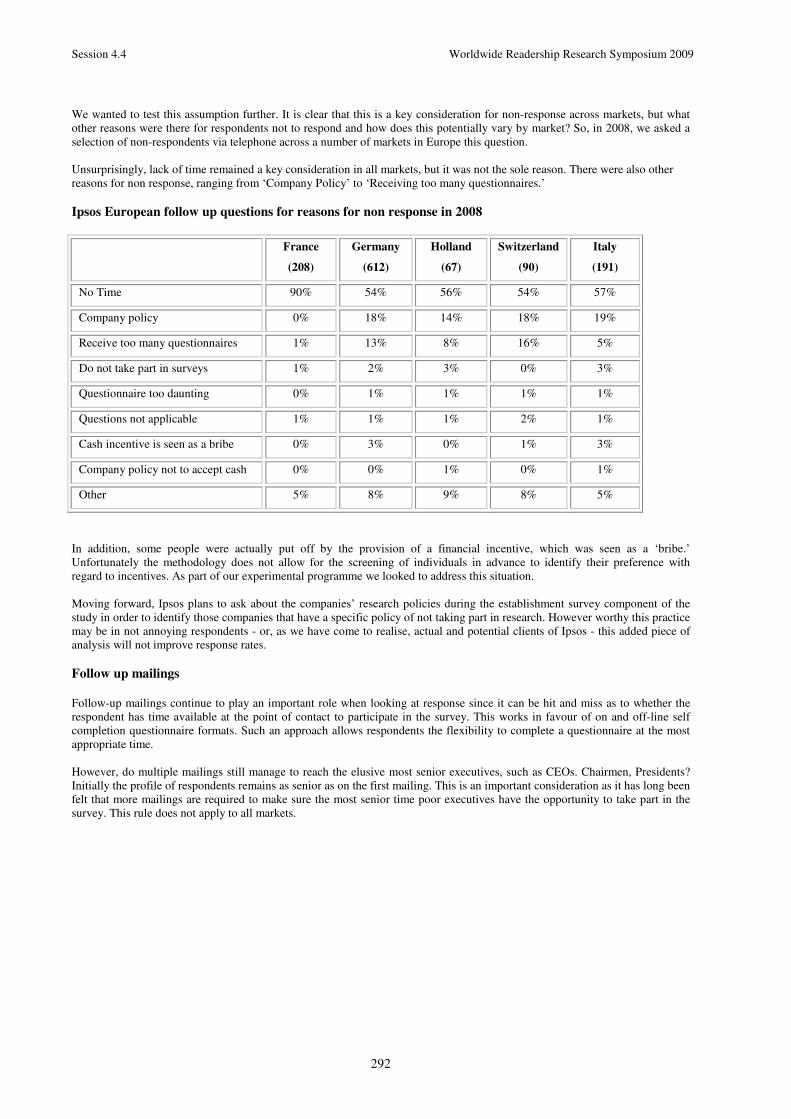
In addition, some people were actually put off by the provision of a financial incentive, which was seen as a ‘bribe.’ Unfortunately the methodology does not allow for the screening of individuals in advance to identify their preference with regard to incentives. As part of our experimental programme we looked to address this situation. Moving forward, Ipsos plans to ask about the companies’ research policies during the establishment survey component of the study in order to identify those companies that have a specific policy of not taking part in research. However worthy this practice may be in not annoying respondents - or, as we have come to realise, actual and potential clients of Ipsos - this added piece of analysis will not improve response rates. Follow up mailings Follow-up mailings continue to play an important role when looking at response since it can be hit and miss as to whether the respondent has time available at the point of contact to participate in the survey. This works in favour of on and off-line self completion questionnaire formats. Such an approach allows respondents the flexibility to complete a questionnaire at the most appropriate time. However, do multiple mailings still manage to reach the elusive most senior executives, such as CEOs. Chairmen, Presidents? Initially the profile of respondents remains as senior as on the first mailing. This is an important consideration as it has long been felt that more mailings are required to make sure the most senior time poor executives have the opportunity to take part in the survey. This rule does not apply to all markets.
Worldwide Readership Research Symposium 2009 Session 4.4
293
Seniority of response profile across survey mailings in 2008
Germany Waves France waves Denmark waves
1 2 3 1 2 3 1 2 3
(566) (229) (147) (525) (248) (138) (296) (141) (85)
Chairman/President 6% 5% 3% 9% 6% 7% 5% 4% 2%
Chief Executive 24% 16% 24% 10% 9% 8% 18% 17% 13%
Chief Financial Officer 4% 14% 3% 14% 11% 13% 16% 13% 11%
Chief Information Officer 2% 7% 1% 8% 6% 7% 12% 13% 13%
Chief Marketing Officer 10% 10% 10% 7% 8% 8% 9% 10% 15%
C-Suite 60% 60% 64% 57% 47% 47% 69% 64% 66%
Board Member 26% 29% 29% 54% 36% 44% 51% 37% 35%
In 2010 we will be able to monitor response across each wave by respondent job function during fieldwork, enabling Ipsos to react to specific poor responder groups in each market. Traditionally one or two reminder mailings have been utilised but more recently a third and fourth set of reminders plus a telephone chase has had to be introduced in some countries. Use of ‘upfront’ incentives Evidence in other surveys including the UK’s NRS suggests response will improve if you can substantially increase the value of the incentive. For example, on the NRS respondents in London, notoriously poor responders were offered a £25 incentive to take part. This has seemingly reversed this downward trend, at least for the time being. We needed to test this assumption ourselves as to whether response could be improved amongst this niche business audience if we were able to provide a substantially higher value incentive to the levels currently used. BE: Europe and Asia 2009 incentive tests We embarked on our experimental programme in 2008, running concurrently with fieldwork. 200 new respondents were recruited in each key test market via the traditional BE methodology. We were looking to see what, if any, impact this would have on
• Response rate • Respondent profile
Within each market we looked to identify two cells: 100 of the most senior people CEOs, Chairmen, President, MDs at the identified establishment and 100 randomly generated ‘other head of functions.‘ Such as Head of Finance, Head of Sales, Head of IT etc. The test respondent packs included the same language appropriate personalised cover letter, a 6-sided questionnaire and a reply pre-paid envelope. The only difference in the test packs was the level of incentive clipped to the front of the cover letter. We undertook the experiments in the UK, France, Germany, Spain, Italy, Hong Kong and Singapore. We looked to test different incentive levels of £20 and £40 in the UK, €20 and €40 in Germany and Spain, €20 and €40 gift vouchers in France and Italy and US$10 and US$20 in Hong Kong and Singapore. We also undertook additional tests in Netherlands, Denmark, Sweden. More about those later in this paper. Our findings compare the effective response rates of the first postal dispatch. We have historically used different market specific response techniques in the main surveys subsequent mailings, making subsequent response comparisons difficult. The first mailout tends to yield the greatest response. Traditionally, after each subsequent wave, response decreases by about half. If we can achieve a good response early on, not only will this impact overall response, it also means there will be potential cost savings in subsequent waves.

Session 4.4 Worldwide Readership Research Symposium 2009
294
Incentive Test Summary – Impact on Response Rates
Total Control study €5 Test: €20 Test: €40
Effective mailout 16,854 1,000 1,000
RR big 5 Euorpean markets 12% 16% 20%
Control study US$2 Test: US$10 Test:US$20
Effective mailout 6,575 400 400
Hong Kong/Singapore 9% 16% 19%
Potential response curve over multiple waves The results were initially encouraging; all things being equal the increase in incentives could potentially improve response rates. Assuming we could achieve similar levels of response on subsequent mailouts, with the right level of incentive the surveys could at least stabilise, or potentially improve on their current position. Unfortunately, the use of the higher incentives would increase the cost anywhere between three and six times current incentive cost levels. Even after subsequent analysis, with the decrease in sampling, telephone screening, printing and dispatch costs that accompany a better response rate, the cost of these larger incentives were felt to far out-weigh the benefits. That said, it was clear that with some more targeted tests we could look to use differential incentive levels across different respondent groups. So we continued to look at the analysis.

Worldwide Readership Research Symposium 2009 Session 4.4
295
Incentive tests – Potential Impact on Respondent Seniority Profile Looking at the results in a bit more detail, we can see that with a higher level of incentive this would potentially impact response in each market in different ways. In some instances there would be no impact and in others response could be negative. Particularly noteworthy were France and Spain.
Main study wave 1
£2/€5
16,854
Test level 1
£20/€20
1,000
Test level 2
£40/€40
1,000
Countries:
RR RR RR
GB Most senior 14% 20% 21%
Others 13% 24% 39%
Germany Most senior 17% 16% 18%
Others 16% 10% 6%
France Most senior 12% 6% 2%
Others 14% 16% 20%
Italy Most senior 17% 14% 18%
Others 21% 18% 20%
Spain Most senior 13% 14% 20%
Others 15% 30% 15%
Main study wave 1
US$2
6,575
Test level 1
US$10
400
Test level 2
US$20
400
Countries:
RR RR RR
Hong
Kong Most senior 9% 15% 17%
Others 13% 20% 23%
Singapore Most senior 9% 18% 20%
Others 12% 22% 22%
In this instance this point went against a conclusion offered by McCullough in his 2001 paperiv that by increasing an up front incentive would have the potential of increasing response amongst difficult to reach groups. As suspected, with substantial upfront incentives, response improves, albeit it in different ways in each market, and at a considerable cost, as suggested in other experimental workv. The happy medium between minimum survey costs and maximum response rates is by no means easy to reach. The Scandinavian and Holland Experiment Another concern in some markets was that a substantial percentage of the money spent on incentives was ‘wasted’ and response still remained low. And in some instances, that the incentives were being seen as a bribe. This seemed to be particularly prevalent in the Scandinavian countries. We therefore looked to test our approach in Denmark and Sweden by removing the cash incentive and then only offer money to a charity of choice on receipt of the questionnaire. Perhaps, a higher incentive offered as a charitable donation might offer a solution in specific markets that have commented that they see the use of cash as a ‘bribe.’

Session 4.4 Worldwide Readership Research Symposium 2009
296
We looked to test this hypothesis further in the Netherlands (historically the most challenging market across Europe). One option we had was simply to withdraw the cash incentive with no danger of reducing response below its already dismal level. So we tested 50DKR and 200DKR to go to charity in Denmark and 50SKR and 200SKR in Sweden. In Holland we tested how offering no cash incentive would impact response.
Main
study
wave 1
20DKR/2
0SKR
4,445
Test level 2
No incentive
300
Test level 2
50DKR/50SKR to
charity
300
Test level 2
200DKR/200SKR
to charity
300
Netherlands Most senior 9% 2% n/a n/a
Others 8% 2% n/a n/a
Denmark Most senior 13% 2% 2% 4%
Others 15% 6% 2% 2%
Sweden Most senior 17% 2% 2% 3%
Others 18% 4% 7% 9%
*Higher incentives impact in differently in each country
It is clear that one of the most important factors influencing response is the use of ‘up-front’ incentives – the return rate was almost non existent for an experimental group where no incentive was offered. Netherland’s response rate is by far the worst on our survey. If we were to continue surveying there we would need to revisit our approach here. Also, in Denmark and Sweden an incentive that is part of the respondent pack works substantially better than simply promising to make a donation to charity of choice by the research company. In conclusion, all of the above required further thought and consideration. Questionnaire length Logically there must be a relationship between response rate on the one hand and questionnaire length and clutter on the other. This suggests that a potential solution to the response rate problem would be to reduce the length of the questionnaire. The converse implication is that further additions would act to reduce the response rate further. Budget limitations did not permit the increase in incentives. So we needed to find a solution to the declining response rate and the extra costs associated with this. As an outcome of this and the above tests, the sponsor group revisited what was core to the survey requirements. Amidst much discussion we were able to reduce the questionnaire content in Europe and Asia by about a third. We now only ask 30 core questions on both European and Asian questionnaires. We were able to fit the revised European questionnaire over 6 sides. However, there was much less content. On the Asian questionnaire we managed to fit the questionnaire content onto a foolscap 4-sided document. We also revisited the look and ease of completing the online questionnaire. Rather than taking more than half an hour to complete, the online questionnaire now takes on average around 20 minutes. Questionnaire design In addition, as well as positioning respondents as being an important elite audience we also repositioned the title on the front page of the questionnaire to ‘SURVEY OF ‘Region’ MOST SENIOR AND INFLUENTIAL BUSINESS EXECUTIVES.’

Worldwide Readership Research Symposium 2009 Session 4.4
297
We kept the same survey design yet reduced the level of questionnaire content. On the front page we also reduced the number of questions asked. We continued to measure AIR and recency questions but stopped measuring a number of qualitative engagement attributes/Source of Copy question for each print vehicle, reducing the number of tick boxes by about a third. Front page of 2008 Questionnaire Front page of the 2009 Questionanire
Cover letter As part of the personalised cover letter we also included a wider section further highlighting the level of seniority, importance and prestige of the elite universe we were targeting, referencing each market being surveyed. Incentive levels Each eligible individual was posted a package including: a self-completion questionnaire and personalised cover letter, and pre-stamped reply envelope in their own language. Within the respondent package we also included a nominal cash amount (or equivalent, such as vouchers in France and Italy) that could be kept by the respondent or given to a charity of choice. Based on a combination of our learnings, as well as through budget constraints, we increased the incentive in the UK and across Asia so that each incentive provided in the first wave was €/£/US$5 or equivalent. Otherwise we decided to keep the incentive levels in line with those used in 2008 in all markets. BE 2009 – Response rates Two reminders were sent across Europe if the questionnaire was not returned. Three were undertaken in Asia if the questionnaire was not returned. In additional we undertook telephone chases across key markets in subsequent mailings. The first reminder mailing went out four weeks after the initial despatch, the other four weeks after that. Each subsequent reminder had a personalised cover letter with a very short url description, questionnaire and additional same level cash incentive.

Session 4.4 Worldwide Readership Research Symposium 2009
298
In terms of testing the impact of the above we will only highlight the response after the first two mailings.
Two
reminders
First Mailout Second Mailout
Effective Paper
Response Rates
Effective Paper
Response Rates
2008 2009 2008 2009
UK 9% 20% +11.0 19% 30% +10.1
Germany 9% 12% +2.2 14% 18% +3.6
France 12% 13% +1.4 18% 18% +0.7
Italy 14% 19% +4.9 20% 23% +2.5
Spain 11% 19% +8.1 18% 24% +6.5
Netherlands 8% 12% +4.0 12% 16% +4.5
Denmark 15% 17% +2.1 21% 25% +3.3
Sweden 20% 30% +9.9 29% 40% +10.9
Hong Kong 9% 15% +5.9 13% 23% +9.7
Singapore 9% 22% +13.0 15% 33% +18.2
Total Europe 13% 18% +4.9 19% 25% +4.8
Total Asia 11% 19% +7.5 21% 29% +8.2
Impact of survey design amendments
Where we increased incentives and shortened the questionnaire in the UK and across Asia response increased. We achieved a similar seniority profile to 2008. Where we maintained incentive levels and shortened questionnaire length response rates increased though not as noticeably. This also proved to be the case across two mailings. France stands out as a country that did not respond. Total response across Asia was 35% (30% in 2008) 10% of those who took part completed online questionnaires compared to 8% in 2008. Total Response for Europe is expected to be 27% (25% in 2008). 25% of those who took part completed online questionnaires compared to 10% in 2008. The survey amendments seemed to work in part…. for the time being. The evolution of Business Elite: BE :USA Background Ipsos has been running a BE survey in the USA annually since 2005 and we are facing the same challenges of declining response and increasing survey costs, as outlined throughout this paper. Before we launched the survey, we undertook a pilot test to establish the best practice approach for the survey. The pilot tests indicated that we would be able to achieve a response rate at the postal stage in excess of 35%. Since then response has reduced and now stands at 25%. Since those initial pilot tests we have not tested the impact of increasing the level of incentives (currently at US$5) or the impact of shortening the questionnaire length. However, we still face the same challenges of declining response and increased survey costs. Over the last decade in the United States, web questionnaires have overtaken paper questionnaires for self completion surveys. Our experience with online response in Europe indicated that there might be potential to move a greater part of the US survey online. So we undertook an experiment to determine the feasibility of moving a greater component of the survey online. The USA ‘stand alone online’ experiment With minor differences, the questions included in the Pilot Study were identical to those used in the 2008 Survey. The questionnaire had evolved and was now 8 sides long.

Worldwide Readership Research Symposium 2009 Session 4.4
299
An initial invite was sent to past BE respondents with a US$5 bill attached. Respondents had to type in a personalised url to take part. The pilot survey took approximately 30 minutes to complete. To further increase the response, “reminder” e-mails were sent to executives who had not completed the online questionnaire and for whom e-mail addresses were available. In total, two “reminder” e-mails were sent, and 101 business executives completed the Pilot Study. Response Rates The response rate for the 2008 Business Elite Survey was 26%. 8% of the overall survey was completed on line. In contrast, the response rate for the Pilot Study was only 12%. The results of this experiment showed that the use of an on-line method of data collection results in a substantially reduced response rate (26% vs. 12%), and, in many instances, provided different results. Although there were some differences in sample composition between the Pilot Study and the 2008 Business Elite Survey, these differences were generally small and cannot fully explain the disparate results of the two studies. In all likelihood, the differences were due to the way the data were collected (on-line vs. paper-and-pencil), and changes that were made to the online questionnaire to make it shorter and easier to self administer within a reasonable time frame. From this initial experiment, it was clear that BE:USA could not be run solely online in the foreseeable future. It needs to remain a top-up vehicle to the main postal survey. As a result of our findings in Europe and Asia we are looking to substantially shorten the US component of this survey and continue to rely on the dual data collection approach. Further developments and challenges Costs In addition to finding ways to combat the perpetual decline in response rates, one of the reasons for investigating alternative data collection methods is cost. Throughout this paper we have highlighted the ever increasing cost of incentives. There are other costs associated with the declining response such as the need to recruit more respondents to deliver the required sample size for each market. The costs of printing and posting questionnaires have also continued to rise. Until this year there have not been cost savings made with the inclusion of paper and online self completion questionnaires. However, we have noted in Europe that 25 % of those who took part in the survey completed on-line. Obviously, as the number for online completions increases the need to print and post the paper version will decrease. There are also other costs associated with setting up and running a dual system. However, early indicators are that there will be savings from printing and postal costs. The response debate With the majority of the experiments undertaken not having a significant positive influence on response rates, coupled with the findings echoing some of those that have been published elsewhere, one does ask the question what this paper adds to the response rate debate. We have found that by applying a number of tailored techniques across multiple markets across the world does not provide the definitive answer. Although there might be some benefits in some markets, the overall response rate and survey costs are both still on the move in the wrong directions. We are also wary that an increasing number of clients paying for the research are not necessarily concerned with response rates. Their interests still lie in the trade off between costs and actionable results. The solution… The BE franchise has served its purpose for the last thirty-five years. The data is used by all of the major media agencies responsible for buying and selling advertising space on a pan regional and global basis. How is the survey likely to evolve in the future? There are two main developments:
In an age when more and more information is readily available there is an increased demand for more regular data. A survey that is released every two years is no longer adequate and from last year the core BE surveys have moved to continuous data collection with the results released annually. From a research point of view the greatest challenge facing the survey continues to be the response rate. This has been addressed by experimental work designed to maximise the return rate of the current methodology while at the same time introducing the use of online data collection.

Session 4.4 Worldwide Readership Research Symposium 2009
300
This step is being taken very carefully. The integrity of the sample remains paramount and it is important not to introduce biases by making the task more appealing for certain respondent categories – paper questionnaires still have the advantage that they can be picked up and completed anywhere and at any time. That said, there are strong arguments, and examples elsewhere in other areas of our work, of giving respondents the opportunity to respond in different ways, depending on their preferences. This trend is likely to continue and the future of the survey will almost certainly lie in a mixed method of data collection…. and further targeted incentive enhancements. Acknowledgement Special thanks to Ted D’Amico for his contribution to the analysis of the BE:USA online pilot and Mette Petersen for her knowledge of BE: Europe and Asia fieldwork in 2008/9. REFERENCES i Gorczyca, Faye, Birt, Hilary and McDonald, Simon (1999). Can’t Buy Me Love, But How About Response? An Analysis of Response Rates From the European Business Readership Survey. Proceedings of the Worldwide Readership Research Symposium, Florence. ii Dillman, D.A. (1978). Mail and Telephone Surveys. New York: John Wiley & Sons iii Douglas, Stephen A. and Napior, David (1999). How Low Can Response Rates Go? Proceedings of the Worldwide Readership Research Symposium, Florence iv McCullough, Walter (2001). Varying the Monetary Incentive in Mail Surveys. (1) Does It Change Survey Results? (2) Can it Create Sample Improvement Opportunities? Proceedings of the Worldwide Readership Research Symposium, Venice v Davis, Jenny, Carroll, John and van Staveren, Martin. (2005) Response Rate Decline: It’s time For Action. Proceedings of the Worldwide Readership Research Symposium, Prague.