the decision between tender offers and open market bond ......the decision between tender offers and...
TRANSCRIPT

1
The Decision between Tender Offers and Open Market Bond Repurchases: Do
Bond Issuers Time the Market?
Hagit Levy
Zicklin School of Business
Baruch College, CUNY
One Bernard Baruch Way
New York, NY 10010
Tel: (646) 312-3199
Email: [email protected]
Ron Shalev
Stern School of Business
New York University
44 West Fourth Street
New York, NY 10012
Tel: (212) 998-0418
Email:[email protected]
We thank Kodjo Apedjino (PNC BANK), Andrew Dubinski (Goldman Sachs), Tomer Berkovitz (JP Morgan-
Chase), Yakov Amihud, Ohad Kadan, Pepa Kraft and seminar participants at Baruch College (CUNY), Washington
University in St Louis, IESE and New York University for their comments and suggestions. All errors are our own.

2
The Decision between Tender Offers and Open Market Bond Repurchases: Do
Bond Issuers Time the Market?
Abstract: We analyze the observed increase, at times of capital market crises, in the number of
firms repurchasing their bonds in the open market, a stealthy method to repurchase bonds, in
which bondholders are not aware of the buyer’s identity, and the observed decrease in the
number of firms using a tender offer, a transparent method to repurchase bonds, in which issuers
pre-announce their repurchase intentions, and provide evidence consistent with issuers timing the
bond market. Specifically, we find that at times of heightened uncertainty, during which bond
prices tend to be depressed, issuers are more likely to repurchase the bonds in the open market
than via a tender offer. Analysis of both the one year-ahead returns on the repurchased bonds
and the issuers accounting gains from the repurchase provides ex-post evidence that bond
repurchased in the open market were executed at better term for the issuers than bonds
repurchased via tender offers. Finally, we find that insider stock buys are more prevalent around
times of open market repurchases.

3
The Decision between Tender Offers and Open Market Bond Repurchases: Do
Bond Issuers Time the Market
I. Introduction
Recent years have seen a large increase in the volume of bond repurchases.1 A public debt
issuer can execute bond repurchases via two alternative methods, tender offer and repurchase in
the open market. Whereas during a typical year firms are more likely to choose tender offers to
repurchase their bonds - for every open market repurchase there are four tender offers - during
the two financial crises of the last decade, the dot com and the housing bubble bursts, this ratio
reversed such that for every tender offer there are four open market repurchases.2 In this study
we analyze the causes and effects of firms’ choice of bond repurchase method and provide
evidence consistent with issuers timing the market in bond repurchases.
Though very large in scale,3
the corporate bond market is more fragmented and
significantly less liquid than the stock market (Coffee and Klein, 1991; Bushman et al, 2010).
As opposed to equity repurchases, in which firms typically pre-announce their repurchase
intentions prior to both tender and open market repurchases, only bond tender offers are pre-
announced and are usually executed at the price set in the offer, typically at a premium over the
presiding market price.4 Bond repurchases executed in the open market are generally not pre-
announced by issuing firms. The transaction price is set in private negotiations between the
1 Using data from the Mergent database of tender and open market repurchases only: in 1998 approximately 10
billion outstanding debt was repurchased by 56 firms whereas in 2007, 135 firms repurchased 45 billion in
outstanding debt. 2009 represents the highest volume of repurchased bond over the last decade, reaching 212 billion
dollars of outstanding debt. 2 Figure I plots the number of repurchases over time in our sample as well as the percentage of repurchases using the
tender and open market methods. 3 Corporate bonds outstanding in the US amounted to 6.9 trillion dollars in 2009.
(Source:http://www.sifma.org/research/statistics.aspx). 4 The issuing firm typically issues a press release and sends an offer letter to all known bondholders inviting them to
sell the bonds back to the firm.

4
buyer’s dealer and the seller’s dealer. While information on pricing of past transactions is
available through TRACE, it is sparse and incomplete.5 Because the bond market is very illiquid,
relying on past transactions to price the bonds during negotiations can be challenging for bond
holders and since the actual bond holder (seller) is not aware of whom the counterparty to the
transaction is, she cannot incorporate information of the issuer’s repurchase intentions into the
pricing decision. Thus, the deal value is ultimately an approximation, sometimes very inaccurate,
of market prices.
Economic literature suggests that capital market turbulence intensifies agency problems
arising from adverse selection and moral hazard, making screening good borrowers from bad
borrowers harder (Mishkin, 1997 and Mishkin and White, 2002), and increasing the likelihood of
asset dislocations and mispricing. Given the corporate bond market structure, we conjecture that
in times of increased market uncertainty, issuing firms will exploit their superior information
when they believe the bonds are undervalued, and repurchase their debt securities in the open
market, at a discount relative to the bonds’ economic value. We develop a set of analyses to test
our conjecture:
We start by validating our basic premise that at times of market turbulence bond prices are
on average depressed due to increased uncertainty. For that purpose, we investigate whether the
premium over the market price offered in a tender offer is different at times of market turbulence
than it is at times of low volatility. If at times of heightened market uncertainty the increase in
uncertainty concerning firms’ default risk depresses bond prices, a signal that the firm can
actually repay its debt (i.e. a tender offer) is likely to be of higher information content with
5 The Trade Reporting and Compliance Engine (TRACE) provides information about over the counter corporate
bonds transactions since 2002. From inception in 2002 reporting on TRACE was gradually expanded to include
more bonds and became complete in February 2005 (Bushman et. al 2010). TRACE provides information about
transaction size, price (inclusive of any markups, markdowns and commissions) and date, but does not identify the
buyer, the seller or even the dealer that executes the transaction.

5
respect to the firm’s credit worthiness and therefore, will likely have a stronger effect on bond
prices compared to times of a relatively stable information environment. Thus, at times of
heightened uncertainty, bondholders will require higher premium to sell their bonds in a tender
offer than in ordinary times. We use two alternative market level measures to capture levels of
uncertainty and information asymmetry in capital markets: 1) the implied volatility of the S&P
500 stock index, commonly known as the VIX index (VIX), and 2) the credit spread between
Baa rated corporate bonds and US treasury bonds (SPREAD). Analysis suggests that premiums
over market price in tender offers are positively associated with both the implied volatility in the
stock market and the credit spread in the bond market.6 This result suggests that the benefits to
the issuer of repurchasing bonds in the open market at market price relative to using a tender
offer increase in times of heightened uncertainty.
Second, we analyze the connection between repurchase method and level of uncertainty in
capital markets. We conduct a quarterly time series analysis of the association between the two
measures of uncertainty and information asymmetry described above (VIX and SPREAD) and
the ratio of open market bond repurchases to total bond repurchases, and find that this ratio
increases in both measures. We also perform a firm level analysis of the choice between open
market repurchase and tender offer, controlling for other factors affecting the choice, and find
that the likelihood of choosing to repurchase bonds in the open market versus tendering the
bonds increases in both measures. These tests suggest that at times of uncertainty and high
information asymmetry, issuers tend to use the open market to repurchase their bonds as opposed
to using a tender offer.
6 It should be noted that it is not the level of information asymmetry that is relevant for the test but changes in
information asymmetry, as the firms’ specific level of information asymmetry is assumed to be priced in the bond at
initiation. If the market is volatile, however, there is a general increase in information asymmetry between firms and
outsiders which will affect the probability of mispricing.

6
Third, in order to corroborate our interpretation of results as market timing in bond
repurchases, we investigate whether repurchases in the open market are executed under more
favorable terms to issuers than tender offers. We perform two tests: 1. a return analysis
comparing the one year ahead returns on the bonds repurchased (or comparable bonds in case the
entire series was repurchased) and find that after controlling for year, and industry fixed effects
and the firm’s credit rating, the returns on bonds following open market repurchases are higher
than returns following tender offers, and 2. an analysis of the impact of each repurchase method
on issuers’ income statement. Unlike stock repurchases, bond repurchases have a direct effect on
issuers’ income statement as “gains/losses from extinguishment of debt”.7 We hypothesize and
find a positive association between the choice to repurchase bonds in the open market and gains
from extinguishment of debt recognized in the income statement. Both of the above findings
support the hypothesis that managers time the market and exploit bond holders by repurchasing
their bonds in the open market.
Finally, we provide additional evidence consistent with managers possessing private
information prior to bonds’ repurchases. We rely on extensive literature which documents that
insiders’ trades are based on superior knowledge (Piotroski and Roulstone, 2005, Beneish and
Vargus, 2002, Rozeff and Zaman, 1998) and predict that if open market bond repurchases are
based on superior insider information and are associated with wealth transfers from debt holders
to shareholder, they will be accompanied by increased purchases of the firm’s stock by insiders.
7 Gains and Losses from extinguishment of debt are calculated as the difference between the payment made to
extinguish the debt and the book value of the debt, and do not necessarily reflect the market value of the gain.
However, unless there is a systematic difference in the book values between debt repurchased using tender offers
and debt repurchased using the open market method, results would be consistent with both economic and accounting
gain.

7
Consistent with the above prediction, we find an abnormal increase in insider trading around the
period in which issuers make bond repurchases in the open market.8
As periods of market turbulence can be accompanied by liquidity shocks, an argument can
be made that during times of liquidity contractions, firms may not want to commit the larger
amounts of funds needed for a tender offer, and instead use open market repurchases to adjust
their debt ratios. The repurchase method could also reflect change in market power between
seller and buyer (during times of illiquidity, sellers may be looking for buyers as opposed to
buyers looking for sellers). To rule out illiquidity as an alternative explanation to our findings we
perform two sensitivity analyses: 1) we verify that our measures of the level of uncertainty (VIX
and SPREAD) do not capture also illiquidity levels by replacing both uncertainty measures in the
analysis with the residuals of a regression of these measures on the Amihud (2002) market
illiquidity measure, and 2) we rerun all of the analyses excluding year 2008 observations from
the analysis. All results remain qualitatively intact.
Our study contributes to the existing body of research in several ways. First, it extends
evidence of the market timing literature by suggesting that market timing exists for debt
repurchases and firms exploit situations in which bonds are likely undervalued to repurchase
them in the open market. The evidence provided is important especially in light of the costs of
timing the market in repurchasing debt: 1. Given that the bond market is fragmented, illiquid and
hosts fewer, more sophisticated players, a bond holder is more likely than a stock holder to know
post-factum that the issuing firm took advantage of market conditions (and thereby bondholders)
without disclosing it ex-ante. In a repetitive game, borrowers will take these actions into account
when pricing the firm’s future debt, thus increasing the borrowing costs of the firm. 2. Legal
8 We also find an increase in insiders’ purchases of stocks before tender offers, however the increase is statistically
smaller than the increase around open market repurchases.

8
bulletins commonly warn repurchasing firms about violating insider trade and anti-fraud laws
(rule 10b-5) and regulation FD. Open market bond repurchases are not pre-announced and thus
may involve higher legal risks.9
Second, bond repurchases offer a cleaner setting than stock repurchases to identify firms’
motivation to time the market in repurchasing their securities. Extant literature in accounting and
finance document positive abnormal returns and subsequent long term run up in stock price
following stock repurchase announcement (Ikenburry et al 1995). Researchers have interpreted
these findings to be consistent with firms timing the market to repurchase their stock when they
believe it to be undervalued. Researchers, however, also provide theory and empirical evidence
associating stock repurchase announcements with managers signaling their private information
(Vermaelen, 1981, Dann, 1981, Vermaelen, 1984, Ofer and Thakor, 1987, and Persons, 1994). In
a multi-period world, if firms that announce stock buyback as a signal of private information
want their future signals to be credible, they would act on the current signal and actually
repurchase the stocks. Thus, empirically separating market timing from credible signaling as a
motivation for the security repurchases may prove a tall order. Furthermore, Dittmar and Dittmar
2007 suggest that stock repurchase waves actually do not coincide with times of stock market
undervaluation. Bond repurchases, therefore, offer a cleaner setting to identify firms’ motivation
to time the market in repurchasing securities. Unlike stock repurchases, public debt repurchases
in the open market are not pre-announced and in most cases bondholders are not aware that the
firm actively repurchases its public debt, which rules out signaling as a motivation for the
security repurchase.
9 When certain conditions are met, an open market repurchase may be classified as a tender offer forcing issuers to
give favorable terms to all bond holders.

9
Third, this research extends our understanding of factors motivating debt repurchases and
the implications of the choice of repurchase method. Bond repurchase research has so far
focused on tender offers and suggested factors such as deleveraging, the cost of debt overhang,
and tax considerations as motivations for public debt repurchases. Our study provides evidence
consistent with firms considering their own debt as a good investment and timing the market in
repurchasing it.
The rest of this study is organized as follows: Section 2 provides institutional background
about transactions in the secondary bond market. Section 3 discusses related research. Development
of the hypotheses is presented in Section 4. Section 5 presents sample selection procedures and
empirical results. Section 6 concludes.
II. Secondary Bond Market and Bond Repurchase
The secondary bond market is fragmented and significantly less liquid than the stock
market (Coffee and Kline, 1991, Bushman et al., 2010). Most market participants are
sophisticated investors, and retail/individual investors do not play a major role. Insurance
companies hold approximately 33 percent of total corporate bonds outstanding and the lion share
of the rest is held by funds (Bushman et al., 2010). Corporate bond transactions in the open
market are normally executed between two dealers, mostly over the phone. Neither the
bondholder nor her agent are aware of who the end counterparty to the transaction is, namely
whether the dealer that buys the bond acquires it for her own portfolio or she serves as an agent
for a different buyer. The transaction price is privately negotiated between the two dealers.
The market information available to bond holders for the purpose of bond pricing is thin
and incomplete. Corporate bond transactions are relatively sparse and the information on these
transactions, though improved in recent years, is limited. As of 2002, dealers, members of the

10
Financial Industry Regulatory Authority (“FINRA”), are required to report deal information on
bond transactions to the Transaction Reporting and Compliance Engine (“TRACE”). From
February 2005, all transactions are reported through TRACE (Bushman et al. 2010). Until 2008,
the information provided through TRACE included only the bond identifier, the price inclusive
of any mark-up, mark-down or commissions, the quantity, the yield, and the time of execution.
In July 2008 FINRA approved a proposal to expand disseminated data to include whether the
reporting dealer is acting on behalf of a buyer, a seller or on her own behalf (the dealer identity,
however, is not reported on TRACE). The proposal,10
the comments by market participants, and
FINRA’s response to the comments shed light on the information environment in the bond
market:
The main reason behind the additional data, as suggested by FINRA in its proposal, is that
the new data allows both dealers and investors to better understand the reported prices and
therefore facilitate price comparisons. The following correspondence between a member
dissenting the proposal and FINRA, however, reveals FINRA’s view of the usability of
information provided by TRACE for the purpose of bond trading. The dissenting comment was
summarized by FINRA as follows:
“(the new data) would hamper the ability of investors trying to accumulate or
dispose of positions without moving the market (as noted above) and would: (i)
permit market participants to discern the trading intent of others and
consequently trade in a manner that is harmful to the identified investor; (ii)
permit others to intrude upon the trading strategies of an investor; (iii) increase
investor costs; and, (iv) as noted above, potentially reduce liquidity….
…. The commenters stated that such investors must be able to execute block
trades and dealers must be able facilitate such trades without signaling the
market because prices in the securities market are driven by supply and demand
and if an institutional investor or a dealer tries to sell, or facilitate the sale of, a
block without having the ability to shroud their activity, it might cost more. In
addition, other market participants might try to raise prices, by buying some of
10
SR-FINRA-2007-026, text of the Proposed Rule Change,
http://www.finra.org/Industry/Regulation/RuleFilings/2007/P037552

11
the desired bonds, or conversely, might try to lower prices, by selling some of
the desired bonds.”
FINRA responded to the comment as follows:
“…it is unclear how, even with this additional information, a consumer of
disseminated information will know who is behind a trade, the nature and extent
of their strategy, and the size of the total debt position being disposed of or
acquired”
Michael Lewis, an author and former bond dealer provides an illuminating
description of the information environment under which bond holders operate:
“…but in many cases the only way to determine if the price some bond trader
had given you was even close to fair was to call around and hope to find some
other bond trader making a market in that particular obscure security. The
opacity and complexity of bond market was, for big Wall Street firms a huge
advantage. The bond market customer lived in perpetual fear of what he didn’t
know. If Wall Street bond departments were increasingly the source of Wall
Street profits, it was in part because of this: In the bond market it was still
possible to make huge sums of money from the fear, and the ignorance of
customers.” (Michael Lewis, The Big Short, P. 62)
Furthermore, unless an issuer is willing to disclose its repurchase intentions to all
investors, it has to be careful not to disclose this information to any of the bondholders in order
not to violate regulation FD. The lack of information on the bondholder’s side allows firms to
take advantage of mispricing in the market to buy back their debt at a discount, relative to its
economic price, as perceived by the issuing firm’s managers.
While it may seem that repurchasing bonds in the open market is always the dominant
strategy when compared to tendering the bonds, this activity is not without costs. Though
unaware of the fact that the issuer is the counterparty to the transaction at the time of the sale,
bondholders, being sophisticated investors, are likely to realize it ex-post. In many cases when
the issuer repurchased the bond without a pre-announcement, the information about the
repurchase was disclosed in the following financial statements (firms report gains and losses
12
from extinguishment of debt in the income statement and sometimes disclose more information
in the notes11
or in conference calls12
). As bond issues are much more frequent than equity and
because of a limited pool of investors in these securities, the notion of a multi-period game is
much stronger. Investors are therefore likely to take into account “stealthy” behavior of the
issuers when pricing future issuances. This means that the benefit from the repurchase in the
open market has to be high enough to justify the potentially higher cost of issuing future bonds.
III. Literature Review
Empirical literature has focused on firms timing the market in both issuance and
repurchase of their equity securities. Seyhun (1990) provides evidence on insiders’ ability to time
share transactions and Loughran and Ritter (1994) provide evidence of timing of seasoned equity
offering, the reverse action to stock repurchases. In the context of repurchase, DeAngelo et al.
(2009) provide a list of factors that motivate managers to engage in equity repurchase.
Specifically, they mention: “correct market undervaluation and/or exploit outside investors by
buying shares when the market price of the firm’s shares is below inside-managers assessment of
intrinsic value”. Two stories emerge from these motivations; (1) signaling and (2) market timing.
Academic literature provides support for both. Vermaelen (1981), Dann (1981), Vermaelen
(1984), Ofer and Thakor (1987), and Persons (1994) provide theory and evidence consistent with
stock repurchases being signals of managers’ private information of security undervaluation.
11
For example: “During December 2008 and early 2009, we used cash on hand to repurchase $100.5 million of
principal face amount 2028 Notes in the open market at approximately 49.1% of their principal face value, plus
accrued and unpaid interest. Should market conditions continue to be advantageous to us, we intend to repurchase
additional 2028 Notes in the open market during 2009.” (Health Management Associates, 2008 10-k) 12
For example: “Yeah, sure. Happy to do so, as you mentioned given the difficult economic environment we are in
and the lack of visibility in terms of how deep the recession will go or how long it will last having more cash than
less is a paramount now. So, we are comfortable despite the lower earnings that cash receives these days, a good use
of the proceeds is sitting in cash right now, having said that we will opportunistically seek further bond repurchases
if they make sense.“ (Joseph Lovejoy, CFO of Fisher Communications, Q4, 2008 Earnings Call)

13
Ikenberry et al. (1995) provide evidence of positive abnormal returns for “value stocks” of
45.3% over the four years following repurchase announcements. Baker and Wurgler (2002)
suggest that firms’ capital structure is the result of past attempts to time the equity market. In a
survey paper by Brav et al. (2005), managers cite market timing as a major motivation for equity
repurchase. However, because all stock repurchases are pre-announced, empirically separating
between the two motivations, namely whether managers are merely acting based on the signal
they made (the repurchase announcement) in order to maintain credibility, or they are timing the
market, is a tall order. The problem of separating signaling from market timing is portrayed in
DeAngelo et al (2009):
“…theoretically investor exploitation cannot provide a viable stand-alone
explanation for the decision to buy back stock. Specifically, if managers’ only
motivation for buying back stock is to exploit outside investor by repurchasing
stock on the cheap, no investors will knowingly sell the stock to the firm because
any attempt to repurchase stock fully reveals that the offer price is too low.”
This separation is important also in light of evidence in Dittmar and Dittmar (2007) that suggests
that repurchase waves do not coincide with times of low stock valuations.
Compared with the abundance of evidence on stock repurchases, evidence on the drivers
of debt repurchase is scant and focuses mainly on tender offers. Chattergee, Dhillon and Ramirez
(1995) compile a sample of 16 tender offers and 30 exchange offers of distressed firms to
analyze the effectiveness of coercive techniques in alleviating the holdout problem. They find
that coercion is not necessarily detrimental to bondholders. They report a positive stock price and
bond price reaction to the tender announcement and suggest that for distressed firms, both bond
holders and shareholders benefit from coerced repurchases as the costs of court restructuring are
avoided. They also report that the severity of the holdout problem affects the decision of whether
to use tender offers or exchange offers. In their discussion, though not specifically referring to

14
open market repurchases, the authors point to an important difference between tender offers and
open market repurchases; the holdout problem is less likely to exist when using open market
repurchases because bondholders do not know who the buyer counterparty is and therefore the
price the buyer will have to pay in an open market repurchase is likely to be lower than in a
tender offer. Indeed, Mann and Powers (2007) document an average premium of 5.55% over
market bond prices in tender offers.
Julio (2007) compounds a sample that includes both tender offers and open market bond
repurchases and conducts a detailed investigation of the agency cost of debt overhang as a
motivation for debt repurchase. He finds that agency cost of debt overhang is an important
consideration in a firm’s decision to repurchase debt. He argues that the agency cost of debt
overhang is only one of the drivers of the decision to repurchase debt and suggests that another
potential motivation is that managers may view their firms’ bonds as underpriced and as such, a
good investment.13
Recently, Kruse Nohel and Todd (2009) documented positive stock returns around firms’
announcements of bond tender offers. The authors provide evidence suggesting that the reaction
to the announcement depends on factors such as the cost of binding protective covenants and
financial distress, the firm’s capital structure, the source of repurchase financing, and tax effects.
13
This view is also supported by anecdotal evidence provided to us in discussions with corporate finance groups at
large banks that provide corporate finance advisory services to industrial firms.

15
IV. Data and Descriptive Statistics
We base our sample of bond repurchases on the Mergent database which contains
details on issuance as well as changes in series of corporate bonds.14
The database includes
information on bond characteristics as well as changes in traded series of bonds due to maturity,
call, exchange, tender, repurchase, etc. We are interested only in the tender and open market
repurchase classifications in the database. The database contains 1,895 observations of bond
repurchases executed in the open market or via tender offer between 1998 and 2009. We first
eliminate observations of bonds repurchased due to a put option exercised by bond holders. We
also eliminate any government agency bonds as well as bonds originating in the financial
industry, which reduces our sample to 440 firms. Requiring the availability of financial data from
Compustat reduces the sample 332 observations. Specific requirements by different analyses
(e.g. gains and losses from extinguishment of debt, bond price data) reduce the sample for each
particular analysis. Data on credit spreads is taken from Federal Reserve of St Louis (FRED)
website, bond prices are taken from TRACE, VIX data is taken from CBOE, and data to calculate
the Amihud (2002) illiquidity measure is taken from CRSP. Table I summarizes the sample filter
procedures.
[Insert Table I here]
Table II reports the distribution of our sample across 2-digit SIC industries. The
number of repurchases range from 34, or 8 percent of our sample firms (Electric, gas, and
sanitary services) to 1, or 0.3 percent of the sample (13 different industries). Overall repurchases
14
We acknowledge that the Mergent database in not complete as noted in Julio (2007), however, when we compare
our statistics to those provided in Julio (2007) who manually collected data on additional repurchases, we do not
find evidence that would lead us to be concerned of a systematic bias due to sample selection issues.
16
are distributed across a fairly wide range of industries and do not reflect major clustering in
specific industries.
[Insert Table II here]
Table III, Panel A reports descriptive statistics on repurchasing firms by method of
repurchase. Statistics suggest an interesting difference between firms that repurchase bonds in
the open market and those that repurchase via tender offer: Firms that repurchase bonds in the
open market are less cash constrained. This may suggest that open market repurchasing firms
have more slack to repurchase debt. Tendering firms are generally larger than firms repurchasing
their bonds in the open market (median size of 3.6 B$ Vs 1.6 B$). The leverage of the median
tendering firm is slightly higher than that of the open market repurchase firm (43% Vs 38%).
Firms in our sample are mostly not distressed (median cash to short term debt of around 3.3 for
both open market and tender offers). Both tender offers and open market repurchase firms
experience as a group a year of relatively weak performance prior to the repurchase. The median
ROA is close to zero for both groups suggesting that on average firms that repurchase their debt
did not perform well in the year leading to the repurchase. Finally, the median firm that
repurchased its debt in the open market reports a gain from extinguishment of debt whereas the
median firm that repurchased debt via tender offers reports a loss.15
[Insert Table III here]
15
Gains and losses from extinguishment of debt are not limited to open market and tenders and include all types of
bond buybacks, such as put option exercised by the holders and call option exercised by the issuers.

17
Table III, Panel B reports descriptive statistics of repurchase characteristics. Open
market repurchases are smaller in size, both absolute (median of 130 M$ for tender offers
compared with 50 M$ for open market repurchases) and as a ratio of the repurchasing firm’s
total assets. Tender offers also retire a larger portion of the issue (median portion retired of 91%
in tender offers compared with 47% in the open market repurchases). There is no marked
difference between the two methods with respect to the initial maturity and the remaining
maturity of the repurchased debt.
V. Empirical Analysis
(a) Bond Repurchase in Times of Market Turbulence
Calomiris and Hubbard (1990) suggest that when balance sheets are initially weak, high potential
losses accentuate adverse selection problems, making lenders uncertain whether a borrower is of
a high or low credit risk. Mishkin (1997) and Mishkin and White (2002) suggest that stock
market crashes heighten informational problems arising from adverse selection and moral
hazard. Bernanke and Gertler (1989) suggest that stock market crashes that reduce net worth
accentuate moral hazard problems. As pointed out in Mishkin and White (2002):
“Uncertainty, which often accompanies a stock market crash in the form of
increased volatility of asset prices, will also make it more difficult for lenders to
screen out good from bad firms”
This statement implies that at times of market turbulence, when uncertainty makes it
harder for bondholders to distinguish good firms from bad firms, mispricing is prevalent such
that a larger portion of bond securities may be traded below the economic value. Our conjecture
is that in turbulent times, managers of good firms will want to take advantage of downward

18
mispricing to repurchase their bonds at a discount relative to their beliefs of the bonds’ value.
We therefore predict a positive association between the level of uncertainty and the likelihood of
bond repurchases in the open market as opposed to a tender offer.
To test our prediction we use two variables to capture the level of uncertainty in capital
markets: 1. The Chicago Board Options Exchange Market Volatility Index (VIX) which measures
the implied volatility of S&P 500 option index. This measure is often referred to as the fear index
or the fear gauge. 2. The credit spread between BBB rated corporate bonds and the risk free rate
(SPREAD). Duffie and Lando (2001) and Cetin et al (2004) model the term structure of credit
spreads under incomplete information and both suggest that increasing information risk and
increasing information asymmetry lead to wider credit spreads. VIX / SPREAD are measured as
the average level in the month prior to an announcement of a tender offer or the month prior to
an open market repurchase. In cases in which either the announcement date of a tender offer is
unknown or the actual date of the open market repurchase is unknown, the VIX / SPREAD used
correspond to month t-3 relative to the effective date in the database.16
Both variables are market
level measures of capital market turbulence.17
Univariate Analysis
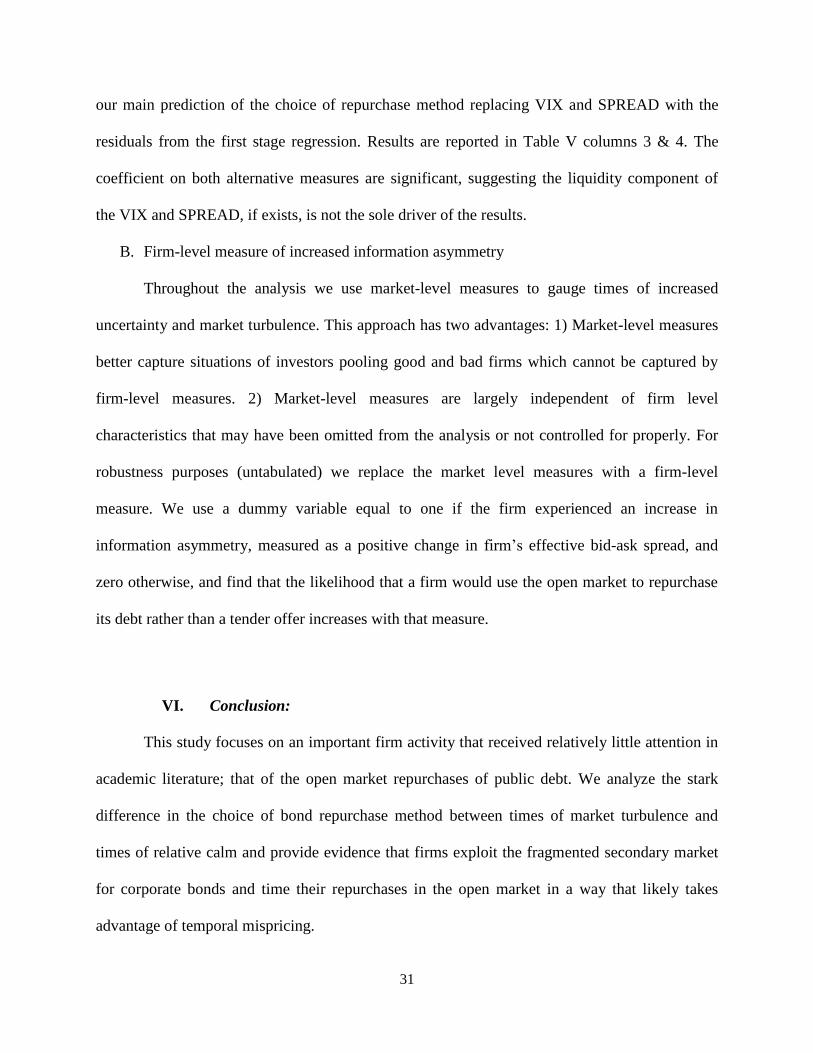
Figure I plots the number of repurchases in our sample over time as well as the percentage
of repurchases using the tender and open market methods. The graph displays a sharp increase in
16
Announcement dates of tenders are hand collected. If the date was not found we use the average of 45 days
between announcement and culmination of the deal as a benchmark and therefore use the average of the VIX / credit
spread in the month prior to these 45 days (month t-3). In the event that the specific date of the open market
repurchase is unknown, the Mergent database uses the end of the quarter as its “effective date” of repurchase. We
therefore take the last month of the previous quarter in our analysis. Using this approach eliminates the forward
looking bias that may be associated with using contemporaneous quarterly data of the variables and the decision to
repurchase. However, as a robustness test we also use the contemporaneous quarterly data. Results are robust to this
change. 17
We use market level measures for level of uncertainty of an individual firm because we do not have data and
therefore cannot control for the bond holding dispersion which is arguably a factor in the choice between a tender
offer and an open market repurchase. We do not expect this missing variable to affect our analysis as it is reasonable
to assume that holding dispersion is orthogonal to VIX and SPREAD, the market-level explanatory variables we use
in the analysis.

19
the number of bond repurchases over the years from 15 in 1998, the first year of our sample to 77
in 2009, the last year of the sample. Consistent with expectation, the time series suggests that
while generally the vast majority of debt repurchases are performed via tender offers, in years of
market turbulence, open market repurchases are more common. In years characterized by
relatively low market volatility the number of open market repurchases (49) out of total bond
buybacks (238) in our sample is 21%. In the three years of market turbulence (2002, 2003, and
2008) the fraction of open market repurchases out of total repurchases increases to 65%. The
most striking increase in the percentage of open market repurchases occurs in 2008 (70% of total
bond repurchases).
[Insert Figure I here]
Regression Analysis
Though we build on extant economic literature that suggests that increased uncertainty at
times of capital market turbulence depresses bond prices, we first validate that this maintained
premise holds true in our setting. If bonds are truly undervalued due to increased uncertainty, a
signal that resolves some of the uncertainty about the issuer’s ability to repay its debt is likely to
be more valuable than at times of lower uncertainty. Specifically, since a tender offer
announcement is a signal that reduces uncertainty, it is likely to be more valuable when
uncertainty is high than when uncertainty is low. If the value of a signal is higher in times of
heightened uncertainty, firms tendering their bonds will be required to offer a higher premium
over market price in order to repurchase their bonds making the benefits of stealthy behavior
greater.
We measure the premium offered in a tender offer (PREMi,t) as the difference between the
offer price and the mean execution price of transactions in the bond over a period of 30 days

20
before the tender announcement date deflated by the pre-announcement mean execution price
and predict a positive association between the two measures for uncertainty in capital markets
(VIX and SPREAD) and the premium offered in the tender. Results are reported in Table IV.18
Consistent with our prediction, the coefficients on VIX and SPREAD are both positive and
significant (VIX: coefficient=0.01, t-stat=6.02, SPREAD: coefficient=0.04, t-stat=4.25). Results
suggest that at times of market turbulence bond prices are depressed due to increased
uncertainty, such that a positive signal on issuers’ ability to pay the debt results in a larger
revision to the presiding price which forces issuers tendering their bonds to offer a higher
premium over the market price. In other words, the cost of a tender offer, in terms of premium
over the market price, is higher in times of market turbulence than it is at times of low volatility
in asset prices.19
[Insert Table IV here]
Next we analyze the relation between uncertainty in capital markets and the choice of
repurchase method. We develop the following model to test our prediction above:
(1) OMRi,t= α + β1ACTIONSIZEi,t + β2PCT_SERIESi,t + β3CASHi,t-1 + β4OCFi,t-1 +
β5OCFi,t +β6LNTAi,t-1 + β7ROAi,t-1 + β8LEVi,t-1 + β9INC_LEVi,t-1 + β10 VIX t-1/SPREADt-1+εi,t
18
We include all the control variables of the main model of the repurchase method choice in the analysis of the
premium as these factors that affect the method choice may also affect the premium an issuer is willing to offer in a
tender. 19
The number of observations in this analysis includes only tender offers and is reduced due to data availability on
bond prices. Due to data availability we begin this analysis in year 2004.

21
The dependent variable, OMRi,t, is an indicator variable equal to 1 if the bonds were
repurchased in the open market and 0 if they were repurchased using a tender offer. The model is
estimated using a logistic regression and we predict a positive association between the
explanatory variables and the likelihood of repurchase in the open market. The first nine RHS
variables represent control variables and are included in the model to capture factors that may
affect the choice between a tender offer and an open market repurchase of bonds. Holding
differences in the expected costs (i.e. execution price) of the repurchase methods constant,
issuers will generally prefer a tender offer when they are interested in retiring the whole series or
a large portion of it, when they want to eliminate covenants of the series and for that purpose
want to use coercive techniques, and when bond holders are dispersed and finding and
negotiating with them may be costly. Since tender offers require a cash commitment and are
frequently larger in size than open market repurchases, availability of cash may also play a role.
We therefore include the following control variables: ACTIONSIZEi,t: repurchase size, measured
as the ratio of the repurchase amount to the firm’s total assets. If the issuer wishes to repurchase
relatively large amounts of debt, the efficient to do that will be through a tender offer. Hence, we
predict β1 to be negatively associated with the choice to repurchase debt in the open market.
PCT_SERIESi,t is the percentage of the outstanding series repurchased. Open market repurchases
involve a one on one negotiation with each of the bond holders making it more complicated to
repurchase complete series of bonds. Issuers that want to repurchase a large percentage of the
series will prefer a tender offer. We therefore expect β2 to be negative. CASHi,t-1 (the ratio of cash
to total assets (Compustat che/at)), OCFi,t-1 (operating cash flow in the year prior the repurchase
(Compustat oancf/at)), and OCFi,t (operating cash flow in the year of the repurchase) are three
variables that control for the repurchasing firm’s availability of cash. We do not have directional
22
predictions for these variables. On the one hand, the higher levels of cash required for tender
offers suggests a prediction of negative coefficients. On the other hand, if a motivation of the
repurchase in the open market is to exploit market conditions that depress bond prices of good
firms, coefficients may be positive or not play a role in the choice at all.
Though our sample includes only firms that had made the decision to repurchase debt, we
also add to the regression factors identified in prior literature to affect a firm’s decision to
repurchase debt in order to account for the possibility that the decision to repurchase debt is
correlated with the method of repurchase. LNTAi,t-1, the natural logarithm of total assets
(Compustat at), controls for any firm size effect on the choice. ROAi,t-1 (return on assets) controls
for firm performance in the year leading to the repurchase. LEVi,t-1 is firm leverage measured as
total debt to total asset (Compustat (dlc+dltt)/at). The more highly levered the firm, the higher
the likelihood of being closer to a violation of restrictive covenant and therefore, the higher the
likelihood that the issuer would like to repurchase bonds to de-lever. INC_LEVi,t-1 is a dummy
variable equal to 1 if the issuer’s leverage increased in the year prior to the repurchase, and zero
otherwise. An increase in leverage may bring firms closer to violating their covenants and
therefore drive firms to repurchase debt. We expect these factors to primarily affect the decision
to repurchase debt and not to influence the choice of repurchase; therefore we do not have
directional prediction on their effect on the choice of repurchase method. All estimations are run
using year dummies and 2-digit SIC codes industry fixed effects.
Table V reports results of the choice analysis. Columns 1 and 2 present results of the
uncertainty proxies, VIX and SPREAD respectively. Coefficients on our control variables are
generally in line with expectations. When issuers retire a large portion of the series they will tend
to choose a tender offer over an open market repurchase. Consistent with descriptive evidence,
23
tendering firms tend to be larger in size. Consistent with our prediction, both VIX and SPREAD
coefficients are positive and significant at the 1% level (VIX: coefficient=0.09, z-stat=2.71,
SPREAD: coefficient=0.61, z-stat=2.53). These results are economically significant. One
standard deviation in the VIX (SPREAD) measure is equivalent to a 15% (20%) change in the
likelihood that the firm would repurchase the bond in the open market and not via a tender offer.
[Insert Table V here]
Next, we test whether open market repurchases are more common than tender offers at
times of market turbulence. We run a time series regression using the 48 quarters from 1998 to
2009 in which our dependent variable is the ratio of open market repurchases to total number of
bond repurchases and the explanatory variable is either VIX or SPREAD20
. Results are reported
in Table VI. Consistent with our prediction, we find a statistically significant positive association
between both VIX and SPREAD and the proportion of bond repurchases that are executed in the
open market (VIX: coefficient=0.018, t-stat=4.81, SPREAD: coefficient=0.123, t-stat=3.37).
These results suggest that in periods of stock market turbulence the balance between the two
repurchase methods shifts from tender offers towards open market repurchases.
[Insert Table VI here]
Taken together, the above evidence is consistent with the notion that at times of
heightened market uncertainty, firms motivated by market timing tend to prefer to repurchase
their debt in the open market, taking advantage of potential mispricing.21
20
For this specification we use the contemporaneous quarterly average of the VIX / SPREAD. 21
It may be argued that an alternative explanation to these results is that uncertainty drives firms to be more
reluctant to use tender offers because the firm has to commit to a cash outlay, whereas when purchasing debt in the
open market the firm retains the flexibility to stop at any time. Although we cannot rule out the later as the sole

24
(b) Effects of the Choice of Bond Repurchase Method:
Returns Analysis:
If indeed the ability to exploit superior information to time the market is the motivation for
repurchasing bonds in the open market as opposed to tendering for the bonds, we should observe
higher long term returns on bonds repurchased in the open market than on bonds repurchased via
tender offers. Consistent with that notion we predict a positive association between the use of
open market repurchase and the ex-post bond return. We use the following model to test our
prediction:
(2) ANNUAL_BOND_RETURNi=α + β1OMRi + β2FIRM_RATINGi + εi
Where ANNUAL_BOND_RETURNi reflects the one year ex-post return on bonds for the
firm repurchasing debt. We follow Bessembinder et al. (2009) and calculate actual 1-year
forward returns of the repurchased bonds or, if the entire series was repurchased, the median of
the repurchasing firm’s traded bonds’ return in the period. We control for the credit rating of the
firm by incorporating FIRM_RATINGi, a variable reflecting the long term S&P rating of the
firm. This control variable is important as riskier bonds will yield higher returns (given survival
of the firm). We follow Sharpe and Nguyen (1995) and construct the credit rating variable by
assigning each of the observations a number between 1-5 where 1 corresponds to the highest
rating and 5 corresponds to unrated firms.22
OMRi is our explanatory variable - a dummy
explanation for the choice of the open market method, this is unlikely given: 1) that tender offer firms hold less cash
than open market repurchases firms, 2) our analysis of the insider trade activity below, and 3) the fact that our
results hold when we exclude year 2008 from the analysis.
22Sharpe & Nguyen (1995) use individual dummy variables for each group. We pool the dummy variables into one
credit rating variable. Our results are robust to individual groupings as well.

25
variable equal to one for an open market repurchase, and zero for a tender offer. We also include
year and industry fixed effects to control for time variation and industry effects.
Panel C of Table III reports descriptive statistics of the returns in our sample. Overall,
returns data is available for 150 firms of which 93 are tender offers and the remaining 57 are
open market repurchases. Both mean and median of open market repurchase bonds’ returns are
higher than of tendering firms bonds’ returns. Regression analysis, reported in Table VII,
provides consistent evidence. After controlling for the firm’s rating year and industry fixed
effects, bonds of firms using the open market repurchase method yield on average 18% higher
returns than bonds of firms using the tender offers.
[Insert Table VII here]
Gains and Losses from Extinguishment of Debt:
Debt repurchases directly affect issuers’ reported earnings through “gains and losses from
extinguishment of debt”. When firms repurchase their own debt they record a gain (loss) from
extinguishment of debt if the carrying value of the debt is higher (lower) than the repurchase
price. It is not ex-ante clear whether open market repurchases would result in larger gains than
tender offers. On the one hand tender offers are much larger in scale, extinguishing a larger
portion of the series of bonds (annual median size of 178 M$ for tender offers compared with 67
M$ for open market repurchase). On the other hand, tenders are usually offered at a premium
over the presiding market price. A positive association between open market repurchases and
income statement gains relative to tender offers, however, would suggest that open market
repurchases result in higher reported income than tender offers. We estimate the following model
in order to test the impact of the choice of bond repurchase method on issuers’ income statement:

26
(3) GAINi,t=α+β1LNTAi,t-1+β2LEVi,t-1+β3ROAi,t-1+β4OMRi,t+εi,t
Where GAINi,t is extraordinary gains/losses from extinguishment of debt deflated by total
assets (Compustat dtep/at).23
We control for factors that are likely to affect the gains / losses
from extinguishment of debt. LNTAi,t-1 - larger firms tend to have more outstanding debt than
smaller firms making them more likely to repurchase debt and to recognize gains or losses.
LEVi,t-1 - highly levered firms are more likely to engage in repurchase activities and generate
gains or losses. ROAi,t-1 - controls for issuers’ performance a year before the repurchase. Firms’
accounting based performance may affect their need to repurchase debt as it affects the
likelihood of the firm violating covenants used in debt contracts. The explanatory variable,
OMRi,t, is a dummy variable equal to one for an open market repurchase, and zero for a tender
offer. If open market repurchases result in higher gains from extinguishment of debt we expect β4
to be positive and significant. In two additional specifications we add ACTIONSIZE and an
interaction of ACTIONSIZE and OMR as explanatory variables.
Table VIII reports results of the three alternative OLS specifications analyzing the gains
and losses from extinguishment of debt. In Column 1 we report coefficients of the baseline
regression that does not control for the size of the repurchase. In column 2 we add the size of the
repurchase as a control variable and in column 3 we add an interaction between the method of
repurchase and its size. In all regressions the dependent variable is the income statement
gains/losses from extinguishment of debt. Consistent with our expectation, β4 is positive and
significant (coefficient=0.02, t-stat=3.17), suggesting a positive association between the choice
to repurchase debt in the open market versus via tender offer and gains from extinguishment of
23
Gains and losses from extinguishment of debt (Compustat dtep) includes all gains and losses from firms buying
back their debt and therefore it is a noisy measure for gains and losses from open market or tender offer. This noise,
however, has the effect of attenuating our results.

27
debt in the income statement. Thus, from an income statement perspective, when compared with
tender offers, open market repurchases increase the firm’s net income. Furthermore, columns 2
and 3 report that after the inclusion of the repurchase size, the association between the choice to
repurchase in the open market and the gains from extinguishment of debt remains positive and
significant at 1 percent level, suggesting that transactions of bond repurchase in the open market
are executed at a larger discount relative to their book value than tender transactions.
[Insert Table VIII here]
Abnormal Insider Buys:
Insider trading has been associated in the literature with insiders taking advantage of their
superior knowledge about the firm to generate personal gains. Piotroski and Roulstone (2005)
suggest that insider trade is based on superior knowledge of future cash flows and security
misevaluation, while Beneish and Vargus (2002) provide evidence consistent with insider trade
based on superior knowledge as to the earnings quality and valuation implications of accruals.
Rozeff and Zaman (1998) provide evidence suggesting that insider trading increases at times of
market overreaction.
In the context of our study, if issuers time the market by repurchasing debt in the open
market, and they are willing to sacrifice cash on hand to do so, it suggests that insiders believe
that the company’s debt at current market price constitutes an investment with expected returns
higher than the current expected returns implied by the company’s stock price. Therefore, they
would be actively buying the firm’s stock. Since tender offers of the firm’s public debt could
signal positive information about the firm, insider trades may also increase before bond tender
announcement. However, as tender offers are offered at a premium over the market price, and

28
because we expect opportunism to occur when expected returns are high given the costs
associated with bond repurchase, we also expect insider trading to be more pronounced during
open market repurchases.
To test our prediction we follow Core et al. (2006) and test the following model:
(4) INSIDERi,q=α + β1LNTAi,q-1 + β2INSIDERi,q-1 + β3Q1 + β4Q2 + β5Q3 + β6OPENi,q+
β7TENDERi,q +εi,q
Where INSIDERi,q is the ratio of insider buys to total insider trades in quarter q [Buyi,q /
(Buyi,q+Selli,q)] and Buyi,q(Selli,q) is the number of shares purchased (sold) by the top five
executives of firm i during calendar quarter q. LNTAi,q-1 is the natural logarithm of total assets.
OPENi,q is a dummy variable equal to one if the firm repurchased debt in the open market in
quarter q, and zero otherwise. TENDERi,q is a dummy variable equal to one if the firm announced
a tender to repurchase debt in quarter q, and zero otherwise. We predict the coefficients on both
OPENi,q and TENDERi,q to be positive and that the OPENi,q coefficient will be significantly
larger than the TENDERi,q. coefficient. We also include year / quarter dummy variables to
address seasonality in insider trading behavior24
and industry fixed effects25
.
Table IX reports results of the insider trading analysis. Column 1 reports the coefficients
of a regression estimated using a sample that includes only firms that repurchased debt, column 2
reports results of a regression estimated using all firms that report insider trading activity.
Results are qualitatively similar. Consistent with Core et al (2006) we find that insider trading in
quarter q is positively associated with insider trading in quarter q-1 and negatively associated
24
Core et al. (2006) use fiscal year and quarters. We use Calendar year and quarters in order to capture effects of
external shocks such as the financial crisis. 25
As a robustness test we also include the explanatory variables (OPEN and TENDER) in period t+1 to test whether
any of the insider trades are initiated in anticipation of the repurchase a few months prior to the actual event. Results
are insignificant and do not change the qualitative results presented of the explanatory variables in table IX.

29
with size. Consistent with our expectation, the coefficients on both open market repurchases and
tender repurchases are positive and statistically significant (tenders with a coefficient=0.12, t-
stat=2.83 and OMR with coefficient=0.36, t-stat=7.46) suggesting that periods of open market
bond repurchase and periods prior to tender announcements are often accompanied by insiders
trading on their private information by buying the company’s stock. Interestingly, the coefficient
on open market repurchase is almost three times as large as that of tender offers, with the
difference between the two coefficients significant at the 1% level, suggesting that open market
repurchases are more beneficial to shareholders and likely transfer more wealth from
bondholders to shareholders. In an untabulated analysis we also include in the regression the
average quarterly VIX to rule out the possibility suggested in Rozeff and Zaman (1998) that the
abnormal insider trade is a result of market overreaction which is likely to occur in times of
turbulence. Consistent with Rozeff and Zaman (1998) the coefficient on the VIX is positive and
significant, however results for the open market repurchase and tender periods are qualitatively
intact.
[Insert Table IX here]
(C) Robustness Tests and Additional Issues:
A. Liquidity Shock as an Alternative Explanation
Year 2008 is unique in almost every economic aspect. The magnitude of the financial
crisis had not been seen since the great depression. For the purpose of our study, 2008 may have
significant influence on the results as the capital market crisis was accentuated by a liquidity
shock. Liquidity could potentially offer an alternative explanation to the information hypothesis
developed in this study. One of the drivers of choosing the tender offer to repurchase bonds over
the open market is that when bond holders are dispersed it may be difficult and costly for issuers

30
to identify them and negotiate with each of them separately. A liquidity shock turns the market
into a “buyers’ market” where bond holders, seeking to sell portfolios, look for a willing buyer
and execute the transaction in the open market. Because both VIX and SPREAD spiked in 2008,
it could be argued that they may be capturing an increased liquidity constraint, and not increased
uncertainty.
However, illiquidity as an alternative explanation is not consistent with results in Table
IV that suggest a positive correlation association between VIX and SPREAD and the premium
offered in tenders. Absent asymmetric information, tenders are actually easier to complete at
times of low liquidity when bondholders searching for liquidity become more willing sellers.
Therefore, in times of illiquidity issuers are less likely to face the holdout problem and can offer
lower premiums in tender offer. Thus, if our explanatory variables (VIX and SPREAD) do
capture a liquidity constraint and not information asymmetry, the relation between them and the
premium offered in a tender offer should be negative and not positive as presented in Table IV.
Nevertheless, we perform two additional sensitivity analyses in order to rule out
illiquidity as the sole explanation of the results: First, we repeat all our analyses excluding
calendar year 2008 observations. All our results and inferences are qualitatively intact. Second,
we follow Amihud (2002) and construct an average market illiquidity measure using daily stock
returns and trading volume data. We use a two stage estimation method to ensure that the
measures used in this study to capture uncertainty (VIX and SPREAD) do not in fact capture
illiquidity. In the first stage, we use a time-series regression, regress each of the variables VIX
and SPREAD on the Amihud illiquidity measure, and compute the residuals from these
regressions. These residuals are orthogonal to illiquidity and represent the information
component of the VIX and SPREAD. In the second stage we re-estimate regression (1) to test
31
our main prediction of the choice of repurchase method replacing VIX and SPREAD with the
residuals from the first stage regression. Results are reported in Table V columns 3 & 4. The
coefficient on both alternative measures are significant, suggesting the liquidity component of
the VIX and SPREAD, if exists, is not the sole driver of the results.
B. Firm-level measure of increased information asymmetry
Throughout the analysis we use market-level measures to gauge times of increased
uncertainty and market turbulence. This approach has two advantages: 1) Market-level measures
better capture situations of investors pooling good and bad firms which cannot be captured by
firm-level measures. 2) Market-level measures are largely independent of firm level
characteristics that may have been omitted from the analysis or not controlled for properly. For
robustness purposes (untabulated) we replace the market level measures with a firm-level
measure. We use a dummy variable equal to one if the firm experienced an increase in
information asymmetry, measured as a positive change in firm’s effective bid-ask spread, and
zero otherwise, and find that the likelihood that a firm would use the open market to repurchase
its debt rather than a tender offer increases with that measure.
VI. Conclusion:
This study focuses on an important firm activity that received relatively little attention in
academic literature; that of the open market repurchases of public debt. We analyze the stark
difference in the choice of bond repurchase method between times of market turbulence and
times of relative calm and provide evidence that firms exploit the fragmented secondary market
for corporate bonds and time their repurchases in the open market in a way that likely takes
advantage of temporal mispricing.

32
First, we provide evidence that as costs of tender offers increase at times of heightened
market uncertainty, issuers are more likely to repurchase their debt in the open market than
through a more transparent tender offer. Second, we document that returns on bonds repurchased
in the open market are higher than returns on bonds repurchased via tender offers and that open
market repurchases result in higher accounting profits. Finally, we provide evidence that insiders
take advantage of their private information by showing an abnormal volume of insider buys at
times of open market repurchases.
The evidence in this study may have implications to enforcement agencies as it
suggests that firms may use bond market imperfections to take advantage of inside information,
exacerbated by uncertainty across capital markets. In these cases it may be argued that firms’
intention to repurchase bonds in the open market is, in and of itself, material information that
warrants disclosure ex-ante.

33
References
Amihud, Y., 2002. Illiquidity and Stock Returns: Cross Section and Time Series Effects. Journal
of Financial Markets 5: 31-56.
Aneiro, M., 2009, Debt buybacks garner a tax incentive, Wall Street Journal, March 12.
Baker, M., and J. Wurgler, 2002. Market timing and capital structure. The Journal of finance 57:
1-32.
Beneish, M.D., and M.E. Vargus, 2002, Insider trading earnings quality and accrual mispricing,
The Accounting Review 77: 755-791.
Bernanke B., and M. Gertler. 1989. Agency Costs, Net Worth and Business Fluctuations, The
American Economic Review 79: 14-31.
Bessembinder, H., K.M. Kahle, W.F. Maxwell, and D. Xu. 2009. Measuring Abnormal Bond
Performance, The Review of Financial Studies 22 (10): 4219-4258.
Brav, A., J. R. Graham, C. R. Harvey, and R. Michaely. 2005. Payout in the 21st century, Journal
of Financial Economics 77: 483-527.
Bushman, R., A. Le, and F. Vasvari. 2010. Implied bond liquidity. Working paper, The
university of North Carolina and London Business School.
Calomiris, C.W., and R.G. Hubbard, 1990, Firm heterogeneity, internal finance, and credit
rationing, The Economic Journal 100: 90-104.
Cetin, U., R. Jarrow, P. Protter, and Y. Yildirim. 2004. Modeling credit risk with partial
information. The Annals of Applied Probability 14: 1167-1178.
Chattarjee, S., U.S. Dhillon, and G.G. Ramirez, 1995, coercive tender and exchange offers in
distressed high yield debt restructurings. An empirical analysis, Journal of Financial
Economics 38:113-138.

34
Coffee, S., and W. Klein, 1991, Bondholders coercion: the problem of constrained choice in debt
tender offers and recapitalizations, University of Chicago Law Review 58: 1207-1273.
Comment, R. and G.A. Jarrell, 1991, The relative signaling power of Dutch-auction and fixed
price tender offers and open-market share repurchases, Journal of Finance 46: 1243-1271.
Core, J.E., W.R. Guay, S.A. Richardson, and R.S. Verdi, 2006, Stock Market Anomalies: What
Can We Learn From Repurchases and Insider Trading? Review of Financial Studies 11:
49-70.
Dann, L.Y., 1981, common stock repurchases: An analysis of returns to bondholders and
stockholders, Journal of Financial Economics 9:113-138.
DeAngelo, H., L. DeAngelo, and D. Skinner, 2009. Corporate Payout Policy. Foundation and
Trends in Finance (3) 95-287.
Dittmar, A., and R., Dittmar. 2007. The timing of stock repurchases. Working paper, University
of Michigan.
Duffie, D., D. Lando. 2001. The term structure of credit spreads with incomplete accounting
information. Econometrica 69: 633-664.
Ikenberry, D., J. Lakonishok, and T. Vermaelen, 1995. Market underreaction to open market
share repurchases. Journal of Financial Economics 39: 181-208.
Julio, B.R., 2007, Overcoming overhang: Agency costs, investment and the option to repurchase
debt. Working paper London Business School.
Kruse, T., T. Nohel and S.K. Todd, 2009. The decision to repurchase debt. Working paper,
Loyola University.
Lewis, M., 2010, The big short. W.W.Norton & Company Publishers.

35
Li, K. and W. McNally, 2004, Open market versus tender offer repurchase: A conditional event
study. Working paper, University of British Columbia.
Mann, S.V, and E.A. Powers, 2007, Determinants of bond tender premiums and percentage
tendered, Journal of Banking and Finance 31: 547-566.
Mishkin, F.S., 1997, The Causes and Propagation of Financial Instability: Lessons for
Policymakers, Maintaining Financial Stability in a Global Economy (Federal Reserve
Bank of Kansas City, Kansas City, MO.): 55-96.
Mishkin, F.S., and E.N. White, 2002, U.S. stock market crashes and their aftermath: Implications
for monetary policy, NBER working paper.
Monks, M., 2008, Borrowers itch to re-coup loans, Financial Week, November 16.
Ofer, A. and A. Thakor, 1987, A theory of stock price responses to alternative corporate cash
disbursement methods: Stock repurchases and dividends, Journal of Finance 42: 365-394.
Persons, J.C., 1994, Signaling and takeover deterrence with stock repurchases: Dutch auctions
versus fixed price tender offers, Journal of Finance 49:1373-1402.
Piotroski, J.D., and D. Roulstone, 2005, Do insider trades reflect both contrarian beliefs and
superior knowledge about future cash flow realizations? Journal of Accounting and
Economics 39: 55-81.
Rozeff, M.S., and M.A. Zaman, 1998, Insider trading: Evidence from growth and value
portfolios, Journal of Finance 53: 701-716.
Sharpe, S.A., and H.H. Nguyen, 1995, Capital Market Imperfections and the Incentive to Lease,
Journal of Financial Economics 39: 271-294.
Vermaelen, T., 1981, Common stock repurchases and market signaling: An empirical study,
Journal of Financial Economics 9: 313-333.

36
Vermaelen, T., 1984, Repurchase tender offers, signaling and managerial incentives, Journal of
Financial and Quantitative Analysis 19, 163-181.

37
Appendix: Variable definitions
All relevant variables are winsorized at 1% extreme observations.
Variable Definition
GAIN Gain/loss from extinguishment of debt (Compustat dtep) deflated by total
assets (Compustat at)
OMR A dummy variable equal to one if the bond repurchase was executed in the
open market, zero if using a tender offer.
PREM Premium over the presiding market price offered by the tendering firm.
Measured as the difference between the offer price and the mean execution
price of transactions in the bond over a period of 30 days before the tender
announcement date deflated by the pre-announcement mean execution
price.
INSIDER The ratio of insider buys to the total insider trades in quarter q [Buyq /
(Buyq+Sellq)] where Buyq(Sellq) is the number of shares purchased (sold)
by the top five executives of each firm during calendar quarter q.
LNTA The natural logarithm of total assets (Compustat at).
ROA Issuers’ return on asset. Compustat (oibdp/(att+ att-1)/2).
LEV Leverage measured as total debt to total asset (Compustat (dlc+dltt)/at).
INC_LEV A dummy variable equal to 1 if the issuer leverage increased in the year
prior to the repurchase, and zero otherwise.
ACTIONSIZE The ratio of the repurchase amount to the firm’s total assets.
CASH The ratio of cash to total assets (Compustat che/at)
OCF Operating cash flow (Compustat oancf/at).
PCT_SERIES The percentage of the series repurchased.
VIX The Chicago Board Options Exchange Market Volatility Index that
measures the implied volatility of S&P 500 option index. We use two
specifications: monthly average and quarterly average.
SPREAD The credit spread between BBB rated bond and risk free rate. We use two
specifications: monthly average and quarterly average.
OPEN A dummy variable equal to one if the firms repurchased debt in the open
market in quarter q, and zero otherwise.
TENDER A dummy variable equal to one if the firm announced a tender to
repurchase debt in quarter q, and zero otherwise.

38
ILLIQ A time series variable of stock market illiquidity following Amihud
(2002). This measure is constructed as follows: for each stock we calculate
the daily illiquidity measure as absolute return / volume of trade. We then
average daily illiquidity for each stock over the quarter. We discard
observations with insufficient trading days, price lower than 5 at the end of
the previous quarter, no market cap data and 1 percent outliers. We then
average the individual stock illiquidity measure of each quarter to calculate
the average market illiquidity measure.
VIX_ILLIQ_RESID Residuals of a time-series regression with VIX as the dependent variable
and ILLIQ as the explanatory variable over the sample period
SPREAD_ILLIQ_RESID Residuals of a time-series regression with SPREAD as the dependent
variable and ILLIQ as the explanatory variable over the sample period
FIRM_RATING Groups the firm’s long term S&P credit rating into 5 groups. Receives the
value 1 for firms rated between AAA and AA-, 2 for firms rated between
A+ and A-, 3 for firms rated between BBB+ and BBB-, 4 for firms rated
between BB+ and D, and 5 for unrated firms.
ANNUAL_BOND_RETURN One year ex-post bond return calculated following Bessembinder et al.
(2008). Return is calculated using trading data for repurchased bonds or, if
entire series was repurchased, median of the firm’s return on traded bonds
over the year following the repurchase. The return is calculated using the
following formula:
Bond Return = ((Pt-Pt-1)+AI)/Pt-1 where AI is the accrued interest (stated
coupon in our case).

39
Figure I: Bond Repurchase Activity: by Type and Calendar Year
This figure plots the number of bond repurchases by calendar year (solid line) from 1998 – 2009. The two
dotted lines represent the percentage of open market repurchases and tender offers from total repurchases
in each calendar year.
0%
10%
20%
30%
40%
50%
60%
70%
80%
90%
100%
0
10
20
30
40
50
60
70
80
90
1998 1999 2000 2001 2002 2003 2004 2005 2006 2007 2008 2009
total % open market % tender

40
Table I: Sample filter procedure (1998 – 2009)
Mergent Database Tender (T) & Issue Repurchased (OMR) 1,895
Financial Firms (SIC 6000-SIC 6999) (588)
Government Bonds (37)
No CUSIP match (649)
Put Options Exercised (hand collected) (47)
Multiple actions per effective dates (134)
# Observations 440
Availability of COMPUSTAT Financial data 108
Final Sample* 332
* Each of our regressions contains a subset of these observations, depending on availability of data.
Table II - Sample distribution across Industries and by method of repurchase
Industry acronym Number of
Open
Market
Percentage
of Sample
Number
of
Tenders
Percentage
of Sample
Total Percentage
of Sample
Coal Mining 1 0.003 1 0.003
Oil and Gas Extraction 6 0.018 6 0.018 12 0.036
General Building Contractors 2 0.006 3 0.009 5 0.015
Special Trade Contractors 1 0.003 1 0.003
Food and Kindred Products 5 0.015 5 0.015
Tobacco Products 1 0.003 1 0.003
Textile Mill Products 1 0.003 1 0.003
Apparel and other Textile Products 1 0.003 1 0.003
Furniture and Fixtures 1 0.003 1 0.003
Paper and Allied Products 1 0.003 7 0.021 8 0.024
Printing and Furnishing 1 0.003 4 0.012 5 0.015
Chemicals and Allied Products 7 0.021 16 0.048 23 0.069
Petroleum and Coal Products 2 0.006 2 0.006 4 0.012
Rubber and Misc. Plastics Products 1 0.003 1 0.003
Leather and Leather Products 1 0.003 1 0.003

41
Primary Metal Industries 4 0.012 4 0.012
Fabricated Metal Products 4 0.012 4 0.012
Industrial Machinery and Equipment 9 0.027 9 0.027 18 0.054
Electrical and Electric Equipment 13 0.039 9 0.027 22 0.066
Transportation Equipment 3 0.009 8 0.024 11 0.033
Instruments and Related Products 10 0.030 6 0.018 16 0.048
Misc. Manufacturing industries 1 0.003 1 0.003
Railroad Transportation 3 0.009 3 0.009
Local and Interurban Passenger
Transit 1 0.003 1 0.003
Water Transportation 2 0.006 2 0.006
Transportation by Air 4 0.012 4 0.012
Communications 9 0.027 23 0.069 32 0.096
Electric, Gas, and Sanitary Services 6 0.018 28 0.084 34 0.102
Wholesale Trade – Durable Goods 3 0.009 6 0.018 9 0.027
Wholesale Trade – Nondurable
Goods
2 0.006 8 0.024 10 0.030
General Merchandise Store 3 0.009 4 0.012 7 0.021
Food Stores 1 0.003 2 0.006 3 0.009
Automotive Dealers and Service
Stations
3 0.009 0.000 3 0.009
Furniture and Home Furnishing
Stores
1 0.003 2 0.006 3 0.009
Eating and Drinking Places 3 0.009 3 0.009
Miscellaneous Retail 2 0.006 2 0.006
Hotels and Other Lodging Places 3 0.009 4 0.012 7 0.021
Personal Services 1 0.003 2 0.006 3 0.009
Business services 12 0.036 11 0.033 23 0.069
Auto Repair Services, and Parking 1 0.003 1 0.003
Motion Pictures 3 0.009 3 0.009
Amusement and Recreation Services 1 0.003 7 0.021 8 0.024
Health Services 5 0.015 10 0.030 15 0.045
Engineering and Management
Services
4 0.012 3 0.009 7 0.021
Non-classifiable Establishments 2 0.006 1 0.003 3 0.009
Total 110 33.1 222 66.9 332 100

42
Table III: Descriptive statistics
Panel A – Firm characteristics by repurchase type
Open Market Repurchase Tender
# obs Mean Median # obs Mean Median
Lag Cash / TA 110 0.14 0.09 206 0.08 0.05
Lag Assets (mil) 110 4,183 1,626 209 10,570 3,675
Lag ROA 110 -0.006 0.001 209 -0.001 0.004
Lag Total Debt / TA 110 0.44 0.38 208 0.47 0.43
Lag cash / STD 88 669.20 3.32 196 47.03 2.31
Lag Cash / TD 110 0.57 0.23 204 0.24 0.10
Gain/ Loss from
extinguishment of Debt / TA 84 0.012 0.001 131 -0.008 -0.002
Panel B – Issue characteristics
Open Market Repurchase Tender
Mean Median Mean Median
Repurchase Amount (thous.) 141,481 50,000 197,645 130,000
Proportion of Outstanding Amount Retired 0.56 0.47 0.72 0.91
Initial Maturity (years) 13.9 10.0 14.0 10.0
Remaining Maturity (years) 10.5 7.1 8.8 5.7
Yearly Repurchase Amount (thous.) 157,713 66,750 274,960 178,482
Yearly Repurchase Amount / TA 8.86% 4.16% 10.88% 4.82%
Premium offered over market price 0.66% 3.53%
Panel C – Firm Annual Bond Returns26
All Open Market
Repurchase
Tender
Number of observations 150 57 93
Mean Return 19.2% 35.4% 9.3%
Median Return 9.7% 25.3% 7.0%
26
The data is based on the 266 observations used in the choice model. Loss of observations in the raw return column
is due to the following reasons: 44 are repurchases executed before 2002 (first year of trace); for 61 of the
observations no bond trades were found in the event window; for 10 of the observations, TRACE data could not be
found; 1 extreme observation of 1300% return is deleted from the analysis (open market repurchase observation).

43
Table IV: OLS Regression - Tender Premium
This table reports the estimation results of the premium OLS regression (regression 1).
PREMIUMi=α + β1LNTAi,t-1 + β2ROAi,t-1 + β3LEVi,t-1 + β4INC_LEVi,t-1 + β5ACTIONSIZEi + β6CASHi,t-1 +
β7OCFi,t-1 + β8OCFi,t + β9PCT_SERIESi + β10EXPLANATORYt+εi,t
The dependent variable is the premium over market price offered in a tender offer and the
explanatory variable is either the VIX or the SPREAD monthly average for the last month
information is known to managers when making the decision to repurchase debt. Control variables
are defined in the appendix. Year and industry fixed effects are included. T-statistics are reported in
parentheses below the coefficient estimates. ***, **, * indicate significance at 1%, 5%, or 10% level
respectively, two-tailed tests.
Independent Variables Expected Sign (1) (2) ACTIONSIZE ? 0.18 0.20
(0.73) (0.74)
CASH ? -0.04 -0.09
(-0.21) (-0.42)
OCFt-1 ? -0.05 0.02
(-0.23) (0.06)
OCFt ? 0.21 0.16
(0.95) (0.62)
PCT_SERIES ? -0.09 -0.12*
(-1.61) (-1.81)
LNTA ? 0.02 0.02
(1.37) (1.01)
ROA ? -1.29** -1.41**
(-2.65) (-2.55)
LEV ? 0.03 0.05
(0.39) (0.63)
CHA_LEV ? 0.00 0.01
(0.01) (0.37)
VIX + 0.01***
(6.02)
SPREAD + 0.04***
(4.25)
Constant ? -0.29* -0.17
(-1.91) (-1.03)
Adj R2 0.50 0.36
Num Obs 92 92

44
Table V: Logit Estimation - The choice between tender / open market repurchase
This table reports the estimation results of choice Logit regression (regression 1).
OMRi=α + β1LNTAi,t-1 + β2ROAi,t-1 + β3LEVi,t-1 + β4INC_LEVi,t-1 + β5ACTIONSIZEi + β6CASHi,t-1 +
β7OCFi,t-1 + β8OCFi,t + β9PCT_SERIESi + β10EXPLANATORYt+εi,t
The dependent variable is a dummy variable equal to 1 if the firm used the open market to repurchase
the bonds and zero if it used a tender offer. The explanatory variables in columns 1 and 2 are VIX
and SPREAD. Columns 3 and 4 report results of the illiquidity analysis using the orthogonal
residuals of regressions of VIX and SPREAD on the Amihud illiquidity measure. Control variables
are defined in the appendix. Z-statistics are reported in parentheses below the coefficient estimates.
***, **, * indicate significance at 1%, 5%, or 10% level respectively, two-tailed tests. Regression is
run using industry fixed effects and year dummies. Loss of observations occurs because of all
positive / negative outcomes within specific groups.
Independent Variables
Expected
Sign 1 2
3
4
ACTIONSIZE - -1.25 -1.23 -1.33 -1.21
(-0.7) (-0.69) (-0.75) (-0.68)
PCT_SERIES - -3.78*** -3.82*** -3.79*** -3.82***
(-4.26) (-4.39) (-4.27) (-4.39)
CASH ? 4.34** 4.29** 4.20** 4.33**
(2.16) (2.13) (2.10) (2.15)
OCFt-1 ? 1.36 1.20 1.28 1.23
(0.47) (0.41) (0.45) (0.42)
OCFt ? 0.84 1.30 0.85 1.28
(0.30) (0.46) (0.30) (0.46)
LNTA ? -0.56*** -0.55*** -0.57*** -0.55***
(-2.94) (-2.87) (-2.96) (-2.87)
ROA ? -15.23** -15.73** -14.94** -15.8**
(-2.08) (-2.09) (-2.06) (-2.1)
LEV ? -1.7* -1.75* -1.71* -1.75*
(-1.84) (-1.87) (-1.85) (-1.87)
CHA_LEV ? 0.07 0.16 0.05 0.16
(0.17) (0.39) (0.13) (0.40)
VIX + 0.09***
(2.71)
SPREAD + 0.61**
(2.53)
VIX_ILLIQ_RESID + 0.10***
(2.67)
SPREAD_ILLIQ_RESID + 0.60**
(2.55)
Num Obs 266 266 266 266

45
Table VI: OLS - percentage of open market repurchase from total repurchases
This table reports results of a time series regression of 48 quarters starting with Quarter I 1998 and
ending with Quarter IV, 2010. The dependent variable is the ratio of open market repurchases to
total bond repurchases executed in quarter q and the explanatory variable is either the VIX or the
SPREAD in that quarter. Year fixed effects are included. T-statistics are reported in parentheses
below the coefficient estimates. ***, **, * indicate significance at 1%, 5%, or 10% level
respectively, two-tailed tests.
Independent Variables
Expected
Sign
VIX + 0.02***
(4.81)
SPREAD + 0.12***
(3.78)
Constant -0.15 -0.31
(-1.02) (-1.76)
Adj R2 0.54 0.45
Num Obs 47 47

46
Table VII: Annual bond return following repurchase
This table reports the estimation results of the return OLS regression (regression 2).
ANNUAL_BOND_RETURNi=α + β1OMRi + β2FIRM_RATINGi + εi
The dependent variable is the ex-post one year return on bonds repurchased. The explanatory
variable is a dummy variable of whether the repurchase was done in the open market or by using a
tender offer. A 5-rating scale is used to control for credit rating of the bond where 1-4 are rated firms
and 5 represents the unrated firms. Year and industry fixed effects are included. T-statistics are
reported in parentheses below the coefficient estimates. ***, **, * indicate significance at 1%, 5%, or
10% level respectively, two-tailed tests.
Independent Variables Expected Sign
OMR + 0.18**
(2.55)
FIRM_RATING + 0.11**
(2.30)
Constant -0.42
(-1.91)
Adj R2 0.13
Num of obs 150

47
Table VIII: OLS – Effect of repurchase choice on gain / loss from extinguishment of debt
This table reports the estimation results of the income statement effects of the repurchase method
(regression 3).
GAINi,t=α+β1LNTAi,t-1+β2LEVi,t-1+β3ROAi,t-1 +β4OMRi,t+β5ACTIONSIZEi,t + β6ACTIONSIZEi,t*OMRi,t
+εi,t
The regression is estimated for firms that executed debt repurchases either in the open market or via a
tender offer and that have Compustat item dtep (“Gain from Extinguishment of Debt) available. The
dependent variable is the income statement gain from extinguishment of debt. The explanatory
variables are a dummy variable of the open market repurchase method, the repurchase amount and an
interaction between the two vairbales. Control variables are defined in the appendix. Industry and
year fixed effects are included. T-statistics are reported in parentheses below the coefficient
estimates. ***, **, * indicate significance at 1%, 5%, or 10% level respectively, two-tailed tests.
Independent Variables
Expected Sign
(1)
(2)
(3)
LNTA ? 0.00 0.00 0.00
(-1.62) (-0.34) (-1.18)
LEV ? 0.00 0.01 0.02
(0.47) (0.43) (1.35)
ROA ? 0.06 0.11 0.24***
(0.61) (1.23) (3.12)
OMR + 0.02*** 0.03*** 0.00
(3.17) (3.69) (-0.48)
ACTIONSIZE ? 0.07** -0.09***
(2.23) (-2.83)
ACTIONSIZE *OMR + 0.34***
(8.39)
Constant 0.02 0.00 0.01
(0.46) (-0.11) (0.43)
Adj R2 0.06 0.08 0.36
Num Obs 213 213 213

48
Table IX: Insider trading during repurchase activity
This table reports the estimation results of the insider trading OLS regression (regression 4).
INSIDERi,q=α + β1LNTAi,q-1 + β2INSIDERi,q-1 + β3Q1 + β4Q2 + β5Q3 + β6OPENi,q+ β7TENDERi,q +εi,q
The dependent variable is the ratio of insider buys to total insider trades. The explanatory variables
are OPEN and TENDER – two dummy variables of repurchases in the quarter. Column 1 reports
coefficients for a sample that includes only firms that repurchased their public debt, and column 2
reports coefficients for the entire insider trade universe. Control variables are defined in the
appendix. Year dummies and industry fixed effects are included. T-statistics are reported in
parentheses below the coefficient estimates. ***, **, * indicate significance at 1%, 5%, or 10% level
respectively, two-tailed tests.
Independent Variables Expected Sign (1) (2)
Insider Tradeq-1 + 0.28*** 0.22***
(127.61) (13.36)
Log Assetsq-1 - -0.01*** 0.00
(-35.27) (-0.40)
Quarter 1 ? -0.03*** -0.02
(-13.80) (-1.36)
Quarter 2 ? -0.02*** -0.02
(-9.61) (-1.48)
Quarter 3 ? 0.00** 0.01
(-2.24) (0.36)
Open + 0.33*** 0.36***
(6.38) (7.46)
Tender + 0.12*** 0.12***
(2.58) (2.83)
Constant ? 0.26*** 0.17***
(65.29) (3.92)
Adj R2 0.12 0.14
Num Obs 190,482 3,538