the decam local volume exploration survey: overview and
TRANSCRIPT
FERMILAB-PUB-21-075-AE-LDRD
Draft version September 3, 2021Typeset using LATEX twocolumn style in AASTeX63
The DECam Local Volume Exploration Survey: Overview and First Data Release
A. Drlica-Wagner ,1, 2, 3 J. L. Carlin ,4 D. L. Nidever ,5, 6 P. S. Ferguson ,7, 8 N. Kuropatkin ,1
M. Adamow ,9, 10 W. Cerny ,2, 3 Y. Choi ,11 J. H. Esteves,12 C. E. Martınez-Vazquez ,13 S. Mau ,14, 15
A. E. Miller,16, 17 B. Mutlu-Pakdil ,2, 3 E. H. Neilsen ,1 K. A. G. Olsen ,6 A. B. Pace ,18 A. H. Riley ,7, 8
J. D. Sakowska ,19 D. J. Sand ,20 L. Santana-Silva ,21 E. J. Tollerud ,11 D. L. Tucker ,1 A. K. Vivas ,13
E. Zaborowski,2 A. Zenteno ,13 T. M. C. Abbott ,13 S. Allam ,1 K. Bechtol ,22, 23 C. P. M. Bell ,16
E. F. Bell ,24 P. Bilaji,2, 3 C. R. Bom ,25 J. A. Carballo-Bello ,26 D. Crnojevic ,27 M.-R. L. Cioni ,16
A. Diaz-Ocampo,28 T. J. L. de Boer ,29 D. Erkal ,19 R. A. Gruendl ,30, 31 D. Hernandez-Lang,32, 13, 33
A. K. Hughes,20 D. J. James ,34 L. C. Johnson ,35 T. S. Li ,36, 37, 38 Y.-Y. Mao ,39, 38
D. Martınez-Delgado ,40 P. Massana,19, 41 M. McNanna ,22 R. Morgan ,22 E. O. Nadler ,14, 15
N. E. D. Noel ,19 A. Palmese ,1, 2 A. H. G. Peter ,42 E. S. Rykoff ,2, 43 J. Sanchez ,1 N. Shipp ,3, 2
J. D. Simon ,36 A. Smercina ,44 M. Soares-Santos ,12 G. S. Stringfellow ,45 K. Tavangar ,2, 3
R. P. van der Marel ,11, 46 A. R. Walker ,13 R. H. Wechsler ,14, 15, 43 J. F. Wu 11 And B. Yanny 1
(DELVE Collaboration)
M. Fitzpatrick ,6 L. Huang ,6 A. Jacques ,6 R. Nikutta 6 And A. Scott 6
(Astro Data Lab)
1Fermi National Accelerator Laboratory, P.O. Box 500, Batavia, IL 60510, USA2Kavli Institute for Cosmological Physics, University of Chicago, Chicago, IL 60637, USA
3Department of Astronomy and Astrophysics, University of Chicago, Chicago IL 60637, USA4Rubin Observatory/AURA, 950 North Cherry Avenue, Tucson, AZ, 85719, USA
5Department of Physics, Montana State University, P.O. Box 173840, Bozeman, MT 59717-38406NSF’s National Optical-Infrared Astronomy Research Laboratory, 950 N. Cherry Ave., Tucson, AZ 85719, USA
7George P. and Cynthia Woods Mitchell Institute for Fundamental Physics and Astronomy,
Texas A&M University, College Station, TX 77843, USA8Department of Physics and Astronomy, Texas A&M University, College Station, TX 77843, USA
9National Center for Supercomputing Applications, University of Illinois, 1205 West Clark St., Urbana, IL 61801, USA10Center for Astrophysical Surveys, National Center for Supercomputing Applications, Urbana, IL, 61801, USA
11Space Telescope Science Institute, 3700 San Martin Drive, Baltimore, MD 21218, USA12Department of Physics, University of Michigan, Ann Arbor, MI 48109, USA
13Cerro Tololo Inter-American Observatory, NSF’s National Optical-Infrared Astronomy Research Laboratory,
Casilla 603, La Serena, Chile14Department of Physics, Stanford University, 382 Via Pueblo Mall, Stanford, CA 94305, USA
15Kavli Institute for Particle Astrophysics & Cosmology, P.O. Box 2450, Stanford University, Stanford, CA 94305, USA16Leibniz-Institut fur Astrophysik Potsdam (AIP), An der Sternwarte 16, D-14482 Potsdam, Germany
17Institut fur Physik und Astronomie, Universitat Potsdam, Haus 28, Karl-Liebknecht-Str. 24/25, D-14476 Golm (Potsdam), Germany18McWilliams Center for Cosmology, Carnegie Mellon University, 5000 Forbes Ave, Pittsburgh, PA 15213, USA
19Department of Physics, University of Surrey, Guildford GU2 7XH, UK20Department of Astronomy/Steward Observatory, 933 North Cherry Avenue, Room N204, Tucson, AZ 85721-0065, USA
21NAT-Universidade Cruzeiro do Sul / Universidade Cidade de Sao Paulo, Rua Galvao Bueno, 868, 01506-000, Sao Paulo, SP, Brazil22Department of Physics, University of Wisconsin-Madison, Madison, WI 53706, USA
23LSST, 933 North Cherry Avenue, Tucson, AZ 85721, USA24Department of Astronomy, University of Michigan, 1085 S. University Ave., Ann Arbor, MI, 48109-1107, USA
25Centro Brasileiro de Pesquisas Fısicas, Rua Dr. Xavier Sigaud 150, 22290-180 Rio de Janeiro, RJ, Brazil26Instituto de Alta Investigacion, Sede Esmeralda, Universidad de Tarapaca, Av. Luis Emilio Recabarren 2477, Iquique, Chile
Corresponding author: Alex Drlica-Wagner
arX
iv:2
103.
0747
6v2
[as
tro-
ph.G
A]
2 S
ep 2
021
2 DELVE Collaboration
27University of Tampa, Department of Chemistry, Biochemistry, and Physics, 401 West Kennedy Boulevard, Tampa, FL 33606, USA28Departamento de Fısica y Astronomıa, Facultad de Ciencias, Universidad de La Serena. Av. Juan Cisternas 1200, La Serena, Chile
29Institute for Astronomy, University of Hawaiı, 2680 Woodlawn Drive, Honolulu, HI 96822, USA30Department of Astronomy, University of Illinois, 1002 W. Green Street, Urbana, IL 61801, USA31National Center for Supercomputing Applications, 1205 West Clark St., Urbana, IL 61801, USA
32University of La Serena, La Serena, Chile33Gemini Observatory, La Serena, Chile
34ASTRAVEO, LLC, PO Box 1668, Gloucester, MA 0193135Center for Interdisciplinary Exploration and Research in Astrophysics (CIERA) and Department of Physics and Astronomy,
Northwestern University,
1800 Sherman Ave, Evanston, IL 60201 USA36Observatories of the Carnegie Institution for Science, 813 Santa Barbara St., Pasadena, CA 91101, USA
37Department of Astrophysical Sciences, Princeton University, Princeton, NJ 08544, USA38NHFP Einstein Fellow
39Department of Physics and Astronomy, Rutgers, The State University of New Jersey, Piscataway, NJ 08854, USA40Instituto de Astrofısica de Andalucıa, CSIC, E-18080 Granada, Spain
41Isaac Newton Group of Telescopes, Apartado 321, E-38700 Santa Cruz de La Palma, Canary Islands, Spain42CCAPP, Department of Physics, and Department of Astronomy, The Ohio State University,
191 W. Woodruff Ave., Columbus, OH 4321043SLAC National Accelerator Laboratory, Menlo Park, CA 94025, USA
44Astronomy Department, University of Washington, Box 351580, Seattle, WA 98195-1580, USA45Center for Astrophysics and Space Astronomy, University of Colorado, 389 UCB, Boulder, CO 80309-0389, USA
46Center for Astrophysical Sciences, Department of Physics & Astronomy, Johns Hopkins University, Baltimore, MD 21218, USA
ABSTRACT
The DECam Local Volume Exploration survey (DELVE) is a 126-night survey program on the
4 m Blanco Telescope at the Cerro Tololo Inter-American Observatory in Chile. DELVE seeks to
understand the characteristics of faint satellite galaxies and other resolved stellar substructures over
a range of environments in the Local Volume. DELVE will combine new DECam observations with
archival DECam data to cover ∼ 15000 deg2 of high Galactic latitude (|b| > 10 deg) southern sky to a
5σ depth of g, r, i, z ∼ 23.5 mag. In addition, DELVE will cover a region of ∼ 2200 deg2 around the
Magellanic Clouds to a depth of g, r, i ∼ 24.5 mag and an area of ∼ 135 deg2 around four Magellanic
analogs to a depth of g, i ∼ 25.5 mag. Here, we present an overview of the DELVE program and progress
to date. We also summarize the first DELVE public data release (DELVE DR1), which provides point-
source and automatic aperture photometry for ∼ 520 million astronomical sources covering ∼ 5000 deg2
of the southern sky to a 5σ point-source depth of g=24.3, r=23.9, i=23.3, and z=22.8 mag. DELVE
DR1 is publicly available via the NOIRLab Astro Data Lab science platform.
Keywords: Surveys – Catalogs – Dwarf galaxies – Magellanic Clouds – Local Group
1. INTRODUCTION
The standard model of cosmology (ΛCDM) is strongly
supported by observations at large spatial scales (e.g.,
Planck Collaboration 2020; DES Collaboration 2018b).
However, this fundamental model for the growth and
evolution of our Universe remains challenging to test
on scales smaller than our Milky Way. Starting with
the Sloan Digital Sky Survey (SDSS; York et al. 2000),
large digital sky surveys have revolutionized our under-
standing of galaxies with stellar masses . 105 M� (see
recent reviews by McConnachie 2012 and Simon 2019).
We now know that our Milky Way is surrounded by
scores (and likely hundreds) of faint galaxies, which span
orders of magnitude in luminosity (e.g., Drlica-Wagner
et al. 2020, and references therein). Discoveries of faint
satellites around our nearest galactic neighbors have be-
gun to extend these studies beyond the Milky Way (e.g.,
Martin et al. 2013; Chiboucas et al. 2013; Muller et al.
2015; Carlin et al. 2016; Smercina et al. 2018; Crno-
jevic et al. 2019). Furthermore, we observe the tidal
remnants of faint satellite galaxies traversing our own
Galactic halo (e.g., Ibata et al. 2001b; Belokurov et al.
2006; Shipp et al. 2018) and the halos of other nearby
galaxies (e.g., Malin & Hadley 1997; Ibata et al. 2001a;
Martınez-Delgado et al. 2008; Mouhcine et al. 2010).
The discovery of the faintest galaxies and their remnants
represents an observational frontier for large digital sky
DELVE DR1 3
surveys, while the study of these systems continues to
improve our understanding of ΛCDM at the smallest
observable scales.
The Dark Energy Camera (DECam; Flaugher et al.
2015), mounted on the 4 m Blanco Telescope at Cerro
Tololo Inter-American Observatory in Chile, is an excep-
tional instrument for exploring the faintest stellar sys-
tems. The large field of view (3 deg2) and fast read-
out time (27 s) of DECam allow it to quickly image
large areas of the sky. DECam has been used by sev-
eral large survey programs, including the Dark Energy
Survey (DES; DES Collaboration 2005, 2016), the Sur-
vey of the Magellanic Stellar History (SMASH; Nide-
ver et al. 2017, 2021b), and the DECam Legacy Surveys
(DECaLS; Dey et al. 2019). Furthermore, the astronom-
ical community has used DECam for targeted observing
programs that have covered much of the remaining sky.
Here we present the DECam Local Volume
Exploration survey (DELVE),1 which is in the process
of combining 126 nights of new DECam observations
with existing public archival DECam data to assemble
contiguous multi-band coverage of the entire high Galac-
tic latitude (|b| > 10 deg) southern sky (Figure 1). The
DELVE program consists of three main components: (1)
DELVE-WIDE seeks to complete DECam coverage of
∼ 15000 deg2 of the high-Galactic-latitude southern sky
in g, r, i, z; (2) DELVE-MC provides deeper contiguous
coverage of 2200 deg2 in g, r, i surrounding the Large
and Small Magellanic Clouds (LMC and SMC); and (3)
DELVE-DEEP performs deep imaging of 135 deg2 in g, i
around four Magellanic analogs in the Local Volume.
Each survey component will combine new observations
with archival data that have been self-consistently pro-
cessed with state-of-the-art data management pipelines.
The wide-area DELVE data are processed with the DES
Data Management pipeline (DESDM; Morganson et al.
2018), which includes point-spread function (PSF) fit-
ting and source modeling. The deeper DELVE data
around the Magellanic Clouds and Magellanic analogs
are processed with the multiepoch point-source fitting
pipeline used by SMASH (Nidever & Dorta 2020) to en-
able deep, accurate photometry in these regions. The
DELVE data will be released on regular intervals with
the first public data release (DELVE DR1) documented
here.
This paper summarizes the DELVE science program,
survey design, progress to date, and contents of the first
data release. We start in Section 2 by describing the
scientific motivation for DELVE. In Section 3 we docu-
1 https://delve-survey.github.io
ment the survey strategy and observational progress to
date. In Section 4 we describe DELVE DR1, including
the input data set, processing, validation, and data ac-
cess tools. We provide several scientific demonstrations
of the DELVE data in Section 5, and we conclude in
Section 6. Throughout this paper, all magnitudes are
referenced in the AB system (Oke 1974), and all as-
tronomical coordinates are provided in the Gaia-CRF2
reference frame (Gaia Collaboration 2018b) unless ex-
plicitly noted otherwise.
2. SCIENTIFIC MOTIVATION
The ΛCDM model predicts that galaxies like the
Milky Way inhabit large dark matter halos that grow
hierarchically by merging with and/or accreting smaller
galaxies. There is ample evidence for the ΛCDM
paradigm on large scales; however, small-scale tests are
challenging due to the low luminosities of the faintest
galaxies that inhabit low-mass dark matter halos. In
particular, ultra-faint galaxies with stellar masses .105 M� have only been identified out to distances of a
few Mpc (e.g., McConnachie 2012; Martin et al. 2013;
Muller et al. 2015; Carlin et al. 2016; Smercina et al.
2018; Crnojevic et al. 2019), while the census of the
faintest dwarf galaxies (sometimes called “hyper-faint”
dwarf galaxies; Hargis et al. 2014) is incomplete even
within the Milky Way halo (e.g., Tollerud et al. 2008;
Hargis et al. 2014; Kim et al. 2018; Simon 2019; Drlica-
Wagner et al. 2020). Despite these observational chal-
lenges, the faintest galaxies provide crucial information
about the role of environment and feedback on galaxy
formation (e.g., Mashchenko et al. 2008; Wheeler et al.
2015, 2019; Munshi et al. 2019; Agertz et al. 2020;
Karunakaran et al. 2020), reionization and the first stars
(e.g., Bullock et al. 2000; Shapiro et al. 2004; Weisz
et al. 2014a,b; Boylan-Kolchin et al. 2015; Ishiyama et al.
2016; Weisz & Boylan-Kolchin 2017; Tollerud & Peek
2018; Graus et al. 2019; Katz et al. 2020), and the nature
of dark matter (e.g., Bergstrom et al. 1998; Spekkens
et al. 2013; Malyshev et al. 2014; Ackermann et al. 2015;
Geringer-Sameth et al. 2015; Brandt 2016; Bullock &
Boylan-Kolchin 2017; Nadler et al. 2019; Nadler et al.
2021). Ultra-faint galaxies also provide a unique oppor-
tunity to study the creation of heavy elements in some
of the earliest star-forming environments (e.g., Frebel &
Norris 2015; Ji et al. 2016; Roederer et al. 2016).
DELVE seeks to improve our understanding of dark
matter and galaxy formation by studying the faintest
satellite galaxies and their tidally disrupted remnants in
a range of environments. To accomplish this, DELVE
consists of three survey programs, each with a specific
observational aim.
4 DELVE Collaboration
−60◦
−30◦
0◦
+30◦
+60◦
−120◦−60◦0◦+60◦+120◦
SextansB
IC5152
NGC300
NGC55
LMC SMC
DELVE-WIDE (g ∼ 23.5)
DELVE-MC (g ∼ 24.5)
DELVE-DEEP (g ∼ 25.5)
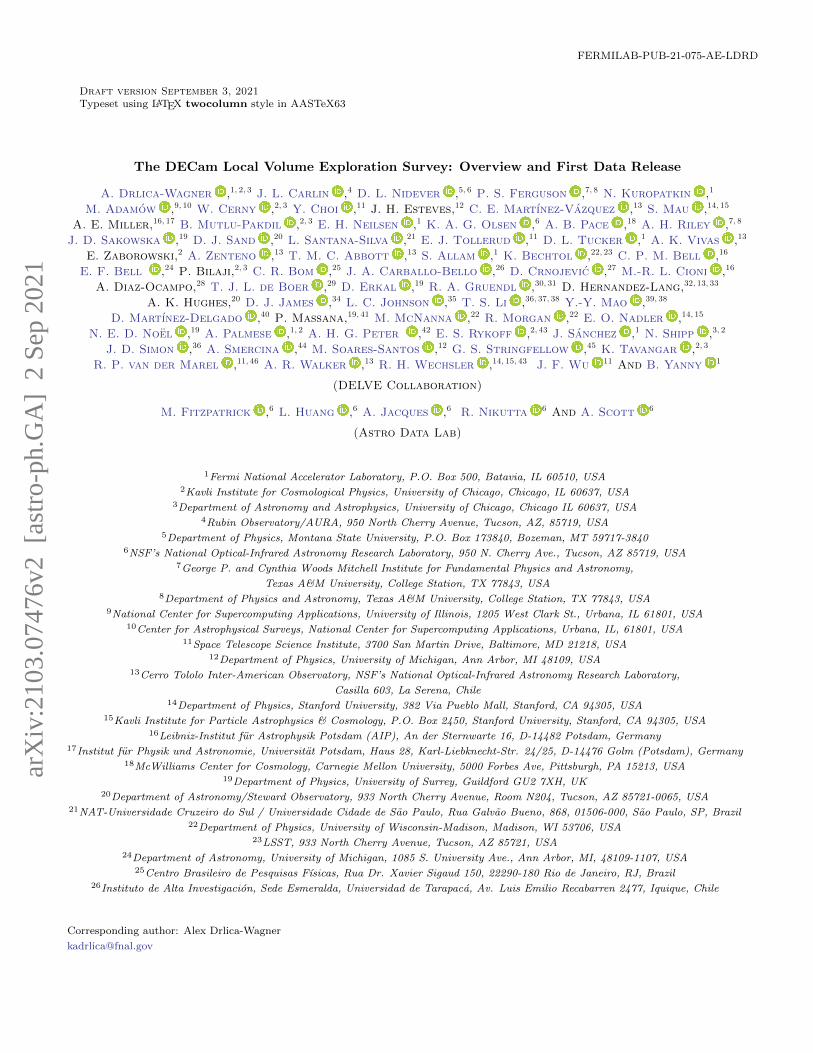
Figure 1. DELVE combines 126 nights of allocated time with public archival data to cover the southern equatorial skywith DECam. DELVE will provide contiguous multi-band imaging with a 5σ point-source depth of g, r, i, z & 23.5 mag over∼ 15000 deg2 (turquoise region). In addition, a region of 2200 deg2 around the Magellanic Clouds will be imaged to a depth ofg, r, i ≥ 24.5 mag (light-blue region). Deep fields around four Magellanic analogs (Sextans B, NGC 300, NGC 55, and IC 5152)will be imaged to a depth of g, i ≥ 25.5 mag (dark-blue region). The Galactic plane is indicated with a thick black line (dashedlines denote b = ±10 deg), and the DES footprint is outlined in black. This figure uses an equal-area McBryde–Thomas flatpolar quartic projection in celestial equatorial coordinates.
2.1. DELVE-WIDE
The DELVE-WIDE program will complete DECam
coverage over the entire high Galactic latitude (|b| > 10)
southern sky to provide a deep and accurate census
of ultra-faint satellite galaxies around the Milky Way.
DELVE will reach a photometric depth in g, r, i, z that
is comparable to that of the first two years of DES. Early
DELVE-WIDE data have already resulted in the discov-
ery of an ultra-faint satellite galaxy, Centaurus I (Mau
et al. 2020). The full DELVE-WIDE survey will enable
the detection of ultra-faint satellites similar to Centau-
rus I (MV = −5 mag and µ = 27 mag arcsec−2) out
to the virial radius of the Milky Way (∼ 300 kpc) with
> 90% efficiency (Drlica-Wagner et al. 2020). The com-
bined model of the Milky Way and LMC satellite galaxy
populations from Nadler et al. (2020) predicts that the
DELVE footprint (including the area covered by DES)
contains 48± 8 satellite galaxies that are detectable by
DELVE. Given the existing population of confirmed and
candidate satellite galaxies (Drlica-Wagner et al. 2020),
this model predicts that DELVE could discover over a
dozen ultra-faint satellite galaxies.
The DELVE-WIDE program also provides exceptional
sensitivity to stellar streams, the remnants of tidally dis-
rupted dwarf galaxies and globular clusters. These re-
solved stellar structures provide insight into the forma-
tion and evolution of the Milky Way stellar halo (e.g.,
Bullock & Johnston 2005). The composition, morphol-
ogy, and orbital properties of detected structures cap-
ture the recent accretion history of the Milky Way, in-
cluding the masses, orbits, and metallicities of recently
accreted satellites (e.g., Bonaca et al. 2021). Stellar
streams also probe both the large- and small-scale dis-
tribution of dark matter around the Milky Way: they
trace the gravitational potential of the Milky Way over
a large range of radii (e.g., Johnston et al. 1999; Bovy
et al. 2016; Erkal et al. 2016b; Bonaca & Hogg 2018), and
they offer a promising way to test dark matter clusteringbelow the threshold of galaxy formation (e.g., Johnston
et al. 2002; Carlberg 2013; Erkal et al. 2016a; Banik et al.
2019).
The detection of stellar streams relies on deep, uni-
form coverage due to their low surface brightnesses
(∼ 32 mag arcsec−2) and large extents on the sky (tens of
degrees). Recent studies of stellar streams have empha-
sized the synergy between deep photometry with DE-
Cam, proper-motion measurements from Gaia, and ra-
dial velocities from massively multiplexed spectroscopic
instruments (e.g., Balbinot et al. 2016; Shipp et al. 2018;
Jethwa et al. 2018b; Shipp et al. 2019; Li et al. 2019,
2021; Shipp et al. 2020; Bonaca et al. 2020). DELVE-
WIDE will extend the study of stellar streams by provid-
ing contiguous coverage across the southern hemisphere.
DELVE DR1 5
DELVE-WIDE will also enable a broad range of ex-
tragalactic science due to its wide, multi-band cover-
age. In particular, DELVE-WIDE will enable extended
southern-sky targeting for the Satellites Around Galac-
tic Analogs (SAGA) program, which seeks to study
more massive and luminous companions of Milky Way-
like galaxies within 20–40 Mpc (Geha et al. 2017; Mao
et al. 2021). In addition, DELVE-WIDE will enable the
search for strong gravitational lens systems, which can
be used to probe the Hubble constant, dark energy, and
the small-scale structure of dark matter (e.g., Koopmans
2005; Treu 2010; Oguri & Marshall 2010; Vegetti et al.
2012; Treu et al. 2018; Gilman et al. 2019; Wong et al.
2020). Furthermore, the DELVE-WIDE data can be
used to study galaxies and galaxy clusters in a range of
environments. Several examples of extragalactic science
with DELVE-WIDE can be found in Section 5.
2.2. DELVE-MC
While it has long been hypothesized that the Magel-
lanic Clouds (MCs) arrived with their own population
of dwarf companions (e.g., Lynden-Bell 1976; D’Onghia
& Lake 2008), the observational evidence for this model
has been strengthened by the discovery of many ultra-
faint satellites surrounding the MCs (e.g., Bechtol et al.
2015; Koposov et al. 2015; Drlica-Wagner et al. 2015,
2016; Torrealba et al. 2018; Koposov et al. 2018; Cerny
et al. 2021). These discoveries have stimulated a flurry
of interest in simulating and modeling the satellite pop-
ulations of the MCs. Simulations predict that up to a
third of the satellites around the Milky Way originated
with the MCs (e.g., Deason et al. 2015; Wetzel et al.
2015; Jethwa et al. 2016; Dooley et al. 2017b; Jahn
et al. 2019; Nadler et al. 2020). Some studies suggest
that the MCs should host more luminous satellites than
are observed (e.g., Dooley et al. 2017b), while others
suggest that the MCs should host more faint satellites
than are observed (e.g., Jahn et al. 2019). Furthermore,
there is significant observational uncertainty in associ-
ating known ultra-faint galaxies with the MCs (Kalli-
vayalil et al. 2018; Pardy et al. 2020; Erkal & Belokurov
2020; Patel et al. 2020).
One issue in determining the satellite luminosity func-
tion of the MCs comes from the fact that the region
around the MCs has only been observed by relatively
shallow contiguous surveys (e.g., Drlica-Wagner et al.
2016; Mackey et al. 2018) and by deep surveys with
low fill factors (e.g., Nidever et al. 2017). The DELVE-
MC program will provide deep, contiguous imaging of
the MCs and their surrounding environment to robustly
measure the population of faint satellites around the
MCs. DELVE has already started to probe this region
with inhomogeneous early data, leading to the discov-
ery an ultra-faint star cluster (DELVE 2; MV = −2.1)
located 12 kpc from the SMC and 28 kpc from the LMC
(Cerny et al. 2021). The model of Nadler et al. (2020)
predicts that ∼ 30% of the ultra-faint galaxies contained
within the DELVE footprint are associated with the
MCs.
The stellar masses, star formation histories, and in-
teraction histories of the MCs are expected to influ-
ence the properties of their satellite populations (e.g.,
Jethwa et al. 2016; Dooley et al. 2017b; Jahn et al.
2019). SMASH has used DECam to study the main bod-
ies and periphery of the MCs with a deep, partially filled
survey (Nidever et al. 2017). Photometric metallicities
from SMASH suggest that the LMC periphery is not as
metal-poor as would be expected in a “classical” halo
produced by ΛCDM-style hierarchical assembly. This
observation is consistent with the hypothesis that the
stellar envelope of the LMC may be dominated by ma-
terial from the outer LMC disk, likely stirred up through
a recent interaction with the SMC (Choi et al. 2018a,b;
Nidever et al. 2019). In parallel, recent observations of
Gaia-selected red giant branch (RGB) stars suggest that
even more structure exists in the periphery of the MCs
(Belokurov & Erkal 2019; Gaia Collaboration 2021a).
The deep, contiguous imaging of DELVE-MC will ex-
tend below the oldest main-sequence turn off (MSTO)
of the MCs and will be sensitive to faint substructures
that can provide clues about their interaction history
(Massana et al. 2020). Comparisons between the stellar
populations in the bodies, peripheries, and satellites of
the MCs will help reconstruct the evolution of the MCs
and their satellite system as they are accreted onto the
Milky Way.
DELVE-MC is also well suited to study the gravita-
tional wake of the LMC. As the LMC moves through the
Milky Way stellar halo, it pulls stars towards itself, cre-
ating an overdensity of stars along its past orbital path
(e.g., Garavito-Camargo et al. 2019; Erkal et al. 2020).
Recently, it has been shown that the Pisces Overden-
sity (Watkins et al. 2009) matches the properties of the
expected wake (Belokurov et al. 2019). The wide cov-
erage of DELVE will give a more complete view of the
Milky Way’s stellar halo close to the LMC, allowing us
to better map the wake of the LMC and test the ef-
fect of dynamical friction. This, in turn, may constrain
alternative dark matter models that modify dynamical
friction (e.g., Lancaster et al. 2020).
2.3. DELVE-DEEP
As our understanding of satellite galaxies and stellar
substructures in the Local Group has improved, searches
6 DELVE Collaboration
0 1 2 3 4 5 6Distance (Mpc)
−20
−15
−10
−5
0
MB
Edg
eof
Loc
alG
roup
M31
M83
LMC
SMC
Milky Way
Cen
A,
Scu
lpto
r,M
81
all Local Volume galaxies
LMC/SMC
DELVE targets
existing DECam observations
MW UFDs
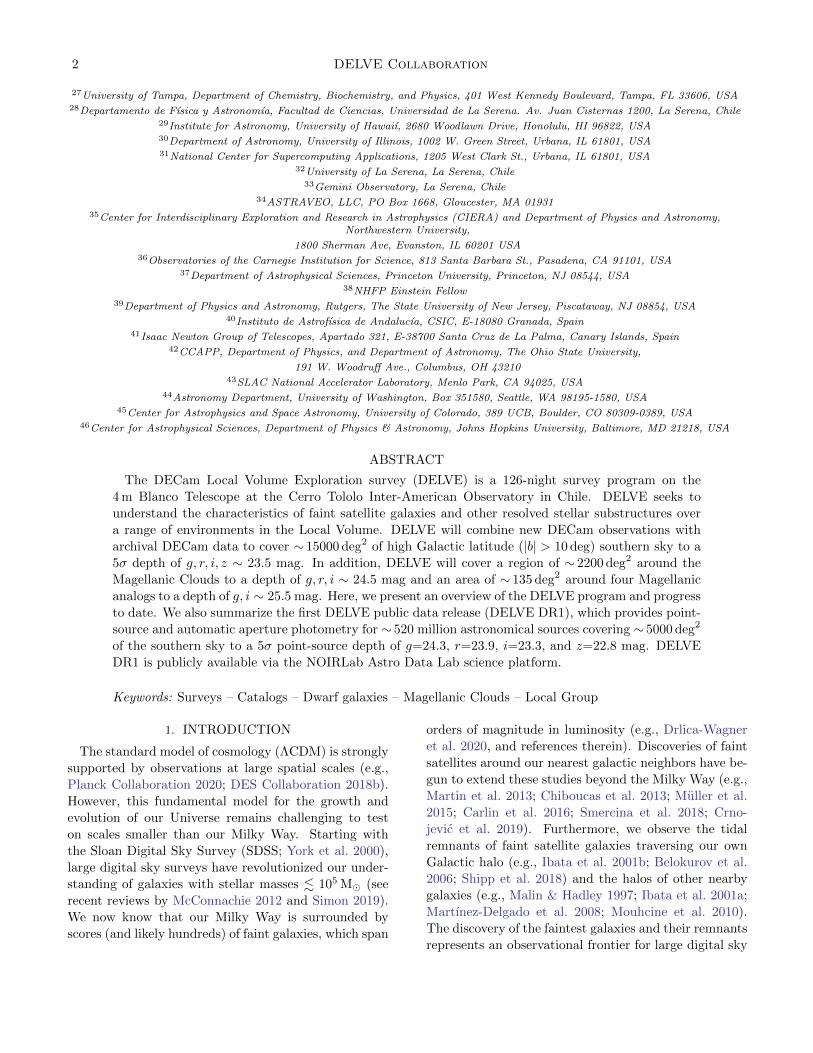
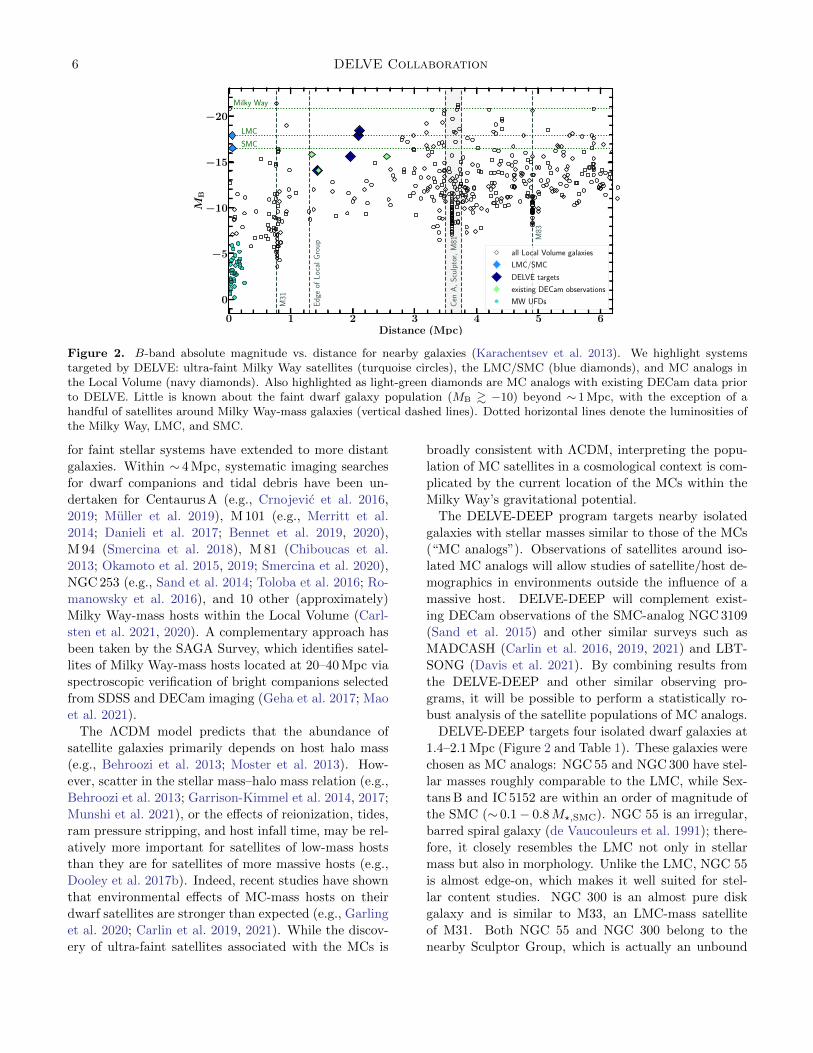
Figure 2. B-band absolute magnitude vs. distance for nearby galaxies (Karachentsev et al. 2013). We highlight systemstargeted by DELVE: ultra-faint Milky Way satellites (turquoise circles), the LMC/SMC (blue diamonds), and MC analogs inthe Local Volume (navy diamonds). Also highlighted as light-green diamonds are MC analogs with existing DECam data priorto DELVE. Little is known about the faint dwarf galaxy population (MB & −10) beyond ∼ 1 Mpc, with the exception of ahandful of satellites around Milky Way-mass galaxies (vertical dashed lines). Dotted horizontal lines denote the luminosities ofthe Milky Way, LMC, and SMC.
for faint stellar systems have extended to more distant
galaxies. Within ∼ 4 Mpc, systematic imaging searches
for dwarf companions and tidal debris have been un-
dertaken for Centaurus A (e.g., Crnojevic et al. 2016,
2019; Muller et al. 2019), M 101 (e.g., Merritt et al.
2014; Danieli et al. 2017; Bennet et al. 2019, 2020),
M 94 (Smercina et al. 2018), M 81 (Chiboucas et al.
2013; Okamoto et al. 2015, 2019; Smercina et al. 2020),
NGC 253 (e.g., Sand et al. 2014; Toloba et al. 2016; Ro-
manowsky et al. 2016), and 10 other (approximately)
Milky Way-mass hosts within the Local Volume (Carl-
sten et al. 2021, 2020). A complementary approach has
been taken by the SAGA Survey, which identifies satel-
lites of Milky Way-mass hosts located at 20–40 Mpc via
spectroscopic verification of bright companions selected
from SDSS and DECam imaging (Geha et al. 2017; Mao
et al. 2021).
The ΛCDM model predicts that the abundance of
satellite galaxies primarily depends on host halo mass
(e.g., Behroozi et al. 2013; Moster et al. 2013). How-
ever, scatter in the stellar mass–halo mass relation (e.g.,
Behroozi et al. 2013; Garrison-Kimmel et al. 2014, 2017;
Munshi et al. 2021), or the effects of reionization, tides,
ram pressure stripping, and host infall time, may be rel-
atively more important for satellites of low-mass hosts
than they are for satellites of more massive hosts (e.g.,
Dooley et al. 2017b). Indeed, recent studies have shown
that environmental effects of MC-mass hosts on their
dwarf satellites are stronger than expected (e.g., Garling
et al. 2020; Carlin et al. 2019, 2021). While the discov-
ery of ultra-faint satellites associated with the MCs is
broadly consistent with ΛCDM, interpreting the popu-
lation of MC satellites in a cosmological context is com-
plicated by the current location of the MCs within the
Milky Way’s gravitational potential.
The DELVE-DEEP program targets nearby isolated
galaxies with stellar masses similar to those of the MCs
(“MC analogs”). Observations of satellites around iso-
lated MC analogs will allow studies of satellite/host de-
mographics in environments outside the influence of a
massive host. DELVE-DEEP will complement exist-
ing DECam observations of the SMC-analog NGC 3109
(Sand et al. 2015) and other similar surveys such as
MADCASH (Carlin et al. 2016, 2019, 2021) and LBT-
SONG (Davis et al. 2021). By combining results fromthe DELVE-DEEP and other similar observing pro-
grams, it will be possible to perform a statistically ro-
bust analysis of the satellite populations of MC analogs.
DELVE-DEEP targets four isolated dwarf galaxies at
1.4–2.1 Mpc (Figure 2 and Table 1). These galaxies were
chosen as MC analogs: NGC 55 and NGC 300 have stel-
lar masses roughly comparable to the LMC, while Sex-
tans B and IC 5152 are within an order of magnitude of
the SMC (∼ 0.1− 0.8M?,SMC). NGC 55 is an irregular,
barred spiral galaxy (de Vaucouleurs et al. 1991); there-
fore, it closely resembles the LMC not only in stellar
mass but also in morphology. Unlike the LMC, NGC 55
is almost edge-on, which makes it well suited for stel-
lar content studies. NGC 300 is an almost pure disk
galaxy and is similar to M33, an LMC-mass satellite
of M31. Both NGC 55 and NGC 300 belong to the
nearby Sculptor Group, which is actually an unbound
DELVE DR1 7
filamentary structure extended along our line of sight
(Karachentsev et al. 2003). Both Sextans B and IC
5152 are irregular dwarf galaxies. While Sextans B is
a member of a very loose group of dwarf galaxies (the
NGC 3109 association; Tully et al. 2006), IC 5152 is an
exceptionally isolated object, with the nearest neighbor
being NGC 55 at a distance of 800 kpc (Karachentsev
et al. 2002). While all of our targets have been studied
with deep imaging observations (e.g., Tosi et al. 1991;
Zijlstra & Minniti 1999; Tanaka et al. 2011; Bellazzini
et al. 2014; Hillis et al. 2016; Rodrıguez et al. 2016; Jang
et al. 2020), systematic searches for dwarf satellites have
not been possible due to limited sky coverage.
DELVE-DEEP will provide sensitivity to resolved
stars & 1.5 mag below the tip of the RGB of each target,
enabling the detection of resolved satellite galaxies with
MV . −7 (comparable to the brightest ultra-faint satel-
lites of the Milky Way). DELVE-DEEP imaging covers
the halos of each target (rvir ∼ 110 kpc for an SMC-mass
galaxy; e.g., Dooley et al. 2017b) to provide a complete
census of faint satellites with a total area of ∼ 135 deg2.
According to predictions based on ΛCDM, we expect to
discover 5–17 satellites with MV . −7 around the four
targets (Dooley et al. 2017a,b). In addition to searches
for faint satellites, the DELVE-DEEP data will enable
detailed studies of the target galaxies, including searches
for globular clusters and measurement of their stellar
density profiles to large radii and low surface bright-
nesses (e.g., Pucha et al. 2019).
3. SURVEY DESIGN AND PROGRESS
DELVE began observing in 2019 February and has col-
lected ∼ 12000 new DECam exposures as of 2021 Jan-
uary. The DELVE imaging data are released via the
NOIRLab Astro Data Archive2 without any proprietary
period. Observations for the three DELVE programs
are scheduled by an automated open-source tool that
optimizes for field availability, air mass, sky brightness,
and seeing.3 DELVE observing has been performed on
site at CTIO and from remote stations in Tucson and
at Fermilab. Remote observing from home commenced
in 2020 October due to the COVID-19 pandemic. The
observational strategy and status for each of the DELVE
programs are described in more detail below.
3.1. DELVE-WIDE
DELVE-WIDE seeks to assemble contiguous DECam
coverage over the entire southern sky with |b| > 10 deg
(Figure 1). Two-band photometry provides sufficient
2 https://astroarchive.noirlab.edu/3 https://github.com/kadrlica/obztak
color–magnitude information to separate old, metal-
poor halo populations from Milky Way foreground; how-
ever, additional color information is useful for a wide
range of science topics. Thus, DELVE-WIDE observes
preferentially in the g, i bands and coordinates with
other DECam programs to process and assemble cov-
erage in the r, z bands (see Section 4). DELVE-WIDE
nominally performs 3 × 90 s dithered exposures in g, i
using the same icosahedral tiling scheme used by DE-
CaLS (Dey et al. 2019),4 but with larger dithered offsets
(corresponding to roughly three times the DECam CCD
dimensions). The DELVE tiling scheme allows the en-
tire 15000 deg2 DELVE-WIDE footprint to be covered
with three tilings in g, i by ∼ 43000 DECam exposures.
However, a large fraction of the sky has already been
covered by DES, DECaLS, and other DECam programs.
By preferentially targeting regions that lack sufficiently
deep DECam data, the DELVE-WIDE footprint can be
contiguously covered with 3 tilings in g, i by ∼ 20000
new exposures. DELVE-WIDE includes a fourth tiling
when necessitated by observing constraints and existing
DECam coverage. As of 2021 January, DELVE-WIDE
has collected 9778 exposures.
When scheduling DELVE-WIDE, we use public meta-
data to assess the coverage and depth of archival DE-
Cam imaging. We calculate the effective exposure time
for each archival exposure from the shutter-open time,
Texp, and the effective exposure time scale factor, teff ,
which combines the achieved seeing, sky brightness, and
extinction due to clouds to assess the effective depth of
an exposure (Neilsen et al. 2015). We create maps of the
summed effective exposure time in each band as a func-
tion of sky position at a resolution of ∼ 3.′4 (HEALPix
nside = 1024). Each DELVE-WIDE target exposure
is compared to the existing summed effective exposure
time at the target location of that exposure and is con-
sidered to have been covered if > 67% of the exposure
area exceeds a minimum depth threshold. The mini-
mum depth of each DELVE-WIDE target exposure is
calculated from the tiling number, Ntile ∈ {1, 2, 3, 4},the DELVE-WIDE shutter open time, Texp,0 = 90 s,
and the minimum effective depth scale factor, teff,min.
A DELVE-WIDE exposure in tiling Ntile is considered
covered if the summed effective exposure time in that
region of the sky is
∑j
teff,j × Texp,j > Ntile × teff,min × Texp,0. (1)
4 Based on the scheme of Hardin, Sloane, and Smith (http://neilsloane.com/icosahedral.codes)
8 DELVE Collaboration
Table 1. DELVE-DEEP isolated dwarf galaxy targets.
Target R.A. Decl. Distance MB M∗ R110 Nsat,exp References
(deg) (deg) (Mpc) (mag) (M�) (deg)
NGC 55 3.79 -39.22 2.1 -18.4 3.0× 10⁹ 3.0 2–6 (1)(2)(3)
NGC 300 13.72 -37.68 2.0 -17.9 2.6× 10⁹ 3.0 2–5 (4)(2)(3)
Sextans B 150.00 5.33 1.4 -14.1 6.8× 10⁷ 4.4 0–2 (1)(5)(6)
IC 5152 330.67 -51.30 2.0 -15.6 5.1× 10⁸ 3.2 1–4 (7)(5)(8)
Note—Stellar masses are derived from the K-band luminosity reported by Karachentsev et al.(2013) assuming a K-band mass-to-light ratio of unity. R110 denotes the angular size of a 110kpc region (roughly the virial radius) at the distance of each target. Nsat,exp is the numberof expected satellites with MV < −7 according to Dooley et al. (2017a,b).
References—Values come from the compilation of Karachentsev et al. (2013). For each galaxy,we provide the original references for distance, absolute magnitude, and K-band luminosity:(1) Dalcanton et al. (2009), (2) da Costa et al. (1998), (3) Huchra et al. (2012), (4) Freedmanet al. (2001), (5) de Vaucouleurs et al. (1991), (6) Karachentsev et al. (2013), (7) Jacobs et al.(2009), (8) Fingerhut et al. (2010)
The cumulative exposure time from archival data (the
left-hand side of the above equation) is calculated from
archival exposures with teff,j > 0.2. Motivated by ex-
perience from DES and other DECam programs, we
set the minimum effective exposure time threshold as
teff,min,g = 0.4 and teff,min,i = 0.5. The DECam coverage
map is updated with new archival data each semester,
while completed DELVE exposures are included in real
time during observing.
The DELVE-WIDE data are processed with the
DESDM pipeline (Morganson et al. 2018) and serve as
the basis for DELVE DR1. The DELVE-WIDE data
processing is described in more detail in Section 4.2.
3.2. DELVE-MC
The DELVE-MC program seeks to map the periph-
ery of the MCs by covering a contiguous region of
∼ 2200 deg2 extending 25 deg around the LMC and15 deg around the SMC to a depth comparable to that of
SMASH, g = 24.8, r = 24.5, and i = 24.2 mag (Nidever
et al. 2017, 2019). DELVE-MC observes in three bands
to leverage (g − r) and (r − i) colors to help separate
compact blue galaxies from Magellanic MSTO stars at
g & 23 mag (Nidever et al. 2019). Roughly half of the
DELVE-MC footprint has already been covered to the
desired depth by DES and SMASH, and DELVE is in
the process of supplementing the remaining ∼ 1100 deg2
with ∼ 2200 new exposures. DELVE-MC targets a to-
tal integrated exposure time of 800 s in g, r, and 1000 s
in i by using 3 × 267 s dithered exposures in g, r and
3 × 333 s dithered exposures in i. The DELVE-MC
tiling scheme is the same as the DELVE-WIDE survey,
and regions of missing DECam coverage are determined
following the procedure described in Section 3.1. Due
to the low elevation of the MCs as seen from CTIO,
DECam observations of the MCs generally have larger-
than-average PSF FWHM values and correspondingly
lower-than-average teff values. Based on SMASH ob-
servations, we set teff,min,g = 0.3, teff,min,r = 0.3, and
teff,min,i = 0.45 when calculating the existing coverage.
DELVE-MC observations are scheduled when the PSF
FWHM is < 1.′′1 (as estimated for an i-band exposure
taken at zenith) to help improve crowded-field photome-
try. As of 2021 January, DELVE-MC has collected 1467
exposures.
The high stellar density in the DELVE-MC region
motivates us to process the DELVE-MC data with a
modified version of the PHOTRED pipeline (Nidever &
Dorta 2020). This pipeline, called “DELVERED”, was
created to better handle large dithers between overlap-
ping DELVE-MC exposures. DELVERED first performs
PSF photometry for each exposure and then performs
forced PSF photometry for overlapping exposures. At
the exposure level, each night is processed separately.
This processing includes WCS correction for each CCD
using Gaia DR2, PSF photometry using DAOPHOT
(Stetson 1987, 1994), photometric zeropoint determina-
tion, and aperture correction. The photometric zero-
point of each exposure is estimated in the same man-
ner as for the NOIRLab Source Catalog (NSC; Nide-
ver et al. 2018, 2021a, 2020) using all-sky catalogs and
“model magnitudes”. Forced PSF photometry is then
performed on overlapping exposures that pass quality
cuts on seeing and zeropoints. DAOPHOT/ALLFRAME (Stet-
son 1994) is run on all CCD images overlapping each
0.25 deg×0.25 deg patch of sky (referred to as a “brick”
from the DECaLS tiling scheme) using a master source
list generated from a multi-band stacked image and
SourceExtractor. The ALLFRAME results are then cali-
DELVE DR1 9
brated using the zeropoints and aperture corrections de-
termined at the exposure level. Finally, weighted mean
magnitudes, coordinates, and photometric variability in-
dices are determined for each object using the measure-
ments from the multiple exposures.
3.3. DELVE-DEEP
DELVE-DEEP performs deep DECam imaging
around four isolated dwarf galaxies: Sextans B, NGC 55,
NGC 300, and IC 5152. DELVE-DEEP will achieve 5σ
depths of g = 26.0 mag and i = 25.0 mag for each tar-
get with total integrated exposure times of 4500 s in g
and 3000 s in i. The nominal depth can be achieved
in 15 × 300 s exposures in g and 10 × 300 s exposures
in i. However, three of the four DELVE-DEEP targets
(NGC 55, NGC 300, and IC 5152) reside in the DES foot-
print; thus, we decrease the required exposure time by
900 s to account for the existing DES data and target
12× 300 s g-band exposures and 7× 300 s i-band expo-
sures for these targets.
The DELVE-DEEP fields are chosen to roughly cover
the angular region corresponding to the virial radius of
the SMC (rvir ∼ 110 kpc; Dooley et al. 2017b) at the dis-
tance of each target (Table 1). This radius corresponds
to ∼ 3 deg for NGC 55, NGC 300, and IC 5152, but it
is significantly larger for Sextans B due to its proxim-
ity (∼ 4.4 deg). Covering this large of a region around
Sextans B is prohibitive given the DELVE-DEEP time
allocation, and the coverage around Sextans B was re-
duced to ∼ 3 deg.
Observations of each target start with the central
pointing and progress outward. Small dithers of ∼ 2′ are
applied in a hexagonal pattern to each tiling to cover the
gaps between CCDs. Star–galaxy separation is critical
to the DELVE-DEEP science, and observations are per-
formed only when the i-band zenith PSF is estimated to
have FWHM < 0.′′9. DELVE imaging for Sextans B was
completed in 2019A, and imaging of NGC 55 is ∼ 78%
complete as of 2020B. The DELVE-DEEP program has
collected 419 exposures as of 2021 January.
The DELVE-DEEP data are processed with the
DESDM image co-addition pipeline in a manner simi-
lar to the DES deep fields (Hartley & Choi et al. 2020).
While this has allowed for early visual inspection and
catalog analysis, the DESDM pipeline is not optimized
for stellar photometry in the crowded fields near the
DELVE-DEEP targets. We are exploring the use of
DELVERED to perform crowded-field stellar photometry
in the DELVE-DEEP fields.
4. DATA RELEASE
The first DELVE data release, DELVE DR1, is based
on new and archival DECam data collected as part
0.6 0.8 1.0 1.2 1.4 1.6 1.8 2.0
PSF FWHM (arcsec)
0.0
0.5
1.0
1.5
2.0
2.5
Nor
mal
ized
Nu
mb
erof
Exp
osu
res g
r
i
z
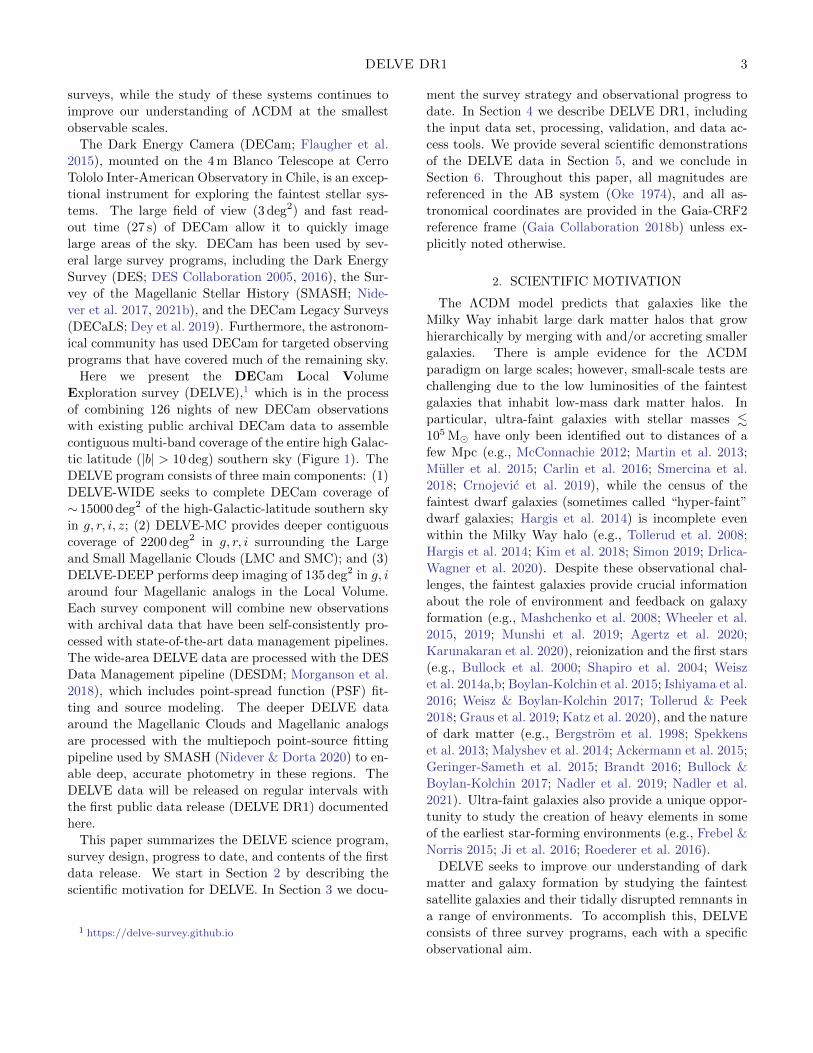
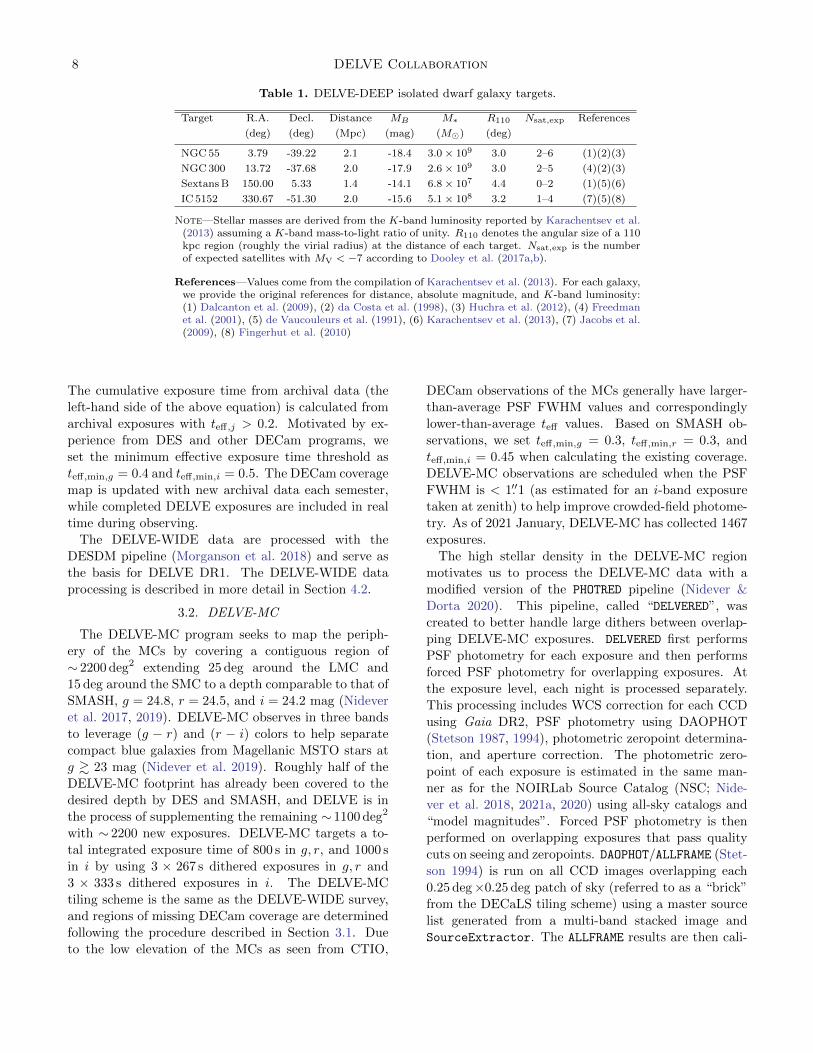
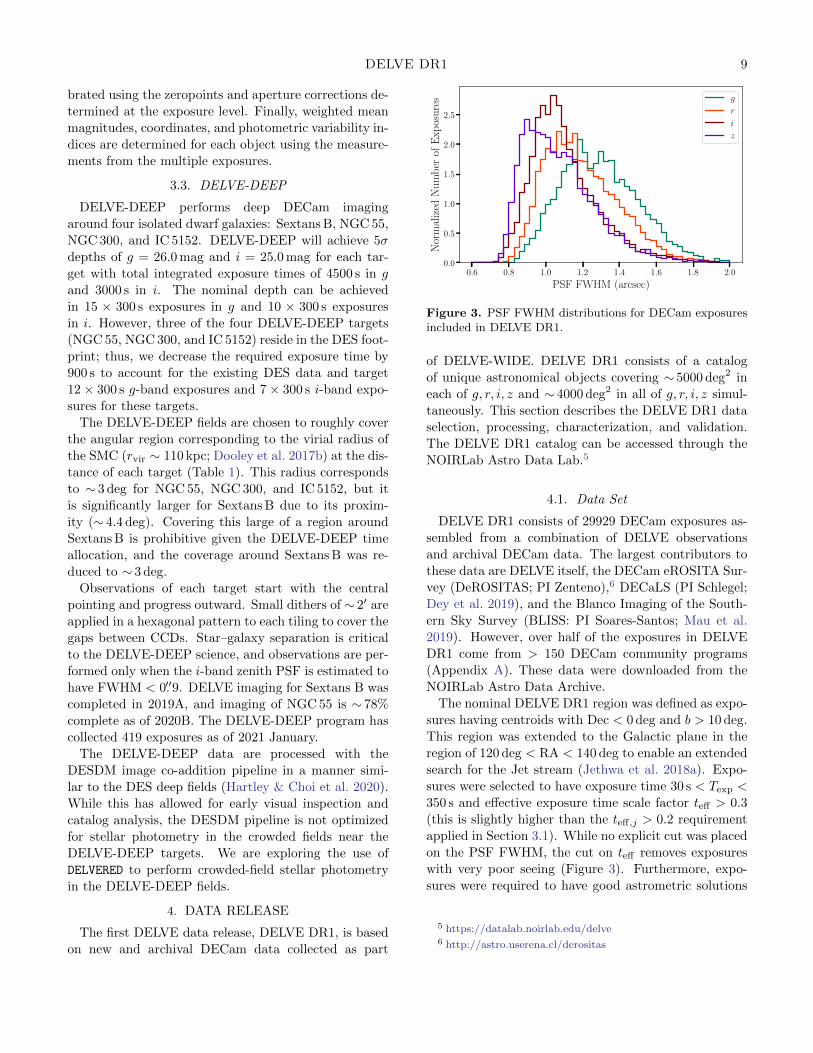
Figure 3. PSF FWHM distributions for DECam exposuresincluded in DELVE DR1.
of DELVE-WIDE. DELVE DR1 consists of a catalog
of unique astronomical objects covering ∼ 5000 deg2 in
each of g, r, i, z and ∼ 4000 deg2 in all of g, r, i, z simul-
taneously. This section describes the DELVE DR1 data
selection, processing, characterization, and validation.
The DELVE DR1 catalog can be accessed through the
NOIRLab Astro Data Lab.5
4.1. Data Set
DELVE DR1 consists of 29929 DECam exposures as-
sembled from a combination of DELVE observations
and archival DECam data. The largest contributors to
these data are DELVE itself, the DECam eROSITA Sur-
vey (DeROSITAS; PI Zenteno),6 DECaLS (PI Schlegel;
Dey et al. 2019), and the Blanco Imaging of the South-
ern Sky Survey (BLISS: PI Soares-Santos; Mau et al.
2019). However, over half of the exposures in DELVE
DR1 come from > 150 DECam community programs
(Appendix A). These data were downloaded from the
NOIRLab Astro Data Archive.
The nominal DELVE DR1 region was defined as expo-
sures having centroids with Dec < 0 deg and b > 10 deg.
This region was extended to the Galactic plane in the
region of 120 deg < RA < 140 deg to enable an extended
search for the Jet stream (Jethwa et al. 2018a). Expo-
sures were selected to have exposure time 30 s < Texp <
350 s and effective exposure time scale factor teff > 0.3
(this is slightly higher than the teff,j > 0.2 requirement
applied in Section 3.1). While no explicit cut was placed
on the PSF FWHM, the cut on teff removes exposures
with very poor seeing (Figure 3). Furthermore, expo-
sures were required to have good astrometric solutions
5 https://datalab.noirlab.edu/delve6 http://astro.userena.cl/derositas
10 DELVE Collaboration
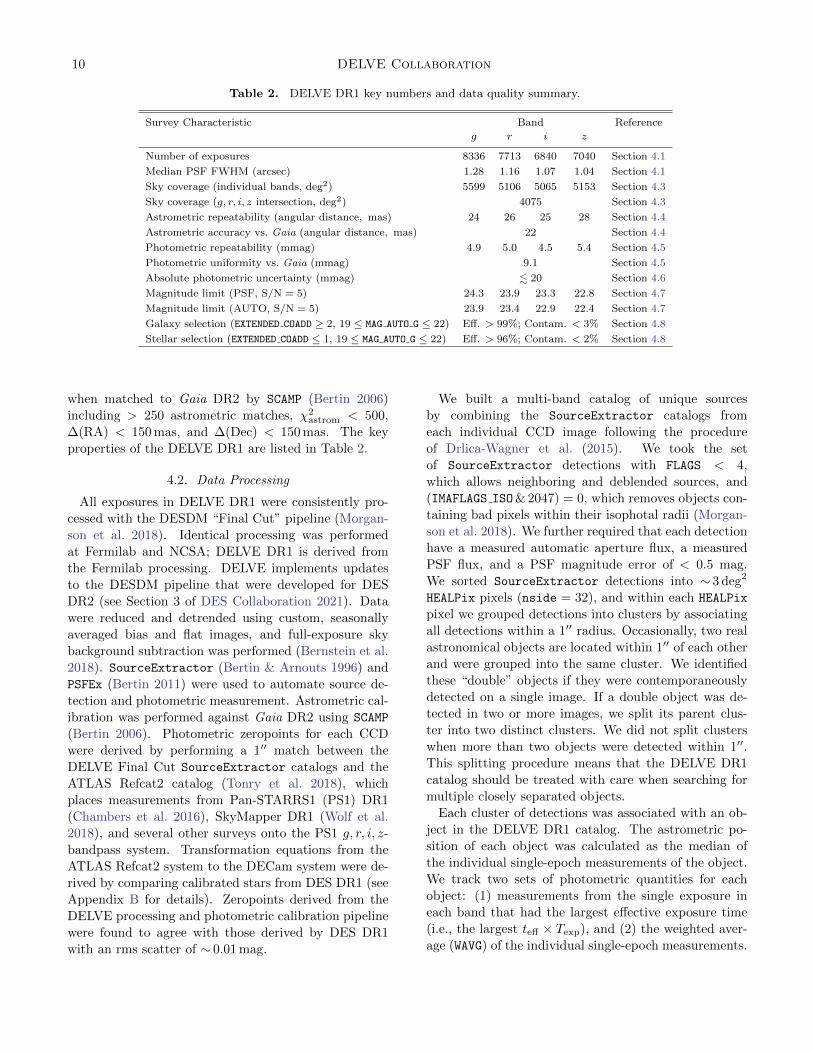
Table 2. DELVE DR1 key numbers and data quality summary.
Survey Characteristic Band Reference
g r i z
Number of exposures 8336 7713 6840 7040 Section 4.1
Median PSF FWHM (arcsec) 1.28 1.16 1.07 1.04 Section 4.1
Sky coverage (individual bands, deg2) 5599 5106 5065 5153 Section 4.3
Sky coverage (g, r, i, z intersection, deg2) 4075 Section 4.3
Astrometric repeatability (angular distance, mas) 24 26 25 28 Section 4.4
Astrometric accuracy vs. Gaia (angular distance, mas) 22 Section 4.4
Photometric repeatability (mmag) 4.9 5.0 4.5 5.4 Section 4.5
Photometric uniformity vs. Gaia (mmag) 9.1 Section 4.5
Absolute photometric uncertainty (mmag) . 20 Section 4.6
Magnitude limit (PSF, S/N = 5) 24.3 23.9 23.3 22.8 Section 4.7
Magnitude limit (AUTO, S/N = 5) 23.9 23.4 22.9 22.4 Section 4.7
Galaxy selection (EXTENDED COADD ≥ 2, 19 ≤ MAG AUTO G ≤ 22) Eff. > 99%; Contam. < 3% Section 4.8
Stellar selection (EXTENDED COADD ≤ 1, 19 ≤ MAG AUTO G ≤ 22) Eff. > 96%; Contam. < 2% Section 4.8
when matched to Gaia DR2 by SCAMP (Bertin 2006)
including > 250 astrometric matches, χ2astrom < 500,
∆(RA) < 150 mas, and ∆(Dec) < 150 mas. The key
properties of the DELVE DR1 are listed in Table 2.
4.2. Data Processing
All exposures in DELVE DR1 were consistently pro-
cessed with the DESDM “Final Cut” pipeline (Morgan-
son et al. 2018). Identical processing was performed
at Fermilab and NCSA; DELVE DR1 is derived from
the Fermilab processing. DELVE implements updates
to the DESDM pipeline that were developed for DES
DR2 (see Section 3 of DES Collaboration 2021). Data
were reduced and detrended using custom, seasonally
averaged bias and flat images, and full-exposure sky
background subtraction was performed (Bernstein et al.
2018). SourceExtractor (Bertin & Arnouts 1996) andPSFEx (Bertin 2011) were used to automate source de-
tection and photometric measurement. Astrometric cal-
ibration was performed against Gaia DR2 using SCAMP
(Bertin 2006). Photometric zeropoints for each CCD
were derived by performing a 1′′ match between the
DELVE Final Cut SourceExtractor catalogs and the
ATLAS Refcat2 catalog (Tonry et al. 2018), which
places measurements from Pan-STARRS1 (PS1) DR1
(Chambers et al. 2016), SkyMapper DR1 (Wolf et al.
2018), and several other surveys onto the PS1 g, r, i, z-
bandpass system. Transformation equations from the
ATLAS Refcat2 system to the DECam system were de-
rived by comparing calibrated stars from DES DR1 (see
Appendix B for details). Zeropoints derived from the
DELVE processing and photometric calibration pipeline
were found to agree with those derived by DES DR1
with an rms scatter of ∼ 0.01 mag.
We built a multi-band catalog of unique sources
by combining the SourceExtractor catalogs from
each individual CCD image following the procedure
of Drlica-Wagner et al. (2015). We took the set
of SourceExtractor detections with FLAGS < 4,
which allows neighboring and deblended sources, and
(IMAFLAGS ISO& 2047) = 0, which removes objects con-
taining bad pixels within their isophotal radii (Morgan-
son et al. 2018). We further required that each detection
have a measured automatic aperture flux, a measured
PSF flux, and a PSF magnitude error of < 0.5 mag.
We sorted SourceExtractor detections into ∼ 3 deg2
HEALPix pixels (nside = 32), and within each HEALPix
pixel we grouped detections into clusters by associating
all detections within a 1′′ radius. Occasionally, two real
astronomical objects are located within 1′′ of each other
and were grouped into the same cluster. We identified
these “double” objects if they were contemporaneously
detected on a single image. If a double object was de-
tected in two or more images, we split its parent clus-
ter into two distinct clusters. We did not split clusters
when more than two objects were detected within 1′′.
This splitting procedure means that the DELVE DR1
catalog should be treated with care when searching for
multiple closely separated objects.
Each cluster of detections was associated with an ob-
ject in the DELVE DR1 catalog. The astrometric po-
sition of each object was calculated as the median of
the individual single-epoch measurements of the object.
We track two sets of photometric quantities for each
object: (1) measurements from the single exposure in
each band that had the largest effective exposure time
(i.e., the largest teff × Texp), and (2) the weighted aver-
age (WAVG) of the individual single-epoch measurements.
DELVE DR1 11
The weighted average and unbiased weighted standard
deviation were calculated following the weighted sample
prescriptions used by DES (Gough 2009; DES Collabo-
ration 2021).7 In addition, we track cluster-level statis-
tics such as the number of detections in each band.
We follow the procedure of DES DR1 (DES Collabora-
tion 2018a) to calculate the interstellar extinction from
Milky Way foreground dust. We calculate the value
of E(B − V ) at the location of each catalog source by
performing a bi-linear interpolation in (RA,Dec) to the
maps of Schlegel et al. (1998). The reddening correction
for each source in each band, Ab = Rb × E(B − V ), is
calculated using the fiducial interstellar extinction co-
efficients from DES DR1: Rg = 3.185, Rr = 2.140,
Ri = 1.571, and Rz = 1.196 (DES Collaboration 2018a).
Note that, following the procedure of DES DR1, the
Schlafly & Finkbeiner (2011) calibration adjustment to
the Schlegel et al. (1998) maps is included in our fidu-
cial reddening coefficients. The Ab values are included
for each object in DELVE DR1 but are not applied to
the magnitude columns by default. The list of the pho-
tometric and astrometric properties provided in DELVE
DR1 can be found in Appendix C.
4.3. Sky Coverage
We quantify the area covered by DELVE DR1 in the
form of HEALPix maps with angular resolution of ∼ 0.′86
(nside = 4096). These maps were created by pixelizing
the geometry of each DECam CCD using the decasu8
package built on healsparse.9 This package calcu-
lates the geometry of each CCD using higher-resolution
nested HEALPix maps (nside = 16384) and sums the re-
sulting covered pixels to generate lower resolution maps
containing the fraction of each pixel that is covered by
the survey. This bypasses the computationally intensive
mangle processing done by DES (Swanson et al. 2008;
Morganson et al. 2018) while retaining the same accu-
racy at a resolution of nside = 4096. We quantitatively
estimate the covered area as the sum of the coverage
fraction maps in each band independently, as well as the
intersection of the maps in all four bands. These values
are reported in Table 2 and visualized in Appendix D.
4.4. Astrometry
We assess the internal astrometric accuracy by com-
paring the distributions of angular separations of indi-
vidual detections of the same objects over multiple expo-
7 https://www.gnu.org/software/gsl/doc/html/statistics.html#weighted-samples
8 https://github.com/erykoff/decasu9 https://healsparse.readthedocs.io
sures. The median global astrometric spread is 26 mas
across all bands. We find that this spread is fairly consis-
tent within each band, with median offsets in g, r, i, z of
24, 26, 25, 28 mas. Furthermore, we compare the DELVE
DR1 catalog-coadd object locations to the locations of
matched sources in the Gaia DR2 catalog (Gaia Collab-
oration 2018a), and we find an overall astrometric agree-
ment of 22 mas. This comparison is somewhat circular,
since the Gaia DR2 catalog was used for the image-level
astrometric calibration; however, the good agreement
confirms that no significant astrometric offsets have been
introduced by the catalog coaddition procedure.
4.5. Relative Photometric Calibration
We assess the photometric repeatability in each band
from the root-mean-square (rms) scatter between inde-
pendent PSF measurements of bright stars. For each
band, we select stars with 16 < WAVG MAG PSF < 18
mag and calculate the median rms scatter in ∼ 0.2 deg2
HEALPix pixels (nside = 128). We estimate the median
of the rms scatter over the entire footprint in each band.
This quantity is found to be ∼ 5 mmag and is listed for
each band in Table 2.
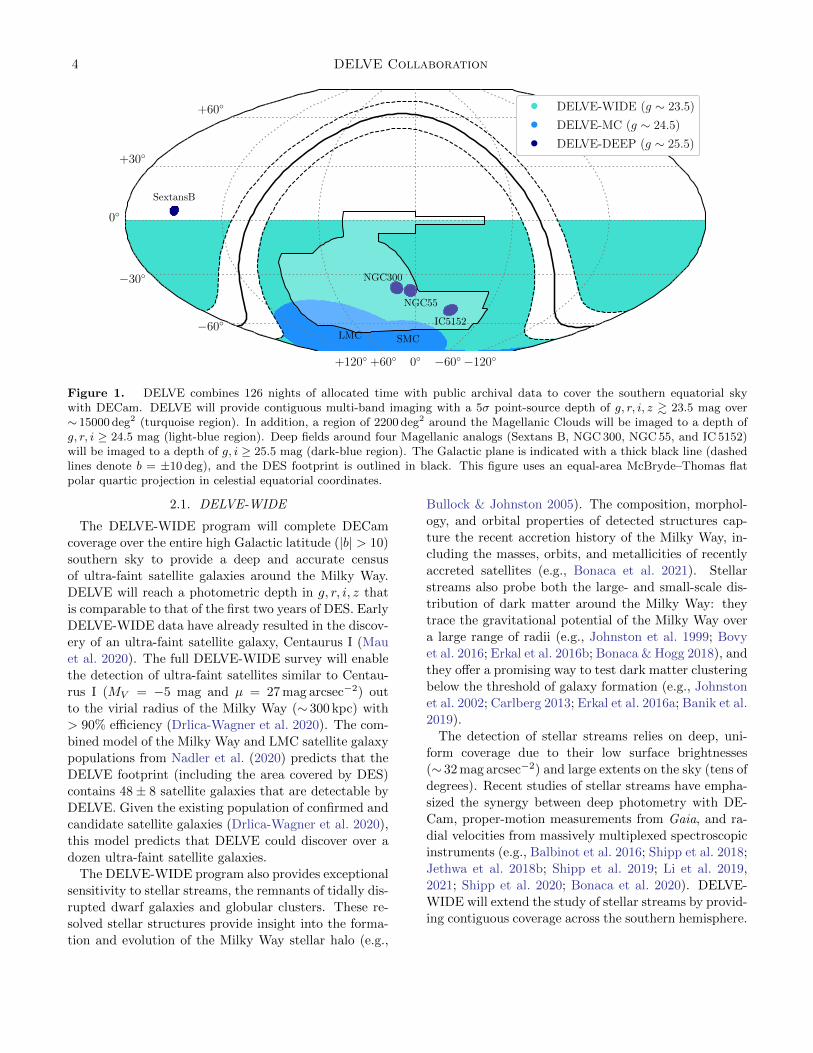
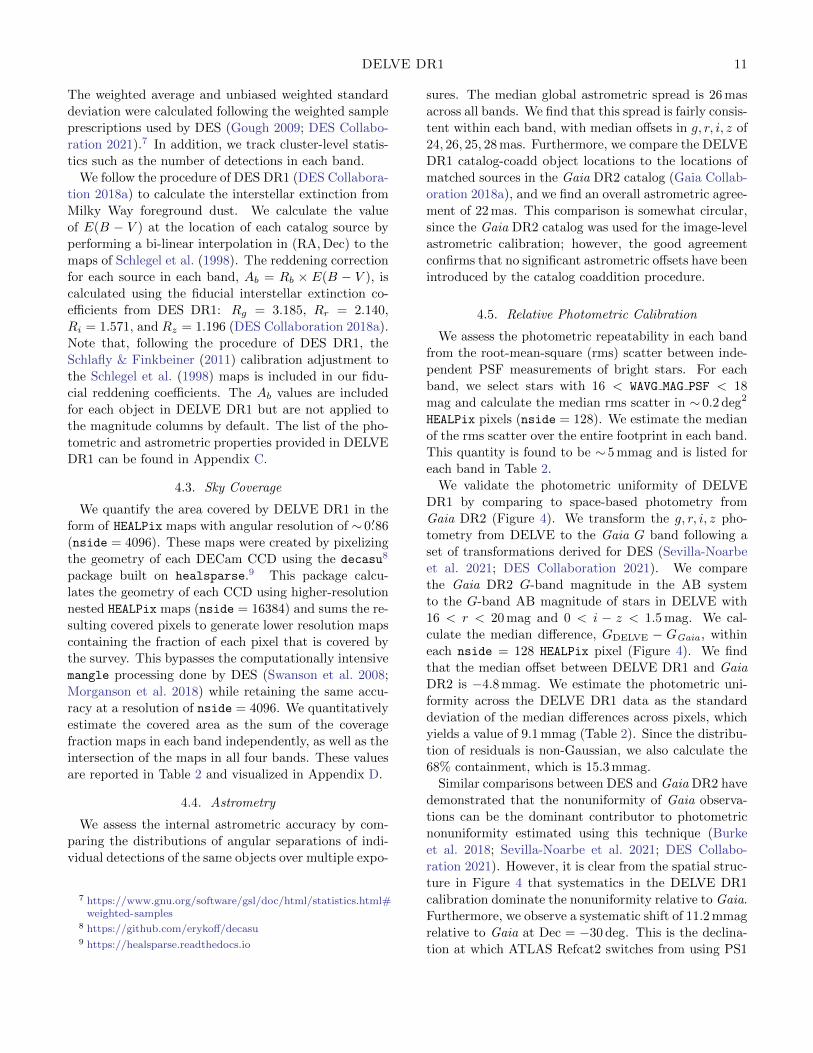
We validate the photometric uniformity of DELVE
DR1 by comparing to space-based photometry from
Gaia DR2 (Figure 4). We transform the g, r, i, z pho-
tometry from DELVE to the Gaia G band following a
set of transformations derived for DES (Sevilla-Noarbe
et al. 2021; DES Collaboration 2021). We compare
the Gaia DR2 G-band magnitude in the AB system
to the G-band AB magnitude of stars in DELVE with
16 < r < 20 mag and 0 < i − z < 1.5 mag. We cal-
culate the median difference, GDELVE − GGaia , within
each nside = 128 HEALPix pixel (Figure 4). We find
that the median offset between DELVE DR1 and Gaia
DR2 is −4.8 mmag. We estimate the photometric uni-
formity across the DELVE DR1 data as the standard
deviation of the median differences across pixels, which
yields a value of 9.1 mmag (Table 2). Since the distribu-
tion of residuals is non-Gaussian, we also calculate the
68% containment, which is 15.3 mmag.
Similar comparisons between DES and Gaia DR2 have
demonstrated that the nonuniformity of Gaia observa-
tions can be the dominant contributor to photometric
nonuniformity estimated using this technique (Burke
et al. 2018; Sevilla-Noarbe et al. 2021; DES Collabo-
ration 2021). However, it is clear from the spatial struc-
ture in Figure 4 that systematics in the DELVE DR1
calibration dominate the nonuniformity relative to Gaia.
Furthermore, we observe a systematic shift of 11.2 mmag
relative to Gaia at Dec = −30 deg. This is the declina-
tion at which ATLAS Refcat2 switches from using PS1
12 DELVE Collaboration
270◦300◦330◦ 30◦60◦90◦120◦150◦180◦210◦240◦
Right Ascension
−75◦−75◦
−60◦−60◦
−45◦
−30◦
−15◦
0◦
Dec
linat
ion
−0.016 −0.002 0.012GDELVE −GGaia
−0.015 0.000 0.015GDELVE −GGaia
15
30
45
60
Nor
mal
ized
Are
a
Figure 4. Median difference between the DELVE DR1 photometry transformed into the Gaia G-band, GDELVE, and themeasured Gaia magnitude, GGaia . The spatial distribution of the median difference in each pixel is shown in the left panel,while the right panel shows a histogram of the pixel values. A shift in the zeropoint can be seen at Dec ∼ −30 deg, whichcorresponds to the boundary between the ATLAS Refcat2 use of PS1 and SkyMapper (Section 4.5). This comparison isrestricted to the area with overlapping DELVE DR1 coverage in all four bands (g, r, i, z).
to SkyMapper, and a similar feature can be seen in the
residuals of Figure 3 in Tonry et al. (2018). This off-
set is the dominant contributor to the broadening of
the residuals between DELVE DR1 and Gaia DR2 seen
in the left panel of Figure 4. The relative photometric
calibration of DELVE could be improved in the future
by performing an internal relative calibration such as
the “ubercalibration” of SDSS and PS1 (Padmanabhan
et al. 2008; Schlafly et al. 2012), or the forward global
calibration of DES (i.e., Burke et al. 2018).
4.6. Absolute Photometric Calibration
We do not have a precise estimate of the absolute pho-
tometric calibration of DELVE DR1, but a rough esti-
mate can be derived by comparing to other data sets.
The absolute photometry of DELVE DR1 is tied to the
HST CalSpec standard star C26202 via DES DR2, which
was used to adjust the zeropoints of the ATLAS Refcat2
transformation equations (Appendix B). Thus, DELVE
DR1 cannot have a better absolute calibration than DES
DR2, which sets a lower limit on the statistical uncer-
tainty of 2.2 mmag per band and a systematic uncer-
tainty of 11 to 12 mmag per band (see Table 1 of DES
Collaboration 2021). The global offset between DELVE
DR1 and Gaia DR2 (which is not seen in DES DR2)
suggests that the absolute calibration cannot be better
than 4.8 mmag. Combining the maximum systematic
uncertainty on the absolute calibration from DES DR2
and the DELVE DR1 offset relative to Gaia, we conser-
vatively estimate that the absolute photometric accu-
racy of DELVE DR1 is . 20 mmag. This is comparable
to the absolute photometric accuracy estimated for the
DES first-year cosmology data set (Drlica-Wagner et al.
2018). In the future, the absolute photometric calibra-
tion of DELVE can be improved and verified directly
following a similar procedure to DES DR2 using HST
CalSpec standards and/or pure hydrogen atmosphere
white dwarf stars (DES Collaboration 2021).
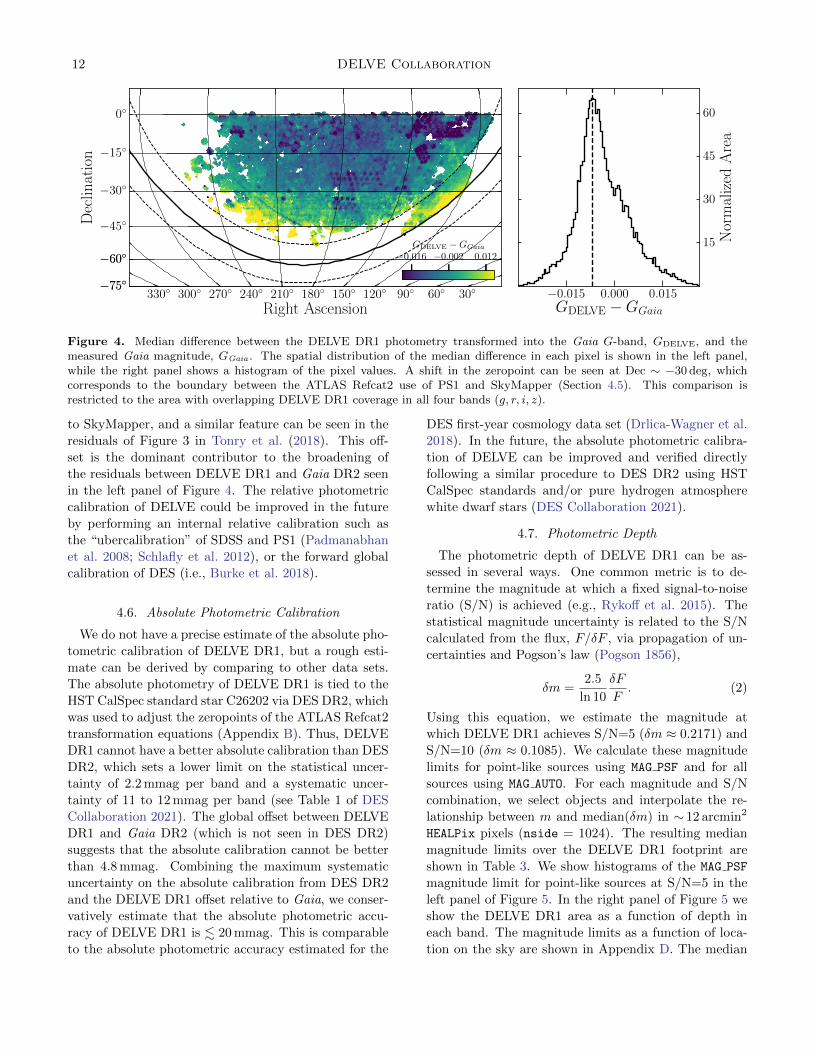
4.7. Photometric Depth
The photometric depth of DELVE DR1 can be as-
sessed in several ways. One common metric is to de-
termine the magnitude at which a fixed signal-to-noise
ratio (S/N) is achieved (e.g., Rykoff et al. 2015). The
statistical magnitude uncertainty is related to the S/N
calculated from the flux, F/δF , via propagation of un-
certainties and Pogson’s law (Pogson 1856),
δm =2.5
ln 10
δF
F. (2)
Using this equation, we estimate the magnitude at
which DELVE DR1 achieves S/N=5 (δm ≈ 0.2171) and
S/N=10 (δm ≈ 0.1085). We calculate these magnitude
limits for point-like sources using MAG PSF and for all
sources using MAG AUTO. For each magnitude and S/N
combination, we select objects and interpolate the re-
lationship between m and median(δm) in ∼ 12 arcmin2
HEALPix pixels (nside = 1024). The resulting median
magnitude limits over the DELVE DR1 footprint are
shown in Table 3. We show histograms of the MAG PSF
magnitude limit for point-like sources at S/N=5 in the
left panel of Figure 5. In the right panel of Figure 5 we
show the DELVE DR1 area as a function of depth in
each band. The magnitude limits as a function of loca-
tion on the sky are shown in Appendix D. The median
DELVE DR1 13
21 22 23 24 25 26
Magnitude Limit (PSF, S/N=5)
0.00
0.25
0.50
0.75
1.00
1.25
1.50
1.75
2.00
Nor
mal
ized
Are
a
g
r
i
z
21 22 23 24 25 26
Magnitude Limit (PSF, S/N=5)
0
1000
2000
3000
4000
5000
Are
a(d
eg2)
g
r
i
z
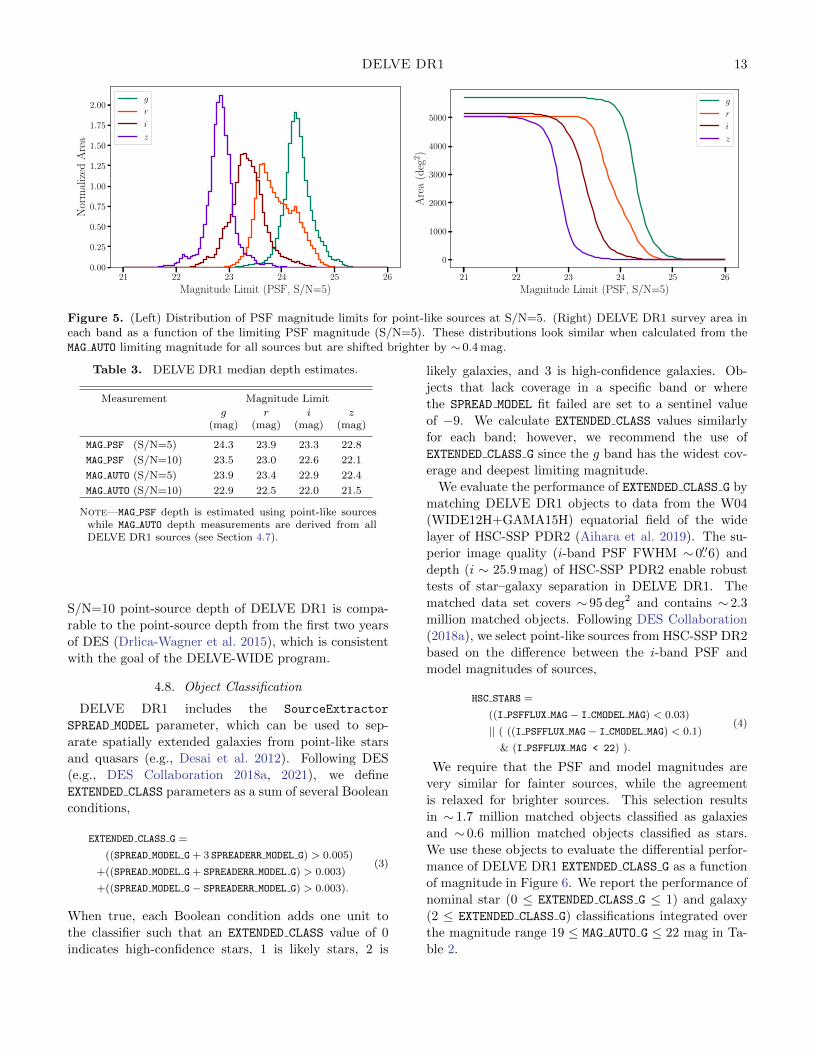
Figure 5. (Left) Distribution of PSF magnitude limits for point-like sources at S/N=5. (Right) DELVE DR1 survey area ineach band as a function of the limiting PSF magnitude (S/N=5). These distributions look similar when calculated from theMAG AUTO limiting magnitude for all sources but are shifted brighter by ∼ 0.4 mag.
Table 3. DELVE DR1 median depth estimates.
Measurement Magnitude Limit
g r i z(mag) (mag) (mag) (mag)
MAG PSF (S/N=5) 24.3 23.9 23.3 22.8
MAG PSF (S/N=10) 23.5 23.0 22.6 22.1
MAG AUTO (S/N=5) 23.9 23.4 22.9 22.4
MAG AUTO (S/N=10) 22.9 22.5 22.0 21.5
Note—MAG PSF depth is estimated using point-like sourceswhile MAG AUTO depth measurements are derived from allDELVE DR1 sources (see Section 4.7).
S/N=10 point-source depth of DELVE DR1 is compa-
rable to the point-source depth from the first two years
of DES (Drlica-Wagner et al. 2015), which is consistent
with the goal of the DELVE-WIDE program.
4.8. Object Classification
DELVE DR1 includes the SourceExtractor
SPREAD MODEL parameter, which can be used to sep-
arate spatially extended galaxies from point-like stars
and quasars (e.g., Desai et al. 2012). Following DES
(e.g., DES Collaboration 2018a, 2021), we define
EXTENDED CLASS parameters as a sum of several Boolean
conditions,
EXTENDED CLASS G =
((SPREAD MODEL G + 3 SPREADERR MODEL G) > 0.005)
+((SPREAD MODEL G + SPREADERR MODEL G) > 0.003)
+((SPREAD MODEL G− SPREADERR MODEL G) > 0.003).
(3)
When true, each Boolean condition adds one unit to
the classifier such that an EXTENDED CLASS value of 0
indicates high-confidence stars, 1 is likely stars, 2 is
likely galaxies, and 3 is high-confidence galaxies. Ob-
jects that lack coverage in a specific band or where
the SPREAD MODEL fit failed are set to a sentinel value
of −9. We calculate EXTENDED CLASS values similarly
for each band; however, we recommend the use of
EXTENDED CLASS G since the g band has the widest cov-
erage and deepest limiting magnitude.
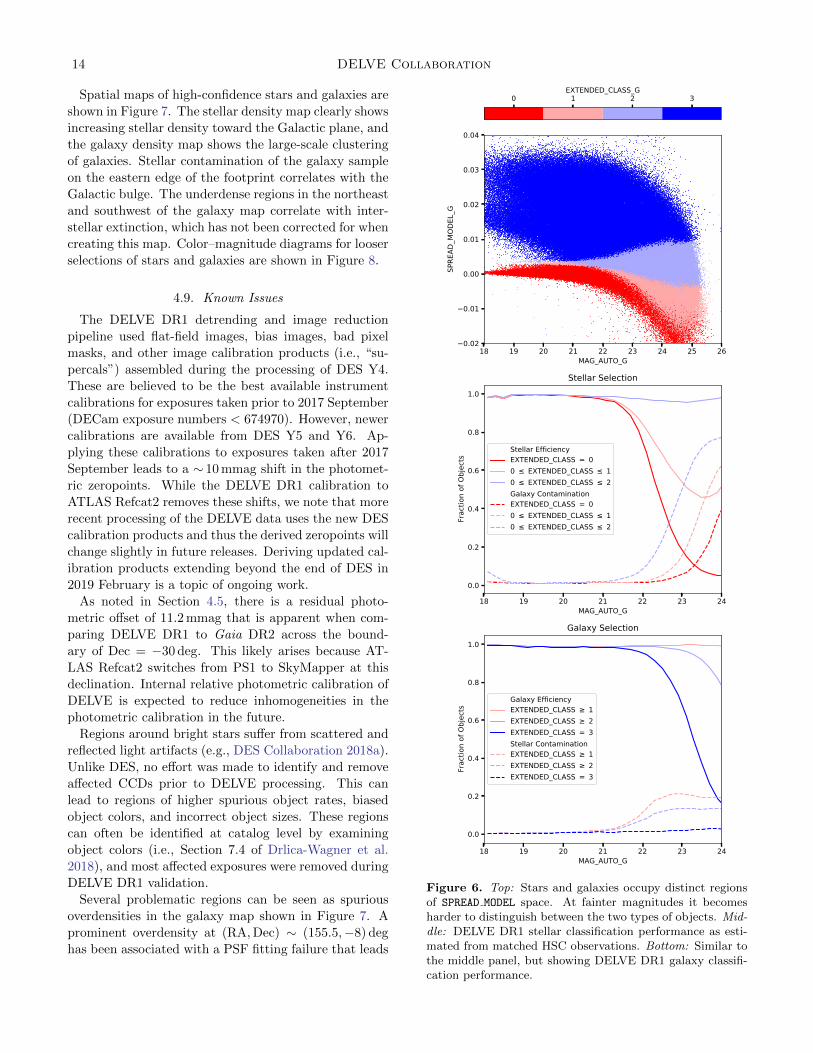
We evaluate the performance of EXTENDED CLASS G by
matching DELVE DR1 objects to data from the W04
(WIDE12H+GAMA15H) equatorial field of the wide
layer of HSC-SSP PDR2 (Aihara et al. 2019). The su-
perior image quality (i-band PSF FWHM ∼ 0.′′6) and
depth (i ∼ 25.9 mag) of HSC-SSP PDR2 enable robust
tests of star–galaxy separation in DELVE DR1. The
matched data set covers ∼ 95 deg2 and contains ∼ 2.3
million matched objects. Following DES Collaboration
(2018a), we select point-like sources from HSC-SSP DR2
based on the difference between the i-band PSF and
model magnitudes of sources,
HSC STARS =
((I PSFFLUX MAG− I CMODEL MAG) < 0.03)
|| ( ((I PSFFLUX MAG− I CMODEL MAG) < 0.1)
& (I PSFFLUX MAG < 22) ).
(4)
We require that the PSF and model magnitudes are
very similar for fainter sources, while the agreement
is relaxed for brighter sources. This selection results
in ∼ 1.7 million matched objects classified as galaxies
and ∼ 0.6 million matched objects classified as stars.
We use these objects to evaluate the differential perfor-
mance of DELVE DR1 EXTENDED CLASS G as a function
of magnitude in Figure 6. We report the performance of
nominal star (0 ≤ EXTENDED CLASS G ≤ 1) and galaxy
(2 ≤ EXTENDED CLASS G) classifications integrated over
the magnitude range 19 ≤ MAG AUTO G ≤ 22 mag in Ta-
ble 2.
14 DELVE Collaboration
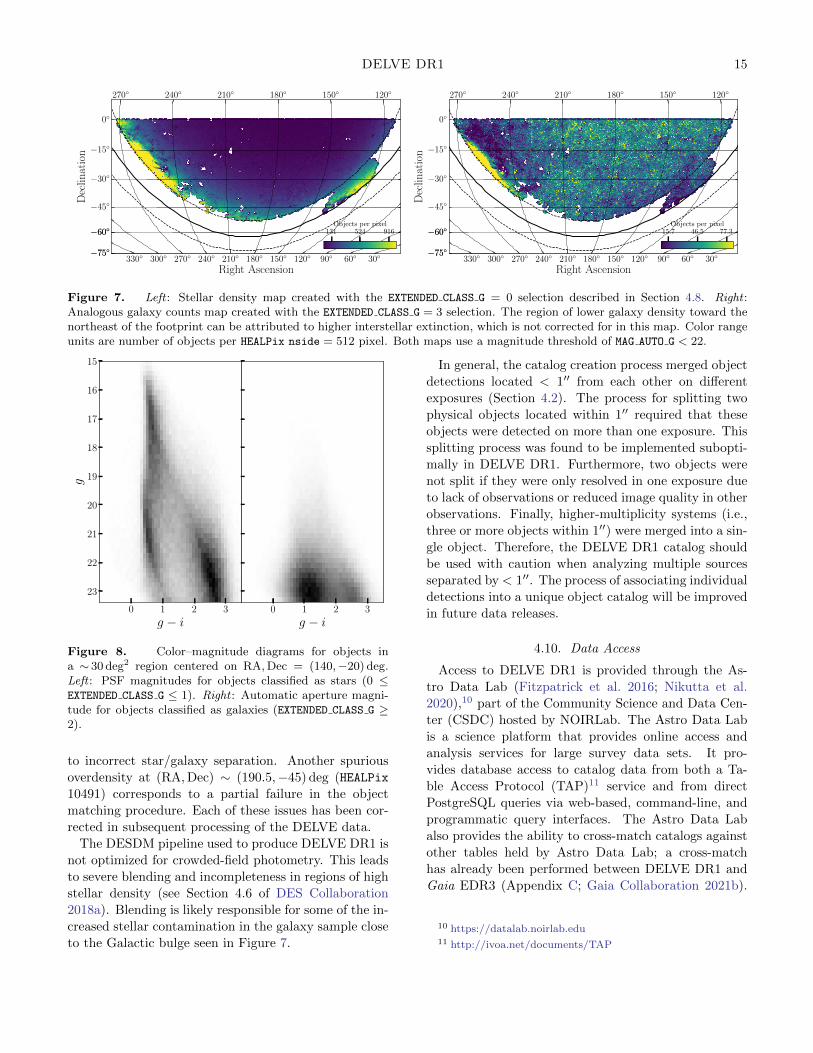
Spatial maps of high-confidence stars and galaxies are
shown in Figure 7. The stellar density map clearly shows
increasing stellar density toward the Galactic plane, and
the galaxy density map shows the large-scale clustering
of galaxies. Stellar contamination of the galaxy sample
on the eastern edge of the footprint correlates with the
Galactic bulge. The underdense regions in the northeast
and southwest of the galaxy map correlate with inter-
stellar extinction, which has not been corrected for when
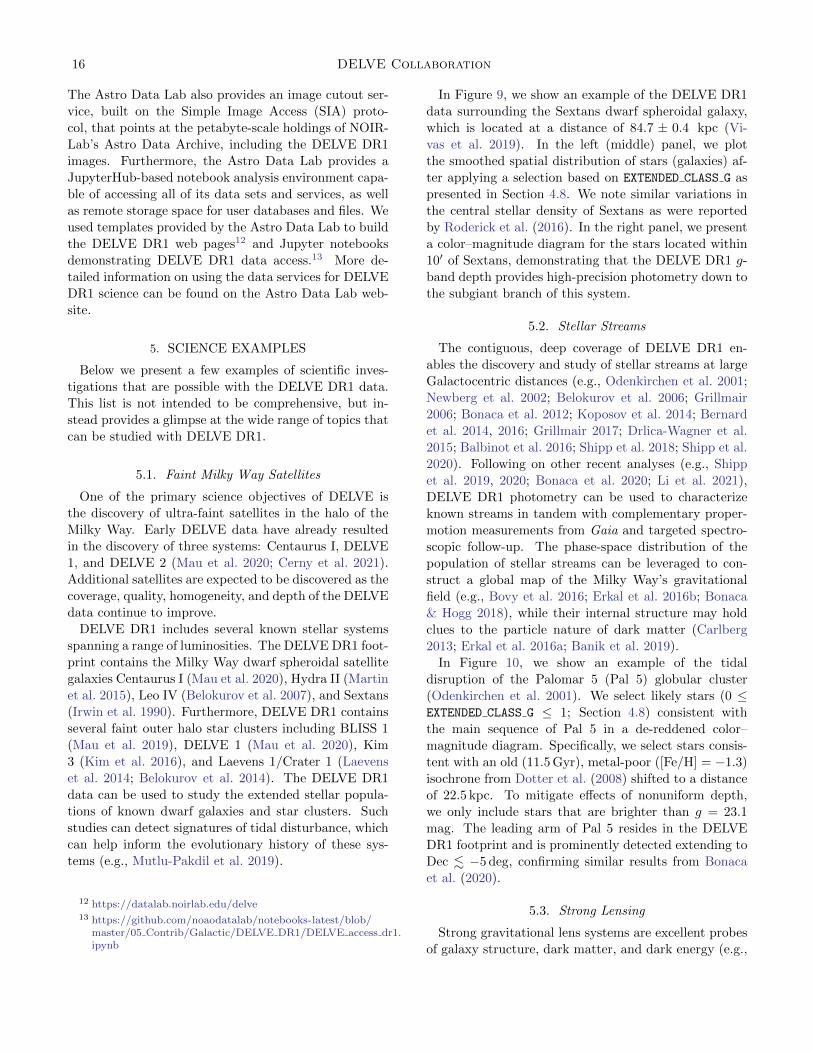
creating this map. Color–magnitude diagrams for looser
selections of stars and galaxies are shown in Figure 8.
4.9. Known Issues
The DELVE DR1 detrending and image reduction
pipeline used flat-field images, bias images, bad pixel
masks, and other image calibration products (i.e., “su-
percals”) assembled during the processing of DES Y4.
These are believed to be the best available instrument
calibrations for exposures taken prior to 2017 September
(DECam exposure numbers < 674970). However, newer
calibrations are available from DES Y5 and Y6. Ap-
plying these calibrations to exposures taken after 2017
September leads to a ∼ 10 mmag shift in the photomet-
ric zeropoints. While the DELVE DR1 calibration to
ATLAS Refcat2 removes these shifts, we note that more
recent processing of the DELVE data uses the new DES
calibration products and thus the derived zeropoints will
change slightly in future releases. Deriving updated cal-
ibration products extending beyond the end of DES in
2019 February is a topic of ongoing work.
As noted in Section 4.5, there is a residual photo-
metric offset of 11.2 mmag that is apparent when com-
paring DELVE DR1 to Gaia DR2 across the bound-
ary of Dec = −30 deg. This likely arises because AT-
LAS Refcat2 switches from PS1 to SkyMapper at this
declination. Internal relative photometric calibration of
DELVE is expected to reduce inhomogeneities in the
photometric calibration in the future.
Regions around bright stars suffer from scattered and
reflected light artifacts (e.g., DES Collaboration 2018a).
Unlike DES, no effort was made to identify and remove
affected CCDs prior to DELVE processing. This can
lead to regions of higher spurious object rates, biased
object colors, and incorrect object sizes. These regions
can often be identified at catalog level by examining
object colors (i.e., Section 7.4 of Drlica-Wagner et al.
2018), and most affected exposures were removed during
DELVE DR1 validation.
Several problematic regions can be seen as spurious
overdensities in the galaxy map shown in Figure 7. A
prominent overdensity at (RA,Dec) ∼ (155.5,−8) deg
has been associated with a PSF fitting failure that leads
18 19 20 21 22 23 24 25 26MAG_AUTO_G
0.02
0.01
0.00
0.01
0.02
0.03
0.04
SPRE
AD_M
ODEL
_G
18 19 20 21 22 23 24MAG_AUTO_G
0.0
0.2
0.4
0.6
0.8
1.0
Frac
tion
of O
bjec
ts
Stellar Selection
Stellar EfficiencyEXTENDED_CLASS = 00 EXTENDED_CLASS 10 EXTENDED_CLASS 2Galaxy ContaminationEXTENDED_CLASS = 00 EXTENDED_CLASS 10 EXTENDED_CLASS 2
18 19 20 21 22 23 24MAG_AUTO_G
0.0
0.2
0.4
0.6
0.8
1.0
Frac
tion
of O
bjec
ts
Galaxy Selection
Galaxy EfficiencyEXTENDED_CLASS 1EXTENDED_CLASS 2EXTENDED_CLASS = 3Stellar ContaminationEXTENDED_CLASS 1EXTENDED_CLASS 2EXTENDED_CLASS = 3
0 1 2 3EXTENDED_CLASS_G
Figure 6. Top: Stars and galaxies occupy distinct regionsof SPREAD MODEL space. At fainter magnitudes it becomesharder to distinguish between the two types of objects. Mid-dle: DELVE DR1 stellar classification performance as esti-mated from matched HSC observations. Bottom: Similar tothe middle panel, but showing DELVE DR1 galaxy classifi-cation performance.
DELVE DR1 15
270◦300◦330◦ 30◦60◦90◦120◦150◦180◦210◦240◦
Right Ascension
270◦ 120◦150◦180◦210◦240◦
−75◦−75◦
−60◦−60◦
−45◦
−30◦
−15◦
0◦
Dec
linat
ion
131 524 916Objects per pixel
270◦300◦330◦ 30◦60◦90◦120◦150◦180◦210◦240◦
Right Ascension
270◦ 120◦150◦180◦210◦240◦
−75◦−75◦
−60◦−60◦
−45◦
−30◦
−15◦
0◦
Dec
linat
ion
15.7 46.5 77.3Objects per pixel
Figure 7. Left : Stellar density map created with the EXTENDED CLASS G = 0 selection described in Section 4.8. Right :Analogous galaxy counts map created with the EXTENDED CLASS G = 3 selection. The region of lower galaxy density toward thenortheast of the footprint can be attributed to higher interstellar extinction, which is not corrected for in this map. Color rangeunits are number of objects per HEALPix nside = 512 pixel. Both maps use a magnitude threshold of MAG AUTO G < 22.
0 1 2 3
g − i
15
16
17
18
19
20
21
22
23
g
0 1 2 3
g − i
Figure 8. Color–magnitude diagrams for objects ina ∼ 30 deg2 region centered on RA,Dec = (140,−20) deg.Left : PSF magnitudes for objects classified as stars (0 ≤EXTENDED CLASS G ≤ 1). Right : Automatic aperture magni-tude for objects classified as galaxies (EXTENDED CLASS G ≥2).
to incorrect star/galaxy separation. Another spurious
overdensity at (RA,Dec) ∼ (190.5,−45) deg (HEALPix
10491) corresponds to a partial failure in the object
matching procedure. Each of these issues has been cor-
rected in subsequent processing of the DELVE data.
The DESDM pipeline used to produce DELVE DR1 is
not optimized for crowded-field photometry. This leads
to severe blending and incompleteness in regions of high
stellar density (see Section 4.6 of DES Collaboration
2018a). Blending is likely responsible for some of the in-
creased stellar contamination in the galaxy sample close
to the Galactic bulge seen in Figure 7.
In general, the catalog creation process merged object
detections located < 1′′ from each other on different
exposures (Section 4.2). The process for splitting two
physical objects located within 1′′ required that these
objects were detected on more than one exposure. This
splitting process was found to be implemented subopti-
mally in DELVE DR1. Furthermore, two objects were
not split if they were only resolved in one exposure due
to lack of observations or reduced image quality in other
observations. Finally, higher-multiplicity systems (i.e.,
three or more objects within 1′′) were merged into a sin-
gle object. Therefore, the DELVE DR1 catalog should
be used with caution when analyzing multiple sources
separated by < 1′′. The process of associating individual
detections into a unique object catalog will be improved
in future data releases.
4.10. Data Access
Access to DELVE DR1 is provided through the As-
tro Data Lab (Fitzpatrick et al. 2016; Nikutta et al.
2020),10 part of the Community Science and Data Cen-
ter (CSDC) hosted by NOIRLab. The Astro Data Lab
is a science platform that provides online access and
analysis services for large survey data sets. It pro-
vides database access to catalog data from both a Ta-
ble Access Protocol (TAP)11 service and from direct
PostgreSQL queries via web-based, command-line, and
programmatic query interfaces. The Astro Data Lab
also provides the ability to cross-match catalogs against
other tables held by Astro Data Lab; a cross-match
has already been performed between DELVE DR1 and
Gaia EDR3 (Appendix C; Gaia Collaboration 2021b).
10 https://datalab.noirlab.edu11 http://ivoa.net/documents/TAP
16 DELVE Collaboration
The Astro Data Lab also provides an image cutout ser-
vice, built on the Simple Image Access (SIA) proto-
col, that points at the petabyte-scale holdings of NOIR-
Lab’s Astro Data Archive, including the DELVE DR1
images. Furthermore, the Astro Data Lab provides a
JupyterHub-based notebook analysis environment capa-
ble of accessing all of its data sets and services, as well
as remote storage space for user databases and files. We
used templates provided by the Astro Data Lab to build
the DELVE DR1 web pages12 and Jupyter notebooks
demonstrating DELVE DR1 data access.13 More de-
tailed information on using the data services for DELVE
DR1 science can be found on the Astro Data Lab web-
site.
5. SCIENCE EXAMPLES
Below we present a few examples of scientific inves-
tigations that are possible with the DELVE DR1 data.
This list is not intended to be comprehensive, but in-
stead provides a glimpse at the wide range of topics that
can be studied with DELVE DR1.
5.1. Faint Milky Way Satellites
One of the primary science objectives of DELVE is
the discovery of ultra-faint satellites in the halo of the
Milky Way. Early DELVE data have already resulted
in the discovery of three systems: Centaurus I, DELVE
1, and DELVE 2 (Mau et al. 2020; Cerny et al. 2021).
Additional satellites are expected to be discovered as the
coverage, quality, homogeneity, and depth of the DELVE
data continue to improve.
DELVE DR1 includes several known stellar systems
spanning a range of luminosities. The DELVE DR1 foot-
print contains the Milky Way dwarf spheroidal satellite
galaxies Centaurus I (Mau et al. 2020), Hydra II (Martin
et al. 2015), Leo IV (Belokurov et al. 2007), and Sextans
(Irwin et al. 1990). Furthermore, DELVE DR1 contains
several faint outer halo star clusters including BLISS 1
(Mau et al. 2019), DELVE 1 (Mau et al. 2020), Kim
3 (Kim et al. 2016), and Laevens 1/Crater 1 (Laevens
et al. 2014; Belokurov et al. 2014). The DELVE DR1
data can be used to study the extended stellar popula-
tions of known dwarf galaxies and star clusters. Such
studies can detect signatures of tidal disturbance, which
can help inform the evolutionary history of these sys-
tems (e.g., Mutlu-Pakdil et al. 2019).
12 https://datalab.noirlab.edu/delve13 https://github.com/noaodatalab/notebooks-latest/blob/
master/05 Contrib/Galactic/DELVE DR1/DELVE access dr1.ipynb
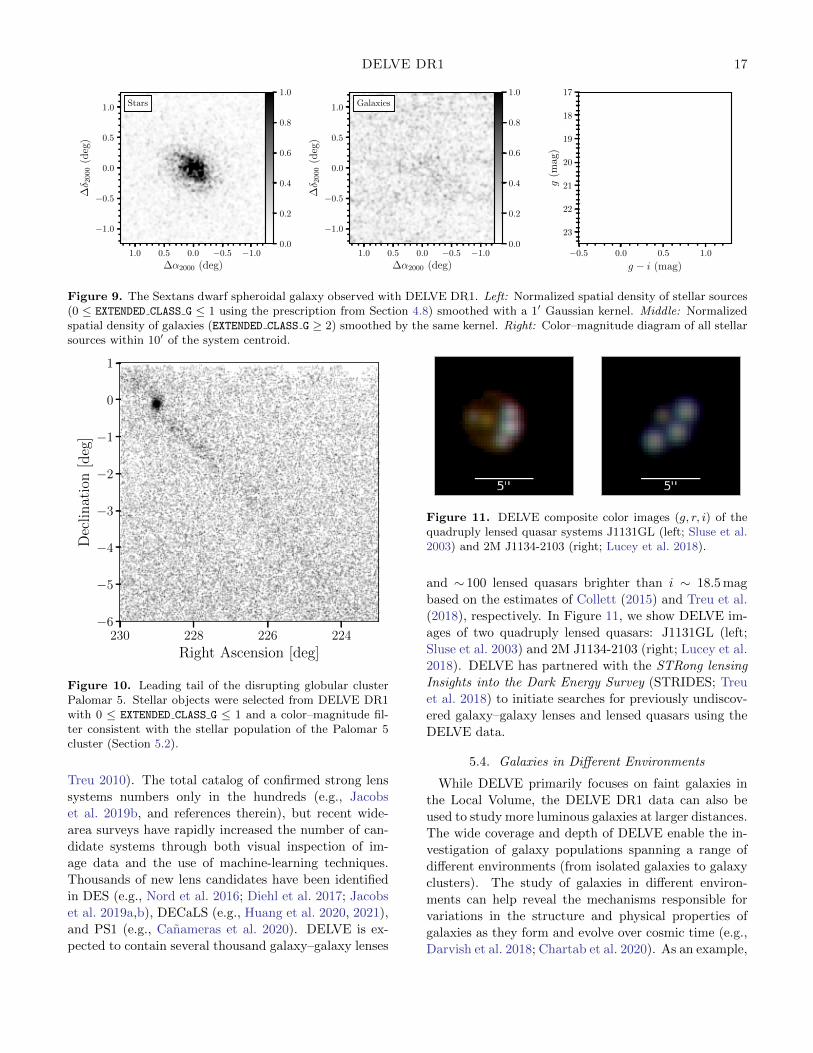
In Figure 9, we show an example of the DELVE DR1
data surrounding the Sextans dwarf spheroidal galaxy,
which is located at a distance of 84.7 ± 0.4 kpc (Vi-
vas et al. 2019). In the left (middle) panel, we plot
the smoothed spatial distribution of stars (galaxies) af-
ter applying a selection based on EXTENDED CLASS G as
presented in Section 4.8. We note similar variations in
the central stellar density of Sextans as were reported
by Roderick et al. (2016). In the right panel, we present
a color–magnitude diagram for the stars located within
10′ of Sextans, demonstrating that the DELVE DR1 g-
band depth provides high-precision photometry down to
the subgiant branch of this system.
5.2. Stellar Streams
The contiguous, deep coverage of DELVE DR1 en-
ables the discovery and study of stellar streams at large
Galactocentric distances (e.g., Odenkirchen et al. 2001;
Newberg et al. 2002; Belokurov et al. 2006; Grillmair
2006; Bonaca et al. 2012; Koposov et al. 2014; Bernard
et al. 2014, 2016; Grillmair 2017; Drlica-Wagner et al.
2015; Balbinot et al. 2016; Shipp et al. 2018; Shipp et al.
2020). Following on other recent analyses (e.g., Shipp
et al. 2019, 2020; Bonaca et al. 2020; Li et al. 2021),
DELVE DR1 photometry can be used to characterize
known streams in tandem with complementary proper-
motion measurements from Gaia and targeted spectro-
scopic follow-up. The phase-space distribution of the
population of stellar streams can be leveraged to con-
struct a global map of the Milky Way’s gravitational
field (e.g., Bovy et al. 2016; Erkal et al. 2016b; Bonaca
& Hogg 2018), while their internal structure may hold
clues to the particle nature of dark matter (Carlberg
2013; Erkal et al. 2016a; Banik et al. 2019).
In Figure 10, we show an example of the tidal
disruption of the Palomar 5 (Pal 5) globular cluster
(Odenkirchen et al. 2001). We select likely stars (0 ≤EXTENDED CLASS G ≤ 1; Section 4.8) consistent with
the main sequence of Pal 5 in a de-reddened color–
magnitude diagram. Specifically, we select stars consis-
tent with an old (11.5 Gyr), metal-poor ([Fe/H] = −1.3)
isochrone from Dotter et al. (2008) shifted to a distance
of 22.5 kpc. To mitigate effects of nonuniform depth,
we only include stars that are brighter than g = 23.1
mag. The leading arm of Pal 5 resides in the DELVE
DR1 footprint and is prominently detected extending to
Dec . −5 deg, confirming similar results from Bonaca
et al. (2020).
5.3. Strong Lensing
Strong gravitational lens systems are excellent probes
of galaxy structure, dark matter, and dark energy (e.g.,
DELVE DR1 17
−1.0−0.50.00.51.0
∆α2000 (deg)
−1.0
−0.5
0.0
0.5
1.0
∆δ 2
000
(deg
)
Stars
−1.0−0.50.00.51.0
∆α2000 (deg)
−1.0
−0.5
0.0
0.5
1.0
∆δ 2
000
(deg
)
Galaxies
−0.5 0.0 0.5 1.0
g − i (mag)
17
18
19
20
21
22
23
g(m
ag)
0.0
0.2
0.4
0.6
0.8
1.0
0.0
0.2
0.4
0.6
0.8
1.0
Figure 9. The Sextans dwarf spheroidal galaxy observed with DELVE DR1. Left: Normalized spatial density of stellar sources(0 ≤ EXTENDED CLASS G ≤ 1 using the prescription from Section 4.8) smoothed with a 1′ Gaussian kernel. Middle: Normalizedspatial density of galaxies (EXTENDED CLASS G ≥ 2) smoothed by the same kernel. Right: Color–magnitude diagram of all stellarsources within 10′ of the system centroid.
224226228230
Right Ascension [deg]
−6
−5
−4
−3
−2
−1
0
1
Dec
lin
atio
n[d
eg]
Figure 10. Leading tail of the disrupting globular clusterPalomar 5. Stellar objects were selected from DELVE DR1with 0 ≤ EXTENDED CLASS G ≤ 1 and a color–magnitude fil-ter consistent with the stellar population of the Palomar 5cluster (Section 5.2).
Treu 2010). The total catalog of confirmed strong lens
systems numbers only in the hundreds (e.g., Jacobs
et al. 2019b, and references therein), but recent wide-
area surveys have rapidly increased the number of can-
didate systems through both visual inspection of im-
age data and the use of machine-learning techniques.
Thousands of new lens candidates have been identified
in DES (e.g., Nord et al. 2016; Diehl et al. 2017; Jacobs
et al. 2019a,b), DECaLS (e.g., Huang et al. 2020, 2021),
and PS1 (e.g., Canameras et al. 2020). DELVE is ex-
pected to contain several thousand galaxy–galaxy lenses
Figure 11. DELVE composite color images (g, r, i) of thequadruply lensed quasar systems J1131GL (left; Sluse et al.2003) and 2M J1134-2103 (right; Lucey et al. 2018).
and ∼ 100 lensed quasars brighter than i ∼ 18.5 mag
based on the estimates of Collett (2015) and Treu et al.
(2018), respectively. In Figure 11, we show DELVE im-
ages of two quadruply lensed quasars: J1131GL (left;
Sluse et al. 2003) and 2M J1134-2103 (right; Lucey et al.
2018). DELVE has partnered with the STRong lensing
Insights into the Dark Energy Survey (STRIDES; Treu
et al. 2018) to initiate searches for previously undiscov-
ered galaxy–galaxy lenses and lensed quasars using the
DELVE data.
5.4. Galaxies in Different Environments
While DELVE primarily focuses on faint galaxies in
the Local Volume, the DELVE DR1 data can also be
used to study more luminous galaxies at larger distances.
The wide coverage and depth of DELVE enable the in-
vestigation of galaxy populations spanning a range of
different environments (from isolated galaxies to galaxy
clusters). The study of galaxies in different environ-
ments can help reveal the mechanisms responsible for
variations in the structure and physical properties of
galaxies as they form and evolve over cosmic time (e.g.,
Darvish et al. 2018; Chartab et al. 2020). As an example,

18 DELVE Collaboration
early community data processed by DELVE have been
used to perform environmental studies of local analogs
to high-redshift galaxies (Santana-Silva et al. 2020).
Tidal streams around massive galaxies are a ubiqui-
tous aspect of galaxy formation that has not yet been
fully explored due to the deep imaging required to de-
tect these systems beyond the Local Group (Bullock &
Johnston 2005; Cooper et al. 2010; Martınez-Delgado
et al. 2010; Morales et al. 2018). A systematic survey
for galactic remnants in a large sample of nearby galax-
ies is needed to understand whether the recent merger
histories of the Milky Way and Andromeda are “typ-
ical.” DELVE has partnered with the Stellar Stream
Legacy Survey (Martinez-Delgado et al. 2021), a sys-
tematic imaging survey of tidal features around nearby
galaxies that has reached surface brightnesses as faint
as ∼ 29 mag arcsec−2 using public data from the DESI
Legacy Imaging Surveys (Dey et al. 2019). The DELVE
data will enable a search for extragalactic stellar streams
around several thousand galaxies in the southern hemi-
sphere. A catalog of extragalactic stellar streams will
probe the current mass assembly rate of nearby galax-
ies, the stellar content and orbits of satellites, and the
formation of stellar halos.
5.5. Galaxy Clusters
Galaxy clusters are a powerful tool for studying cos-
mology and galaxy evolution in dense environments
(Allen et al. 2011; Zenteno et al. 2016; Hennig et al.
2017; Bocquet et al. 2019; DES Collaboration 2020).
Assembling a large population of galaxy clusters is es-
sential for improving measurements of cosmological pa-
rameters (Hildebrandt et al. 2020; DES Collaboration
2018b; McClintock et al. 2019). DELVE collaborates
closely with DeROSITAS (PI: Zenteno) to assemble con-
tiguous imaging in g, r, i, z and enable wide-area optical
studies of galaxy clusters. The optical data can be com-
bined with data from large surveys in the submillimeter
(e.g., Bleem et al. 2020; Hilton et al. 2021) and X-ray
(e.g., eROSITA; Predehl et al. 2021) regimes. Multi-
wavelength studies of galaxy clusters can help mitigate
systemics in optical studies (Grandis et al. 2021) and
provide information about the dynamical state of galaxy
clusters, which is important for cosmological measure-
ments (e.g., Andrade-Santos et al. 2012, 2017; Lovisari
et al. 2020a,b) and studies of galaxy evolution (e.g., Zen-
teno et al. 2020).
As a proof of concept, Figure 12 shows DELVE DR1
data associated with the rich galaxy cluster Abell 1689
(e.g., Limousin et al. 2007). We use a kernel-density
estimate to subtract likely field galaxies from the color–
magnitude diagram (Pimbblet et al. 2002), and we re-
cover a prominent red sequence without the need for
spectroscopic membership information or photometric
redshifts. The colors and magnitudes of DELVE DR1
galaxies (black circles) follow the linear red sequence re-
lation derived from the DES Y1 redMaPPer catalog (red
line; McClintock et al. 2019) demonstrating consistency
between these data sets in the galaxy cluster regime. In
the future, we plan to assemble a catalog of galaxy clus-
ters by using a cluster finder algorithm such as redMaP-
Per (Rykoff et al. 2014) or WAZP (Aguena et al. 2021).
These algorithms have been validated on DES data and
can be naturally adapted to DELVE data.
6. SUMMARY
DELVE seeks to study the fundamental physics of
dark matter and galaxy formation through rigorous sys-
tematic studies of dwarf galaxies and stellar substruc-
tures in the Local Volume. To do so, DELVE aims
to complete contiguous coverage of the southern, high
Galactic latitude sky in g, r, i, z to a depth comparable
to two years of DES observations. As of 2021 January,
DELVE has completed slightly less than half of the 126
nights of scheduled DECam observing. The first ma-
jor public release of DELVE DR1 combines observations
from the DELVE-WIDE program with archival DECam
data to cover∼ 4000 deg2 of the northern Galactic cap to
a 5σ depth of g = 24.3, r = 23.9, i = 23.3, z = 22.8 mag
(Table 2). The DELVE DR1 catalog contains PSF and
automatic aperture measurements for ∼ 520 million as-
tronomical objects produced by the DESDM pipeline
and accessible through the NOIRLab Astro Data Lab.
DELVE DR1 has utility for a broad range of scientific
investigations in the Local Volume and beyond. Future
DELVE data releases will increase the coverage, unifor-
mity, and depth of the DELVE catalogs. Furthermore,
these releases will include products from the DELVE-
MC and DELVE-DEEP programs, which are processed
with the multiepoch point-source pipeline from SMASH.
We anticipate that DELVE DR1 and future DELVE
data releases will be a valuable resource for the com-
munity in advance of the Vera C. Rubin Observatory
Legacy Survey of Space and Time.
7. ACKNOWLEDGMENTS
The DELVE project is partially supported by Fer-
milab LDRD project L2019-011 and the NASA Fermi
Guest Investigator Program Cycle 9 No. 91201. This
work is supported by the Visiting Scholars Award Pro-
gram of the Universities Research Association. ABP
acknowledges support from NSF grant AST-1813881.
This research received support from the National Sci-
ence Foundation (NSF) under grant no. NSF DGE-
1656518 through the NSF Graduate Research Fellowship
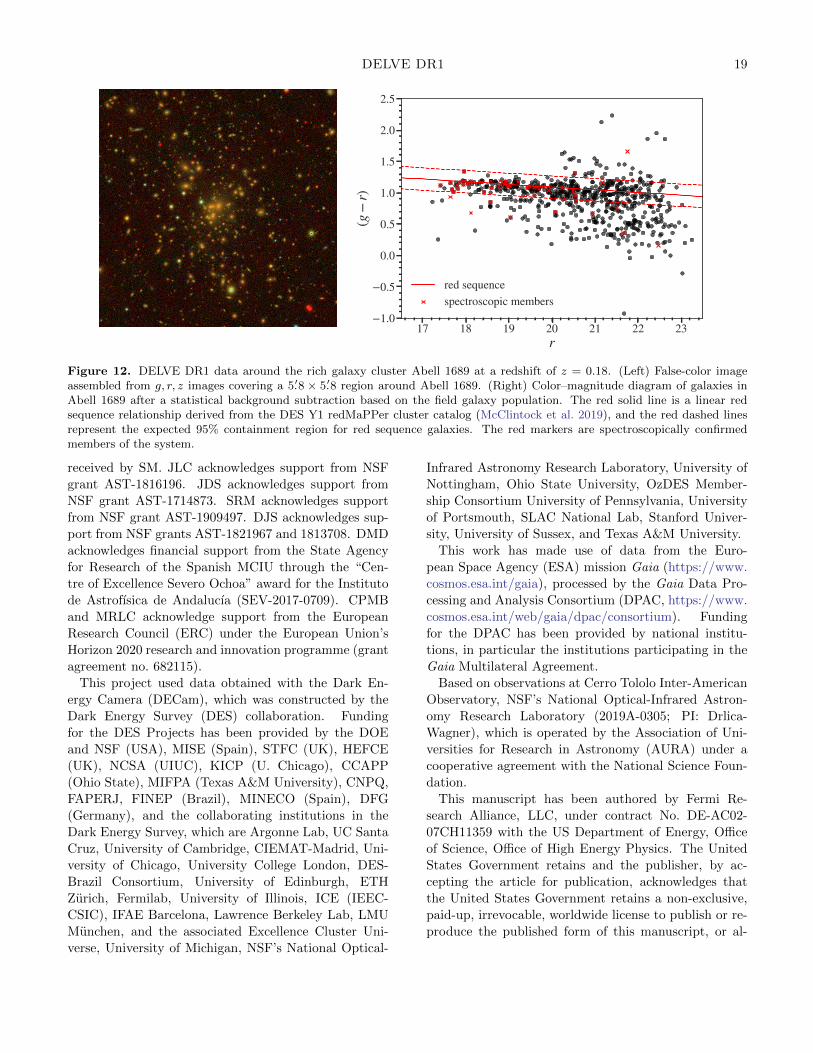
DELVE DR1 19
17 18 19 20 21 22 23r
1.0
0.5
0.0
0.5
1.0
1.5
2.0
2.5
(gr)
red sequencespectroscopic members
Figure 12. DELVE DR1 data around the rich galaxy cluster Abell 1689 at a redshift of z = 0.18. (Left) False-color imageassembled from g, r, z images covering a 5.′8 × 5.′8 region around Abell 1689. (Right) Color–magnitude diagram of galaxies inAbell 1689 after a statistical background subtraction based on the field galaxy population. The red solid line is a linear redsequence relationship derived from the DES Y1 redMaPPer cluster catalog (McClintock et al. 2019), and the red dashed linesrepresent the expected 95% containment region for red sequence galaxies. The red markers are spectroscopically confirmedmembers of the system.
received by SM. JLC acknowledges support from NSF
grant AST-1816196. JDS acknowledges support from
NSF grant AST-1714873. SRM acknowledges support
from NSF grant AST-1909497. DJS acknowledges sup-
port from NSF grants AST-1821967 and 1813708. DMD
acknowledges financial support from the State Agency
for Research of the Spanish MCIU through the “Cen-
tre of Excellence Severo Ochoa” award for the Instituto
de Astrofısica de Andalucıa (SEV-2017-0709). CPMB
and MRLC acknowledge support from the European
Research Council (ERC) under the European Union’s
Horizon 2020 research and innovation programme (grant
agreement no. 682115).
This project used data obtained with the Dark En-
ergy Camera (DECam), which was constructed by the
Dark Energy Survey (DES) collaboration. Funding
for the DES Projects has been provided by the DOE
and NSF (USA), MISE (Spain), STFC (UK), HEFCE
(UK), NCSA (UIUC), KICP (U. Chicago), CCAPP
(Ohio State), MIFPA (Texas A&M University), CNPQ,
FAPERJ, FINEP (Brazil), MINECO (Spain), DFG
(Germany), and the collaborating institutions in the
Dark Energy Survey, which are Argonne Lab, UC Santa
Cruz, University of Cambridge, CIEMAT-Madrid, Uni-
versity of Chicago, University College London, DES-
Brazil Consortium, University of Edinburgh, ETH
Zurich, Fermilab, University of Illinois, ICE (IEEC-
CSIC), IFAE Barcelona, Lawrence Berkeley Lab, LMU
Munchen, and the associated Excellence Cluster Uni-
verse, University of Michigan, NSF’s National Optical-
Infrared Astronomy Research Laboratory, University of
Nottingham, Ohio State University, OzDES Member-
ship Consortium University of Pennsylvania, University
of Portsmouth, SLAC National Lab, Stanford Univer-
sity, University of Sussex, and Texas A&M University.
This work has made use of data from the Euro-
pean Space Agency (ESA) mission Gaia (https://www.
cosmos.esa.int/gaia), processed by the Gaia Data Pro-
cessing and Analysis Consortium (DPAC, https://www.
cosmos.esa.int/web/gaia/dpac/consortium). Funding
for the DPAC has been provided by national institu-
tions, in particular the institutions participating in the
Gaia Multilateral Agreement.
Based on observations at Cerro Tololo Inter-American
Observatory, NSF’s National Optical-Infrared Astron-
omy Research Laboratory (2019A-0305; PI: Drlica-
Wagner), which is operated by the Association of Uni-
versities for Research in Astronomy (AURA) under a
cooperative agreement with the National Science Foun-
dation.
This manuscript has been authored by Fermi Re-
search Alliance, LLC, under contract No. DE-AC02-
07CH11359 with the US Department of Energy, Office
of Science, Office of High Energy Physics. The United
States Government retains and the publisher, by ac-
cepting the article for publication, acknowledges that
the United States Government retains a non-exclusive,
paid-up, irrevocable, worldwide license to publish or re-
produce the published form of this manuscript, or al-
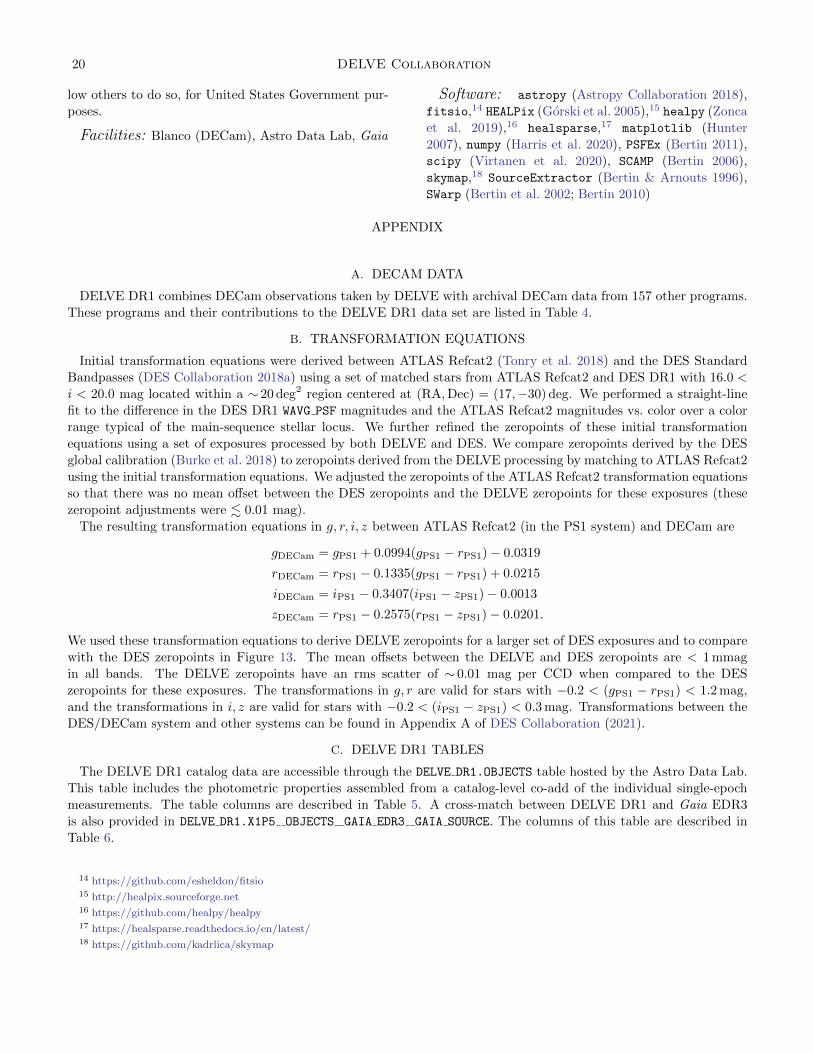
20 DELVE Collaboration
low others to do so, for United States Government pur-
poses.
Facilities: Blanco (DECam), Astro Data Lab, Gaia
Software: astropy (Astropy Collaboration 2018),
fitsio,14 HEALPix (Gorski et al. 2005),15 healpy (Zonca
et al. 2019),16 healsparse,17 matplotlib (Hunter
2007), numpy (Harris et al. 2020), PSFEx (Bertin 2011),
scipy (Virtanen et al. 2020), SCAMP (Bertin 2006),
skymap,18 SourceExtractor (Bertin & Arnouts 1996),
SWarp (Bertin et al. 2002; Bertin 2010)
APPENDIX
A. DECAM DATA
DELVE DR1 combines DECam observations taken by DELVE with archival DECam data from 157 other programs.
These programs and their contributions to the DELVE DR1 data set are listed in Table 4.
B. TRANSFORMATION EQUATIONS
Initial transformation equations were derived between ATLAS Refcat2 (Tonry et al. 2018) and the DES Standard
Bandpasses (DES Collaboration 2018a) using a set of matched stars from ATLAS Refcat2 and DES DR1 with 16.0 <
i < 20.0 mag located within a ∼ 20 deg2 region centered at (RA,Dec) = (17,−30) deg. We performed a straight-line
fit to the difference in the DES DR1 WAVG PSF magnitudes and the ATLAS Refcat2 magnitudes vs. color over a color
range typical of the main-sequence stellar locus. We further refined the zeropoints of these initial transformation
equations using a set of exposures processed by both DELVE and DES. We compare zeropoints derived by the DES
global calibration (Burke et al. 2018) to zeropoints derived from the DELVE processing by matching to ATLAS Refcat2
using the initial transformation equations. We adjusted the zeropoints of the ATLAS Refcat2 transformation equations
so that there was no mean offset between the DES zeropoints and the DELVE zeropoints for these exposures (these
zeropoint adjustments were . 0.01 mag).
The resulting transformation equations in g, r, i, z between ATLAS Refcat2 (in the PS1 system) and DECam are
gDECam = gPS1 + 0.0994(gPS1 − rPS1)− 0.0319
rDECam = rPS1 − 0.1335(gPS1 − rPS1) + 0.0215
iDECam = iPS1 − 0.3407(iPS1 − zPS1)− 0.0013
zDECam = rPS1 − 0.2575(rPS1 − zPS1)− 0.0201.
We used these transformation equations to derive DELVE zeropoints for a larger set of DES exposures and to compare
with the DES zeropoints in Figure 13. The mean offsets between the DELVE and DES zeropoints are < 1 mmag
in all bands. The DELVE zeropoints have an rms scatter of ∼ 0.01 mag per CCD when compared to the DES
zeropoints for these exposures. The transformations in g, r are valid for stars with −0.2 < (gPS1 − rPS1) < 1.2 mag,
and the transformations in i, z are valid for stars with −0.2 < (iPS1 − zPS1) < 0.3 mag. Transformations between the
DES/DECam system and other systems can be found in Appendix A of DES Collaboration (2021).
C. DELVE DR1 TABLES
The DELVE DR1 catalog data are accessible through the DELVE DR1.OBJECTS table hosted by the Astro Data Lab.
This table includes the photometric properties assembled from a catalog-level co-add of the individual single-epoch
measurements. The table columns are described in Table 5. A cross-match between DELVE DR1 and Gaia EDR3
is also provided in DELVE DR1.X1P5 OBJECTS GAIA EDR3 GAIA SOURCE. The columns of this table are described in
Table 6.
14 https://github.com/esheldon/fitsio15 http://healpix.sourceforge.net16 https://github.com/healpy/healpy17 https://healsparse.readthedocs.io/en/latest/18 https://github.com/kadrlica/skymap
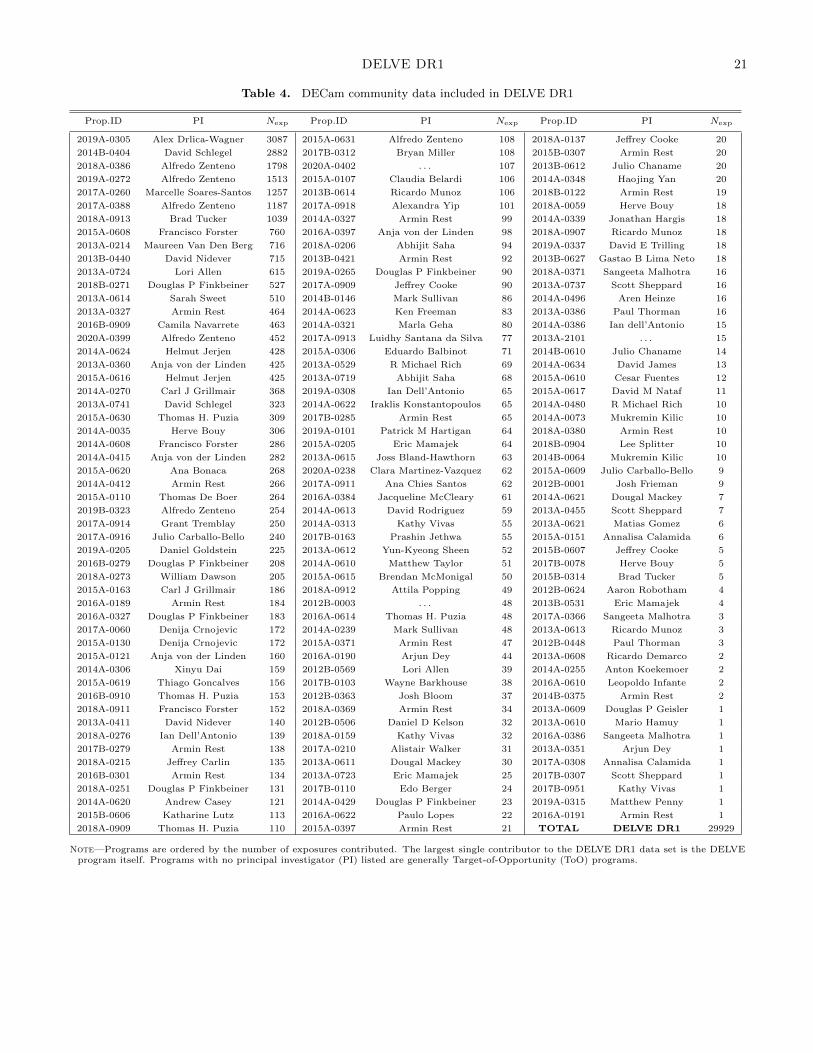
DELVE DR1 21
Table 4. DECam community data included in DELVE DR1
Prop.ID PI Nexp Prop.ID PI Nexp Prop.ID PI Nexp
2019A-0305 Alex Drlica-Wagner 3087 2015A-0631 Alfredo Zenteno 108 2018A-0137 Jeffrey Cooke 20
2014B-0404 David Schlegel 2882 2017B-0312 Bryan Miller 108 2015B-0307 Armin Rest 20
2018A-0386 Alfredo Zenteno 1798 2020A-0402 . . . 107 2013B-0612 Julio Chaname 20
2019A-0272 Alfredo Zenteno 1513 2015A-0107 Claudia Belardi 106 2014A-0348 Haojing Yan 20
2017A-0260 Marcelle Soares-Santos 1257 2013B-0614 Ricardo Munoz 106 2018B-0122 Armin Rest 19
2017A-0388 Alfredo Zenteno 1187 2017A-0918 Alexandra Yip 101 2018A-0059 Herve Bouy 18
2018A-0913 Brad Tucker 1039 2014A-0327 Armin Rest 99 2014A-0339 Jonathan Hargis 18
2015A-0608 Francisco Forster 760 2016A-0397 Anja von der Linden 98 2018A-0907 Ricardo Munoz 18
2013A-0214 Maureen Van Den Berg 716 2018A-0206 Abhijit Saha 94 2019A-0337 David E Trilling 18
2013B-0440 David Nidever 715 2013B-0421 Armin Rest 92 2013B-0627 Gastao B Lima Neto 18
2013A-0724 Lori Allen 615 2019A-0265 Douglas P Finkbeiner 90 2018A-0371 Sangeeta Malhotra 16
2018B-0271 Douglas P Finkbeiner 527 2017A-0909 Jeffrey Cooke 90 2013A-0737 Scott Sheppard 16
2013A-0614 Sarah Sweet 510 2014B-0146 Mark Sullivan 86 2014A-0496 Aren Heinze 16
2013A-0327 Armin Rest 464 2014A-0623 Ken Freeman 83 2013A-0386 Paul Thorman 16
2016B-0909 Camila Navarrete 463 2014A-0321 Marla Geha 80 2014A-0386 Ian dell’Antonio 15
2020A-0399 Alfredo Zenteno 452 2017A-0913 Luidhy Santana da Silva 77 2013A-2101 . . . 15
2014A-0624 Helmut Jerjen 428 2015A-0306 Eduardo Balbinot 71 2014B-0610 Julio Chaname 14
2013A-0360 Anja von der Linden 425 2013A-0529 R Michael Rich 69 2014A-0634 David James 13
2015A-0616 Helmut Jerjen 425 2013A-0719 Abhijit Saha 68 2015A-0610 Cesar Fuentes 12
2014A-0270 Carl J Grillmair 368 2019A-0308 Ian Dell’Antonio 65 2015A-0617 David M Nataf 11
2013A-0741 David Schlegel 323 2014A-0622 Iraklis Konstantopoulos 65 2014A-0480 R Michael Rich 10
2015A-0630 Thomas H. Puzia 309 2017B-0285 Armin Rest 65 2014A-0073 Mukremin Kilic 10
2014A-0035 Herve Bouy 306 2019A-0101 Patrick M Hartigan 64 2018A-0380 Armin Rest 10
2014A-0608 Francisco Forster 286 2015A-0205 Eric Mamajek 64 2018B-0904 Lee Splitter 10
2014A-0415 Anja von der Linden 282 2013A-0615 Joss Bland-Hawthorn 63 2014B-0064 Mukremin Kilic 10
2015A-0620 Ana Bonaca 268 2020A-0238 Clara Martinez-Vazquez 62 2015A-0609 Julio Carballo-Bello 9
2014A-0412 Armin Rest 266 2017A-0911 Ana Chies Santos 62 2012B-0001 Josh Frieman 9
2015A-0110 Thomas De Boer 264 2016A-0384 Jacqueline McCleary 61 2014A-0621 Dougal Mackey 7
2019B-0323 Alfredo Zenteno 254 2014A-0613 David Rodriguez 59 2013A-0455 Scott Sheppard 7
2017A-0914 Grant Tremblay 250 2014A-0313 Kathy Vivas 55 2013A-0621 Matias Gomez 6
2017A-0916 Julio Carballo-Bello 240 2017B-0163 Prashin Jethwa 55 2015A-0151 Annalisa Calamida 6
2019A-0205 Daniel Goldstein 225 2013A-0612 Yun-Kyeong Sheen 52 2015B-0607 Jeffrey Cooke 5
2016B-0279 Douglas P Finkbeiner 208 2014A-0610 Matthew Taylor 51 2017B-0078 Herve Bouy 5
2018A-0273 William Dawson 205 2015A-0615 Brendan McMonigal 50 2015B-0314 Brad Tucker 5
2015A-0163 Carl J Grillmair 186 2018A-0912 Attila Popping 49 2012B-0624 Aaron Robotham 4
2016A-0189 Armin Rest 184 2012B-0003 . . . 48 2013B-0531 Eric Mamajek 4
2016A-0327 Douglas P Finkbeiner 183 2016A-0614 Thomas H. Puzia 48 2017A-0366 Sangeeta Malhotra 3
2017A-0060 Denija Crnojevic 172 2014A-0239 Mark Sullivan 48 2013A-0613 Ricardo Munoz 3
2015A-0130 Denija Crnojevic 172 2015A-0371 Armin Rest 47 2012B-0448 Paul Thorman 3
2015A-0121 Anja von der Linden 160 2016A-0190 Arjun Dey 44 2013A-0608 Ricardo Demarco 2
2014A-0306 Xinyu Dai 159 2012B-0569 Lori Allen 39 2014A-0255 Anton Koekemoer 2
2015A-0619 Thiago Goncalves 156 2017B-0103 Wayne Barkhouse 38 2016A-0610 Leopoldo Infante 2
2016B-0910 Thomas H. Puzia 153 2012B-0363 Josh Bloom 37 2014B-0375 Armin Rest 2
2018A-0911 Francisco Forster 152 2018A-0369 Armin Rest 34 2013A-0609 Douglas P Geisler 1
2013A-0411 David Nidever 140 2012B-0506 Daniel D Kelson 32 2013A-0610 Mario Hamuy 1
2018A-0276 Ian Dell’Antonio 139 2018A-0159 Kathy Vivas 32 2016A-0386 Sangeeta Malhotra 1
2017B-0279 Armin Rest 138 2017A-0210 Alistair Walker 31 2013A-0351 Arjun Dey 1
2018A-0215 Jeffrey Carlin 135 2013A-0611 Dougal Mackey 30 2017A-0308 Annalisa Calamida 1
2016B-0301 Armin Rest 134 2013A-0723 Eric Mamajek 25 2017B-0307 Scott Sheppard 1
2018A-0251 Douglas P Finkbeiner 131 2017B-0110 Edo Berger 24 2017B-0951 Kathy Vivas 1
2014A-0620 Andrew Casey 121 2014A-0429 Douglas P Finkbeiner 23 2019A-0315 Matthew Penny 1
2015B-0606 Katharine Lutz 113 2016A-0622 Paulo Lopes 22 2016A-0191 Armin Rest 1
2018A-0909 Thomas H. Puzia 110 2015A-0397 Armin Rest 21 TOTAL DELVE DR1 29929
Note—Programs are ordered by the number of exposures contributed. The largest single contributor to the DELVE DR1 data set is the DELVEprogram itself. Programs with no principal investigator (PI) listed are generally Target-of-Opportunity (ToO) programs.
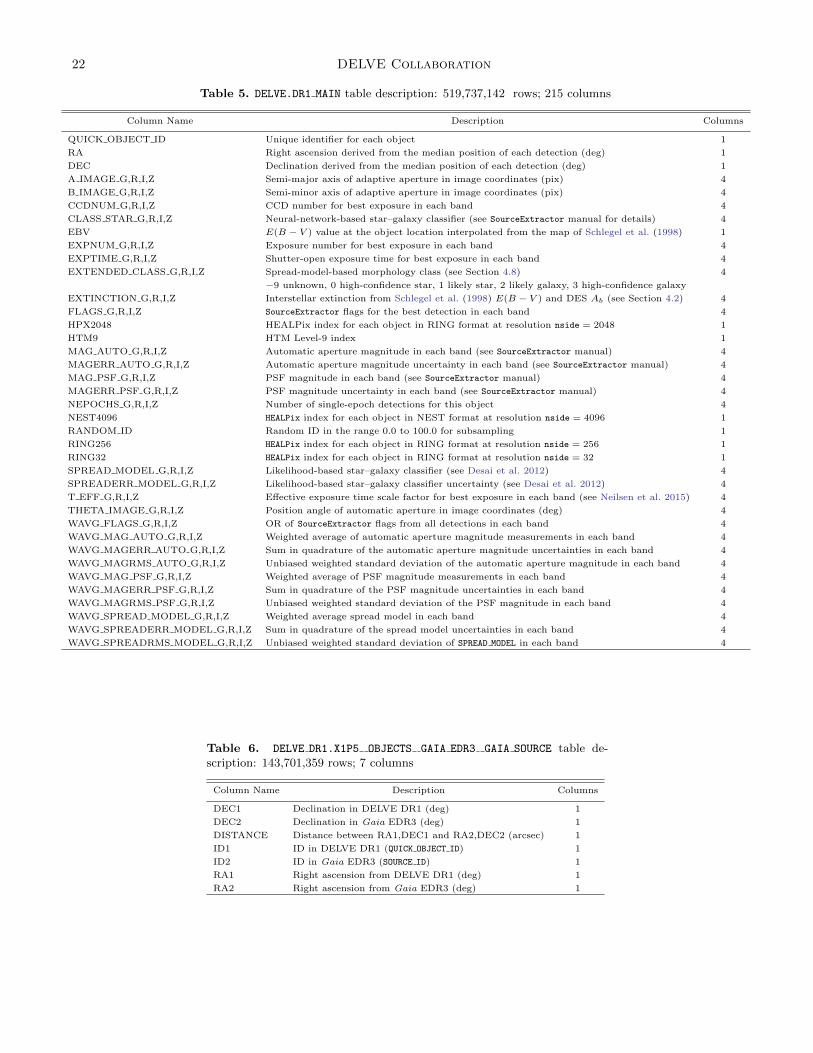
22 DELVE Collaboration
Table 5. DELVE.DR1 MAIN table description: 519,737,142 rows; 215 columns
Column Name Description Columns
QUICK OBJECT ID Unique identifier for each object 1
RA Right ascension derived from the median position of each detection (deg) 1
DEC Declination derived from the median position of each detection (deg) 1
A IMAGE G,R,I,Z Semi-major axis of adaptive aperture in image coordinates (pix) 4
B IMAGE G,R,I,Z Semi-minor axis of adaptive aperture in image coordinates (pix) 4
CCDNUM G,R,I,Z CCD number for best exposure in each band 4
CLASS STAR G,R,I,Z Neural-network-based star–galaxy classifier (see SourceExtractor manual for details) 4
EBV E(B − V ) value at the object location interpolated from the map of Schlegel et al. (1998) 1
EXPNUM G,R,I,Z Exposure number for best exposure in each band 4
EXPTIME G,R,I,Z Shutter-open exposure time for best exposure in each band 4
EXTENDED CLASS G,R,I,Z Spread-model-based morphology class (see Section 4.8) 4
−9 unknown, 0 high-confidence star, 1 likely star, 2 likely galaxy, 3 high-confidence galaxy
EXTINCTION G,R,I,Z Interstellar extinction from Schlegel et al. (1998) E(B − V ) and DES Ab (see Section 4.2) 4
FLAGS G,R,I,Z SourceExtractor flags for the best detection in each band 4
HPX2048 HEALPix index for each object in RING format at resolution nside = 2048 1
HTM9 HTM Level-9 index 1
MAG AUTO G,R,I,Z Automatic aperture magnitude in each band (see SourceExtractor manual) 4
MAGERR AUTO G,R,I,Z Automatic aperture magnitude uncertainty in each band (see SourceExtractor manual) 4
MAG PSF G,R,I,Z PSF magnitude in each band (see SourceExtractor manual) 4
MAGERR PSF G,R,I,Z PSF magnitude uncertainty in each band (see SourceExtractor manual) 4
NEPOCHS G,R,I,Z Number of single-epoch detections for this object 4
NEST4096 HEALPix index for each object in NEST format at resolution nside = 4096 1
RANDOM ID Random ID in the range 0.0 to 100.0 for subsampling 1
RING256 HEALPix index for each object in RING format at resolution nside = 256 1
RING32 HEALPix index for each object in RING format at resolution nside = 32 1
SPREAD MODEL G,R,I,Z Likelihood-based star–galaxy classifier (see Desai et al. 2012) 4
SPREADERR MODEL G,R,I,Z Likelihood-based star–galaxy classifier uncertainty (see Desai et al. 2012) 4
T EFF G,R,I,Z Effective exposure time scale factor for best exposure in each band (see Neilsen et al. 2015) 4
THETA IMAGE G,R,I,Z Position angle of automatic aperture in image coordinates (deg) 4
WAVG FLAGS G,R,I,Z OR of SourceExtractor flags from all detections in each band 4
WAVG MAG AUTO G,R,I,Z Weighted average of automatic aperture magnitude measurements in each band 4
WAVG MAGERR AUTO G,R,I,Z Sum in quadrature of the automatic aperture magnitude uncertainties in each band 4
WAVG MAGRMS AUTO G,R,I,Z Unbiased weighted standard deviation of the automatic aperture magnitude in each band 4
WAVG MAG PSF G,R,I,Z Weighted average of PSF magnitude measurements in each band 4
WAVG MAGERR PSF G,R,I,Z Sum in quadrature of the PSF magnitude uncertainties in each band 4
WAVG MAGRMS PSF G,R,I,Z Unbiased weighted standard deviation of the PSF magnitude in each band 4
WAVG SPREAD MODEL G,R,I,Z Weighted average spread model in each band 4
WAVG SPREADERR MODEL G,R,I,Z Sum in quadrature of the spread model uncertainties in each band 4
WAVG SPREADRMS MODEL G,R,I,Z Unbiased weighted standard deviation of SPREAD MODEL in each band 4
Table 6. DELVE DR1.X1P5 OBJECTS GAIA EDR3 GAIA SOURCE table de-scription: 143,701,359 rows; 7 columns
Column Name Description Columns
DEC1 Declination in DELVE DR1 (deg) 1
DEC2 Declination in Gaia EDR3 (deg) 1
DISTANCE Distance between RA1,DEC1 and RA2,DEC2 (arcsec) 1
ID1 ID in DELVE DR1 (QUICK OBJECT ID) 1
ID2 ID in Gaia EDR3 (SOURCE ID) 1
RA1 Right ascension from DELVE DR1 (deg) 1
RA2 Right ascension from Gaia EDR3 (deg) 1
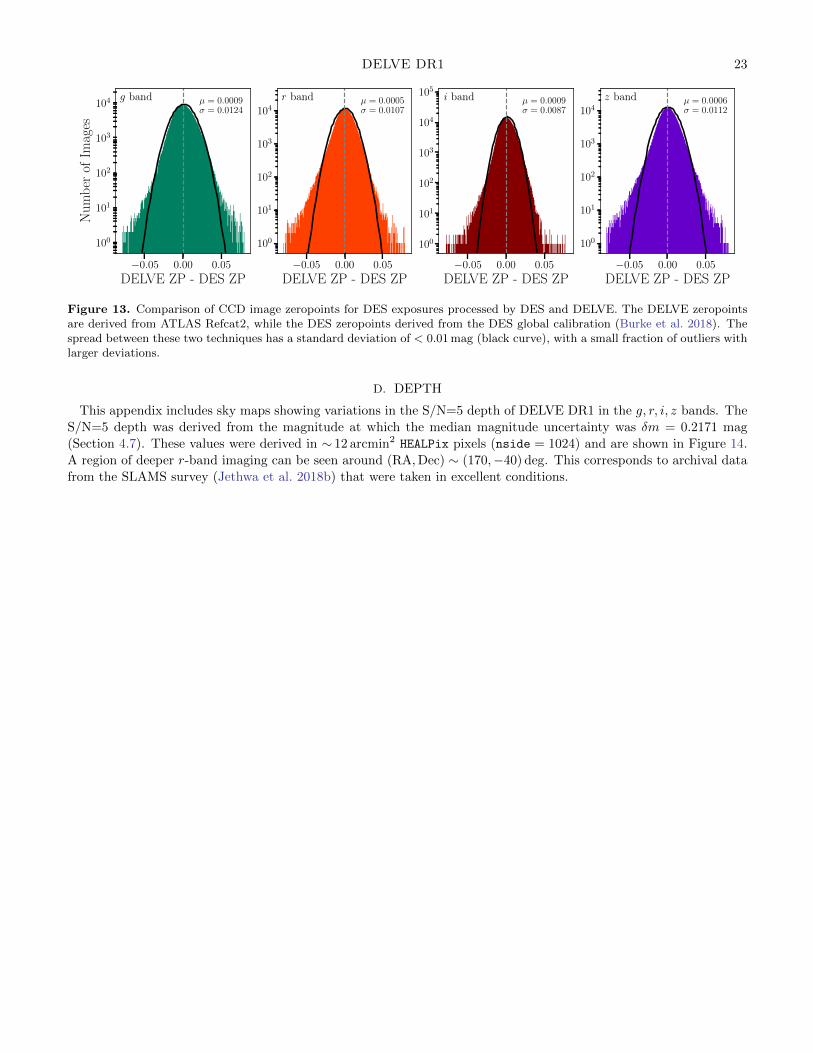
DELVE DR1 23
−0.05 0.00 0.05
DELVE ZP - DES ZP
100
101
102
103
104
Nu
mb
erof
Imag
esµ = 0.0009σ = 0.0124
g band
−0.05 0.00 0.05
DELVE ZP - DES ZP
100
101
102
103
104µ = 0.0005σ = 0.0107
r band
−0.05 0.00 0.05
DELVE ZP - DES ZP
100
101
102
103
104
105
µ = 0.0009σ = 0.0087
i band
−0.05 0.00 0.05
DELVE ZP - DES ZP
100
101
102
103
104µ = 0.0006σ = 0.0112
z band
Figure 13. Comparison of CCD image zeropoints for DES exposures processed by DES and DELVE. The DELVE zeropointsare derived from ATLAS Refcat2, while the DES zeropoints derived from the DES global calibration (Burke et al. 2018). Thespread between these two techniques has a standard deviation of < 0.01 mag (black curve), with a small fraction of outliers withlarger deviations.
D. DEPTH
This appendix includes sky maps showing variations in the S/N=5 depth of DELVE DR1 in the g, r, i, z bands. The
S/N=5 depth was derived from the magnitude at which the median magnitude uncertainty was δm = 0.2171 mag
(Section 4.7). These values were derived in ∼ 12 arcmin2 HEALPix pixels (nside = 1024) and are shown in Figure 14.
A region of deeper r-band imaging can be seen around (RA,Dec) ∼ (170,−40) deg. This corresponds to archival data
from the SLAMS survey (Jethwa et al. 2018b) that were taken in excellent conditions.
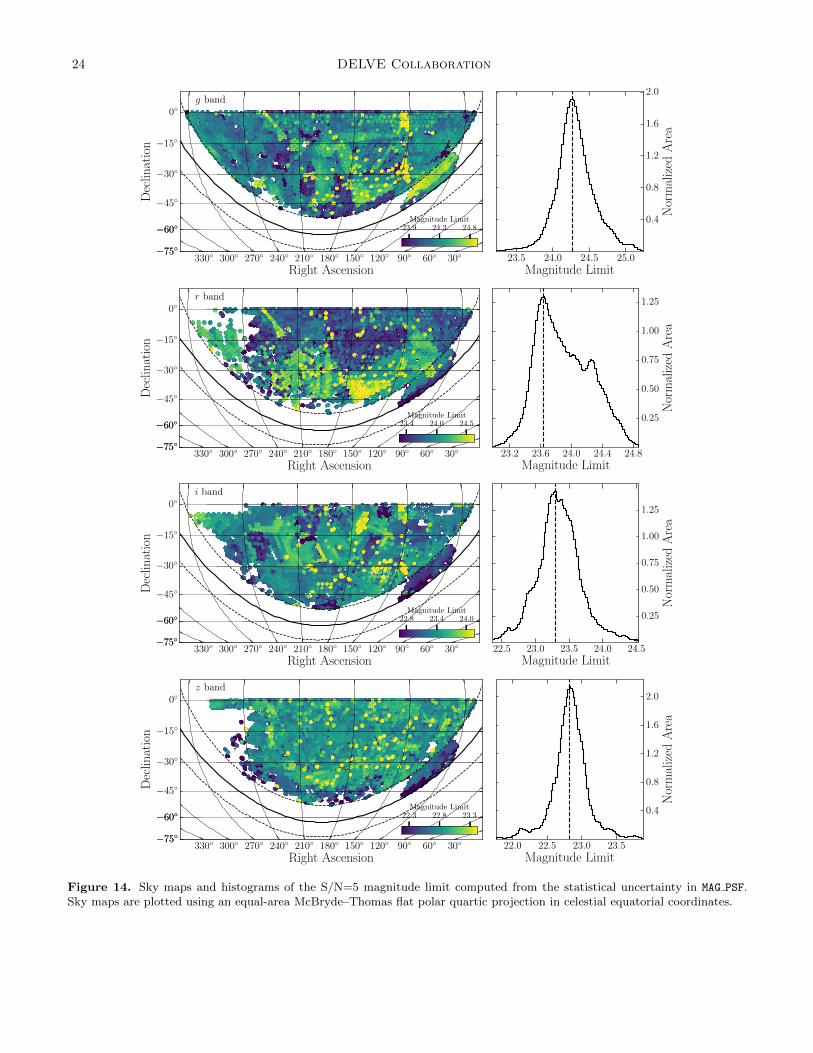
24 DELVE Collaboration
270◦300◦330◦ 30◦60◦90◦120◦150◦180◦210◦240◦
Right Ascension
−75◦−75◦
−60◦−60◦
−45◦
−30◦
−15◦
0◦
Dec
linat
ion
g band
23.9 24.3 24.8Magnitude Limit
23.5 24.0 24.5 25.0
Magnitude Limit
0.4
0.8
1.2
1.6
2.0
Nor
mal
ized
Are
a
270◦300◦330◦ 30◦60◦90◦120◦150◦180◦210◦240◦
Right Ascension
−75◦−75◦
−60◦−60◦
−45◦
−30◦
−15◦
0◦
Dec
linat
ion
r band
23.4 24.0 24.5Magnitude Limit
23.2 23.6 24.0 24.4 24.8
Magnitude Limit
0.25
0.50
0.75
1.00
1.25
Nor
mal
ized
Are
a
270◦300◦330◦ 30◦60◦90◦120◦150◦180◦210◦240◦
Right Ascension
−75◦−75◦
−60◦−60◦
−45◦
−30◦
−15◦
0◦
Dec
linat
ion
i band
22.8 23.4 24.0Magnitude Limit
22.5 23.0 23.5 24.0 24.5
Magnitude Limit
0.25
0.50
0.75
1.00
1.25
Nor
mal
ized
Are
a
270◦300◦330◦ 30◦60◦90◦120◦150◦180◦210◦240◦
Right Ascension
−75◦−75◦
−60◦−60◦
−45◦
−30◦
−15◦
0◦
Dec
linat
ion
z band
22.3 22.8 23.3Magnitude Limit
22.0 22.5 23.0 23.5
Magnitude Limit
0.4
0.8
1.2
1.6
2.0
Nor
mal
ized
Are
a
Figure 14. Sky maps and histograms of the S/N=5 magnitude limit computed from the statistical uncertainty in MAG PSF.Sky maps are plotted using an equal-area McBryde–Thomas flat polar quartic projection in celestial equatorial coordinates.

DELVE DR1 25
REFERENCES
Ackermann, M., Albert, A., Anderson, B., et al. 2015,
PhRvL, 115, 231301, arXiv:1503.02641
Agertz, O., Pontzen, A., Read, J. I., et al. 2020, MNRAS,
491, 1656, arXiv:1904.02723
Aguena, M., Benoist, C., da Costa, L. N., et al. 2021,
MNRAS, 502, 4435, arXiv:2008.08711
Aihara, H., AlSayyad, Y., Ando, M., et al. 2019, PASJ, 71,
114, arXiv:1905.12221
Allen, S. W., Evrard, A. E., & Mantz, A. B. 2011,
ARA&A, 49, 409, arXiv:1103.4829
Andrade-Santos, F., Lima Neto, G. B., & Lagana, T. F.
2012, ApJ, 746, 139, arXiv:1112.1971
Andrade-Santos, F., Jones, C., Forman, W. R., et al. 2017,
ApJ, 843, 76, arXiv:1703.08690
Astropy Collaboration. 2018, AJ, 156, 123,
arXiv:1801.02634
Balbinot, E., Yanny, B., Li, T. S., et al. 2016, ApJ, 820, 58,
arXiv:1509.04283
Banik, N., Bovy, J., Bertone, G., Erkal, D., & de Boer,
T. J. L. 2019, arXiv e-prints, arXiv:1911.02663,
arXiv:1911.02663
Bechtol, K., Drlica-Wagner, A., Balbinot, E., et al. 2015,
ApJ, 807, 50, arXiv:1503.02584
Behroozi, P. S., Wechsler, R. H., & Conroy, C. 2013, ApJ,
770, 57, arXiv:1207.6105
Bellazzini, M., Beccari, G., Fraternali, F., et al. 2014, A&A,
566, A44, arXiv:1404.1697
Belokurov, V., Deason, A. J., Erkal, D., et al. 2019,
MNRAS, 488, L47, arXiv:1904.07909
Belokurov, V., Irwin, M. J., Koposov, S. E., et al. 2014,
MNRAS, 441, 2124, arXiv:1403.3406
Belokurov, V., Zucker, D. B., Evans, N. W., et al. 2006,
ApJL, 642, L137, arXiv:astro-ph/0605025
Belokurov, V., Zucker, D. B., Evans, N. W., et al. 2007,
ApJ, 654, 897, astro-ph/0608448
Belokurov, V. A. & Erkal, D. 2019, MNRAS, 482, L9,
arXiv:1808.00462
Bennet, P., Sand, D. J., Crnojevic, D., et al. 2019, ApJ,
885, 153, arXiv:1906.03230
Bennet, P., Sand, D. J., Crnojevic, D., et al. 2020, ApJL,
893, L9, arXiv:2002.11126
Bergstrom, L., Ullio, P., & Buckley, J. H. 1998,
Astroparticle Physics, 9, 137, arXiv:astro-ph/9712318
Bernard, E. J., Ferguson, A. M. N., Schlafly, E. F., et al.
2014, MNRAS, 443, L84, arXiv:1405.6645
Bernard, E. J., Ferguson, A. M. N., Schlafly, E. F., et al.
2016, MNRAS, 463, 1759, arXiv:1607.06088
Bernstein, G. M., Abbott, T. M. C., Armstrong, R., et al.
2018, PASP, 130, 054501, arXiv:1710.10943
Bertin, E. 2006, in Astronomical Society of the Pacific
Conference Series, Vol. 351, Astronomical Data Analysis
Software and Systems XV, ed. C. Gabriel, C. Arviset,
D. Ponz, & S. Enrique, 112
Bertin, E. 2010, SWarp: Resampling and Co-adding FITS
Images Together, Astrophysics Source Code Library,
ascl:1010.068
Bertin, E. 2011, in Astronomical Society of the Pacific
Conference Series, Vol. 442, Astronomical Data Analysis
Software and Systems XX, ed. I. N. Evans, A. Accomazzi,
D. J. Mink, & A. H. Rots, San Francisco, CA, 435
Bertin, E. & Arnouts, S. 1996, A&AS, 117, 393
Bertin, E., Mellier, Y., Radovich, M., et al. 2002, in
Astronomical Society of the Pacific Conference Series,
Vol. 281, Astronomical Data Analysis Software and
Systems XI, ed. D. A. Bohlender, D. Durand, & T. H.
Handley, 228
Bleem, L. E., Bocquet, S., Stalder, B., et al. 2020, ApJS,
247, 25, arXiv:1910.04121
Bocquet, S. et al. 2019, ApJ, 878, 55, arXiv:1812.01679
Bonaca, A., Geha, M., & Kallivayalil, N. 2012, ApJL, 760,
L6, arXiv:1209.5391
Bonaca, A. & Hogg, D. W. 2018, ApJ, 867, 101,
arXiv:1804.06854
Bonaca, A., Pearson, S., Price-Whelan, A. M., et al. 2020,
ApJ, 889, 70, arXiv:1910.00592
Bonaca, A., Naidu, R. P., Conroy, C., et al. 2021, ApJL,
909, L26, arXiv:2012.09171
Bovy, J., Bahmanyar, A., Fritz, T. K., & Kallivayalil, N.
2016, ApJ, 833, 31, arXiv:1609.01298
Boylan-Kolchin, M., Weisz, D. R., Johnson, B. D., et al.
2015, MNRAS, 453, 1503, arXiv:1504.06621
Brandt, T. D. 2016, ApJL, 824, L31, arXiv:1605.03665
Bullock, J. S. & Boylan-Kolchin, M. 2017, ARA&A, 55,
343, arXiv:1707.04256
Bullock, J. S. & Johnston, K. V. 2005, ApJ, 635, 931,
arXiv:astro-ph/0506467
Bullock, J. S., Kravtsov, A. V., & Weinberg, D. H. 2000,
ApJ, 539, 517, astro-ph/0002214
Burke, D. L., Rykoff, E. S., Allam, S., et al. 2018, AJ, 155,
41, arXiv:1706.01542
Carlberg, R. G. 2013, ApJ, 775, 90, arXiv:1307.1929
Carlin, J. L., Sand, D. J., Price, P., et al. 2016, ApJ, 828,
L5, arXiv:1608.02591
Carlin, J. L., Garling, C. T., Peter, A. H. G., et al. 2019,
ApJ, 886, 109, arXiv:1906.08260
Carlin, J. L., Mutlu-Pakdil, B., Crnojevic, D., et al. 2021,
ApJ, 909, 211, arXiv:2012.09174
26 DELVE Collaboration
Carlsten, S. G., Greene, J. E., Peter, A. H. G., Beaton,
R. L., & Greco, J. P. 2021, ApJ, 908, 109,
arXiv:2006.02443
Carlsten, S. G., Greene, J. E., Peter, A. H. G., Greco, J. P.,
& Beaton, R. L. 2020, ApJ, 902, 124, arXiv:2006.02444
Canameras, R., Schuldt, S., Suyu, S. H., et al. 2020, a, 644,
A163
Cerny, W., Pace, A. B., Drlica-Wagner, A., et al. 2021,
ApJ, 910, 18, arXiv:2009.08550
Chambers, K. C., Magnier, E. A., Metcalfe, N., et al. 2016,
ArXiv e-prints, arXiv:1612.05560
Chartab, N., Mobasher, B., Darvish, B., et al. 2020, ApJ,
890, 7, arXiv:1912.04890
Chiboucas, K., Jacobs, B. A., Tully, R. B., &
Karachentsev, I. D. 2013, AJ, 146, 126, arXiv:1309.4130
Choi, Y., Nidever, D. L., Olsen, K., et al. 2018a, ApJ, 866,
90, arXiv:1804.07765
Choi, Y., Nidever, D. L., Olsen, K., et al. 2018b, ApJ, 869,
125, arXiv:1805.00481
Collett, T. E. 2015, ApJ, 811, 20, arXiv:1507.02657
Cooper, A. P., Cole, S., Frenk, C. S., et al. 2010, MNRAS,
406, 744, arXiv:0910.3211
Crnojevic, D., Sand, D. J., Spekkens, K., et al. 2016, ApJ,
823, 19, arXiv:1512.05366
Crnojevic, D., Sand, D. J., Bennet, P., et al. 2019, ApJ,
872, 80, arXiv:1809.05103
da Costa, L. N., Willmer, C. N. A., Pellegrini, P. S., et al.
1998, AJ, 116, 1, arXiv:astro-ph/9804064
Dalcanton, J. J., Williams, B. F., Seth, A. C., et al. 2009,
ApJS, 183, 67, arXiv:0905.3737
Danieli, S., van Dokkum, P., Merritt, A., et al. 2017, ApJ,
837, 136, arXiv:1702.04727
Darvish, B., Martin, C., Goncalves, T. S., et al. 2018, ApJ,
853, 155, arXiv:1801.02618
Davis, A. B., Nierenberg, A. M., Peter, A. H. G., et al.
2021, MNRAS, 500, 3854, arXiv:2003.08352
de Vaucouleurs, G., de Vaucouleurs, A., Corwin, Herold G.,
J., et al. 1991, Third Reference Catalogue of Bright
Galaxies (Springer)
Deason, A. J., Wetzel, A. R., Garrison-Kimmel, S., &
Belokurov, V. 2015, MNRAS, 453, 3568,
arXiv:1504.04372
DES Collaboration. 2005, arXiv:astro-ph/0510346
DES Collaboration. 2018a, ApJS, 239, 18, arXiv:1801.03181
DES Collaboration. 2016, MNRAS, 460, 1270,
arXiv:1601.00329
DES Collaboration. 2018b, PhRvD, 98, 043526,
arXiv:1708.01530
DES Collaboration. 2020, PhRvD, 102, 023509,
arXiv:2002.11124
DES Collaboration. 2021, arXiv e-prints, arXiv:2101.05765,
arXiv:2101.05765
Desai, S., Armstrong, R., Mohr, J. J., et al. 2012, ApJ, 757,
83, arXiv:1204.1210
Dey, A., Schlegel, D. J., Lang, D., et al. 2019, AJ, 157, 168,
arXiv:1804.08657
Diehl, H. T., Buckley-Geer, E. J., Lindgren, K. A., et al.
2017, ApJS, 232, 15
D’Onghia, E. & Lake, G. 2008, ApJL, 686, L61,
arXiv:0802.0001
Dooley, G. A., Peter, A. H. G., Carlin, J. L., et al. 2017a,
MNRAS, 472, 1060, arXiv:1703.05321
Dooley, G. A., Peter, A. H. G., Yang, T., et al. 2017b,
MNRAS, 471, 4894, arXiv:1610.00708
Dotter, A., Chaboyer, B., Jevremovic, D., et al. 2008,
ApJS, 178, 89, arXiv:0804.4473
Drlica-Wagner, A., Bechtol, K., Rykoff, E. S., et al. 2015,
ApJ, 813, 109, arXiv:1508.03622
Drlica-Wagner, A., Bechtol, K., Allam, S., et al. 2016,
ApJL, 833, L5, arXiv:1609.02148
Drlica-Wagner, A., Sevilla-Noarbe, I., Rykoff, E. S., et al.
2018, ApJS, 235, 33, arXiv:1708.01531
Drlica-Wagner, A., Bechtol, K., Mau, S., et al. 2020, ApJ,
893, 47, arXiv:1912.03302
Erkal, D., Belokurov, V., Bovy, J., & Sanders, J. L. 2016a,
MNRAS, 463, 102, arXiv:1606.04946
Erkal, D. & Belokurov, V. A. 2020, MNRAS, 495, 2554,
arXiv:1907.09484
Erkal, D., Belokurov, V. A., & Parkin, D. L. 2020,
MNRAS, 498, 5574, arXiv:2001.11030
Erkal, D., Sanders, J. L., & Belokurov, V. 2016b, MNRAS,
461, 1590, arXiv:1603.08922
Fingerhut, R. L., McCall, M. L., Argote, M., et al. 2010,
ApJ, 716, 792
Fitzpatrick, M. J., Graham, M. J., Mighell, K. J., et al.
2016, Society of Photo-Optical Instrumentation
Engineers (SPIE) Conference Series, Vol. 9913, The
NOAO data lab: science-driven development, ed.
G. Chiozzi & J. C. Guzman, 99130L
Flaugher, B., Diehl, H. T., Honscheid, K., et al. 2015, AJ,
150, 150, arXiv:1504.02900
Frebel, A. & Norris, J. E. 2015, ARA&A, 53, 631,
arXiv:1501.06921
Freedman, W. L., Madore, B. F., Gibson, B. K., et al. 2001,
ApJ, 553, 47, arXiv:astro-ph/0012376
Gaia Collaboration. 2018a, A&A, 616, A1,
arXiv:1804.09365
Gaia Collaboration. 2018b, A&A, 616, A14,
arXiv:1804.09377
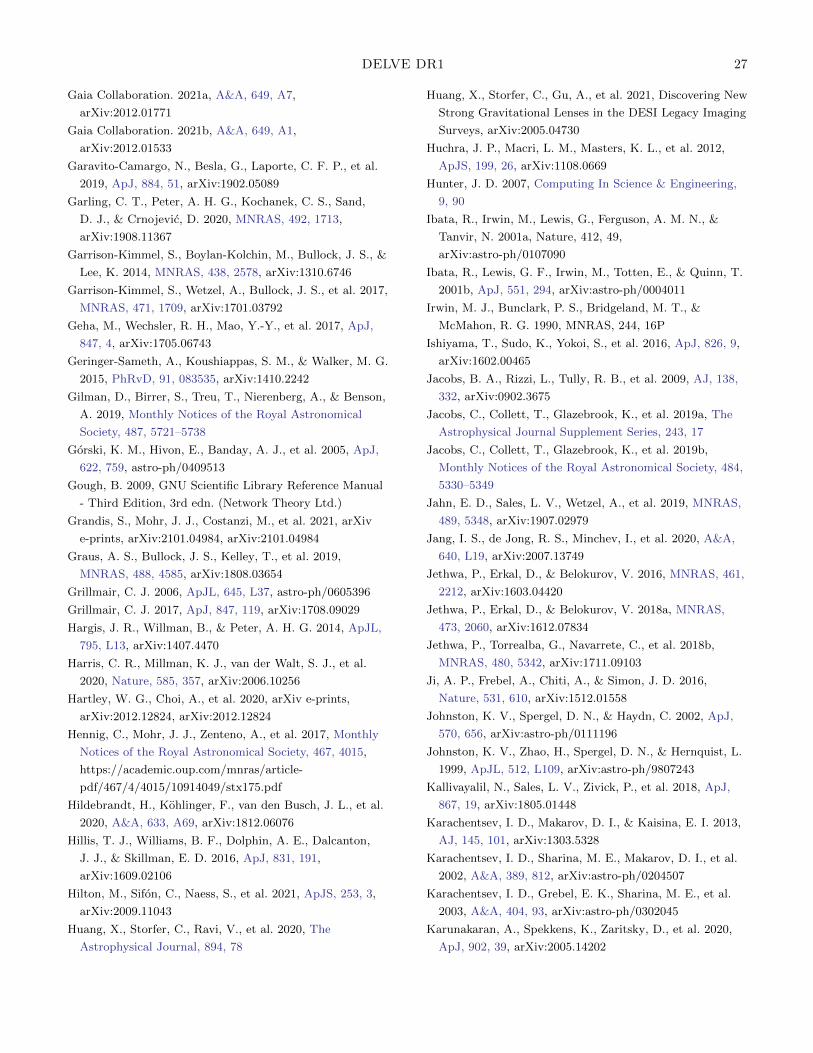
DELVE DR1 27
Gaia Collaboration. 2021a, A&A, 649, A7,
arXiv:2012.01771
Gaia Collaboration. 2021b, A&A, 649, A1,
arXiv:2012.01533
Garavito-Camargo, N., Besla, G., Laporte, C. F. P., et al.
2019, ApJ, 884, 51, arXiv:1902.05089
Garling, C. T., Peter, A. H. G., Kochanek, C. S., Sand,
D. J., & Crnojevic, D. 2020, MNRAS, 492, 1713,
arXiv:1908.11367
Garrison-Kimmel, S., Boylan-Kolchin, M., Bullock, J. S., &
Lee, K. 2014, MNRAS, 438, 2578, arXiv:1310.6746
Garrison-Kimmel, S., Wetzel, A., Bullock, J. S., et al. 2017,
MNRAS, 471, 1709, arXiv:1701.03792
Geha, M., Wechsler, R. H., Mao, Y.-Y., et al. 2017, ApJ,
847, 4, arXiv:1705.06743
Geringer-Sameth, A., Koushiappas, S. M., & Walker, M. G.
2015, PhRvD, 91, 083535, arXiv:1410.2242
Gilman, D., Birrer, S., Treu, T., Nierenberg, A., & Benson,
A. 2019, Monthly Notices of the Royal Astronomical
Society, 487, 5721–5738
Gorski, K. M., Hivon, E., Banday, A. J., et al. 2005, ApJ,
622, 759, astro-ph/0409513
Gough, B. 2009, GNU Scientific Library Reference Manual
- Third Edition, 3rd edn. (Network Theory Ltd.)
Grandis, S., Mohr, J. J., Costanzi, M., et al. 2021, arXiv
e-prints, arXiv:2101.04984, arXiv:2101.04984
Graus, A. S., Bullock, J. S., Kelley, T., et al. 2019,
MNRAS, 488, 4585, arXiv:1808.03654
Grillmair, C. J. 2006, ApJL, 645, L37, astro-ph/0605396
Grillmair, C. J. 2017, ApJ, 847, 119, arXiv:1708.09029
Hargis, J. R., Willman, B., & Peter, A. H. G. 2014, ApJL,
795, L13, arXiv:1407.4470
Harris, C. R., Millman, K. J., van der Walt, S. J., et al.
2020, Nature, 585, 357, arXiv:2006.10256
Hartley, W. G., Choi, A., et al. 2020, arXiv e-prints,
arXiv:2012.12824, arXiv:2012.12824
Hennig, C., Mohr, J. J., Zenteno, A., et al. 2017, Monthly
Notices of the Royal Astronomical Society, 467, 4015,
https://academic.oup.com/mnras/article-
pdf/467/4/4015/10914049/stx175.pdf
Hildebrandt, H., Kohlinger, F., van den Busch, J. L., et al.
2020, A&A, 633, A69, arXiv:1812.06076
Hillis, T. J., Williams, B. F., Dolphin, A. E., Dalcanton,
J. J., & Skillman, E. D. 2016, ApJ, 831, 191,
arXiv:1609.02106
Hilton, M., Sifon, C., Naess, S., et al. 2021, ApJS, 253, 3,
arXiv:2009.11043
Huang, X., Storfer, C., Ravi, V., et al. 2020, The
Astrophysical Journal, 894, 78
Huang, X., Storfer, C., Gu, A., et al. 2021, Discovering New
Strong Gravitational Lenses in the DESI Legacy Imaging
Surveys, arXiv:2005.04730
Huchra, J. P., Macri, L. M., Masters, K. L., et al. 2012,
ApJS, 199, 26, arXiv:1108.0669
Hunter, J. D. 2007, Computing In Science & Engineering,
9, 90
Ibata, R., Irwin, M., Lewis, G., Ferguson, A. M. N., &
Tanvir, N. 2001a, Nature, 412, 49,
arXiv:astro-ph/0107090
Ibata, R., Lewis, G. F., Irwin, M., Totten, E., & Quinn, T.
2001b, ApJ, 551, 294, arXiv:astro-ph/0004011
Irwin, M. J., Bunclark, P. S., Bridgeland, M. T., &
McMahon, R. G. 1990, MNRAS, 244, 16P
Ishiyama, T., Sudo, K., Yokoi, S., et al. 2016, ApJ, 826, 9,
arXiv:1602.00465
Jacobs, B. A., Rizzi, L., Tully, R. B., et al. 2009, AJ, 138,
332, arXiv:0902.3675
Jacobs, C., Collett, T., Glazebrook, K., et al. 2019a, The
Astrophysical Journal Supplement Series, 243, 17
Jacobs, C., Collett, T., Glazebrook, K., et al. 2019b,
Monthly Notices of the Royal Astronomical Society, 484,
5330–5349
Jahn, E. D., Sales, L. V., Wetzel, A., et al. 2019, MNRAS,
489, 5348, arXiv:1907.02979
Jang, I. S., de Jong, R. S., Minchev, I., et al. 2020, A&A,
640, L19, arXiv:2007.13749
Jethwa, P., Erkal, D., & Belokurov, V. 2016, MNRAS, 461,
2212, arXiv:1603.04420
Jethwa, P., Erkal, D., & Belokurov, V. 2018a, MNRAS,
473, 2060, arXiv:1612.07834
Jethwa, P., Torrealba, G., Navarrete, C., et al. 2018b,
MNRAS, 480, 5342, arXiv:1711.09103
Ji, A. P., Frebel, A., Chiti, A., & Simon, J. D. 2016,
Nature, 531, 610, arXiv:1512.01558
Johnston, K. V., Spergel, D. N., & Haydn, C. 2002, ApJ,
570, 656, arXiv:astro-ph/0111196
Johnston, K. V., Zhao, H., Spergel, D. N., & Hernquist, L.
1999, ApJL, 512, L109, arXiv:astro-ph/9807243
Kallivayalil, N., Sales, L. V., Zivick, P., et al. 2018, ApJ,
867, 19, arXiv:1805.01448
Karachentsev, I. D., Makarov, D. I., & Kaisina, E. I. 2013,
AJ, 145, 101, arXiv:1303.5328
Karachentsev, I. D., Sharina, M. E., Makarov, D. I., et al.
2002, A&A, 389, 812, arXiv:astro-ph/0204507
Karachentsev, I. D., Grebel, E. K., Sharina, M. E., et al.
2003, A&A, 404, 93, arXiv:astro-ph/0302045
Karunakaran, A., Spekkens, K., Zaritsky, D., et al. 2020,
ApJ, 902, 39, arXiv:2005.14202
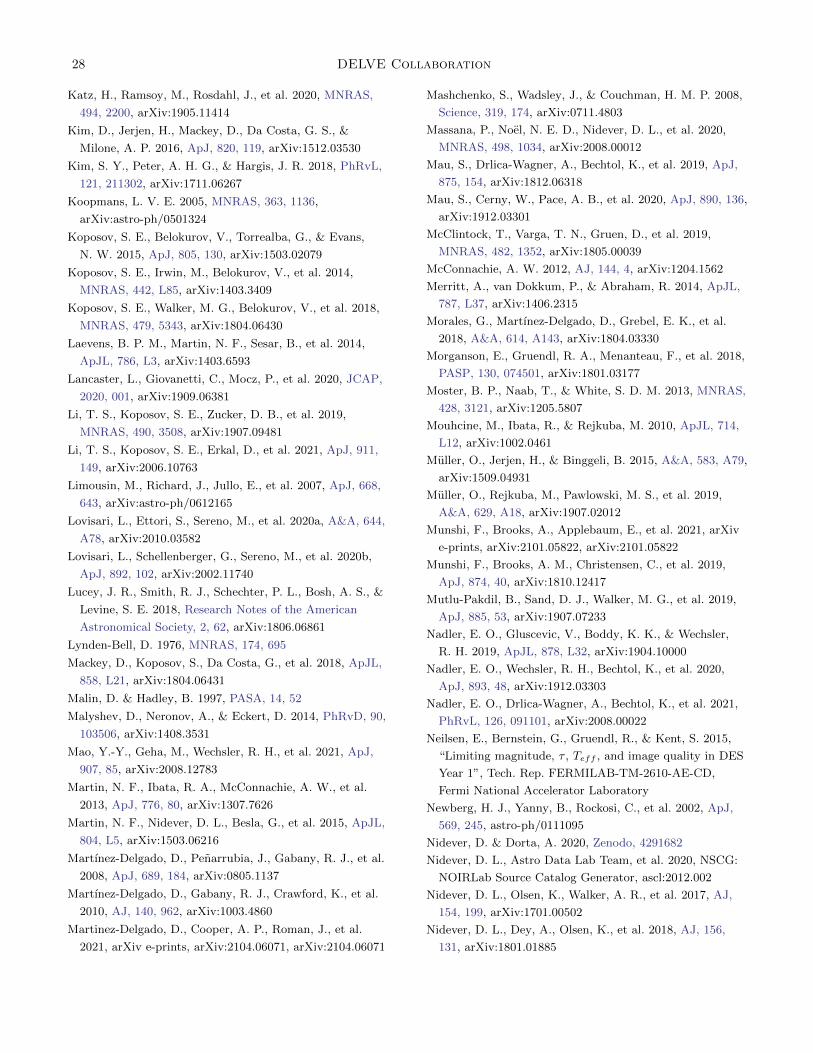
28 DELVE Collaboration
Katz, H., Ramsoy, M., Rosdahl, J., et al. 2020, MNRAS,
494, 2200, arXiv:1905.11414
Kim, D., Jerjen, H., Mackey, D., Da Costa, G. S., &
Milone, A. P. 2016, ApJ, 820, 119, arXiv:1512.03530
Kim, S. Y., Peter, A. H. G., & Hargis, J. R. 2018, PhRvL,
121, 211302, arXiv:1711.06267
Koopmans, L. V. E. 2005, MNRAS, 363, 1136,
arXiv:astro-ph/0501324
Koposov, S. E., Belokurov, V., Torrealba, G., & Evans,
N. W. 2015, ApJ, 805, 130, arXiv:1503.02079
Koposov, S. E., Irwin, M., Belokurov, V., et al. 2014,
MNRAS, 442, L85, arXiv:1403.3409
Koposov, S. E., Walker, M. G., Belokurov, V., et al. 2018,
MNRAS, 479, 5343, arXiv:1804.06430
Laevens, B. P. M., Martin, N. F., Sesar, B., et al. 2014,
ApJL, 786, L3, arXiv:1403.6593
Lancaster, L., Giovanetti, C., Mocz, P., et al. 2020, JCAP,
2020, 001, arXiv:1909.06381
Li, T. S., Koposov, S. E., Zucker, D. B., et al. 2019,
MNRAS, 490, 3508, arXiv:1907.09481
Li, T. S., Koposov, S. E., Erkal, D., et al. 2021, ApJ, 911,
149, arXiv:2006.10763
Limousin, M., Richard, J., Jullo, E., et al. 2007, ApJ, 668,
643, arXiv:astro-ph/0612165
Lovisari, L., Ettori, S., Sereno, M., et al. 2020a, A&A, 644,
A78, arXiv:2010.03582
Lovisari, L., Schellenberger, G., Sereno, M., et al. 2020b,
ApJ, 892, 102, arXiv:2002.11740
Lucey, J. R., Smith, R. J., Schechter, P. L., Bosh, A. S., &
Levine, S. E. 2018, Research Notes of the American
Astronomical Society, 2, 62, arXiv:1806.06861
Lynden-Bell, D. 1976, MNRAS, 174, 695
Mackey, D., Koposov, S., Da Costa, G., et al. 2018, ApJL,
858, L21, arXiv:1804.06431
Malin, D. & Hadley, B. 1997, PASA, 14, 52
Malyshev, D., Neronov, A., & Eckert, D. 2014, PhRvD, 90,
103506, arXiv:1408.3531
Mao, Y.-Y., Geha, M., Wechsler, R. H., et al. 2021, ApJ,
907, 85, arXiv:2008.12783
Martin, N. F., Ibata, R. A., McConnachie, A. W., et al.
2013, ApJ, 776, 80, arXiv:1307.7626
Martin, N. F., Nidever, D. L., Besla, G., et al. 2015, ApJL,
804, L5, arXiv:1503.06216
Martınez-Delgado, D., Penarrubia, J., Gabany, R. J., et al.
2008, ApJ, 689, 184, arXiv:0805.1137
Martınez-Delgado, D., Gabany, R. J., Crawford, K., et al.
2010, AJ, 140, 962, arXiv:1003.4860
Martinez-Delgado, D., Cooper, A. P., Roman, J., et al.
2021, arXiv e-prints, arXiv:2104.06071, arXiv:2104.06071
Mashchenko, S., Wadsley, J., & Couchman, H. M. P. 2008,
Science, 319, 174, arXiv:0711.4803
Massana, P., Noel, N. E. D., Nidever, D. L., et al. 2020,
MNRAS, 498, 1034, arXiv:2008.00012
Mau, S., Drlica-Wagner, A., Bechtol, K., et al. 2019, ApJ,
875, 154, arXiv:1812.06318
Mau, S., Cerny, W., Pace, A. B., et al. 2020, ApJ, 890, 136,
arXiv:1912.03301
McClintock, T., Varga, T. N., Gruen, D., et al. 2019,
MNRAS, 482, 1352, arXiv:1805.00039
McConnachie, A. W. 2012, AJ, 144, 4, arXiv:1204.1562
Merritt, A., van Dokkum, P., & Abraham, R. 2014, ApJL,
787, L37, arXiv:1406.2315
Morales, G., Martınez-Delgado, D., Grebel, E. K., et al.
2018, A&A, 614, A143, arXiv:1804.03330
Morganson, E., Gruendl, R. A., Menanteau, F., et al. 2018,
PASP, 130, 074501, arXiv:1801.03177
Moster, B. P., Naab, T., & White, S. D. M. 2013, MNRAS,
428, 3121, arXiv:1205.5807
Mouhcine, M., Ibata, R., & Rejkuba, M. 2010, ApJL, 714,
L12, arXiv:1002.0461
Muller, O., Jerjen, H., & Binggeli, B. 2015, A&A, 583, A79,
arXiv:1509.04931
Muller, O., Rejkuba, M., Pawlowski, M. S., et al. 2019,
A&A, 629, A18, arXiv:1907.02012
Munshi, F., Brooks, A., Applebaum, E., et al. 2021, arXiv
e-prints, arXiv:2101.05822, arXiv:2101.05822
Munshi, F., Brooks, A. M., Christensen, C., et al. 2019,
ApJ, 874, 40, arXiv:1810.12417
Mutlu-Pakdil, B., Sand, D. J., Walker, M. G., et al. 2019,
ApJ, 885, 53, arXiv:1907.07233
Nadler, E. O., Gluscevic, V., Boddy, K. K., & Wechsler,
R. H. 2019, ApJL, 878, L32, arXiv:1904.10000
Nadler, E. O., Wechsler, R. H., Bechtol, K., et al. 2020,
ApJ, 893, 48, arXiv:1912.03303
Nadler, E. O., Drlica-Wagner, A., Bechtol, K., et al. 2021,
PhRvL, 126, 091101, arXiv:2008.00022
Neilsen, E., Bernstein, G., Gruendl, R., & Kent, S. 2015,
“Limiting magnitude, τ , Teff , and image quality in DES
Year 1”, Tech. Rep. FERMILAB-TM-2610-AE-CD,
Fermi National Accelerator Laboratory
Newberg, H. J., Yanny, B., Rockosi, C., et al. 2002, ApJ,
569, 245, astro-ph/0111095
Nidever, D. & Dorta, A. 2020, Zenodo, 4291682
Nidever, D. L., Astro Data Lab Team, et al. 2020, NSCG:
NOIRLab Source Catalog Generator, ascl:2012.002
Nidever, D. L., Olsen, K., Walker, A. R., et al. 2017, AJ,
154, 199, arXiv:1701.00502
Nidever, D. L., Dey, A., Olsen, K., et al. 2018, AJ, 156,
131, arXiv:1801.01885
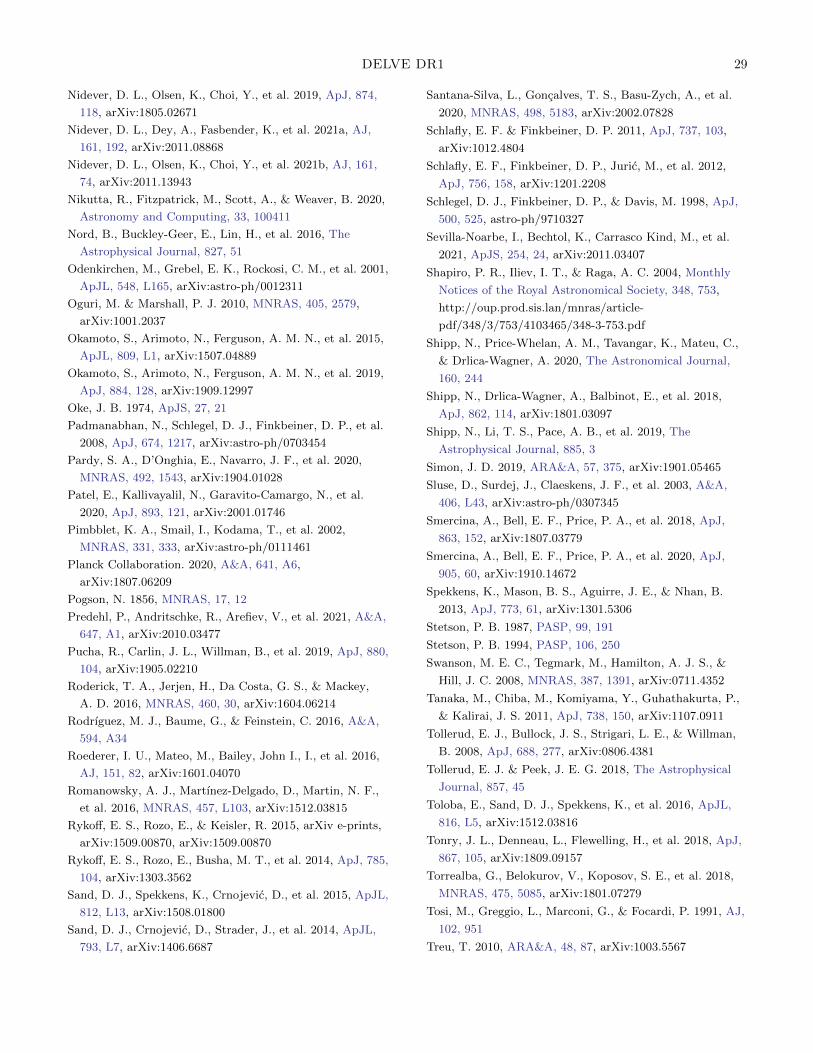
DELVE DR1 29
Nidever, D. L., Olsen, K., Choi, Y., et al. 2019, ApJ, 874,
118, arXiv:1805.02671
Nidever, D. L., Dey, A., Fasbender, K., et al. 2021a, AJ,
161, 192, arXiv:2011.08868
Nidever, D. L., Olsen, K., Choi, Y., et al. 2021b, AJ, 161,
74, arXiv:2011.13943
Nikutta, R., Fitzpatrick, M., Scott, A., & Weaver, B. 2020,
Astronomy and Computing, 33, 100411
Nord, B., Buckley-Geer, E., Lin, H., et al. 2016, The
Astrophysical Journal, 827, 51
Odenkirchen, M., Grebel, E. K., Rockosi, C. M., et al. 2001,
ApJL, 548, L165, arXiv:astro-ph/0012311
Oguri, M. & Marshall, P. J. 2010, MNRAS, 405, 2579,
arXiv:1001.2037
Okamoto, S., Arimoto, N., Ferguson, A. M. N., et al. 2015,
ApJL, 809, L1, arXiv:1507.04889
Okamoto, S., Arimoto, N., Ferguson, A. M. N., et al. 2019,
ApJ, 884, 128, arXiv:1909.12997
Oke, J. B. 1974, ApJS, 27, 21
Padmanabhan, N., Schlegel, D. J., Finkbeiner, D. P., et al.
2008, ApJ, 674, 1217, arXiv:astro-ph/0703454
Pardy, S. A., D’Onghia, E., Navarro, J. F., et al. 2020,
MNRAS, 492, 1543, arXiv:1904.01028
Patel, E., Kallivayalil, N., Garavito-Camargo, N., et al.
2020, ApJ, 893, 121, arXiv:2001.01746
Pimbblet, K. A., Smail, I., Kodama, T., et al. 2002,
MNRAS, 331, 333, arXiv:astro-ph/0111461
Planck Collaboration. 2020, A&A, 641, A6,
arXiv:1807.06209
Pogson, N. 1856, MNRAS, 17, 12
Predehl, P., Andritschke, R., Arefiev, V., et al. 2021, A&A,
647, A1, arXiv:2010.03477
Pucha, R., Carlin, J. L., Willman, B., et al. 2019, ApJ, 880,
104, arXiv:1905.02210
Roderick, T. A., Jerjen, H., Da Costa, G. S., & Mackey,
A. D. 2016, MNRAS, 460, 30, arXiv:1604.06214
Rodrıguez, M. J., Baume, G., & Feinstein, C. 2016, A&A,
594, A34
Roederer, I. U., Mateo, M., Bailey, John I., I., et al. 2016,
AJ, 151, 82, arXiv:1601.04070
Romanowsky, A. J., Martınez-Delgado, D., Martin, N. F.,
et al. 2016, MNRAS, 457, L103, arXiv:1512.03815
Rykoff, E. S., Rozo, E., & Keisler, R. 2015, arXiv e-prints,
arXiv:1509.00870, arXiv:1509.00870
Rykoff, E. S., Rozo, E., Busha, M. T., et al. 2014, ApJ, 785,
104, arXiv:1303.3562
Sand, D. J., Spekkens, K., Crnojevic, D., et al. 2015, ApJL,
812, L13, arXiv:1508.01800
Sand, D. J., Crnojevic, D., Strader, J., et al. 2014, ApJL,
793, L7, arXiv:1406.6687
Santana-Silva, L., Goncalves, T. S., Basu-Zych, A., et al.
2020, MNRAS, 498, 5183, arXiv:2002.07828
Schlafly, E. F. & Finkbeiner, D. P. 2011, ApJ, 737, 103,
arXiv:1012.4804
Schlafly, E. F., Finkbeiner, D. P., Juric, M., et al. 2012,
ApJ, 756, 158, arXiv:1201.2208
Schlegel, D. J., Finkbeiner, D. P., & Davis, M. 1998, ApJ,
500, 525, astro-ph/9710327
Sevilla-Noarbe, I., Bechtol, K., Carrasco Kind, M., et al.
2021, ApJS, 254, 24, arXiv:2011.03407
Shapiro, P. R., Iliev, I. T., & Raga, A. C. 2004, Monthly
Notices of the Royal Astronomical Society, 348, 753,
http://oup.prod.sis.lan/mnras/article-
pdf/348/3/753/4103465/348-3-753.pdf
Shipp, N., Price-Whelan, A. M., Tavangar, K., Mateu, C.,
& Drlica-Wagner, A. 2020, The Astronomical Journal,
160, 244
Shipp, N., Drlica-Wagner, A., Balbinot, E., et al. 2018,
ApJ, 862, 114, arXiv:1801.03097
Shipp, N., Li, T. S., Pace, A. B., et al. 2019, The
Astrophysical Journal, 885, 3
Simon, J. D. 2019, ARA&A, 57, 375, arXiv:1901.05465
Sluse, D., Surdej, J., Claeskens, J. F., et al. 2003, A&A,
406, L43, arXiv:astro-ph/0307345
Smercina, A., Bell, E. F., Price, P. A., et al. 2018, ApJ,
863, 152, arXiv:1807.03779
Smercina, A., Bell, E. F., Price, P. A., et al. 2020, ApJ,
905, 60, arXiv:1910.14672
Spekkens, K., Mason, B. S., Aguirre, J. E., & Nhan, B.
2013, ApJ, 773, 61, arXiv:1301.5306
Stetson, P. B. 1987, PASP, 99, 191
Stetson, P. B. 1994, PASP, 106, 250
Swanson, M. E. C., Tegmark, M., Hamilton, A. J. S., &
Hill, J. C. 2008, MNRAS, 387, 1391, arXiv:0711.4352
Tanaka, M., Chiba, M., Komiyama, Y., Guhathakurta, P.,
& Kalirai, J. S. 2011, ApJ, 738, 150, arXiv:1107.0911
Tollerud, E. J., Bullock, J. S., Strigari, L. E., & Willman,
B. 2008, ApJ, 688, 277, arXiv:0806.4381
Tollerud, E. J. & Peek, J. E. G. 2018, The Astrophysical
Journal, 857, 45
Toloba, E., Sand, D. J., Spekkens, K., et al. 2016, ApJL,
816, L5, arXiv:1512.03816
Tonry, J. L., Denneau, L., Flewelling, H., et al. 2018, ApJ,
867, 105, arXiv:1809.09157
Torrealba, G., Belokurov, V., Koposov, S. E., et al. 2018,
MNRAS, 475, 5085, arXiv:1801.07279
Tosi, M., Greggio, L., Marconi, G., & Focardi, P. 1991, AJ,
102, 951
Treu, T. 2010, ARA&A, 48, 87, arXiv:1003.5567
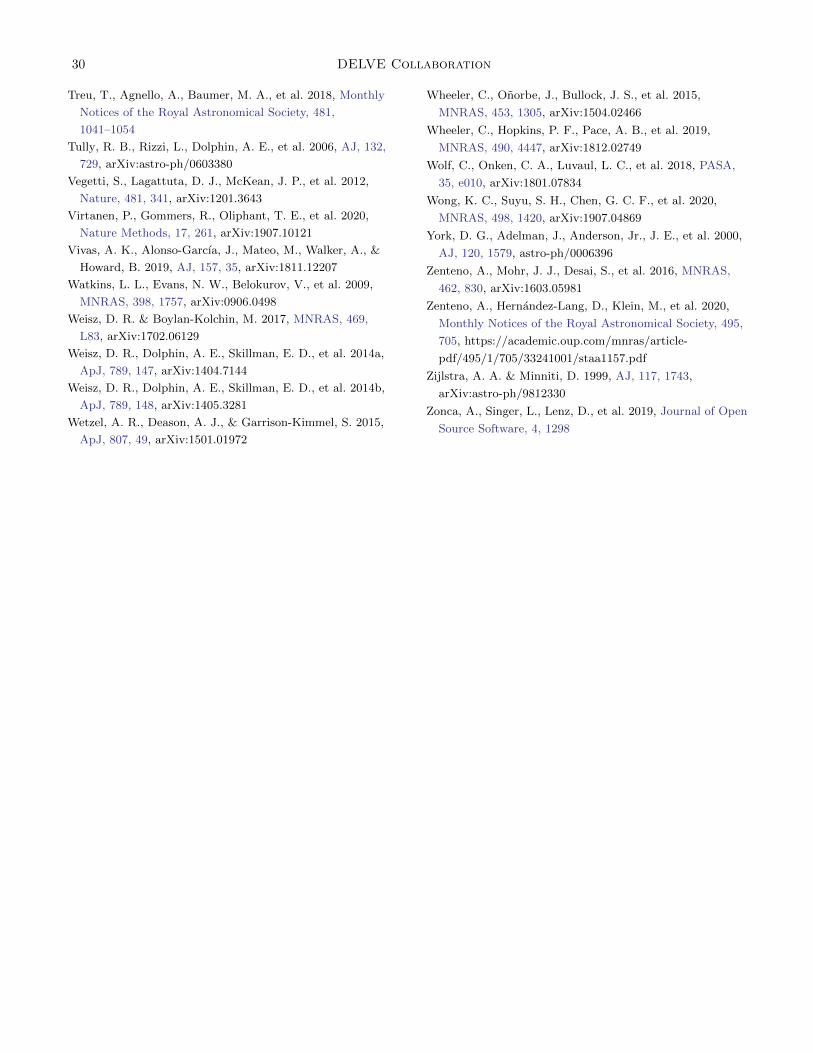
30 DELVE Collaboration
Treu, T., Agnello, A., Baumer, M. A., et al. 2018, Monthly
Notices of the Royal Astronomical Society, 481,
1041–1054
Tully, R. B., Rizzi, L., Dolphin, A. E., et al. 2006, AJ, 132,
729, arXiv:astro-ph/0603380
Vegetti, S., Lagattuta, D. J., McKean, J. P., et al. 2012,
Nature, 481, 341, arXiv:1201.3643
Virtanen, P., Gommers, R., Oliphant, T. E., et al. 2020,
Nature Methods, 17, 261, arXiv:1907.10121
Vivas, A. K., Alonso-Garcıa, J., Mateo, M., Walker, A., &
Howard, B. 2019, AJ, 157, 35, arXiv:1811.12207
Watkins, L. L., Evans, N. W., Belokurov, V., et al. 2009,
MNRAS, 398, 1757, arXiv:0906.0498
Weisz, D. R. & Boylan-Kolchin, M. 2017, MNRAS, 469,
L83, arXiv:1702.06129
Weisz, D. R., Dolphin, A. E., Skillman, E. D., et al. 2014a,
ApJ, 789, 147, arXiv:1404.7144
Weisz, D. R., Dolphin, A. E., Skillman, E. D., et al. 2014b,
ApJ, 789, 148, arXiv:1405.3281
Wetzel, A. R., Deason, A. J., & Garrison-Kimmel, S. 2015,
ApJ, 807, 49, arXiv:1501.01972
Wheeler, C., Onorbe, J., Bullock, J. S., et al. 2015,
MNRAS, 453, 1305, arXiv:1504.02466
Wheeler, C., Hopkins, P. F., Pace, A. B., et al. 2019,
MNRAS, 490, 4447, arXiv:1812.02749
Wolf, C., Onken, C. A., Luvaul, L. C., et al. 2018, PASA,
35, e010, arXiv:1801.07834
Wong, K. C., Suyu, S. H., Chen, G. C. F., et al. 2020,
MNRAS, 498, 1420, arXiv:1907.04869
York, D. G., Adelman, J., Anderson, Jr., J. E., et al. 2000,
AJ, 120, 1579, astro-ph/0006396
Zenteno, A., Mohr, J. J., Desai, S., et al. 2016, MNRAS,
462, 830, arXiv:1603.05981
Zenteno, A., Hernandez-Lang, D., Klein, M., et al. 2020,
Monthly Notices of the Royal Astronomical Society, 495,
705, https://academic.oup.com/mnras/article-
pdf/495/1/705/33241001/staa1157.pdf
Zijlstra, A. A. & Minniti, D. 1999, AJ, 117, 1743,
arXiv:astro-ph/9812330
Zonca, A., Singer, L., Lenz, D., et al. 2019, Journal of Open
Source Software, 4, 1298