the czech audit: internal consistency and latent structure ladislav csémy and hana sovinová...
TRANSCRIPT
The Czech AUDIT: Internal Consistency and Latent Structure
Ladislav Csémy and Hana SovinováNational Institute of Public Health, Czech Republic
Inebria Conference Newcastle, October 2009

Trends in per capita consumption of alcoholin the Czech Republic 1950 - 2005
Source: Czech Statistical Office
1950 1955 1960 1965 1970 1975 1980 1985 1990 1995 2000 20053
4
5
6
7
8
9
10
11litres of pure alcohol/inhabitant
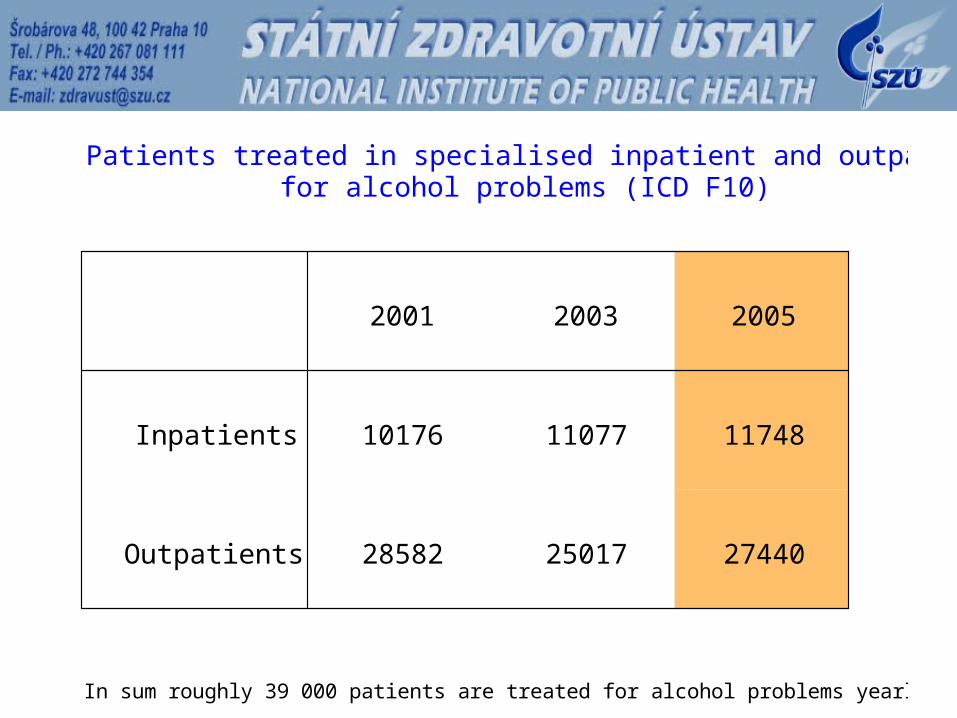
Patients treated in specialised inpatient and outpatient facilitiesfor alcohol problems (ICD F10)
In sum roughly 39 000 patients are treated for alcohol problems yearly
2001 2003 2005
Inpatients 10176 11077 11748
Outpatients 28582 25017 27440
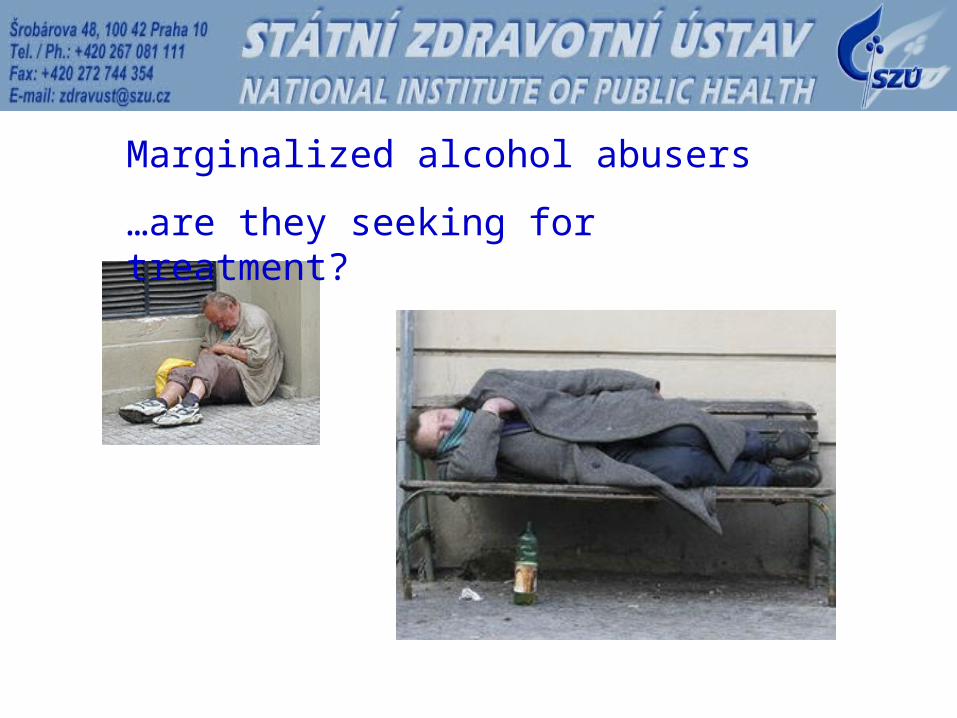
Marginalized alcohol abusers
…are they seeking for treatment?

• Early identification and brief intervention represent an approach that may reduce alcohol-related problems.
• EIBI is a new approach in the Czech Republic, which has been introduced in the frame of our collaboration in PHEPA Project.
• AUDIT seems to be a widely tested instrument useful for screening of alcohol-related problems in offices of general practitioners and in the population as well.
Status of the EIBI in the Czech Republic
• Compared to other countries - untill the recent years - we had little experience with EIBI and AUDIT. This exercise aims to bridge this gap.
• The analyses presented here are also preparatory work for application of the AUDIT in a larger research study funded by the Czech Ministry of Health and focused on alcohol consumption and alcohol-related problems among young adult Czechs.

Application of the Czech AUDIT in Different Context
Major goal was to compare the performance and psychometric characteristics of the AUDIT in two different sites
Specific aimsto compare reliability of the scale
to examine the internal structure of the scale
to compare the rates of alcohol-related problems based on AUDIT applied in different context
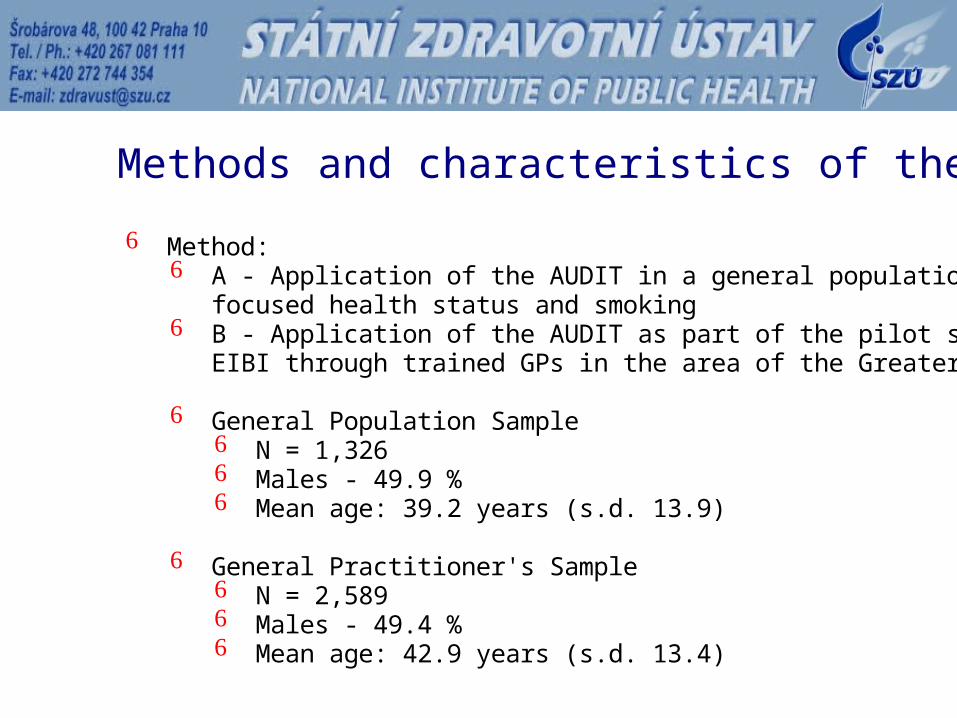
Method: A - Application of the AUDIT in a general population survey focused health status and smokingB - Application of the AUDIT as part of the pilot study on EIBI through trained GPs in the area of the Greater Prague
General Population SampleN = 1,326Males - 49.9 %Mean age: 39.2 years (s.d. 13.9)
General Practitioner's SampleN = 2,589Males - 49.4 %Mean age: 42.9 years (s.d. 13.4)
Methods and characteristics of the samples
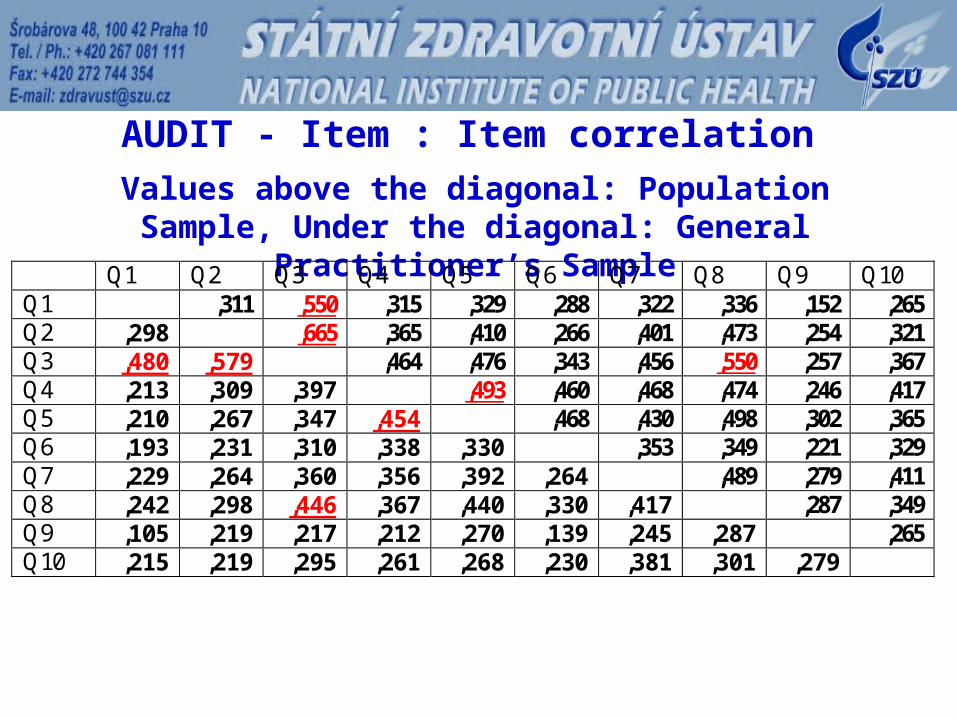
Values above the diagonal: Population Sample, Under the diagonal: General Practitioner’s Sample
AUDIT - Item : Item correlation
Q1 Q2 Q3 Q4 Q5 Q6 Q7 Q8 Q9 Q10 Q1 ,311 ,550 ,315 ,329 ,288 ,322 ,336 ,152 ,265 Q2 ,298 ,665 ,365 ,410 ,266 ,401 ,473 ,254 ,321 Q3 ,480 ,579 ,464 ,476 ,343 ,456 ,550 ,257 ,367 Q4 ,213 ,309 ,397 ,493 ,460 ,468 ,474 ,246 ,417 Q5 ,210 ,267 ,347 ,454 ,468 ,430 ,498 ,302 ,365 Q6 ,193 ,231 ,310 ,338 ,330 ,353 ,349 ,221 ,329 Q7 ,229 ,264 ,360 ,356 ,392 ,264 ,489 ,279 ,411 Q8 ,242 ,298 ,446 ,367 ,440 ,330 ,417 ,287 ,349 Q9 ,105 ,219 ,217 ,212 ,270 ,139 ,245 ,287 ,265 Q10 ,215 ,219 ,295 ,261 ,268 ,230 ,381 ,301 ,279
General Population Sample General Practitioner’s Sample
AUDIT Items
Scale Mean if
Item Deleted
Corrected Item-Total Correlation
Cronbach's Alpha if
Item Deleted
Scale Mean if
Item Deleted
Corrected Item-Total Correlation
Cronbach's Alpha if Item
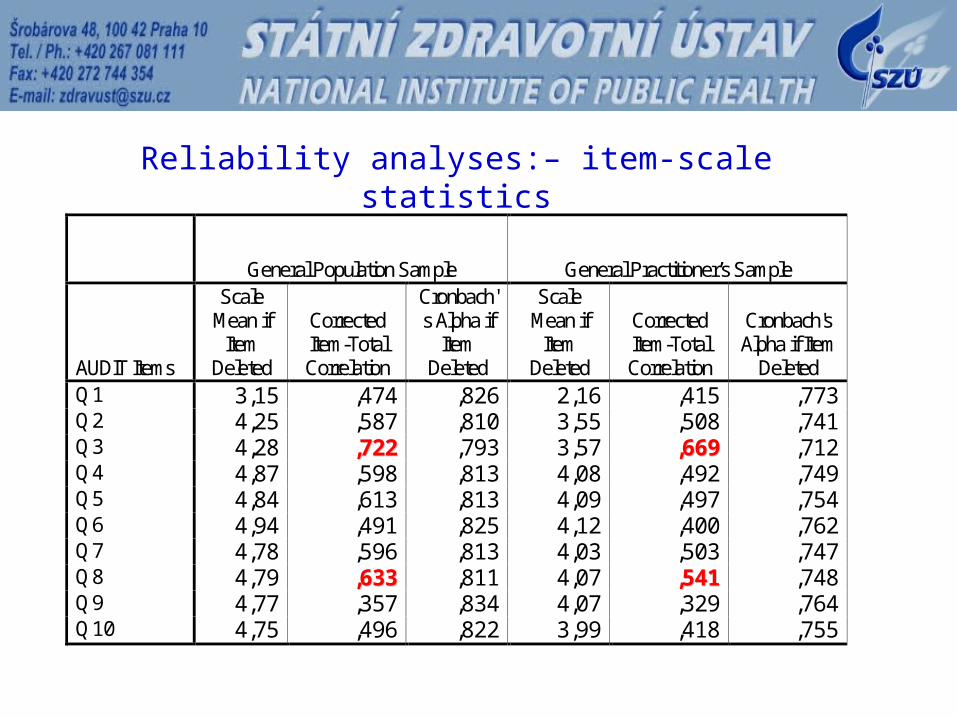
Deleted Q1 3,15 ,474 ,826 2,16 ,415 ,773 Q2 4,25 ,587 ,810 3,55 ,508 ,741 Q3 4,28 ,,772222 ,793 3,57 ,,666699 ,712 Q4 4,87 ,598 ,813 4,08 ,492 ,749 Q5 4,84 ,613 ,813 4,09 ,497 ,754 Q6 4,94 ,491 ,825 4,12 ,400 ,762 Q7 4,78 ,596 ,813 4,03 ,503 ,747 Q8 4,79 ,,663333 ,811 4,07 ,,554411 ,748 Q9 4,77 ,357 ,834 4,07 ,329 ,764 Q10 4,75 ,496 ,822 3,99 ,418 ,755
Reliability analyses:– item-scale statistics

AUDIT - vzorek praktických lékařů
Celkový bodový skór
32
28
24
22
20
18
16
14
12
10
8
6
4
2
0
Četn
ost
500
400
300
200
100
0
AUDIT - populační vzorek
Celkový bodový skór
Četn
ost
300
200
100
0
Histogram of the AUDIT Scores

Scale statistics (reliability)
Mean S.D.Cronbach's
Alpha
General Popul. Sample 5.05 4.73 0.83
G. Practicioner's Sample 4.19 3.75 0.77
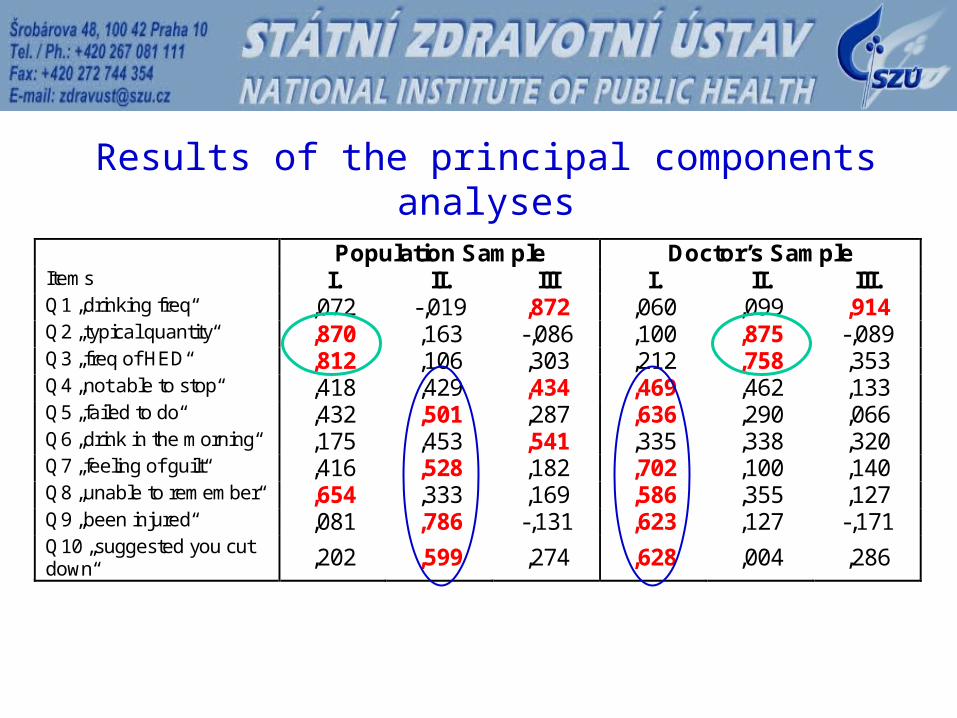
Results of the principal components analyses Population Sample Doctor’s Sample Items I. II. III I. II. III. Q1 „drinking freq“ ,072 -,019 ,872 ,060 ,099 ,914 Q2 „typical quantity“ ,870 ,163 -,086 ,100 ,875 -,089 Q3 „freq of HED“ ,812 ,106 ,303 ,212 ,758 ,353 Q4 „not able to stop“ ,418 ,429 ,434 ,469 ,462 ,133 Q5 „failed to do“ ,432 ,501 ,287 ,636 ,290 ,066 Q6 „drink in the morning“ ,175 ,453 ,541 ,335 ,338 ,320 Q7 „feeling of guilt“ ,416 ,528 ,182 ,702 ,100 ,140 Q8 „unable to remember“ ,654 ,333 ,169 ,586 ,355 ,127 Q9 „been injured“ ,081 ,786 -,131 ,623 ,127 -,171 Q10 „suggested you cut down“ ,202 ,599 ,274 ,628 ,004 ,286

Categorised Scores in AUDIT by Gender and Study
Score <8 [No alcohol
problem]
Score 8 - 19 [Alcohol problem indicated for minimal or brief intervention]
Score > 19 [Serious alcohol
problem / need to be consulted
with specialist]
General Population
Males 67,1 % 29,2 % 3,8 %
Females 90,4 % 9,3 % 0,3 %
Total 78,7 % 19,2 % 2,0 %
Doctor's Sample
Males 76,7 % 22,2 % 1,1 %
Females 93,5 % 6,3 % 0,2 %
Total 85,3 % 14,0 % 0,7 %
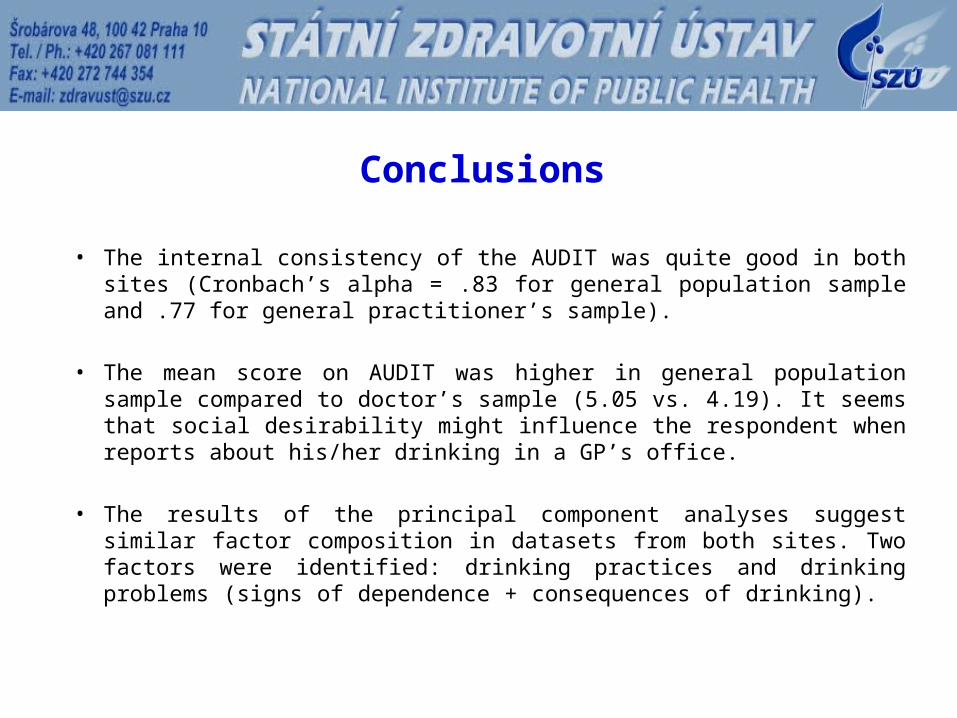
• The internal consistency of the AUDIT was quite good in both sites (Cronbach’s alpha = .83 for general population sample and .77 for general practitioner’s sample).
• The mean score on AUDIT was higher in general population sample compared to doctor’s sample (5.05 vs. 4.19). It seems that social desirability might influence the respondent when reports about his/her drinking in a GP’s office.
• The results of the principal component analyses suggest similar factor composition in datasets from both sites. Two factors were identified: drinking practices and drinking problems (signs of dependence + consequences of drinking).
Conclusions
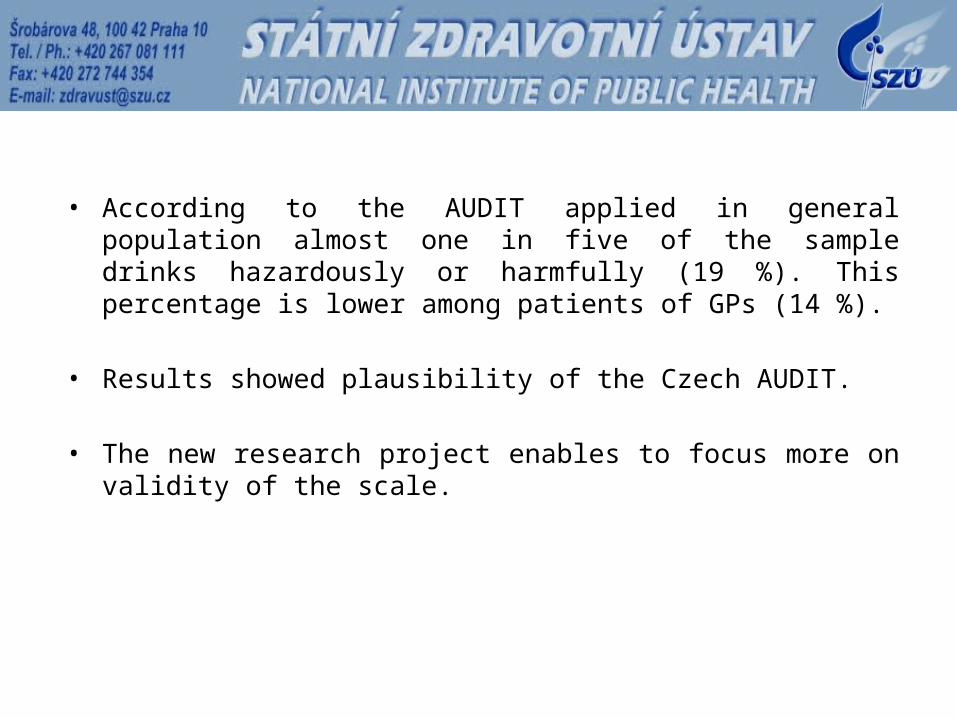
• According to the AUDIT applied in general population almost one in five of the sample drinks hazardously or harmfully (19 %). This percentage is lower among patients of GPs (14 %).
• Results showed plausibility of the Czech AUDIT.
• The new research project enables to focus more on validity of the scale.
Thank you for your attention.
Thank you for your attention.
This work has been supported by the This work has been supported by the grant grant ##NS9645-4/2008 from IGA MH CRNS9645-4/2008 from IGA MH CR