the cwave 2000 visual agent workbenchcmp/thesis.pdf · we show with two case studies that the...
TRANSCRIPT
THE CWAVE 2000 VISUAL AGENT WORKBENCH
by
Christian Müller-Planitz
A dissertation submitted to the faculty of The University of Utah
in partial fulfillment of the requirements for the degree of
Doctor of Philosophy
Department of Computer Science
The University of Utah
August 2000

Copyright © Christian Müller-Planitz 2000
All Rights Reserved
ABSTRACT
Over the last several years, measurement technology has undergone a transformation
from systems with many transducers attached to a central computer to distributed meas-
urement systems where each transducer has an attached CPU, downloadable code, and a
network connection. Even though measurement technology has changed dramatically,
measurement systems are still built using old-fashioned and difficult to debug program
logic control (PLC) technology, which lacks important features such as fault tolerance,
flexibility, and visualization capabilities.
Research in software agent technology has been underway for several years, result-
ing in many high-performance agent systems. With a few exceptions, most existing
agent systems focus on low-level technical details, such as performance, mobility and
communication and do not address deployment, scaling, and especially the management
issues of hundreds or thousands of agents. Many of them also ignore higher-level is-
sues, such as intelligence and autonomous behavior.
Based on experiments and case studies in two different domains, we demonstrate
that software agents combined with a visual programming language address the short-
comings of the PLC technology mentioned above. In particular, agent autonomy and
hierarchical structuring reduce communication overhead and permit redundancy to be
built into the system. While a small-scale, hierarchically structured distributed meas-
urement system (DMS) can be managed without a graphical environment, larger-scale
v
systems benefit from visual metaphors to effectively manage an arbitrary number of
measurement nodes.
In support of this claim, we have constructed a prototype of a visual agent work-
bench that can be used to design, simulate and manage agent systems for distributed
measurement and control applications. Instead of adding visualization and management
capabilities to an existing agent architecture, we have taken the unique approach of
combining a visual programming language with our own agent architecture customized
for DMS applications. We show with two case studies that the resulting system, a com-
bination of a highly customizable, general-purpose visual programming environment
with an extensible agent architecture, can be used both as a rapid prototyping tool, and
also as a development tool for DMS systems. The case studies demonstrate the deploy-
ment of a large number of agents over a local area network and use of the workbench to
construct and simulate a distributed measurement application with built-in redundancy.
We also show the benefits of visually constructing loggers, filters, and performance
measurement tools and finally compare the benefits of the visual metaphor with conven-
tional systems.
TABLE OF CONTENTS
ABSTRACT.....................................................................................................................iv
LIST OF FIGURES..........................................................................................................ix
LIST OF TABLES ........................................................................................................ xiii
ACKNOWLEGMENTS ................................................................................................xiv
1. INTRODUCTION.......................................................................................................1
1.1 Motivation and outline ....................................................................................3 1.2 Visual programming........................................................................................4 1.3 Dataflow..........................................................................................................5 1.4 Agent-based distributed measurements...........................................................5 1.5 Scenario...........................................................................................................7
2. RELATED WORK .....................................................................................................9
2.1 Distributed measurement systems...................................................................9 2.1.1 Centralized versus distributed measurements ......................................11 2.1.2 Problems and challenges ......................................................................11
2.2 Agent-based systems .....................................................................................12 2.2.1 What is an agent ? ................................................................................13 2.2.2 Definition of the term “Management Agent”.......................................13 2.2.3 Why agents ? ........................................................................................14 2.2.4 Classification of agent systems ............................................................15 2.2.5 Existing agent-based systems...............................................................15 2.2.6 Alternatives to mobile agents...............................................................21 2.2.7 Summary ..............................................................................................22
2.3 Visual programming......................................................................................22 2.3.1 Control- and dataflow models..............................................................24 2.3.2 Existing dataflow languages ................................................................25 2.3.3 Motivation for visual programming.....................................................26 2.3.4 Existing visual programming languages ..............................................27 2.3.5 Summary ..............................................................................................28
2.4 Software busses.............................................................................................28 2.4.1 TIBCO..................................................................................................29
2.5 Summary .......................................................................................................30
vii
3. CWAVE 2000 DATAFLOW TOOLKIT ....................................................................31
3.1 Introduction ...................................................................................................31 3.1.1 Microsoft’s COM/DCOM specification .............................................35 3.1.2 The IDispatch interface ........................................................................36 3.1.3 OLE, ActiveX and OCX specifications ...............................................36 3.1.4 OCX containers....................................................................................38 3.1.5 Introduction to component model used in this thesis...........................38
3.2 Publish/Subscribe software bus ....................................................................39 3.2.1 Publications and subscriptions .............................................................40 3.2.2 Hierarchical naming of topics ..............................................................40 3.2.3 Broadcasts ............................................................................................41 3.2.4 Local versus global buses ....................................................................42 3.2.5 Hubs .....................................................................................................43 3.2.6 AnEvent: Broadcast of objects .............................................................43 3.2.7 Comparison of a DCOM-based bus versus a UDP-based bus .............44
3.3 ActiveX Scripting .........................................................................................46 3.3.1 Scripting engines..................................................................................46 3.3.2 Singlethreaded versus multithreaded scripts........................................47 3.3.3 Scripting meta language.......................................................................47 3.3.4 Scripted agents .....................................................................................48
3.4 Visual Workbench: AnWindows ..................................................................49 3.4.1 Nesting of OCXs..................................................................................51 3.4.2 Active faceplates ..................................................................................51 3.4.3 Design overview...................................................................................57 3.4.4 The type library parser .........................................................................59 3.4.5 Using Pub/Sub to implement dataflow ................................................60 3.4.6 Message broadcasts..............................................................................62 3.4.7 Message delivery..................................................................................62 3.4.8 Dispatch of OCX-events ......................................................................64 3.4.9 Serialization .........................................................................................66
3.5 ActiveNode performance library...................................................................69 3.5.1 Agent-based performance measurements.............................................71 3.5.2 The AnPerf COM object ......................................................................72 3.5.3 The ActiveNode OCX...........................................................................73 3.5.4 Hosting agents with ActiveNodes.........................................................74 3.5.5 Using ActiveNodes in the Visual Workbench .....................................74
4. EVALUATION.........................................................................................................75
4.1 Anecdotal evidence .......................................................................................76 4.2 Flexibility ......................................................................................................77
4.2.1 Integration ............................................................................................77 4.2.2 Authoring of components.....................................................................78 4.2.3 Prevention of visual clutter ..................................................................84
4.3 Performance ..................................................................................................84
viii
4.3.1 Message send/delivery on same machine.............................................86 4.3.2 Message delivery across the network...................................................89 4.3.3 Broadcast of messages to two clients...................................................91 4.3.4 Broadcast of messages to multiple clients ...........................................94 4.3.5 Summary and conclusions....................................................................96
4.4 Scalability......................................................................................................96 4.4.1 Scalability of the software bus .............................................................96 4.4.2 Description of agent system ...............................................................103 4.4.3 Goals ..................................................................................................104 4.4.4 Small scale agent system....................................................................110 4.4.5 Large scale agent system....................................................................116
4.5 Summary .....................................................................................................122
5. FUTURE WORK....................................................................................................124
REFERENCES..............................................................................................................126
LIST OF FIGURES
Figure Page
1. CWave 2000 dataflow toolkit. ............................................................................32
2. AnDesigner: Visual workbench based on AnWindows.....................................50
3. AnWindows running inside the Microsoft Management Console. .....................50
4. Active Faceplates: Using the zoom functionality to hide complexity.................53
5. Toplevel view of performance measurements done in AnWindows. .................53
6. Detailed view of measurements after the user zoomed into the drawing............54
7. More detailed view of performance measurements. ...........................................54
8. Most detailed view of performance measurements.............................................55
9. Hiding complexity by zooming embedded components (1). ..............................55
10. Hiding complexity by zooming embedded components (2). ..............................56
11. Complexity of drawing hidden behind the faceplate of an embedded OCX.......56
12. Wrapping and nesting of OCXs. .........................................................................58
13. Mapping of wire names to Publish/Subscribe topics. .........................................61
14. Dispatch of Publish / Subscribe messages to a legacy OCX...............................63
15. Dispatch of Pub/Sub messages to AnWindows aware OCX. .............................64
16. Conceptual measurement hierarchy using ActiveNodes.....................................70
17. The AnPerf COM object. ....................................................................................72
18. ActiveNodes running inside the Visual Workbench...........................................73
19. Authoring of components: Starting the VB wizard.............................................80
x
20. Authoring of components: Setting project parameters........................................80
21. Authoring of components: Adding code. ............................................................81
22. Authoring of components: Adding a second OCX. ............................................81
23. Authoring of components: Writing more code. ..................................................82
24. Authoring of components: Compilation of both OCXs. ....................................82
25. Authoring of components: Registration of OCXs...............................................83
26. Authoring of components: Drag & drop. ............................................................83
27. Authoring of components: Execution and cloning of components. ....................84
28. Publication of variants from RAPID to RAPID..................................................87
29. Publication of AnEvent objects from RAPID to RAPID....................................87
30. Publication of AnEvent objects from OOPS to OOPS. ......................................88
31. Publication of variants from OOPS to OOPS. ....................................................88
32. Publication of variants from RAPID to OOPS with the bus on OOPS...............89
33. Publication of AnEvents from RAPID to OOPS with the bus on OOPS. ..........90
34. Publication of variants from OOPS to RAPID with the bus on OOPS...............90
35. Publication of AnEvents from OOPS to RAPID with the bus on OOPS. ..........91
36. Broadcast of variants from RAPID to OOPS and MONSTER with the bus on OOPS. .................................................................................................................92
37. Broadcast of AnEvents from RAPID to OOPS and MONSTER with the bus on OOPS. .................................................................................................................93
38. Broadcast of variants from OOPS to RAPID and MONSTER with the bus on OOPS. .................................................................................................................93
39. Broadcast of AnEvent objects from OOPS to RAPID and MONSTER with the bus on OOPS.......................................................................................................94
40. Broadcast of variants from OOPS to RAPID and MONSTER each with five subscriptions with the bus on OOPS...................................................................95
xi
41. Broadcast of AnEvent objects from OOPS to RAPID and MONSTER each with 5 subscriptions with the bus on OOPS................................................................95
42. Bus throughput. One sender and one receiver on different machines.................98
43. Bus throughput. One sender and two receivers...................................................98
44. Bus throughput. One sender and four receivers. .................................................99
45. Bus throughput. One sender and eight receivers.................................................99
46. Bus throughput. One sender and 10 receivers...................................................100
47. Bus throughput. One sender and 10 receivers using VARIANTS. ...................100
48. Bus throughput. Two senders and one receiver. ...............................................101
49. Bus throughput. Four senders and one receiver. ...............................................101
50. Bus throughput. Eight senders and one receiver. ..............................................102
51. Bus throughput. Ten senders and one receiver. ................................................102
52. Conceptual diagram of the agent system...........................................................104
53. AnWorker and AnWorker Control. ..................................................................106
54. Visualization of performance data gathered by three agents.............................107
55. Visualization of a subset of several hundred agents running on 3 machines. ...108
56. Composition of the AgentViewer OCX............................................................108
57. One agent per AnWorker process with no GUI attached..................................111
58. Fixed number of AnWorker processes (10) with a variable number of agents per AnWorker and no GUI attached........................................................................112
59. Fixed number of AnWorker processes (5) with a variable number of agents per AnWorker and no GUI attached........................................................................113
60. Performance of agent system with attached GUI. .............................................115
61. Screenshot of agent management console while running an experiment..........117
62. Attachment of UI to 300 running agents. ..........................................................118
63. Attachment of UI to 500 running agents. ..........................................................119
xii
64. Detachment of UI from 500 running agents......................................................119
65. 800 agents without an attached UI. ...................................................................120
66. 100 agents. Attachment of two user interfaces. ................................................121
67. 100 agents. Attachment of three user interfaces. ..............................................121
68. 100 agents. Detachment of four user interfaces. ...............................................122
LIST OF TABLES
Table Page
69. Agent characteristics. ..........................................................................................16
70. Comparison of mobile agent systems. ................................................................23
71. Sample properties of an AnEvent object.............................................................44
72. Nine steps to create a dataflow application from scratch....................................79
73. Bus performance for sending variants.................................................................96
74. Bus performance for sending AnEvent objects...................................................97
75. Throughput measurements with one sender......................................................103
76. Throughput measurements with one client. ......................................................103
77. Description of user actions in Figure 60. ..........................................................114
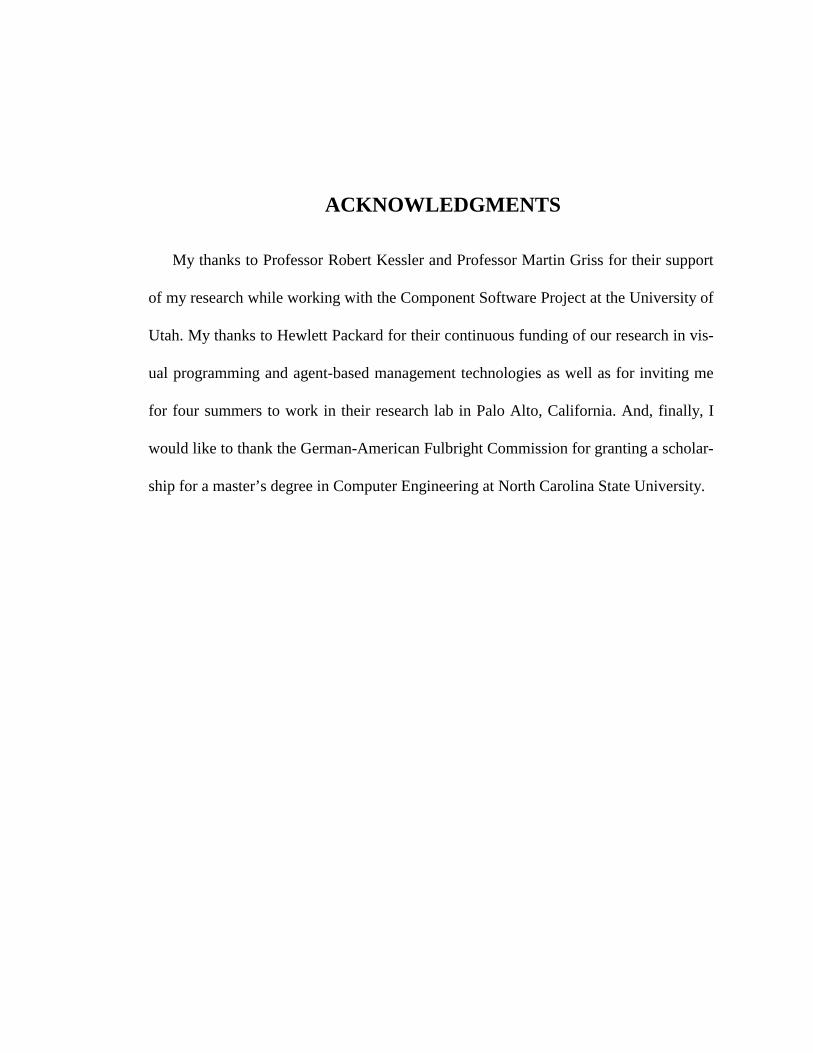
ACKNOWLEDGMENTS
My thanks to Professor Robert Kessler and Professor Martin Griss for their support
of my research while working with the Component Software Project at the University of
Utah. My thanks to Hewlett Packard for their continuous funding of our research in vis-
ual programming and agent-based management technologies as well as for inviting me
for four summers to work in their research lab in Palo Alto, California. And, finally, I
would like to thank the German-American Fulbright Commission for granting a scholar-
ship for a master’s degree in Computer Engineering at North Carolina State University.
CHAPTER 1
INTRODUCTION
This thesis explores and investigates ways in which distributed measurement sys-
tems (DMS) can take advantage of new distributed software agent technology to
produce more flexible, scalable and efficient measurement applications.
Over the last several years, measurement technology has undergone a transformation
from systems with many transducers attached to a central computer to distributed meas-
urement systems where each transducer has an attached CPU, downloadable code, and a
network connection. Even though measurement technology has changed dramatically,
measurement systems are still built using old-fashioned and difficult to debug program
logic control (PLC) technology, which lacks important features such as fault tolerance,
flexibility, and visualization capabilities.
Research in software agent technology has been underway for several years, result-
ing in many high-performance agent systems. With a few exceptions, most existing
agent systems focus on low-level technical details, such as performance, mobility and
communication and do not address deployment, scaling, and especially the management
issues of hundreds or thousands of agents. Many of them also ignore higher-level is-
sues, such as intelligence and autonomous behavior.
Based on experiments and case studies in two different domains, we demonstrate
that software agents combined with a visual programming language address the short-
2
comings of the PLC technology mentioned above. In particular, agent autonomy and
hierarchical structuring reduce communication overhead and permit redundancy to be
built into the system. While a small-scale, hierarchically structured distributed meas-
urement system can be managed without a graphical environment, larger-scale systems
benefit from visual metaphors to effectively manage an arbitrary number of measure-
ment nodes.
In support of this claim, we have constructed a prototype of a visual agent work-
bench that can be used to design, simulate and manage agent systems for distributed
measurement and control applications. Instead of adding visualization and management
capabilities to an existing agent architecture, we have taken the unique approach of
combining a visual programming language with our own agent architecture customized
for DMS applications. We show with two case studies that the resulting system, a com-
bination of a highly customizable, general-purpose visual programming environment
with an extensible agent architecture, can be used both as a rapid prototyping tool, and
also as a development tool for DMS systems. The case studies demonstrate the deploy-
ment of a large number of agents over a local area network and use of the workbench to
construct and simulate a distributed measurement application with built-in redundancy.
We also show the benefits of visually constructing loggers, filters, and performance
measurement tools and finally compare the benefits of the visual metaphor with conven-
tional systems.
3
1.1 Motivation and outline
Recent advances in measurement technology and ubiquitous, inexpensive and smart
measurement devices have left measurement engineers struggling for new programming
metaphors and new types of software tools that deal with management and deployment
issues of large scale systems. In this dissertation, we propose a possible solution to the
problem by combining three distinct technologies: distributed measurement, agent-
based computing and visual programming. Each area in itself is well established and
frequently used by measurement engineers but surprisingly not used in combination.
The combination of all three areas allows us to take the best ideas all three concepts and
merge them into a new powerful programming metaphor. In order to show the value of
visual programming combined with agent technology we have built a prototype and ap-
plied it to the distributed measurement domain.
The rest of this document is structured in the following way. This chapter gives a
brief summary of each of the three core areas. Chapter 2 provides a review of related
work in core areas relevant to our research. Chapter 3 describes technical details of the
CWave2000 dataflow toolkit, which is the basis for our Visual Agent Workbench.
Finally, Chapter 4 merges all of the ideas and programming metaphors presented in
the previous chapters into a coherent, novel concept that can be applied toward solving
the problem of managing a sea of measurement nodes (a collection of many sensors
working together on a specific measurement). A set of carefully selected experiments
will show the benefits of visual programming and highlight the importance of creating
components more easily, which is essential to the acceptance of the visual programming
concept. We explain how the drag-and-drop metaphor helps dealing with management
4
tasks of a large-scale agent system. Finally, we measure and evaluate the performance of
our agent based distributed measurement prototype system.
1.2 Visual programming
Due to the graphical nature of performing design tasks, flow-based visual program-
ming languages have a natural appeal to many engineers in the measurement and
process control community. In this dissertation we present the reader with an implemen-
tation of a visual programming language that can be used to manage and describe the
flow of information of a measurement architecture with a society of multiple, autono-
mous agents.
Visual programming languages have been used for quite a while and are based on
the idea that a graphical representation of a task is more intuitive than a textual
representation. The metaphor of using visual representation of tasks and components
connected by lines and wires was initially used in circuit design and computer aided de-
sign (CAD) user communities. With the availability of high-performance workstations,
these drawings were used to simulate integrated circuits and their application in real-
world problems. The introduction of software engineering techniques and tools such as
Nassi-Schneiderman [16] diagrams led to the idea of visual design environment for pro-
grams that were quickly extended with dataflow semantics and metaphors.
Today we can find a multitude of visual programming environments in use in indus-
trial and research environments. Most of them are very specific to certain domains such
as process-control and workflow.
5
In this thesis we will introduce a new type of a visual programming environment that
is general-purpose enough to be extended as a visual programming language and that
also doubles as our visual agent workbench.
1.3 Dataflow
With the availability of the first multiprocessor machines in 1974, researchers were
looking into alternate ways to parallelize existing, single-threaded programs. A solution
to the problem was the novel idea of using dataflow. Instead of sequentially fetching
instructions that operated on data, operations were carried out whenever all operands
(tokens) for an operation were available. The new model seemed to be an intuitive way
to write programs that exploited natural parallelism of algorithms, was well suited for
applications with regular numerical computational models (e.g., signal processing) and
did not force the programmer into a “straight jacket of sequentiality” [21,22]. In combi-
nation with visual programming environments, dataflow quickly became popular for
process control and simulation applications. In this thesis, we do not focus on dataflow
issues. Nevertheless, it is important to understand that dataflow is part of the underlying
communications mechanism in most visual programming languages.
1.4 Agent-based distributed measurements
Many or most problems in nature are happening in parallel and are naturally distrib-
uted. Process control engineers have been trying for a long time to implement similar
mechanisms for measurement and control tasks but due to the increased complexity, un-
6
synchronized clocks and distribution issues have not been able to come up with a gen-
eral-purpose solution.
Today, the tendency is to develop smart, embedded devices that provide high-level
communication and synchronization. To minimize wiring costs, most of these devices
are connected to a bus that is shared by many transceivers. Research in the distributed
measurement area focuses on making the smart devices even smarter by providing an
even higher level of abstraction. An example for this latest trend is embedding a Java
Virtual Machine (JVM) or some kind of other interpreter on the chip of the device [15].
The capability of executing interpreted code on a remote machine or transducer led to
the idea of autonomous software agents [34] that can be sent to a remote site where they
execute their code, gather data and send their results to other, higher-level agents that do
their own processing. In contrast to other distributed object technologies such as COM
[9] and CORBA [33], software agents are far more autonomous objects and provide a
new approach for solving distributed problems. Instead of a single program, a measure-
ment task is divided into many parts or agents. Compared to conventional DMS
solutions, measurement tasks using agent technology are much smaller, better compo-
nentized and therefore more easily reusable. The agents themselves are relatively
autonomous and are capable of adapting their activities to a dynamically changing and
partially incomplete environment. Depending on policies and implementations, each
agent deploys itself to a measurement site with certain characteristics such as close
proximity to physical hardware (e.g., sensors or actuators) or special hardware and soft-
ware resources (such as multi processor machines or databases). Alternately, agents can
be mobile and roam like spiders or they can be designed to be closely coupled with a
7
sensor or actuator and are always deployed with that device. In either case, the agent an-
nounces its presence and willingness to participate in agent activities over the network.
Depending on its social behavior, the agent collaborates and negotiates with other
agents to accomplish tasks that are more complex than those handled by a single agent
[30].
The benefits of using agents for DMS problems are mainly in the area of fault toler-
ance, flexibility and the ability to localize work, which results in lower communications
overhead. If a measurement site is not reachable via the network, the agent will choose
an alternate site for its operations. If a manufacturing line requires reconfiguration, a
smart agent will know how to deal with that situation. An often underestimated benefit
of subdividing a problem into many pieces that are ultimately executed by several
agents is that multiple programmers can program agent functionality independently and
incrementally add new functionality to the system.
1.5 Scenario
A driving force for our research has been the notion of a “sea of measurement ob-
jects.” Although not yet feasible, we envision leveraging agent technology to solve
problems similar to:
A large number of autonomous sensors are deployed in a river or lake
measuring temperature and water quality as well as other physical characteristics.
Via radio they broadcast their GPS coordinates and measurements to each other
and negotiate an average (or min/max-) reading for a certain area that gets finally
8
sent to monitoring stations regional or on-shore where the data gets logged, evalu-
ated and appropriate actions taken.
The work in this thesis is based on the claim that, assuming imperfect hardware and
intermittent failure of transceivers, an agent-based solution will most likely provide
more reliable results than a more conventional approach.
CHAPTER 2
RELATED WORK
This chapter of the thesis provides the reader with a careful review of existing work
in related areas such as dataflow, agent technology, distributed measurements and visual
programming systems.
In section 2.1 we discuss conventional, non agent-based distributed measurement
and control systems as they have been implemented for a long time. Next, we define
what we mean by the term measurement agent and present a survey of agent-based ar-
chitectures that can be used for distributed measurement implementations. Section 2.3
focuses on visual programming, in particular on visual programming languages and de-
velopment environments. We explain the advantages of different dataflow concepts and
how our own visual programming language/development environment has influenced
our way of thinking in the distributed measurement domain. Section 2.4 describes soft-
ware buses, a very powerful concept of dynamically linking the execution of program
modules that are distributed over a local area network. Section 2.5 summarizes the
chapter.
2.1 Distributed measurement systems
In general, distributed measurement and control systems (DMS) deal with a large
number of sensors and actuators that are monitoring and controlling parts of a physically
10
distributed system. Each sensor generates many measurements that are combined,
evaluated and correlated with other data and finally displayed on a management console.
Depending on the type of the control system, system responses are automatically gener-
ated at various places in the network of sensors and actuators, or fed in by an operator
and sent back to one or more actuators.
A typical example for such control systems is quality control on a multi stage
manufacturing line. The quality of the product to be manufactured is constantly moni-
tored by several sensors. As soon as specified tolerances are exceeded, the product gets
discarded, a warning message is displayed on the screen of the machine and the problem
is logged in the enterprise database. If a known control algorithm and configuration pa-
rameter exist (e.g., a simple self-tuning algorithm such as PID, PD, PI or P [4]), the
machine might adjust itself and continue its operation.
In the example above, one level of controller is used to accumulate data, correct
measurement errors, build abstract models and compress the data before it is archived
and/or sent to a higher level controller. At the top of the hierarchy, controllers talk to
enterprise systems and workflow engines that are used to visualize incoming measure-
ments and to determine the response of the measurement and control system.
Typical examples for systems like these are Hewlett Packard’s Open View network
management system [18], the ManageX [36] technology, as well as the no longer avail-
able HP-Vantera product line [12], which was geared towards industrial automation [5].
Other players in the area of distributed control are Echelon [15] with their LonWorks
[14] product line as well as Siemens with their Simatic [42] product line.
11
2.1.1 Centralized versus distributed measurements
Most measurement systems are by nature distributed in the sense that measurements
are collected at multiple locations simultaneously. To correlate multiple measurements,
two approaches have been used:
• A single controller manages many sensors/actuators. Each sensor/actuator is
connected to the controller through a separate wire. This old-fashioned, but well-
understood, technology is deployed with a very limited number of hard-
wired/hardcoded Programmable Logic Controllers (PLC). Assuming no delay
between sensor and controller, problems due to clock skew across controllers do
not arise. The main disadvantage is high overhead for wiring, which makes this
approach impractical in many applications.
• Sensors and actuators have built-in intelligence and communicate with other
sensors through a shared hardware or wireless bus. Wiring costs are almost neg-
ligible. Typical problems are race conditions while correlating incoming
measurements due to unsynchronized clocks and sample rates. Despite the tech-
nical challenges, this method is slowly replacing the centralized approach
described above.
2.1.2 Problems and challenges
With the recent change to add intelligence to sensors and actuators, solving typical
electrical engineering problems to build measurement and control systems requires a
new way of thinking about how to subdivide a problem into manageable subproblems.
12
Taking fault tolerance into account, this concept requires new skills as well as new pro-
gramming and visualization tools.
2.2 Agent-based systems
Ignoring AI hype regarding intelligence, agent technology is viewed as a convenient
way of developing flexible software for distributed environments in which incomplete
knowledge, multiple program authors, and dynamic change make it hard to develop a
complete solution as a single coherent system.
Instead of a single program, the program is broken up into many agents, which are
relatively autonomous components that are able to adapt their activities to a dynamically
changing and partially incomplete environment, and to changing goals. Typically, agents
work in groups (multi agent systems) and are able to negotiate and communicate with
other agents to accomplish tasks more complex than those handled by a single agent.
They take advantage of communication mechanisms in a distributed agent platform, and
may use a higher level declarative agent communication/control language (ACL), per-
haps based on the KQML dialect [46] or other speech act languages [26]. Agents can
consult various knowledge bases that provide models of the environment and their
goals, and “reason” about situations to determine what they should do, and how they
collaborate with other agents [29,30]
The term agent has become very popular and has been used in a wide variety of con-
texts. In the context of this thesis we are focusing on special kinds of agents: the
management and measurement agents that are relatively autonomous software elements,
capable of adapting their activities to a dynamically changing and partially incomplete
13
environment. Instead of a single monolithic program, measurement agent systems are
broken into many pieces of code that gather information about their environment, such
as performance, health, and system configuration. Through collaboration, agents are ca-
pable of communicating and negotiating results, events and their appropriate actions. Of
particular interest to us are agents that can be used for distributed measurement and con-
trol, performance monitoring, as well as quality control. In each of these examples,
many agents are deployed around a combined software- and hardware system and are
used to sense changes, adapt to the environment, gather information, and negotiate ser-
vices.
2.2.1 What is an agent ?
Carl Hewitt remarked at the 13th International Workshop On Distributed AI that the
question “what is an agent ?” is embarrassing for the agent-based computing community
in just the same way that the question “what is intelligence ?” is embarrassing for the
mainstream AI community [34].
There are many definitions and interpretations of the term software agent. In the
context of this thesis we will define the term agent “a software element with sensors and
actuators, operating somewhat autonomously in some domain, collaborating with other
agents” [29].
2.2.2 Definition of the term “Management Agent”
Management agents are a special kind of software agent, that are specialized to the
task of monitoring and controlling application, system and network components running
on multiple computers. These agents gather information (“measurements”) about vari-
14
ous components and computers, such as performance, health, configuration, etc. These
measurement agents distribute this information to other management agents or to man-
agement consoles. These agents assist in abstracting, filtering, and correlating these
measurements, and using them to report on anomalous events, create, distribute and
execute (globally and locally) control information, and adjust configurations [29].
2.2.3 Why agents ?
Harrison et al. [7] conclude that although “there is nothing that can be done with
mobile agents that cannot also be done with other means […] the aggregate advantage
of mobile agents is overwhelmingly strong, because of the following reasons:
• They provide a pervasive, open, generalized framework for the development
and personalization of network services.
• While alternatives to mobile agents can be advanced for each of the individ-
ual advantages, there is no single alternative to all of the functionality
supported by a mobile agent framework.
• In addition to providing an efficient support for existing services, a mobile
agent framework also enables new, derivative network services and hence
new businesses.
• Mobile agents are expected to appeal strongly to the Internet community,
since they can provide an effective means for dealing with the problems of
finding services and information and since they empower the individual user.
• They provide high bandwidth remote interaction as well as support for dis-
connected operation.
15
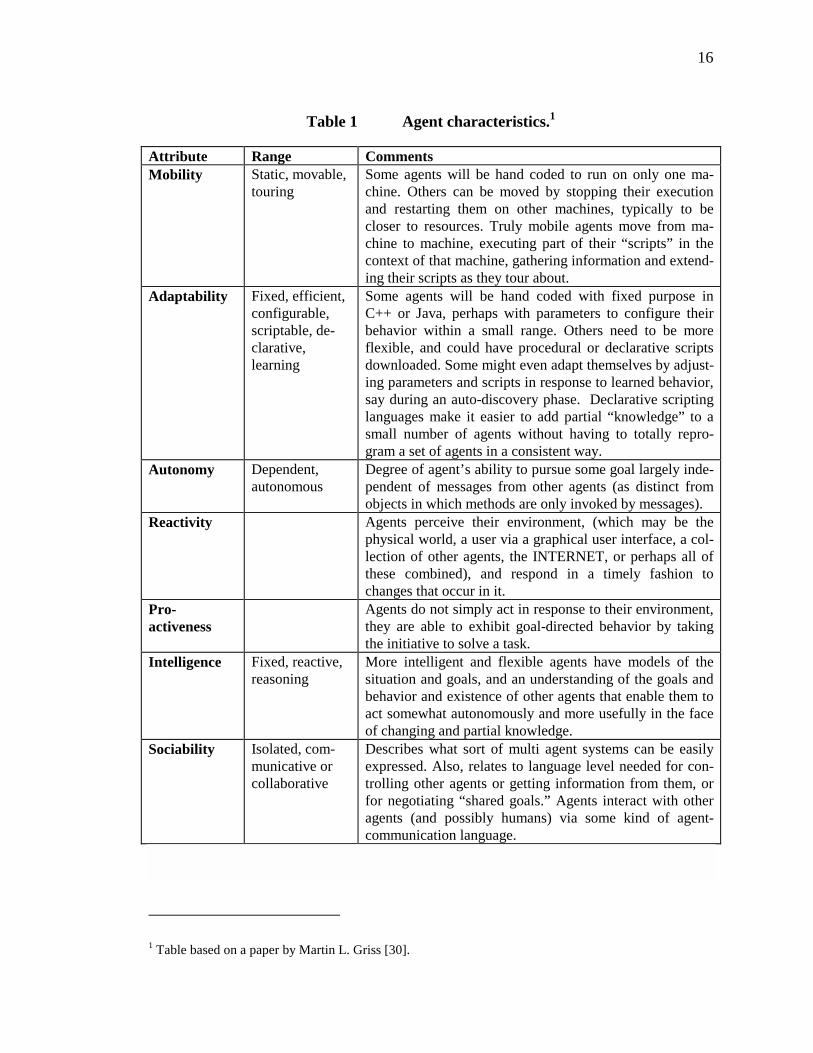
2.2.4 Classification of agent systems
The literature on agents is rife with descriptions of many different kinds of software
agents, and different kinds of agent technology. Some are mobile; some are intelligent;
some are participants in a multi agent environment configuration [29]. Table 1 describes
some of the most important characteristics of agents which will be used to compare our
agent framework with existing agent systems later on.
2.2.5 Existing agent-based systems
This section describes related work in the area of agent technologies that could be
used for distributed measurement applications. This section is by no means complete
and contains only a few representative agent systems. In particular, it excludes many AI-
related agent projects such as Web-crawlers, Web-spiders and agent-based interaction,
which seem to be less directly relevant. We will try to rank characteristics of each re-
viewed agent system on a scale of “++” (fully implemented), “+” (available), “-“
(rudimentary support) and “- - “ (not available). Comparing agent frameworks is not an
easy task and this ranking is based on our admittedly subjective evaluation of the litera-
ture cited.
Aglets are IBM’s implementation of autonomous software agents [11]. An aglet (or
"agile applet") is a small Java application program or applet with the capability to serve
as a mobile agent in a computer network. The IBM Tokyo Research Laboratory is work-
ing on an interesting project called Aglets workbench that shares several common ideas
with what we are trying to accomplish.
16
1 Table based on a paper by Martin L. Griss [30].
Table 1 Agent characteristics.1
Attribute Range Comments Mobility Static, movable,
touring Some agents will be hand coded to run on only one ma-chine. Others can be moved by stopping their execution and restarting them on other machines, typically to be closer to resources. Truly mobile agents move from ma-chine to machine, executing part of their “scripts” in the context of that machine, gathering information and extend-ing their scripts as they tour about.
Adaptability Fixed, efficient, configurable, scriptable, de-clarative, learning
Some agents will be hand coded with fixed purpose in C++ or Java, perhaps with parameters to configure their behavior within a small range. Others need to be more flexible, and could have procedural or declarative scripts downloaded. Some might even adapt themselves by adjust-ing parameters and scripts in response to learned behavior, say during an auto-discovery phase. Declarative scripting languages make it easier to add partial “knowledge” to a small number of agents without having to totally repro-gram a set of agents in a consistent way.
Autonomy Dependent, autonomous
Degree of agent’s ability to pursue some goal largely inde-pendent of messages from other agents (as distinct from objects in which methods are only invoked by messages).
Reactivity Agents perceive their environment, (which may be the physical world, a user via a graphical user interface, a col-lection of other agents, the INTERNET, or perhaps all of these combined), and respond in a timely fashion to changes that occur in it.
Pro-activeness
Agents do not simply act in response to their environment, they are able to exhibit goal-directed behavior by taking the initiative to solve a task.
Intelligence Fixed, reactive, reasoning
More intelligent and flexible agents have models of the situation and goals, and an understanding of the goals and behavior and existence of other agents that enable them to act somewhat autonomously and more usefully in the face of changing and partial knowledge.
Sociability Isolated, com-municative or collaborative
Describes what sort of multi agent systems can be easily expressed. Also, relates to language level needed for con-trolling other agents or getting information from them, or for negotiating “shared goals.” Agents interact with other agents (and possibly humans) via some kind of agent-communication language.
17
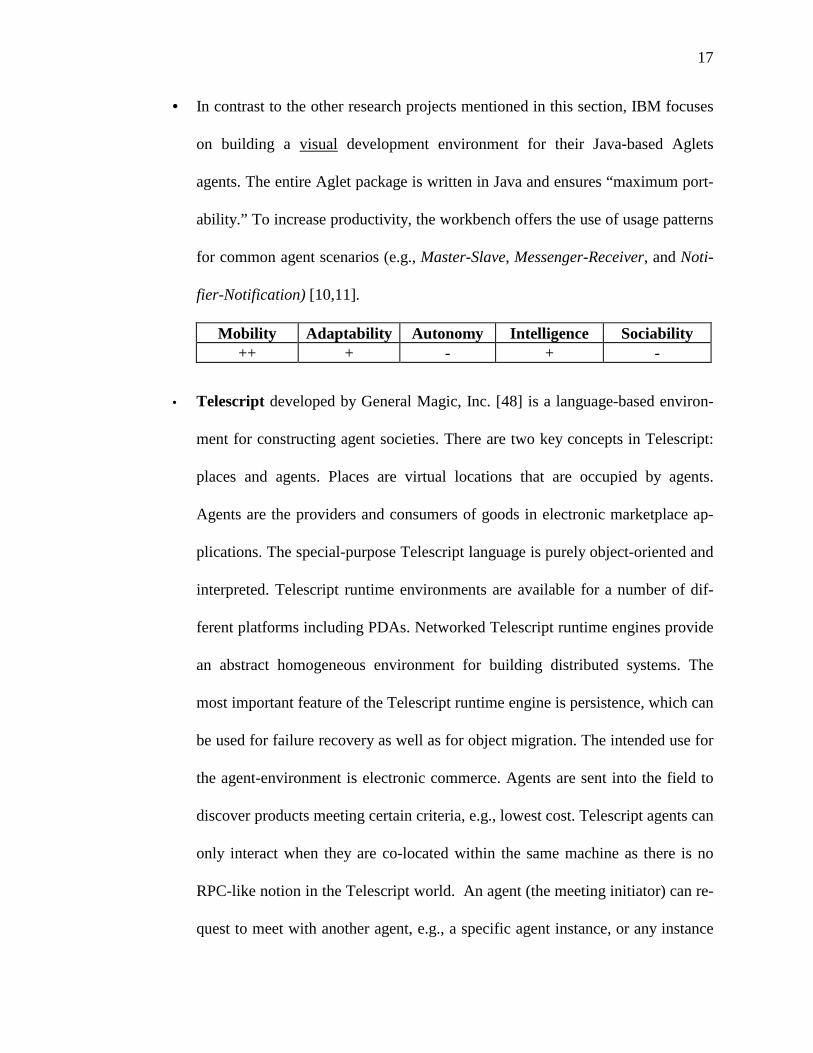
• In contrast to the other research projects mentioned in this section, IBM focuses
on building a visual development environment for their Java-based Aglets
agents. The entire Aglet package is written in Java and ensures “maximum port-
ability.” To increase productivity, the workbench offers the use of usage patterns
for common agent scenarios (e.g., Master-Slave, Messenger-Receiver, and Noti-
fier-Notification) [10,11].
Mobility Adaptability Autonomy Intelligence Sociability ++ + - + -
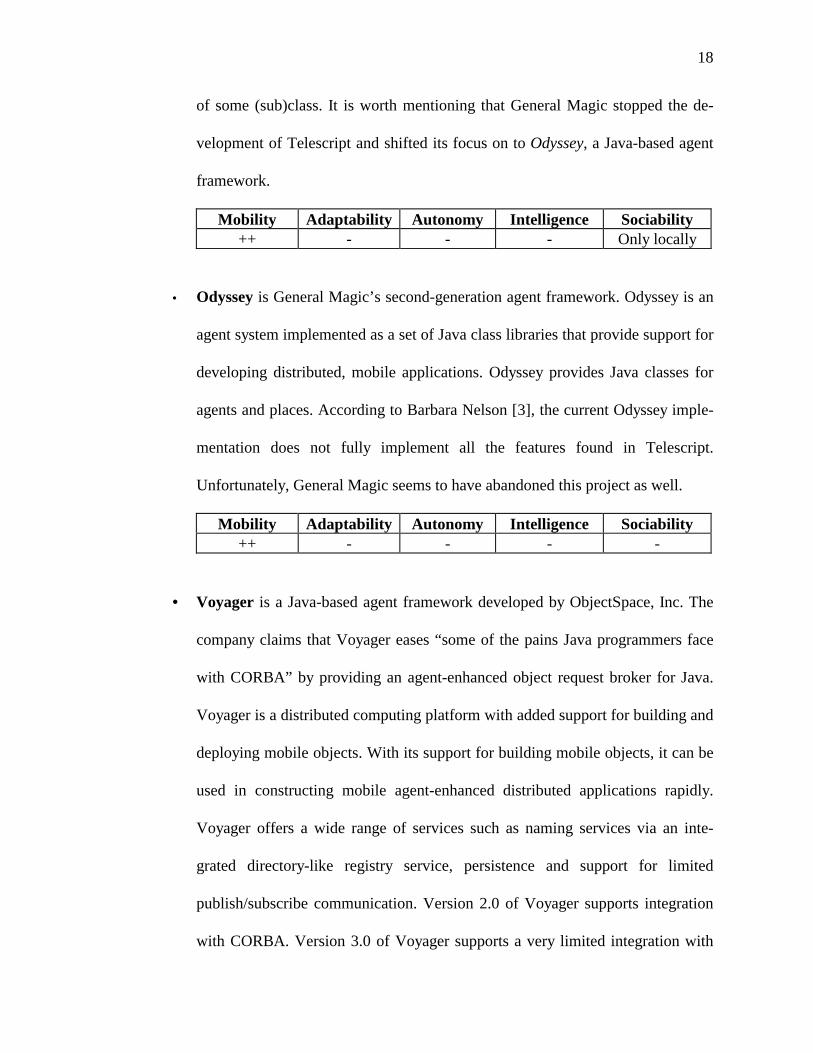
• Telescript developed by General Magic, Inc. [48] is a language-based environ-
ment for constructing agent societies. There are two key concepts in Telescript:
places and agents. Places are virtual locations that are occupied by agents.
Agents are the providers and consumers of goods in electronic marketplace ap-
plications. The special-purpose Telescript language is purely object-oriented and
interpreted. Telescript runtime environments are available for a number of dif-
ferent platforms including PDAs. Networked Telescript runtime engines provide
an abstract homogeneous environment for building distributed systems. The
most important feature of the Telescript runtime engine is persistence, which can
be used for failure recovery as well as for object migration. The intended use for
the agent-environment is electronic commerce. Agents are sent into the field to
discover products meeting certain criteria, e.g., lowest cost. Telescript agents can
only interact when they are co-located within the same machine as there is no
RPC-like notion in the Telescript world. An agent (the meeting initiator) can re-
quest to meet with another agent, e.g., a specific agent instance, or any instance
18
of some (sub)class. It is worth mentioning that General Magic stopped the de-
velopment of Telescript and shifted its focus on to Odyssey, a Java-based agent
framework.
Mobility Adaptability Autonomy Intelligence Sociability ++ - - - Only locally
• Odyssey is General Magic’s second-generation agent framework. Odyssey is an
agent system implemented as a set of Java class libraries that provide support for
developing distributed, mobile applications. Odyssey provides Java classes for
agents and places. According to Barbara Nelson [3], the current Odyssey imple-
mentation does not fully implement all the features found in Telescript.
Unfortunately, General Magic seems to have abandoned this project as well.
Mobility Adaptability Autonomy Intelligence Sociability ++ - - - -
• Voyager is a Java-based agent framework developed by ObjectSpace, Inc. The
company claims that Voyager eases “some of the pains Java programmers face
with CORBA” by providing an agent-enhanced object request broker for Java.
Voyager is a distributed computing platform with added support for building and
deploying mobile objects. With its support for building mobile objects, it can be
used in constructing mobile agent-enhanced distributed applications rapidly.
Voyager offers a wide range of services such as naming services via an inte-
grated directory-like registry service, persistence and support for limited
publish/subscribe communication. Version 2.0 of Voyager supports integration
with CORBA. Version 3.0 of Voyager supports a very limited integration with
19
simple COM objects by leveraging COM hooks in Microsoft’s Java Virtual Ma-
chine (JVM). Compared to COM development tools for C++ and/or Visual
Basic, the Voyager-COM bridge and development tools are in the stage of in-
fancy. Voyager lacks direct support for scripting, though some research attempts
have been made to add KQML [46] plug-ins on the top of Voyager. Limited
support for security is provided in terms of restricting mobile objects from exe-
cuting certain types of operations. Comprehensive security, covering
communications infrastructure, authentication, authorization, and encryption are
not supported. Voyager uses regular Java message syntax to construct remote
objects, send them messages, and move them between applications. Voyager al-
lows agents to move themselves and continue executing as they move. In this
way, agents can act independently on the behalf of a client, even if the client is
disconnected or unavailable.
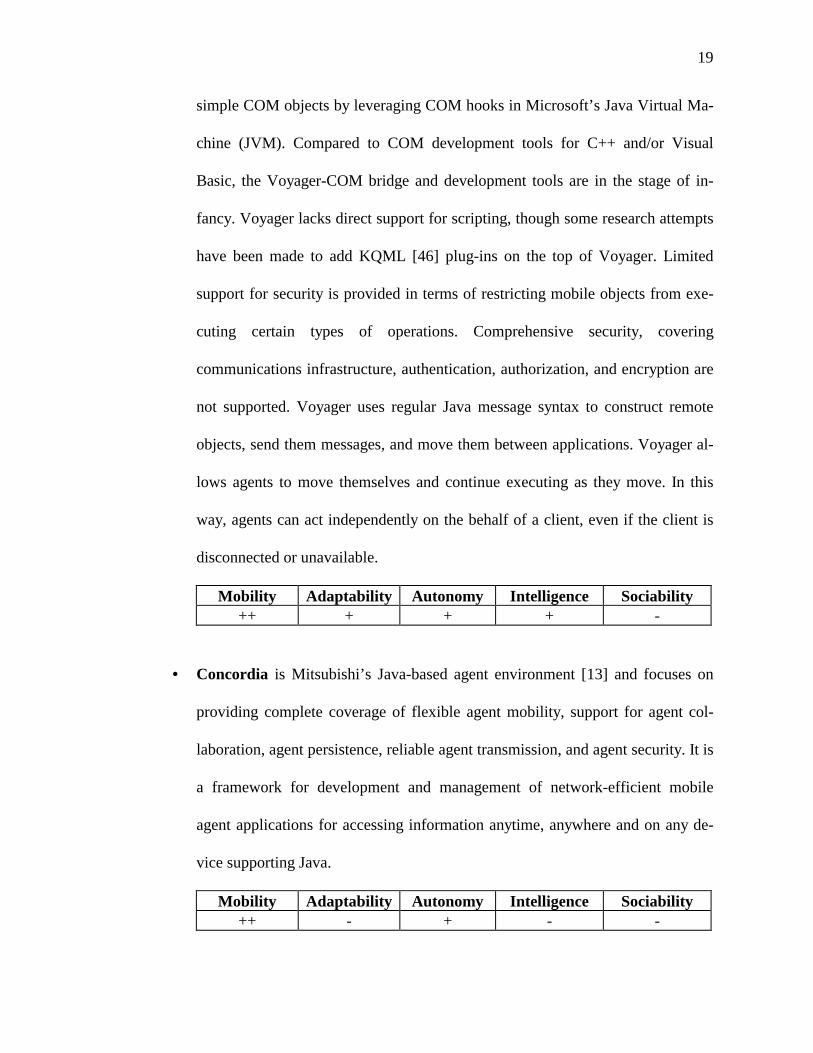
Mobility Adaptability Autonomy Intelligence Sociability ++ + + + -
• Concordia is Mitsubishi’s Java-based agent environment [13] and focuses on
providing complete coverage of flexible agent mobility, support for agent col-
laboration, agent persistence, reliable agent transmission, and agent security. It is
a framework for development and management of network-efficient mobile
agent applications for accessing information anytime, anywhere and on any de-
vice supporting Java.
Mobility Adaptability Autonomy Intelligence Sociability ++ - + - -
20
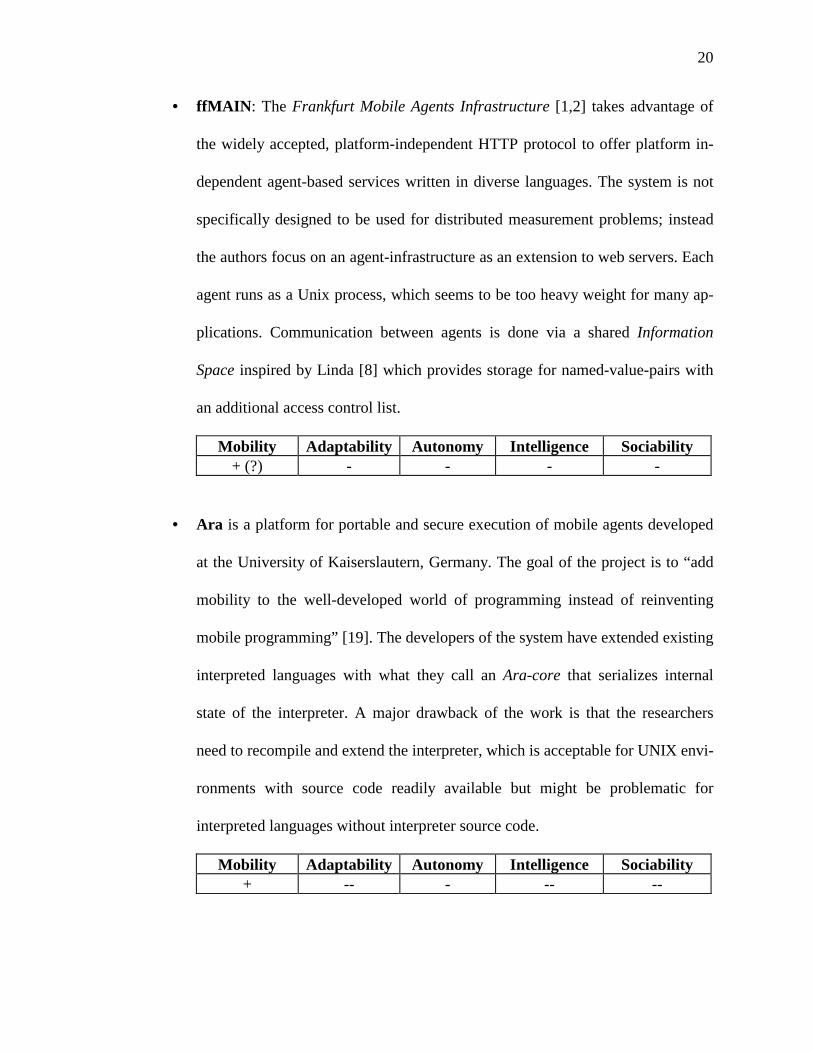
• ffMAIN: The Frankfurt Mobile Agents Infrastructure [1,2] takes advantage of
the widely accepted, platform-independent HTTP protocol to offer platform in-
dependent agent-based services written in diverse languages. The system is not
specifically designed to be used for distributed measurement problems; instead
the authors focus on an agent-infrastructure as an extension to web servers. Each
agent runs as a Unix process, which seems to be too heavy weight for many ap-
plications. Communication between agents is done via a shared Information
Space inspired by Linda [8] which provides storage for named-value-pairs with
an additional access control list.
Mobility Adaptability Autonomy Intelligence Sociability + (?) - - - -
• Ara is a platform for portable and secure execution of mobile agents developed
at the University of Kaiserslautern, Germany. The goal of the project is to “add
mobility to the well-developed world of programming instead of reinventing
mobile programming” [19]. The developers of the system have extended existing
interpreted languages with what they call an Ara-core that serializes internal
state of the interpreter. A major drawback of the work is that the researchers
need to recompile and extend the interpreter, which is acceptable for UNIX envi-
ronments with source code readily available but might be problematic for
interpreted languages without interpreter source code.
Mobility Adaptability Autonomy Intelligence Sociability + -- - -- --
21
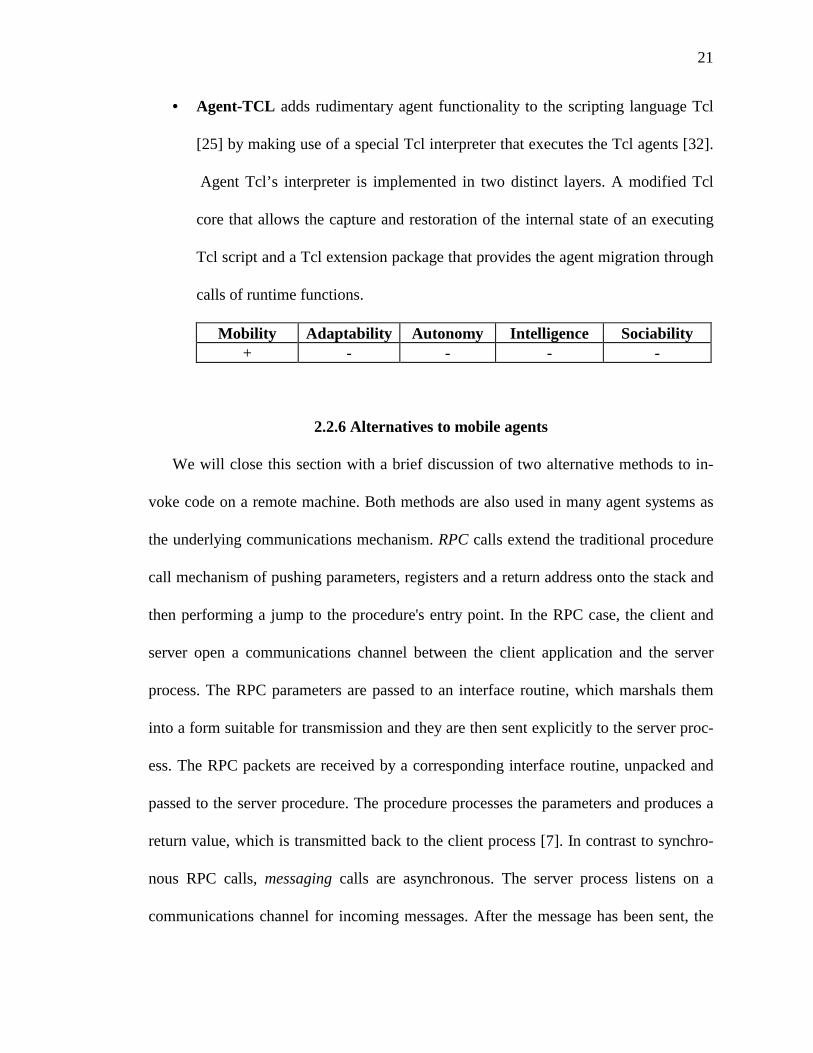
• Agent-TCL adds rudimentary agent functionality to the scripting language Tcl
[25] by making use of a special Tcl interpreter that executes the Tcl agents [32].
Agent Tcl’s interpreter is implemented in two distinct layers. A modified Tcl
core that allows the capture and restoration of the internal state of an executing
Tcl script and a Tcl extension package that provides the agent migration through
calls of runtime functions.
Mobility Adaptability Autonomy Intelligence Sociability + - - - -
2.2.6 Alternatives to mobile agents
We will close this section with a brief discussion of two alternative methods to in-
voke code on a remote machine. Both methods are also used in many agent systems as
the underlying communications mechanism. RPC calls extend the traditional procedure
call mechanism of pushing parameters, registers and a return address onto the stack and
then performing a jump to the procedure's entry point. In the RPC case, the client and
server open a communications channel between the client application and the server
process. The RPC parameters are passed to an interface routine, which marshals them
into a form suitable for transmission and they are then sent explicitly to the server proc-
ess. The RPC packets are received by a corresponding interface routine, unpacked and
passed to the server procedure. The procedure processes the parameters and produces a
return value, which is transmitted back to the client process [7]. In contrast to synchro-
nous RPC calls, messaging calls are asynchronous. The server process listens on a
communications channel for incoming messages. After the message has been sent, the
22
client continues its operation and gets notified by the server through another message
when a result has been computed.
In contrast to the first technique, messaging calls are more robust than pure RPC
calls because clients are not blocked on a [possibly unreliable] network call, but they
add overhead and latency. The basic difference of both techniques and the communica-
tions metaphor used in agent systems is that a remote machine, program or process is
being passively controlled by another process while an agent is autonomously working
on a remote machine and periodically sends results and status messages back to its mas-
ter.
2.2.7 Summary
Table 2 summarizes the features of all reviewed agent systems and compares them
to our own research prototype CWave 2000, which will be presented in more detail in
Chapter 3. Our research prototype lacks certain features found in other agent platforms
but its COM-centric design provides a level of customizability, integration and openness
that is not found in other systems.
2.3 Visual programming
This section provides background information about visual programming and related
dataflow issues. We start with a description of dataflow and review several text-based
dataflow languages. Next we look into existing visual programming languages. Finally,
we will summarize related work in both areas and compare our work to the other re-
search projects.
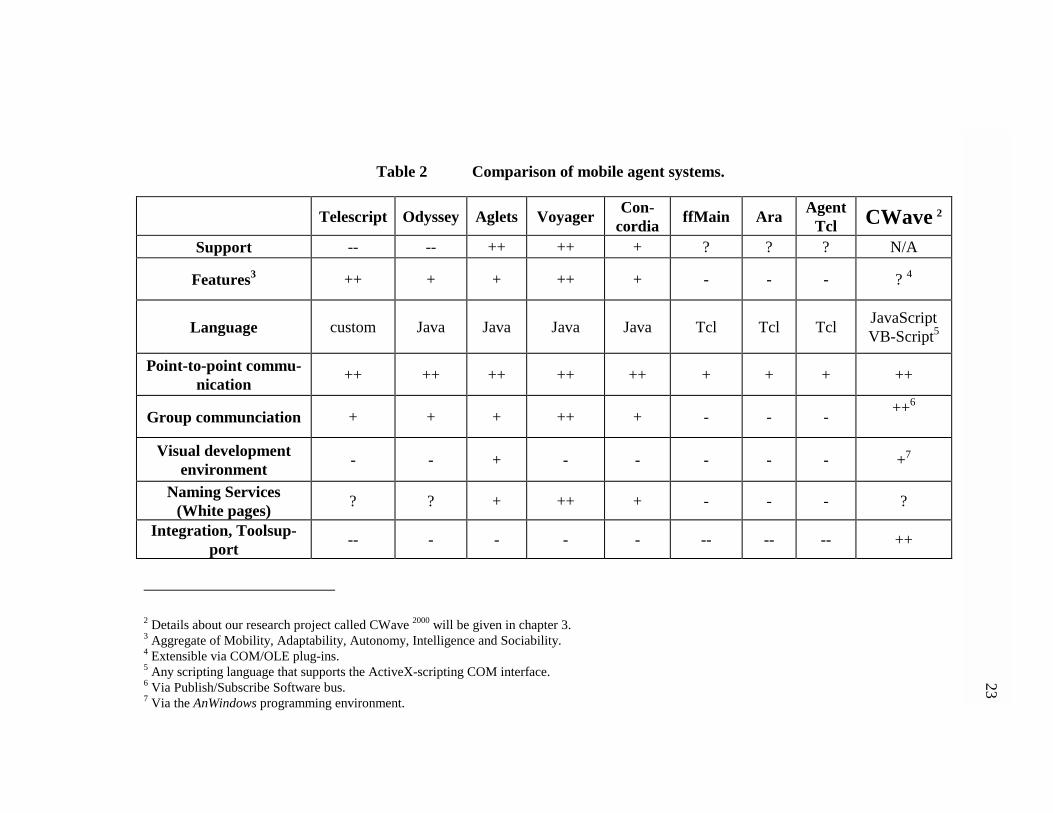
Table 2 Comparison of mobile agent systems.
Telescript Odyssey Aglets Voyager Con-cordia ffMain Ara Agent
Tcl CWave 2
Support -- -- ++ ++ + ? ? ? N/A
Features3 ++ + + ++ + - - - ? 4
Language custom Java Java Java Java Tcl Tcl Tcl JavaScript VB-Script5
Point-to-point commu-nication ++ ++ ++ ++ ++ + + + ++
Group communciation + + + ++ + - - - ++6
Visual development environment - - + - - - - - +7
Naming Services (White pages) ? ? + ++ + - - - ?
Integration, Toolsup-port -- - - - - -- -- -- ++
2 Details about our research project called CWave 2000 will be given in chapter 3. 3 Aggregate of Mobility, Adaptability, Autonomy, Intelligence and Sociability. 4 Extensible via COM/OLE plug-ins. 5 Any scripting language that supports the ActiveX-scripting COM interface. 6 Via Publish/Subscribe Software bus. 7 Via the AnWindows programming environment.
23
24
2.3.1 Control- and dataflow models
For historic reasons, we start this section with a brief description of control flow, the
native flow mechanism of most computer systems these days. In June of 1945, Von
Neumann drafted a report describing a computer that would eventually be built as the
EDVAC (Electronic Discrete Variable Automatic Computer). This was the first descrip-
tion of a machine with a program stored in memory as a serial sequence of instructions.
The machine executed the program by fetching the instructions from memory and exe-
cuting them sequentially. The serial execution of instructions, called control flow, was
and still is the most common way to program computers and was sufficient until the
first multi processor machines were built that support multi-processing (SMP). To in-
crease concurrency, Dennis [23] proposed a “data flow computer” that was based on his
static dataflow model. According to Dennis’ model, a static dataflow program is a data
dependency graph of partial order instruction sequences whose nodes specify operations
and whose edges denote dependencies. Executing a program corresponds to data in mo-
tion being processed by instructions. Due to the fact that each edge holds exactly one
token, it allows very efficient implementations and exploits structural parallelism (dif-
ferent unrelated operators executing simultaneously) as well as pipelined parallelism
(parallel processing of different tokens in a stream). The model is adequate for numeric
computations but does not support parallel execution of loops or recursive function calls
(without duplicating or inlining code).
The need to dynamically parallelize loops led to the development of dynamic data-
flow, which allows more than one token per edge at the same time. For each parallel
25
invocation of the loop-body a tagged token containing the data that must be passed to
the node plus an ID is generated. The nodes use a matching function to compare all IDs
of the tokens on its edges. Once a node has the required number of tokens with match-
ing IDs, it performs its operation and passes the result as a token to the next node.
As it turns out, the matching function is difficult to pipeline in SMP systems be-
cause it requires associative memory and is expensive to implement in software, and
therefore is the bottleneck in most implementations. Other problems arise due to the fact
that unmatched tokens must be garbage-collected and that an uncontrolled fanout might
cause “token explosions,” which greatly reduce efficiency.
2.3.2 Existing dataflow languages
The following overview will be limited to dataflow languages that are either histori-
cally relevant and/or are related to our own research:
• VAL is a dataflow language developed by J. Dennis at MIT in 1977 [23,24]. It was
the first serious attempt to produce a production quality dataflow language. It was
based on static dataflow, did not support recursion and was strongly typed. The lan-
guage was purely functional and offered support for iterative and parallel loops.
• SISAL is a dynamic dataflow language available from the Lawrence Livermore Na-
tional Laboratory [43]. Sisal is a strongly typed, applicative, single assignment
language in use on a variety of parallel processors, including conventional multi-
processors, vector machines and data-flow machines. The language features include
dynamic array structures, and a comprehensive set of built-in operators for them.
Streams are provided for pipelined parallelism. Sisal has a parallel loop construct,
26
with associated reduction and masking operators. A sequential loop form expresses
loops with data dependencies between iterations. Compilers have been developed
for the no longer available hardware platforms such as VAX, Cray, HEP and the
Manchester Dataflow Computer.
2.3.3 Motivation for visual programming
The idea of flow-based visual programming languages attracts many engineers in the
measurement and process control community. To manage complex real-world control
systems, measurement problems are broken down into many pre fabricated pieces and
parts, which communicate through wires and busses. The need to design, simulate, and
visualize such systems more easily than the old-fashioned method of building a model
on a prototype board gave a big boost to the visual programming community.
Visual programming is also of interest to software engineers. Complex pieces of
software are designed by modularizing functionality into several building blocks or
modules. Each module is further decomposed into smaller functional blocks and the in-
teraction between these blocks is usually recorded on paper.
With the availability of more powerful software packages, design has moved to
drawing interaction diagrams in specialized drawing programs that are capable of gener-
ating source code templates but unfortunately do not yet offer simulation capabilities.
Exceptions are a few visual programming languages geared towards test and measure-
ment, which are reviewed in the next section.
27
2.3.4 Existing visual programming languages
An iconic dataflow language seems like a very suitable metaphor for users who are
typically non programmers and want to benefit from using a computer to automate their
work. Similar to our own visual design environment the following visual programming
languages use the metaphor of drag-and-drop to graphically design a program:
• Prograph is an object-oriented visual language that lets you manipulate iconic data-
flow diagrams to create the executable source code for your application [44]. It was
originally developed as a visual programming research project at Acadia University
and the Technical University of Nova Scotia and is currently sold by Pictorius [38].
The initial release of Prograph for the Apple Macintosh was followed in 1998 by a
release for Microsoft Windows platforms.
• Labview is a programming environment from National Instruments [27,35] targeted
at scientific researchers and engineers that need to collect, process, and store ex-
perimental data. Labview is based on the language G which augments the iconic
dataflow with graphical control-flow structures such as looping, conditional code,
and sequencing. To allow diagrams to scale for larger experiments, an abstraction
mechanism is used that represents substructures by an icon. In addition, each dia-
gram also incorporates an interactive graphical interface that provides users with
graphic watch-points and means for interaction during debugging.
• HP-VEE is Hewlett Packard’s visual programming language optimized for instru-
ment control, measurement processing, and test reporting [17]. HP VEE builds
applications quickly without forcing its users to become hardcore programmers.
Programs are constructed by connecting icons together on the screen. The resulting
28
program resembles a block diagram and can be executed interactively. Designed for
test, measurement, and data acquisition, HP VEE simplifies communication with in-
struments and other devices through a wide variety of drivers for commercially
available measurement hardware.
• WAVE was a research prototype of a visual programming language developed by
Martin Griss and Robert Kessler in 1995 [31]. It was the precursor of CWave and its
newest release CWave 2000. WAVE was written in Visual Basic and was used to
show the feasibility of controlling LEGOTM cars and robots with a visual program-
ming environment. Each component in WAVE is a Visual Basic form and contains
substantial code due to the lack of inheritance in Visual Basic 3.0.
2.3.5 Summary
Section 2.3 provided the reader with background information in dataflow- and func-
tional languages as well as visual programming environments. All of the reviewed
visual programming systems have influenced the design of our own visualization and
dataflow environment.
2.4 Software busses
The term software bus was first introduced by James Purtilo and Richard Snodgrass
in a paper published in 1991 [39,40]. According to their definition, a software bus pre-
sents a standard interface into which modules are plugged with the modules’ internal
properties remaining private as long as their interface matches the bus standard.
A software bus is a communications mechanism between separately specified clients
with a bus manager [28] being responsible for the exchange of messages. This design
29
offers the possibility to monitor and intercept traffic with tools added later. Ideally, the
bus manager is implemented as a distributed filtering algorithm that determines whether
a message should be handled by a higher-level application. If at all feasible, this filtering
is done in hardware (e.g., multicast) to handle high throughput of messages.
In contrast to buses used in lower level communication protocols, software buses are
mostly implemented in software and are based on existing communication infrastruc-
tures such as UDP, TCP or DCOM. Typically, messages on software busses tend to be
larger than messages exchanged on traditional systems and some buses allow transmit-
ting entire objects or pointers to objects.
2.4.1 TIBCO
The most successful commercial implementation of a Publish/Subscribe bus has
been developed by Tibco Software Inc, Palo Alto [45]. The Tibco/Rendezvous software
information bus uses a set of definitions, standards and protocols that ensures seamless,
adaptable cross-platform connectivity across a local or wide area network. The core
network technology is based on a publish-subscribe communication metaphor. Instead
of relying on IP-number addressing schemes, Tibco uses self-describing messages that
identify themselves by topic and subject while subscribers listen for messages that con-
tain topics of interest. The main advantage of this scheme is that a subscriber node does
not need to know about the physical location (e.g., building or IP number) of other
nodes. The only information required is an adequate, preferably hierarchical naming
scheme for topic and subject names. Similar to regular expressions, wildcards are used
to do subject-based broadcasting of messages to one or more clients or group of clients.
30
With the hierarchical naming scheme explained in more detail in section 3.2.2 this fea-
ture allows users to send messages or commands to potentially hundreds or thousands of
nodes without actually knowing the exact number or exact topic and subject names. The
downside of this very flexible message-centered middleware is the somewhat high
overhead in network activity and a non trivial implementation of security features.
The successful implementation of the Tibco/Rendezvous software information bus in
several stock exchanges and brokerage houses all over the world has proved the viabil-
ity and importance of software buses in highly dynamic environments and lead us to the
conclusion that a software bus combined with an agent-based measurement architecture
would be a worthwhile approach to solve distribution measurement problems.
2.5 Summary
In this chapter we have reviewed related work in conventionally built distributed
measurement systems and agent-based measurement systems. We have also reviewed
related work in visual programming systems and software buses. All four areas have
influenced our research and our way of thinking.
CHAPTER 3
CWAVE 2000 DATAFLOW TOOLKIT
In order to show the importance of visual programming techniques and agent-based
programming in the distributed measurement domain we have built a prototype of a vis-
ual agent workbench which is based on the CWave 2000 dataflow toolkit, a reusable,
component-oriented architecture for building custom measurement architectures. This
chapter deals with technical details of the toolkit.
3.1 Introduction
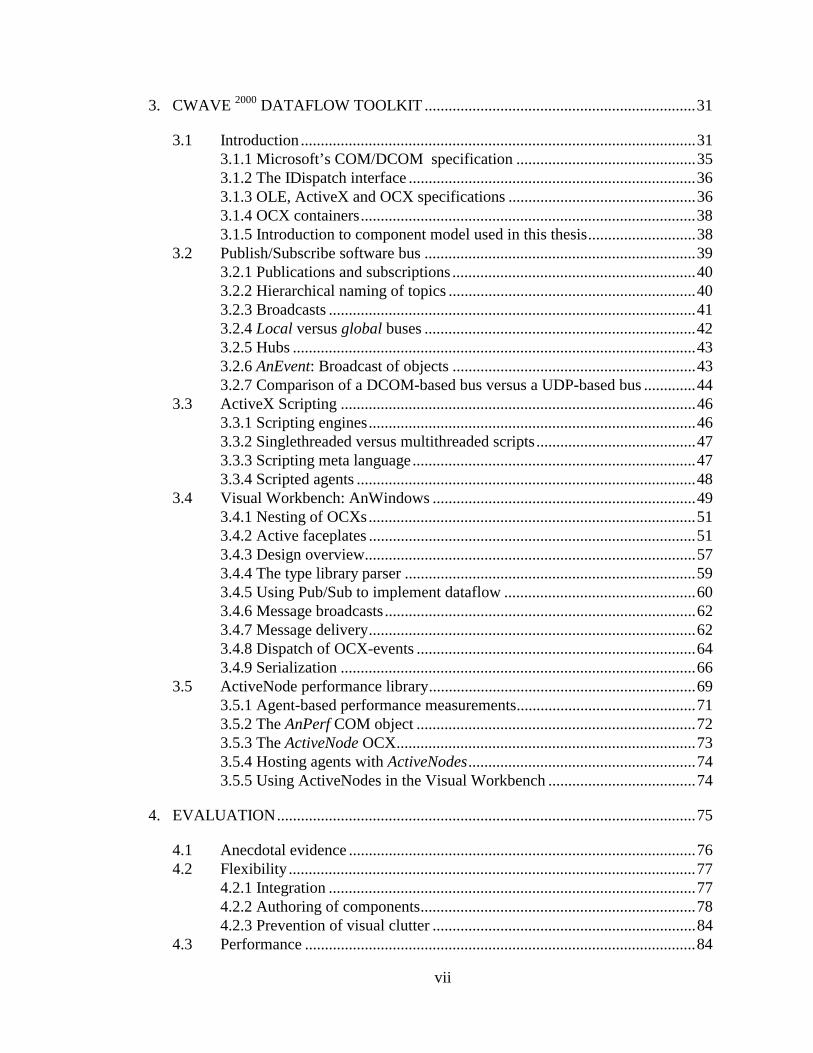
Figure 1 shows the CWave 2000 dataflow toolkit, our approach to building a visual
management system for distributed measurement environments. In order to increase
code reuse and flexibility our system is built as a toolkit and contains the following
parts:
• COM, COM+ and DCOM: The Common Object Model (COM) and its dis-
tributed cousin DCOM as well as COM+ are defined by Microsoft and are an
essential part of Windows. In the context of our framework COM and DCOM
are used for gluing all other components together as well as interfacing existing
applications written by other software vendors.
• Publish/Subscribe Software Bus: The software bus is used for group-level in-
tra- and interprocess communication.
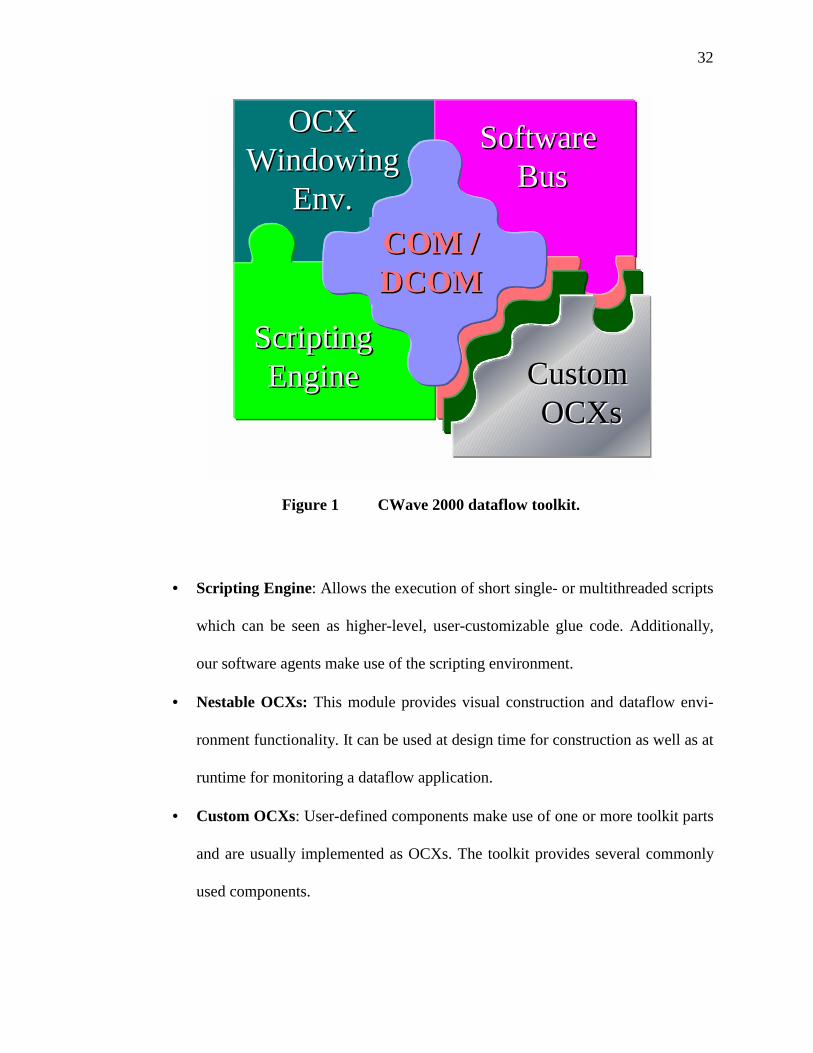
32
• Scripting Engine: Allows the execution of short single- or multithreaded scripts
which can be seen as higher-level, user-customizable glue code. Additionally,
our software agents make use of the scripting environment.
• Nestable OCXs: This module provides visual construction and dataflow envi-
ronment functionality. It can be used at design time for construction as well as at
runtime for monitoring a dataflow application.
• Custom OCXs: User-defined components make use of one or more toolkit parts
and are usually implemented as OCXs. The toolkit provides several commonly
used components.
OCX OCX WindowingWindowing
EnvEnv..
Software Software BusBus
Scripting Scripting EngineEngine
Custom Custom OCXsOCXs
COM /COM /DCOMDCOM
Custom Custom OCXsOCXsCustom Custom OCXsOCXs
OCX OCX WindowingWindowing
EnvEnv..
OCX OCX WindowingWindowing
EnvEnv..
Software Software BusBus
Software Software BusBus
Scripting Scripting EngineEngine
Scripting Scripting EngineEngine
Custom Custom OCXsOCXs
Custom Custom OCXsOCXs
COM /COM /DCOMDCOMCOM /COM /DCOMDCOM
Custom Custom OCXsOCXs
Custom Custom OCXsOCXsCustom Custom OCXsOCXs
Custom Custom OCXsOCXs
Figure 1 CWave 2000 dataflow toolkit.
33
The toolkit shares many features found in other research projects but also satisfies
all of the following requirements:
• Runs on Microsoft Windows platforms: Today, the best software development
tools are available for Microsoft Windows platforms. In order to provide a fair
comparison of a truly visual design environment with existing technology and to
test the ability to use a visual design environment as a plug-in into existing de-
velopment tools, the tool has to run on the same platform.
• Allows reuse due to modular design: Many projects suffer because they are not
designed to be reused in other contexts. Reuse [20] should be available in two
ways: Reuse of source code as well as reuse of compiled modules and compo-
nents.
• Light-weight, small, fast: This is a general design goal for most systems.
Unfortunately many research projects are written with higher-level languages
that allow rapid development but lack runtime performance.
• Powerful, extensible scripting language for agents: There are two possibilities
to implement agents. A custom language tailored to be used exclusively by mo-
bile agents such as KQML [46] or a generic scripting language with agent-
specific runtime libraries. We chose the second option because it allows devel-
opers to leverage existing scripting languages and does not force the user to
learn “yet another language.”
• Good availability of programming tools to build custom components: Many
visual programming environments provide the component writer with numerous
features but unfortunately require special language specific knowledge, header
34
files, etc. We believe that a properly designed visual design environment should
not require this. Instead the environment should be able to handle components
written to a common, language independent specification. In our case we have
picked Microsoft’s OCX specification as the common denominator for all com-
ponents. Details about the underlying common object model technology as well
as a description of OCXs will be given in section 3.1.1.
• Well-defined interface for component writers: Interfaces should be self-
describing which means that all of the interfaces of any of the components
should contain some kind of a type library, stored as an attachment inside the
executable module that can be queried for public interface functions such as
method and properties as well as constants and other datatypes.
• Embeddable in other/existing applications: This is a very important point that
does not get handled well by most other visual programming frameworks. In or-
der to provide the end user with a well-integrated, easy to use system, the visual
environment should be embeddable in other custom-written or existing applica-
tions. The shell should be customizable and seamlessly integratable and provide
the user with a unified user interface. The complexity of today's software sys-
tems is so high that users and developers are expecting integrated solutions at
design and runtime. The trend goes so far that users are expecting a common in-
terface to a collection of management tools. A good example is the Microsoft
Management Console in Windows 2000 that combines all kinds of plug-in man-
agement tasks in one shell. We think that an agent shell should also be plug-in
compatible with these applications.
35
3.1.1 Microsoft’s COM/DCOM specification
In the context of this thesis it is not possible to provide an in-depth coverage of
Microsoft’s Component Object Model (COM) technology [9]. Nevertheless we will try
to cover the most basic concepts.
An interface is a set of logically related functions that provide a way to manipulate
the state of an object but does not include an implementation of how to manipulate the
object. Every COM interface is an extension of the IUnknown interface that provides
mechanisms for lifetime management as well as the ability to query for other interfaces.
COM components are concrete implementations of one or more interfaces and usually
contain a description of the interface in an attached type library. Instances of COM
components are created by class factories that are registered in a global, system wide
database.8
After a first pointer to an instance of a COM object has been handed out by a class
factory, this pointer can be used to query for other interfaces. If the object supports the
requested interface it will return a valid pointer and will automatically increase its inter-
nal reference count. In case the requested interface is not supported a specific error code
will be returned. Each pointer to an object is reference counted and after the last pointer
to an object has been released, the instance of the object gets automatically destroyed.
In order to prevent name clashes, each interface, object and class factory gets as-
signed a globally unique identifier (GUID) which are used as indices into the system-
wide database.
8 On Windows platforms this database is part of the registry.
36
The COM/DCOM specification defines several different techniques on how to pass
pointers to COM objects across machine, process and thread boundaries. If an object
gets passed across process boundaries, COM will make an instance of a special, inter-
face-specific proxy object that is used to marshal calls and their arguments to the
original object.
3.1.2 The IDispatch interface
Of particular importance for this thesis and COM-based scripting languages in gen-
eral is the IDispatch interface. This interface is a simple extension of the IUnknown
interface described earlier and allows late binding. Instead of defining the complete
functionality of an interface upfront in a type library, this interface allows dynamic ex-
tensions of the functionality of an object at runtime. A COM-enabled scripting
interpreter for example would expose all functions, procedures and global variables of
the script through this interface. A client that wants to call a script function would call a
special function of the IDispatch interface asking whether it supports a function with a
certain name. If supported, the object returns a unique, function-specific identifier that
can be used by the client in subsequent calls to invoke that function.
In order to minimize overhead without compromising the flexibility of late binding,
many interfaces are defined as dual, which allows very efficient direct function calls as
well as calls through the slower IDispatch mechanism.
3.1.3 OLE, ActiveX and OCX specifications
Microsoft pioneered DDE (Dynamical Data Exchange) technology with the intro-
duction of Windows 3.1, their first successful implementation of the Windows operating
37
system. DDE allowed users to embed drawings of Microsoft’s painting program in a
word processor. DDE was superseded by the OLE 1.0 (Object Linking and Embedding)
specification, designed to support compound documents containing multiple informa-
tion types such as text, graphic images, sound and motion video within the same
document. In parallel to OLE 1.0 Microsoft defined the first specification for reusable,
in-process Visual Basic components called VBX. VBXs were hugely popular and al-
lowed a multitude of independent software vendors to offer third party components that
were reusable without requiring access to source code. Unfortunately VBXs were only
usable in Visual Basic and were closely tied to Windows 3.1 (16-bit Windows). The
OCX96 specification finally merged the OLE- and VBX technology and consists of a
set of standards describing activation, licensing, serialization, and display behavior.
Typical functionality of an OCX is handling of scroll bar movement, window resizing
and positioning. OCXs come in many different forms. They can be windowed or win-
dowless. They can have a rectangular shape or they can have an odd shape. They can
have transparent or opaque background. OCXs – nowadays called ActiveX controls - are
implemented as DLLs (Dynamic Link Library) and are always in-process. Today, OCXs
have completely replaced VBXs and are the de-facto standard for reusable components
on Windows platforms.
Acceptance of the OCX technology in languages such as C/C++ has been slow due
to the complexity of the technology involved even though Microsoft has been trying
hard to retrofit their MFC C++ class library with all the necessary hooks and interfaces
to make it OCX96 complient. Today, most OCXs are written in higher-level languages
38
such as Microsoft’s Visual Basic or Borland’s Delphi that do a reasonable job in creat-
ing OCX-standard compliant components.
3.1.4 OCX containers
An OCX container is a piece of code that contains one or more OCX instances and
manages shared resources used by all contained OCXs. Examples of shared resources
are screen area, menu and taskbar. During instantiation of an OCX, the container and
OCX exchange information about required and supported functionality through several
protocols. An example for optional functionality of an OCX is transparent background
drawing or windowless activation. An example for optional functionality of an OCX
container is the capability to negotiate menu space for the OCX as well as opti-
mized/flicker free drawing support. Each OCX negotiates its functionality and behavior
with the container. If the OCX does not handle some properties or the container does
not support some runtime functions, a compromise will be negotiated between the con-
tainer and OCX. In most cases, it is up to the container to downgrade its functionality
and to accommodate non-compliant or not fully implemented OCXs.
3.1.5 Introduction to component model used in this thesis
As explained in the previous sections we decided early on to implement our agent
framework on Microsoft’s Windows platform. The availability of excellent tools and a
well-established object model with good compiler support were the main reasons.
In the rest of this chapter we will describe each of the main modules used for our re-
search. Each module is based on COM and can be accessed remotely via DCOM. In
section 3.2 we describe the underlying communication mechanism for many of the
39
modules. Section 3.3 provides the reader with an overview of the scripting language and
the extensions we have added to implement agent behavior. Section 3.4 describes our
‘AnWindows’ library, the part of this that contains most innovations and took most of
the development time.
3.2 Publish/Subscribe software bus
Experiments with Tibco’s Rendezvous publish/subscribe software bus showed that
software buses are ideal for rapid prototyping of distributed applications. Unfortunately
the experiments also showed that Tibco’s bus was not a good choice if used by COM
and DCOM components due to the inability to pass objects and object pointers as well
as the inability to handle any kind of reference counting of the objects attached to it.
We therefore decided to implement our own version of a software bus based on
COM/DCOM. In order to make the transition as easy as possible and reduce the learn-
ing curve we made our own implementation as compatible with Tibco as possible. The
result is a software bus that works extremely efficiently if used in-process and that can
be accessed remotely by passing a pointer to a process on any Windows machine on the
network. Unlike Tibco, which provides only one global bus per network segment, we
can instantiate any number of busses (each bus is equivalent to a private communica-
tions channel) and group them in multilevel hierarchy through so-called “Hub” objects.
On the downside our bus does not use native network broadcasts (UDP) because this is
not supported by DCOM and might under certain circumstances put a higher load on the
network.
40
3.2.1 Publications and subscriptions
The concept of a publish/subscribe software bus is quite simple. All clients are con-
nected to a shared medium called the bus. They announce their interest in a certain topic
by subscribing to it. Clients that want to send a message to other clients publish a mes-
sage under a certain topic to the bus. If the receiver’s topic matches the sender’s topic,
the message is forwarded to the receiver.
3.2.2 Hierarchical naming of topics
One distinct feature of Tibco’s publish/subscribe bus is the hierarchical naming
structure of the topics. As shown in the BNF below, a topic is a string containing any
number of subtopics separated by dots:
SubTopic := STRING | *Topic := SubTopic | SubTopic . Topic | >
Each subtopic is either a string or a wildcard (represented as a ‘*’) which matches
all other topics at the same subtopic level. Finally, a topic can contain ‘>’ as the last
character which will match any number of subsequent topics. Typical examples for
valid topic names are:
MeasurePower. HP . HPLabs . Building_1 . *
MeasurePower. HP . HPLabs . * . *
MeasurePower. HP . *
MeasurePower. HP . >
MeasurePower. * . HPLabs . * . *
MeasurePower. * . HPLabs . * . >
41
Examples for invalid topic names:
Foo>
Foo* . Fee>
3.2.3 Broadcasts
The main purpose of a software bus is to distribute a message to many clients. This
is done via broadcasts. Assuming that we have two clients each subscribed to the fol-
lowing topic9:
ClientA: MeasurePower. HPLabs .Building_1
ClientB: MeasurePower. HPLabs .Building_2
If we wanted to send a message to each client individually, we would send two mes-
sages under the following topic names:
MeasurePower. HPLabs .Building_1
MeasurePower. HPLabs .Building_2
Alternatively we could send one broadcast message with the following topic:
MeasurePower. HPLabs .*
If we wanted to send a message to all (potentially thousands of) clients that ‘Meas-
urePower’ we would broadcast
MeasurePower. >
9 In the context of this section we use the convention that the leading field in the topic/subject name is a command that defines an action on a client. Following the command is a fully qualified node name with as many hierarchy levels as desired. Placing the ‘command’ field in the leading position (as opposed to at the end as suggested by Tibco) allows more efficient use of internal hash tables and hardware filter-ing.
42
So far we have looked at broadcasts done by the sender. The DCOM-based pub-
lish/subscribe bus used in this thesis also supports wildcards in subscriptions, also
known as “broadcast subscriptions” whose presence turns out to be very handy in many
scenarios. Tibco discouraged application writers to use this feature because of their in-
ability to use any kind of filtering in the lower levels of the UDP stack (such as
multicast). Since we use DCOM, the efficiency of our implementation does not suffer. If
for example a monitoring (spy-) application would want to log all ‘MeasurePower’
commands sent to HPLabs . Building_1, it would subscribe to:
MeasurePower. HPLabs . Building_1 . *
and would receive all messages sent under the following topics:
MeasurePower. HPLabs . Building_1 . Machine1,
MeasurePower. HPLabs . Building_1 . Machine2
but it would not receive
MeasurePower. HPLabs . Building_33 . Machine1
MeasureWater. HPLabs . Building_1 . Machine2
3.2.4 Local versus global buses
Let us begin with a description of what we call a local bus. A local bus is a bus that
is not accessible to objects that have not explicitly received a handle to the bus from a
trusted source.10 Only if an object gets hold of a bus pointer can it publish and subscribe
to the bus. In order to get hold of a bus pointer the object needs to have the proper
10 Security issues are enforced by COM / DCOM.
43
DCOM access permissions when it requests the pointer from the object that instantiated
the bus.
In contrast, a global bus is a bus that can be accessed by anyone who has the re-
quired DCOM privileges. In our implementation, a global bus is an instance of a local
bus with a publicly available mechanism to request a handle to the bus. Global busses
are very important to bootstrap a distributed application and are usually used during the
initialization phase to hand out handles to the more secure local buses.
3.2.5 Hubs
Like bus segments in an Ethernet network, local software buses can be combined
into a hierarchy of buses through the use of hub objects.11 A hub object allows the uni-
or bi-directional forwarding of a certain set of filtered messages to another bus. For ex-
ample the hub can be set up to only forward messages with a topic name of GLOBAL .
Power . > to another bus (e.g., an instance of the global bus).
3.2.6 AnEvent: Broadcast of objects
One of the major advantages of our Publish/Subscribe bus is the ability to send ob-
jects (Pass By Value) and references to objects (Pass By Reference) through the bus.
Experiments have shown that instead of publishing numeric values under a certain
topic, users of software buses often prefer to publish a collection of self-explanatory
data values preferably as named-value pairs. An example for a single message is shown
in Table 3.
11 The current implementation does not support circular connected buses.
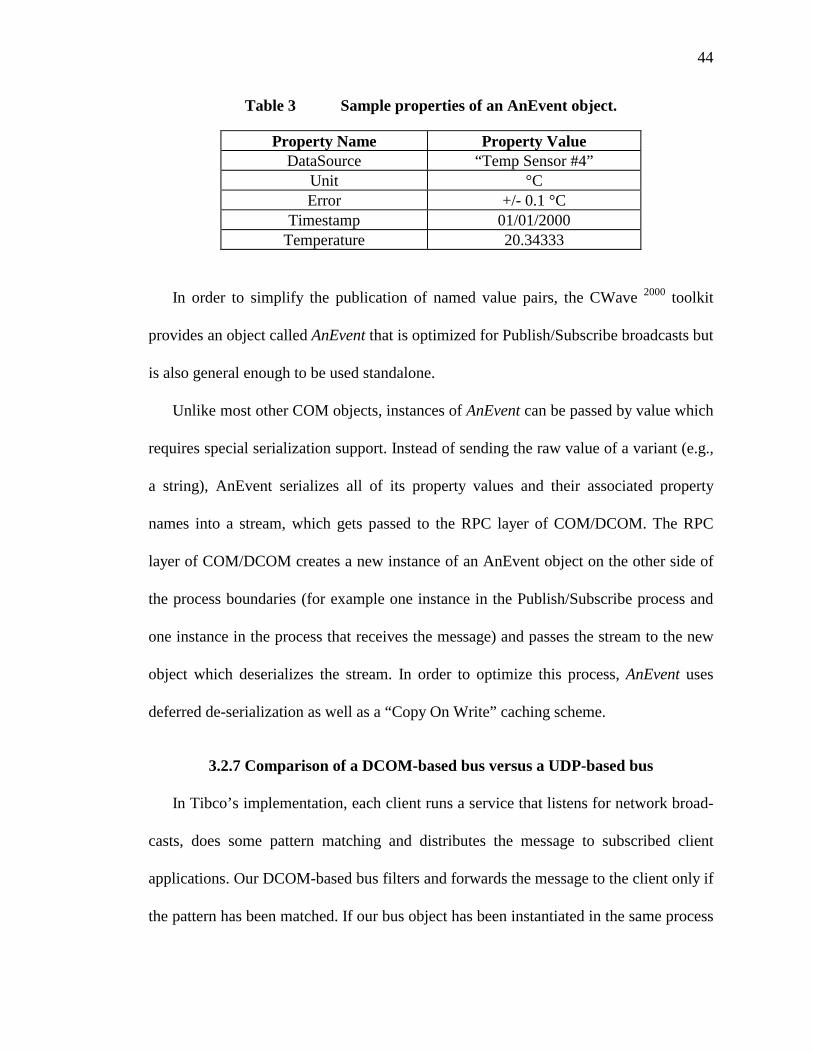
44
Table 3 Sample properties of an AnEvent object.
Property Name Property Value DataSource “Temp Sensor #4”
Unit °C Error +/- 0.1 °C
Timestamp 01/01/2000 Temperature 20.34333
In order to simplify the publication of named value pairs, the CWave 2000 toolkit
provides an object called AnEvent that is optimized for Publish/Subscribe broadcasts but
is also general enough to be used standalone.
Unlike most other COM objects, instances of AnEvent can be passed by value which
requires special serialization support. Instead of sending the raw value of a variant (e.g.,
a string), AnEvent serializes all of its property values and their associated property
names into a stream, which gets passed to the RPC layer of COM/DCOM. The RPC
layer of COM/DCOM creates a new instance of an AnEvent object on the other side of
the process boundaries (for example one instance in the Publish/Subscribe process and
one instance in the process that receives the message) and passes the stream to the new
object which deserializes the stream. In order to optimize this process, AnEvent uses
deferred de-serialization as well as a “Copy On Write” caching scheme.
3.2.7 Comparison of a DCOM-based bus versus a UDP-based bus
In Tibco’s implementation, each client runs a service that listens for network broad-
casts, does some pattern matching and distributes the message to subscribed client
applications. Our DCOM-based bus filters and forwards the message to the client only if
the pattern has been matched. If our bus object has been instantiated in the same process
45
as the client(s) this results in a very low communications overhead. In contrast, Tibco’s
implementation would send out a network broadcast and would have to wait for some
kind of acknowledgement from other machines. On the other hand if our bus has many
remote subscribers we would create more traffic on the network than Tibco.
Seen from a different perspective, Tibco is more efficient, if many clients are listen-
ing to the same topic but does not provide any kind of security due to native network
broadcasts nor does it provide a mechanism for sub group communication within a net-
work segment. Our implementation is more efficient for a small number of clients
listening for a certain topic but creates more traffic if messages are sent to many clients.
As it turns out, the communication pattern in the applications we run favor broadcasts to
small subgroups and a DCOM-based implementation seems to be the better and more
flexible choice in a pure Microsoft software environment.
One important difference between a UDP-based software bus (Tibco) and a connec-
tion-oriented bus implemented on top of DCOM is the ability to instantiate several
buses with each bus running its own filtering algorithm. Since each bus runs independ-
ently of other buses, our DCOM-based solution does not suffer under the potential
security problem that everyone could listen to every message on the network. Instead,
we leverage the built-in security of COM and DCOM. In contrast, a UDP-based solution
would allow every machine to broadcast and listen to messages on the network.
Tibco does not support local buses and therefore cannot isolate several small high-
volume broadcast groups from each other. Instead, messages of these groups would be
sent to everyone over the global bus.
46
3.3 ActiveX Scripting
The flexibility of interpreted programming languages has had a long history in com-
puter science. Interpreted languages are often used for automating frequently executed
task or for gluing applications and components together.
Originally developed for implementation in web pages, Microsoft early on provided
a scripting engine that was embeddable through a COM interface in other applications.
Provided that an application had been developed with scripting in mind, scripting sup-
port replaced macros and batch processing in many applications and provided the power
user with an easy way to automate and control an application. One of the primary advan-
tages of using scripts in applications is the ability to allow customization at any later
time. In many cases this type of late binding is very desirable for fixing bugs without
recompilation and redistribution of executables.
3.3.1 Scripting engines
ActiveX scripting is a generic standard for scripting languages and frees application
developers from worrying which scripting language is best suited for an application.
Currently, Microsoft provides VisualBasic and JavaScript scripting engines, both origi-
nally developed for their web-browser. Other ActiveX scripting languages are Perl-
script [47] and Python [37]. Almost all vendors of Microsoft Windows applications
have redesigned their applications to make use of Microsoft’s generic ActiveX scripting
engine. Scripting is also an integral part of Microsoft Windows 2000 and replaces the
outdated batch file processing inherited from DOS.
47
An important feature of the ActiveX scripting standard is the ability to extend the
namespace of the scripting language with new methods, functions and objects. The
CWave 2000 toolkit makes extensive use of this feature to provide users of the system an
easy to use, highly integrated environment.
3.3.2 Singlethreaded versus multithreaded scripts
In order to increase performance of the agent system, we have added multiproces-
sing capabilities to Microsoft’s scripting engine. A script can be designed to run in a
single- or multithreaded scripting environment and is capable of forking other scripts. If
a script is singlethreaded, it is instantiated in the main thread of the application and (due
to COM threading rules) has direct access to all other singlethreaded objects without
invoking any type of proxies. If on the other hand the script is marked as multithreaded,
the runtime environment creates a new execution context for the script and calls to other
COM objects are marshaled through proxies.
3.3.3 Scripting meta language
We have extended the scripting language with several meta tags that specify certain
runtime parameters of the script itself. Meta tags can appear anywhere in the script but
are expected to be at the beginning of a line. Each meta tag starts with the comment
character of the selected scripting language followed by ‘$[tagname]’. Meta tags are
also accessible through runtime functions from the script via the ‘Self’ object. Each
meta tag is parsed according to the following BNF:
COMMENT_CHAR := [Comment character of selected scripting language]
TAGNAME := String
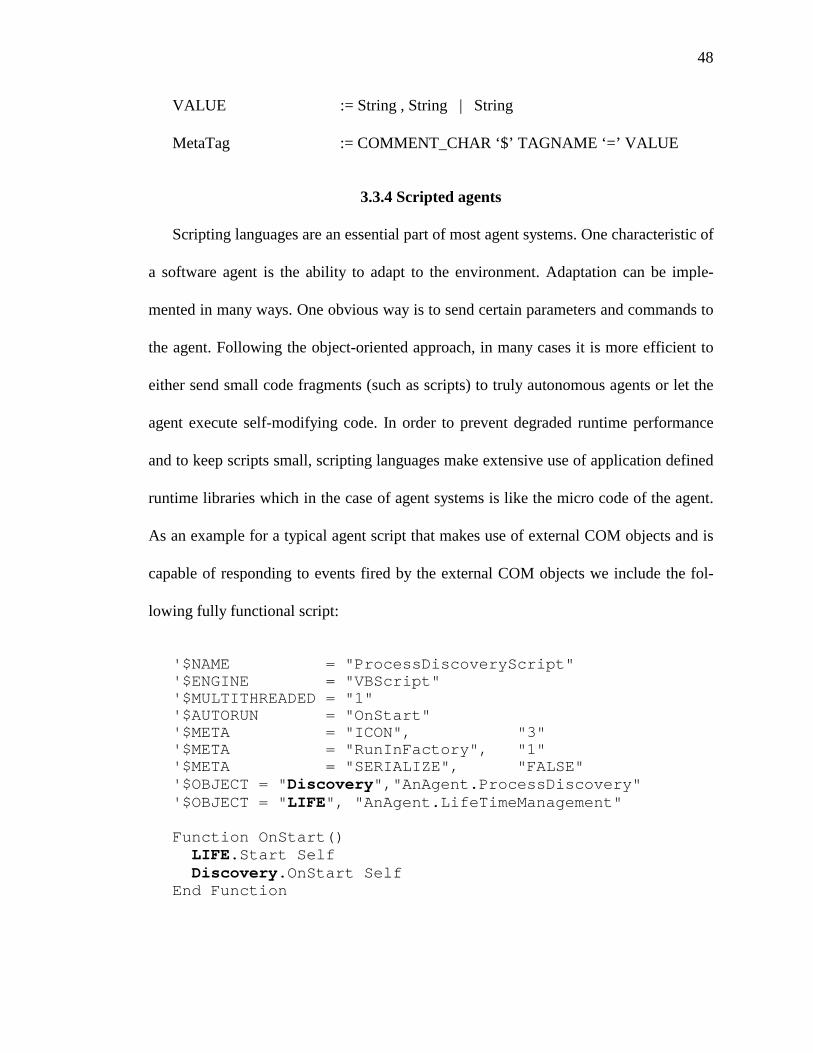
48
VALUE := String , String | String
MetaTag := COMMENT_CHAR ‘$’ TAGNAME ‘=’ VALUE
3.3.4 Scripted agents
Scripting languages are an essential part of most agent systems. One characteristic of
a software agent is the ability to adapt to the environment. Adaptation can be imple-
mented in many ways. One obvious way is to send certain parameters and commands to
the agent. Following the object-oriented approach, in many cases it is more efficient to
either send small code fragments (such as scripts) to truly autonomous agents or let the
agent execute self-modifying code. In order to prevent degraded runtime performance
and to keep scripts small, scripting languages make extensive use of application defined
runtime libraries which in the case of agent systems is like the micro code of the agent.
As an example for a typical agent script that makes use of external COM objects and is
capable of responding to events fired by the external COM objects we include the fol-
lowing fully functional script:
'$NAME = "ProcessDiscoveryScript"'$ENGINE = "VBScript"'$MULTITHREADED = "1"'$AUTORUN = "OnStart"'$META = "ICON", "3"'$META = "RunInFactory", "1"'$META = "SERIALIZE", "FALSE"'$OBJECT = "Discovery","AnAgent.ProcessDiscovery"'$OBJECT = "LIFE", "AnAgent.LifeTimeManagement"
Function OnStart()LIFE.Start SelfDiscovery.OnStart Self
End Function
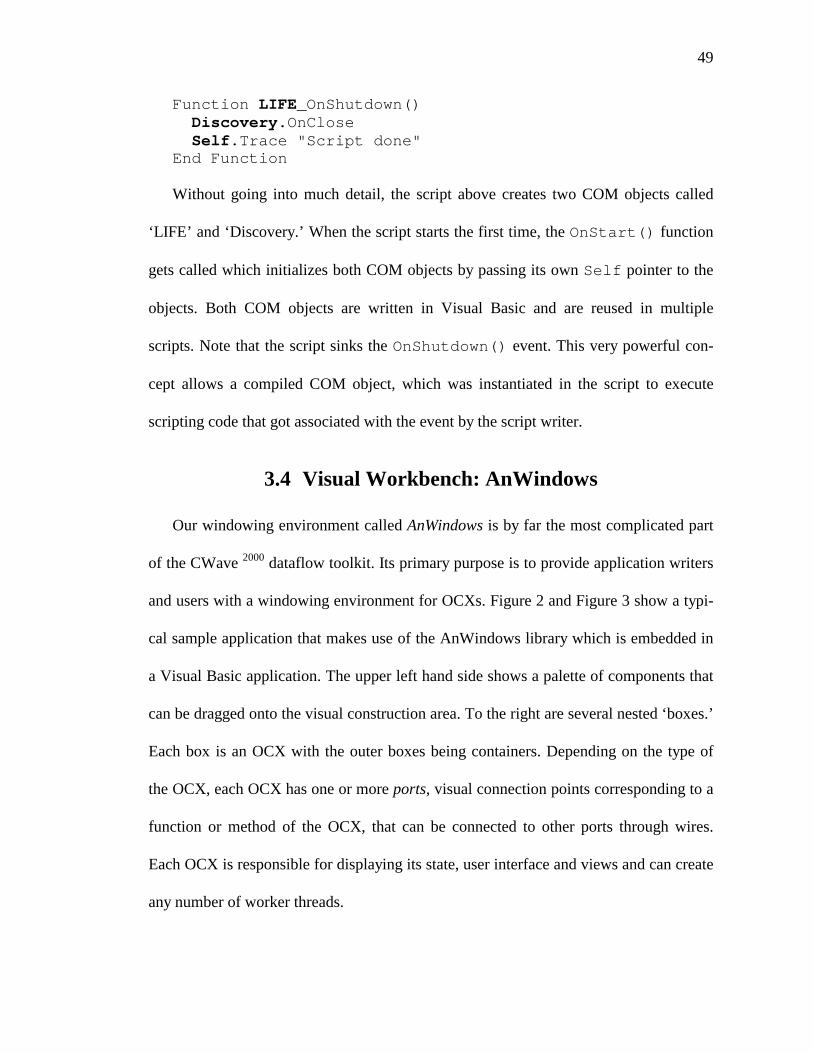
49
Function LIFE_OnShutdown()Discovery.OnCloseSelf.Trace "Script done"
End Function
Without going into much detail, the script above creates two COM objects called
‘LIFE’ and ‘Discovery.’ When the script starts the first time, the OnStart() function
gets called which initializes both COM objects by passing its own Self pointer to the
objects. Both COM objects are written in Visual Basic and are reused in multiple
scripts. Note that the script sinks the OnShutdown() event. This very powerful con-
cept allows a compiled COM object, which was instantiated in the script to execute
scripting code that got associated with the event by the script writer.
3.4 Visual Workbench: AnWindows
Our windowing environment called AnWindows is by far the most complicated part
of the CWave 2000 dataflow toolkit. Its primary purpose is to provide application writers
and users with a windowing environment for OCXs. Figure 2 and Figure 3 show a typi-
cal sample application that makes use of the AnWindows library which is embedded in
a Visual Basic application. The upper left hand side shows a palette of components that
can be dragged onto the visual construction area. To the right are several nested ‘boxes.’
Each box is an OCX with the outer boxes being containers. Depending on the type of
the OCX, each OCX has one or more ports, visual connection points corresponding to a
function or method of the OCX, that can be connected to other ports through wires.
Each OCX is responsible for displaying its state, user interface and views and can create
any number of worker threads.
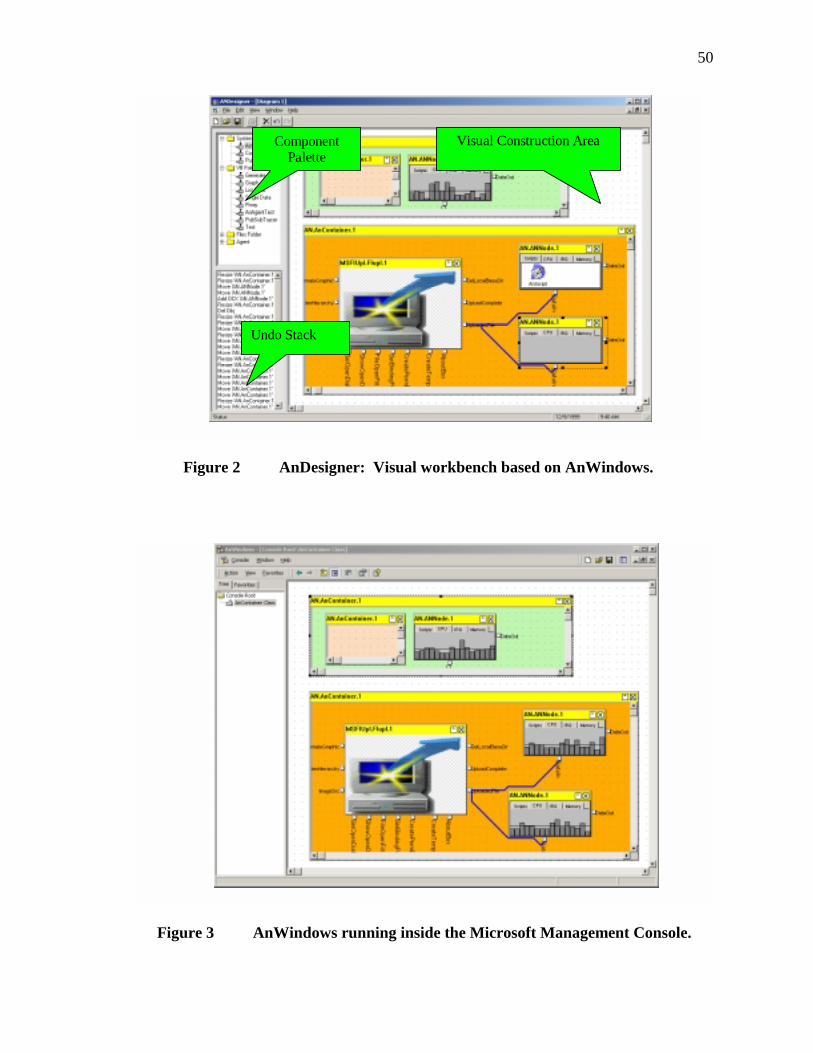
50
Visual Construction Area
Undo Stack
Component Palette
Figure 2 AnDesigner: Visual workbench based on AnWindows.
Figure 3 AnWindows running inside the Microsoft Management Console.
51
It is worth mentioning that the AnWindows library can be embedded in other
applications as well. Figure 3 shows the same drawing embedded inside the Microsoft
Management Console (MMC). Components can be dragged from a palette component
embedded inside the drawing (the palette is also an OCX) or from another instance of
AnWindows running in a different process.
3.4.1 Nesting of OCXs
One of the ideas behind the AnWindows library is the ability to recursively nest
OCXs. In order to nest an OCX in itself, the OCX has to also be an OCX container. The
basis for this recursion is a COM-enabled executable such as a wizard-generated Visual
Basic application (Figure 2) or an existing OCX container (Figure 3) that makes an in-
stance of the top-level AnWindows container. This top-level container provides the user
with a drawing surface that is capable of hosting other OCXs including other instances
of itself. This very powerful concept allows existing applications to host our visual envi-
ronment and leverages existing tools to create visual components.
3.4.2 Active faceplates
Objects in conventional programming languages such as C++ or Java are used to
hide complexity and implementation details. The equivalent of an object in a visual pro-
gramming environment are containers with one or more nested subcomponents wired
together. Most visual programming systems hide the complexity inside of the container
with a static faceplate displayed on top of the substructure. Faceplates in these systems
are typically static images such as bitmaps or vector drawings.
52
Our system does not provide built-in support for static faceplates. Instead we are
leveraging the patend-pending feature of minimizing and maximizing nested child
OCXs inside of an OCX container. Similar to the window handling in Microsoft Win-
dows application, a child OCX can be maximized to the size of its parent OCX with the
titlebar of both OCXs being merged. Unlike the window handling in MS Windows our
system supports the infinite minimizing/maximizing of any number of nested OCXs.
Each nested OCX can be maximized to take over the entire area of its parent and can
therefore serve as a faceplate.
Due to the flexibility of the OCX specification, the OCX can show a static image or
can display any type of animation, visualization or web page based on data flowing
through its inputs. Figure 4 shows two views of an AnWindows drawing. The left hand
side shows a snapshot of the program immediately after the drawing has been done. To
the right, the programmer has decided to hide the complexity of the drawing by maxi-
mizing two of the subcomponents to the size of their surrounding container. Instead of
presenting the user of the visual program with a complex drawing, two subcomponents
are chosen to represent the inside of the container.
Figures 5 to 11 show how active faceplates can be used to hide complexity of a
drawing by maximizing embedded components inside an AnContainer. Initially, the
chart component hides all other components and serves as an active faceplate. Drilling
down the hierarchy exposes more and more detail. Finally, we maximize some other
components to provide users with a different view (a static faceplate).
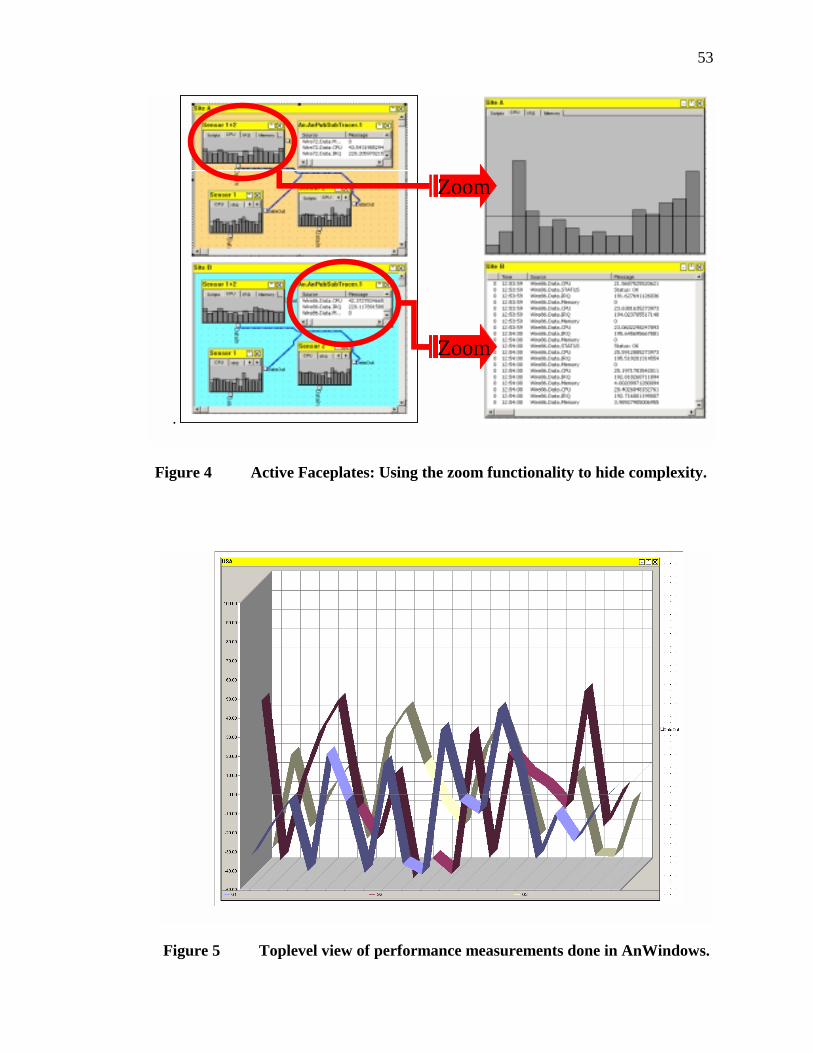
53
.
Zoom
Zoom
Zoom
Zoom
Figure 4 Active Faceplates: Using the zoom functionality to hide complexity.
Figure 5 Toplevel view of performance measurements done in AnWindows.
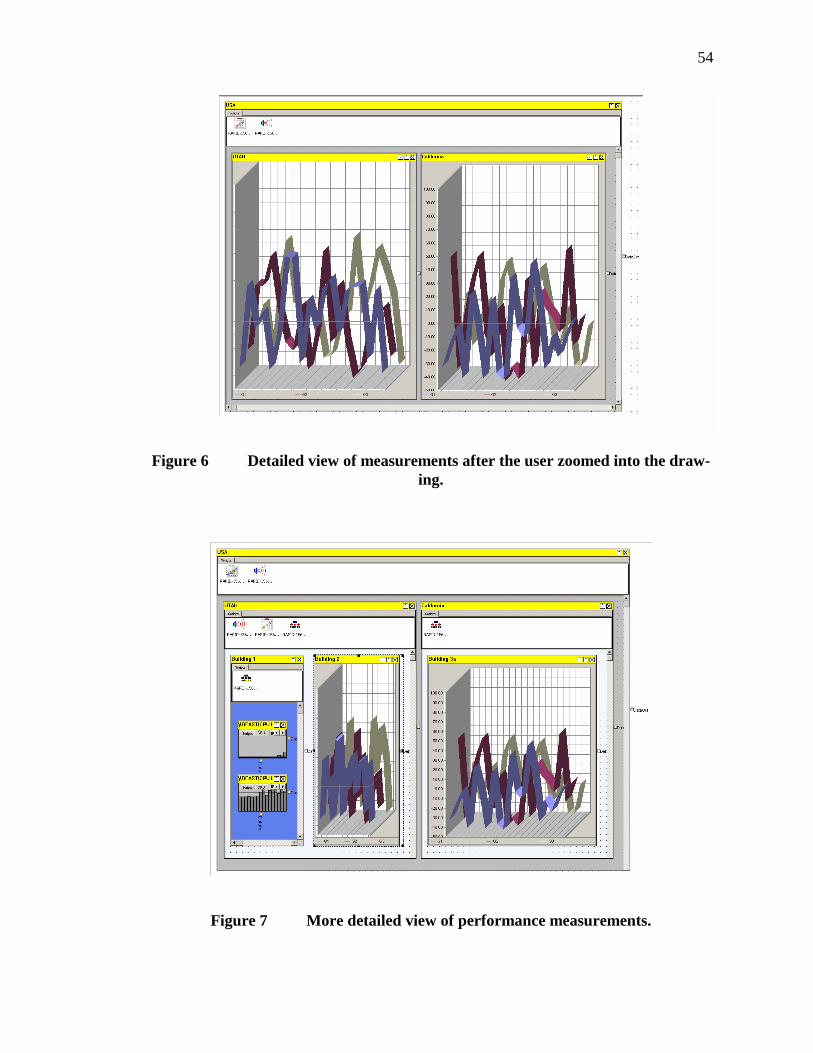
54
Figure 6 Detailed view of measurements after the user zoomed into the draw-ing.
Figure 7 More detailed view of performance measurements.
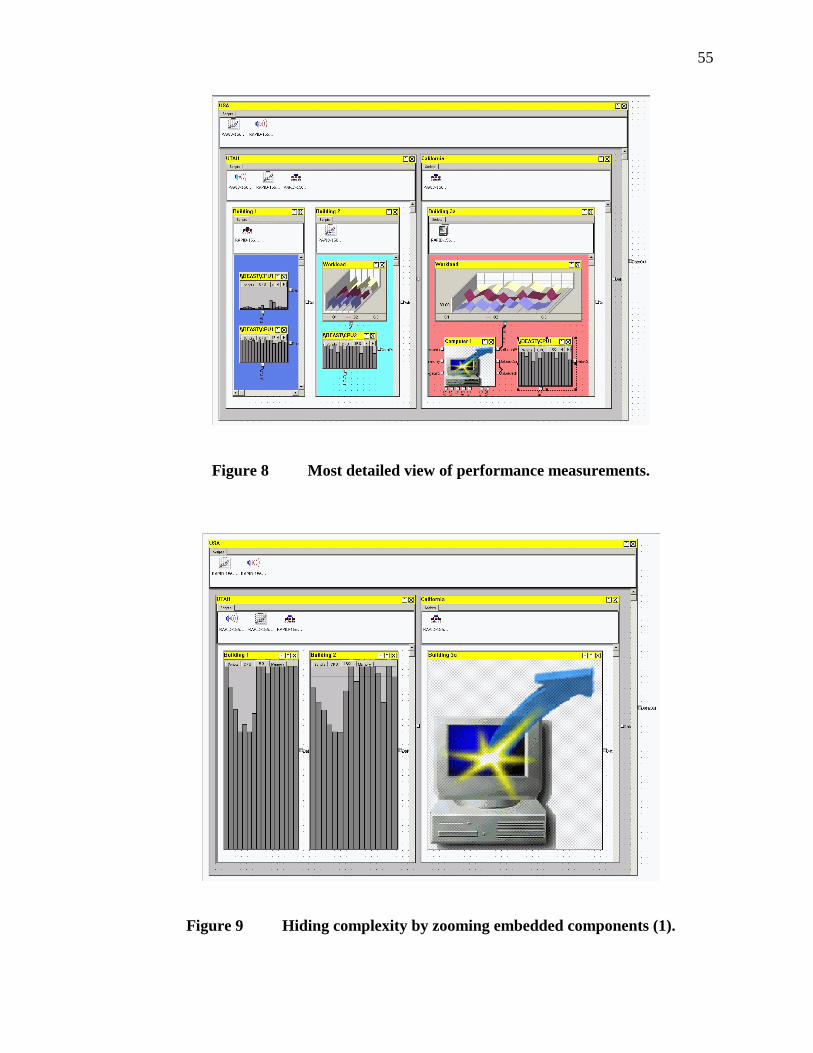
55
Figure 8 Most detailed view of performance measurements.
Figure 9 Hiding complexity by zooming embedded components (1).
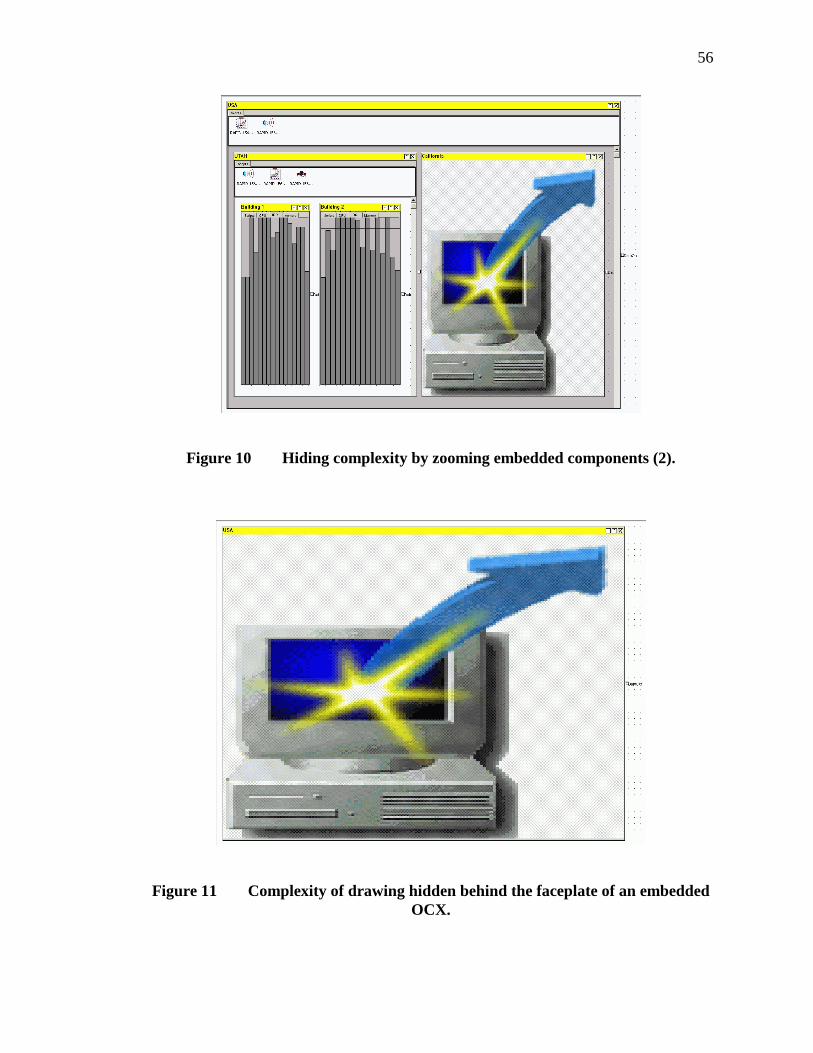
56
Figure 10 Hiding complexity by zooming embedded components (2).
Figure 11 Complexity of drawing hidden behind the faceplate of an embedded OCX.
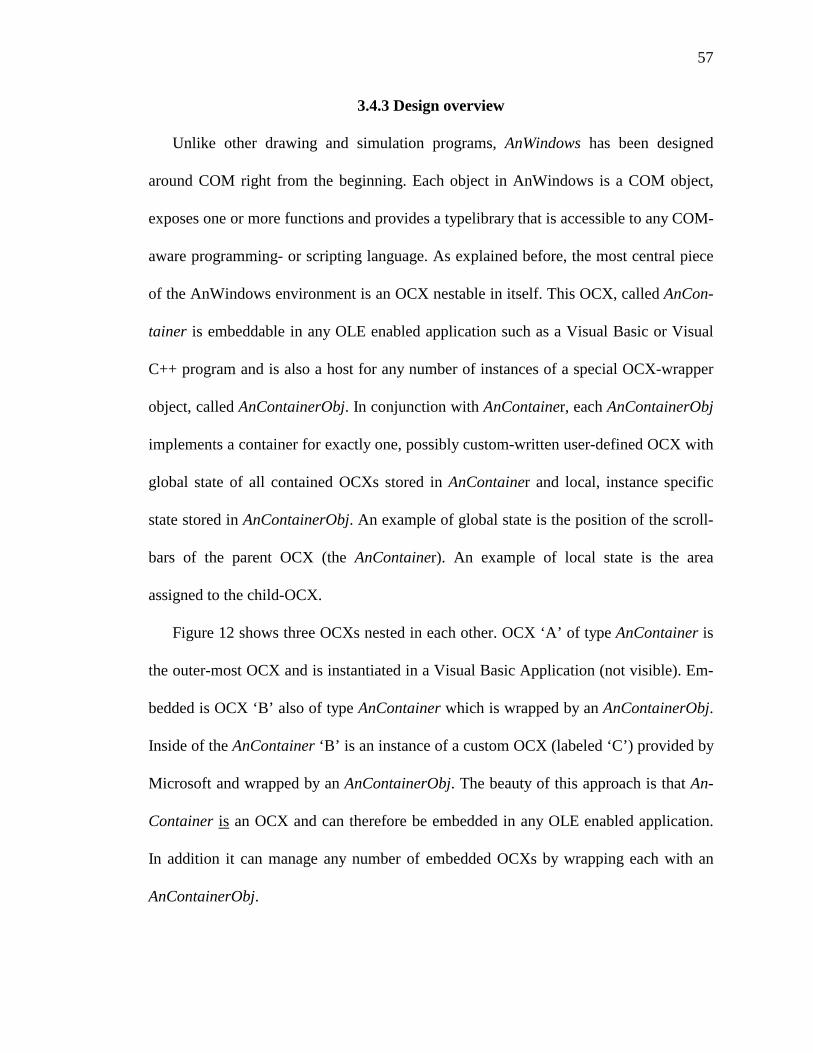
57
3.4.3 Design overview
Unlike other drawing and simulation programs, AnWindows has been designed
around COM right from the beginning. Each object in AnWindows is a COM object,
exposes one or more functions and provides a typelibrary that is accessible to any COM-
aware programming- or scripting language. As explained before, the most central piece
of the AnWindows environment is an OCX nestable in itself. This OCX, called AnCon-
tainer is embeddable in any OLE enabled application such as a Visual Basic or Visual
C++ program and is also a host for any number of instances of a special OCX-wrapper
object, called AnContainerObj. In conjunction with AnContainer, each AnContainerObj
implements a container for exactly one, possibly custom-written user-defined OCX with
global state of all contained OCXs stored in AnContainer and local, instance specific
state stored in AnContainerObj. An example of global state is the position of the scroll-
bars of the parent OCX (the AnContainer). An example of local state is the area
assigned to the child-OCX.
Figure 12 shows three OCXs nested in each other. OCX ‘A’ of type AnContainer is
the outer-most OCX and is instantiated in a Visual Basic Application (not visible). Em-
bedded is OCX ‘B’ also of type AnContainer which is wrapped by an AnContainerObj.
Inside of the AnContainer ‘B’ is an instance of a custom OCX (labeled ‘C’) provided by
Microsoft and wrapped by an AnContainerObj. The beauty of this approach is that An-
Container is an OCX and can therefore be embedded in any OLE enabled application.
In addition it can manage any number of embedded OCXs by wrapping each with an
AnContainerObj.
58
It is important to note that the AnWindows dynamic link library does not provide
any type of dataflow capabilities. A visual connection between two ports might look like
a wire or bus but it does not define any type of execution semantics. What it does pro-
vide are hooks to exchange messages between objects connected to a wire through an
external software bus, in our case instances of the Publish / Subscribe bus described in
section 3.2. Details about the implementation of dataflow between visual components
are given in section 3.4.4. A surprisingly complex task of AnContainer is to initiate se-
rialization (load and save) of itself and all of its substructures, notably the contained
AnContainerObj
Custom OCX
AnContainerObj
AnContainer OCX
AnContainer OCX
AnContainerObj
Custom OCX
AnContainerObj
AnContainer OCX
AnContainer OCX
Figure 12 Wrapping and nesting of OCXs.
59
OCXs and wires. Section 3.4.9 provides the reader with an in-depth description of how
serialization is implemented.
In order to provide openness and flexibility, one of the design goals of the system
was to allow users to walk up and down the object hierarchy with any COM enabled
language (e.g., VB script). Therefore each object provides COM-accessible enumera-
tions of all objects it is connected to. Each port provides an enumeration of attached
wires, visual connections between ports. Each wire itself exposes an enumeration of all
attached ports. Each AnContainer exposes enumerations of all contained AnContain-
erObj and wires. AnContainerObj provides a pointer to the wrapped OCX and the OCX
can retrieve a pointer to its wrapper via the IClientSite interface (C++) or through the
Extender property in Visual Basic.
3.4.4 The type library parser
One of the interesting features of AnContainerObj is the capability to parse the type
library of the OCX it wraps. Type libraries of OCXs contain signatures and descriptions
of public interfaces, functions, methods, properties, constants and datatypes. Most so-
phisticated COM objects will expose their type information through the
IProvideTypeInfo interface which provides a root handle to the type information of the
object. Parsing the type information is done recursively, is quite complex, and might
involve loading (and parsing) type libraries of other referenced COM objects. Through a
complicated process of recursively walking the type information, AnContainerObj
searches for relevant incoming and outgoing (event-) IDispatch interfaces and attaches
ports, visual connection points to be used for wiring, for each method, property or func-
60
tion to the graphical representation of the OCX. For each visual connection point the
parser decodes the type(s) of the expected function arguments, a help string (if avail-
able), as well as information about the type of the function and how it is supposed to be
invoked. Examples for different invocation types are property-put, property-get and
standard method invocation.
3.4.5 Using Pub/Sub to implement dataflow
One of the primary design goals of the code presented as part of the thesis is modu-
larity and software reuse. Initially, the Publish / Subscribe bus described in section 3.2
was developed as part of a research project at HP-Labs, Palo Alto, to provide a conven-
ient topic-based communications environment for COM-based applications. The code is
in use, is the basis for an application management prototype and was recently trans-
ferred to an HP product division.
Previous experience with implementing dataflow in our first CWave prototype made
us realize how convenient it would be to base the communications between wired OCXs
on the existing Publish / Subscribe software bus. There were many advantages ranging
from practical reasons such as reusing well-debugged, trusted code to conceptual advan-
tages such as using the same communications metaphor in more than one project. A
careful requirements analysis of existing dataflow implementations showed that the bus
already handled most of the common dataflow issues such as message buffering, asyn-
chronous message delivery and so on. We decided to instantiate one local bus (see
section 3.2.4 for details) per AnContainer and to map wires between two or more OCXs
to a unique topic name (a communications channel) on the bus.
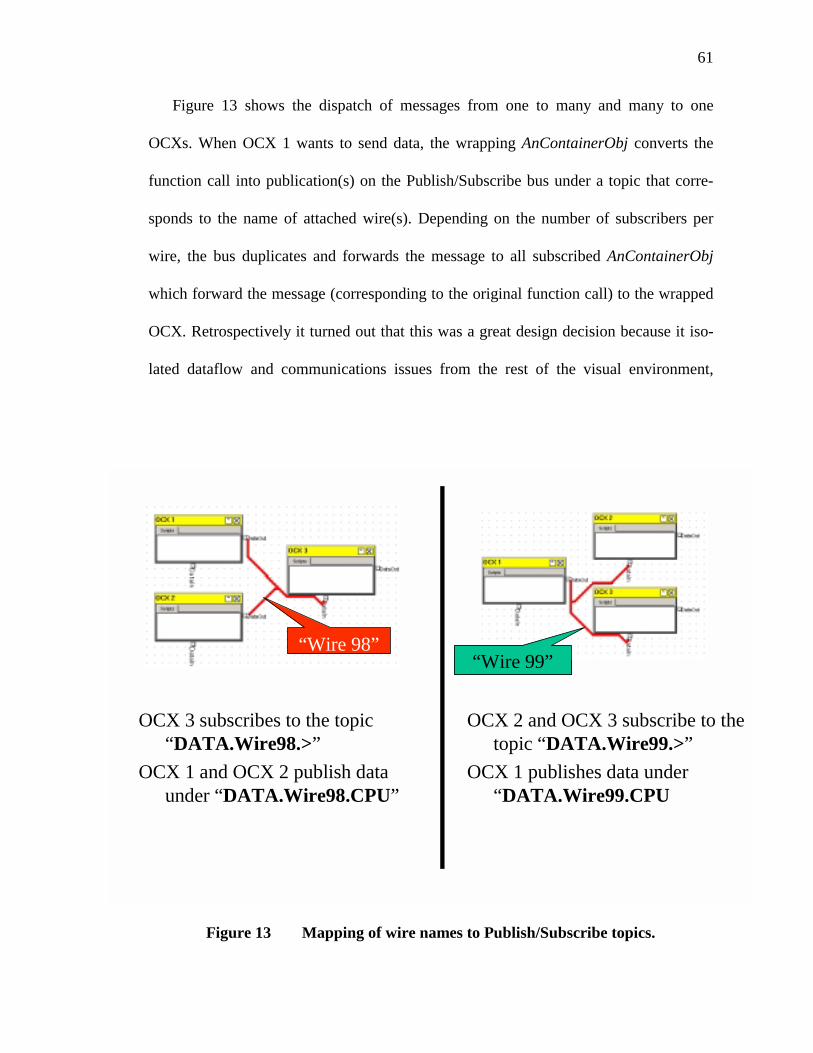
61
Figure 13 shows the dispatch of messages from one to many and many to one
OCXs. When OCX 1 wants to send data, the wrapping AnContainerObj converts the
function call into publication(s) on the Publish/Subscribe bus under a topic that corre-
sponds to the name of attached wire(s). Depending on the number of subscribers per
wire, the bus duplicates and forwards the message to all subscribed AnContainerObj
which forward the message (corresponding to the original function call) to the wrapped
OCX. Retrospectively it turned out that this was a great design decision because it iso-
lated dataflow and communications issues from the rest of the visual environment,
OCX 3 subscribes to the topic “DATA.Wire98.>”
OCX 1 and OCX 2 publish data under “DATA.Wire98.CPU”
OCX 2 and OCX 3 subscribe to the topic “DATA.Wire99.>”
OCX 1 publishes data under “DATA.Wire99.CPU
“Wire 98”“Wire 98”“Wire 99”“Wire 99”
Figure 13 Mapping of wire names to Publish/Subscribe topics.
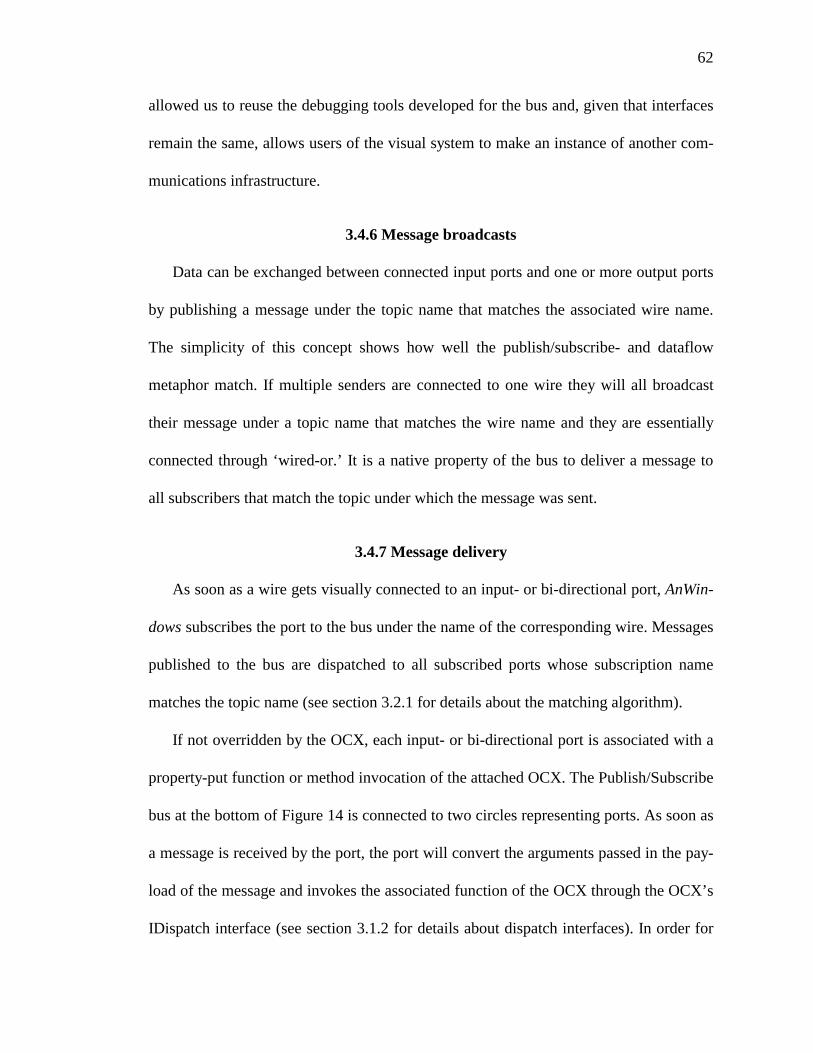
62
allowed us to reuse the debugging tools developed for the bus and, given that interfaces
remain the same, allows users of the visual system to make an instance of another com-
munications infrastructure.
3.4.6 Message broadcasts
Data can be exchanged between connected input ports and one or more output ports
by publishing a message under the topic name that matches the associated wire name.
The simplicity of this concept shows how well the publish/subscribe- and dataflow
metaphor match. If multiple senders are connected to one wire they will all broadcast
their message under a topic name that matches the wire name and they are essentially
connected through ‘wired-or.’ It is a native property of the bus to deliver a message to
all subscribers that match the topic under which the message was sent.
3.4.7 Message delivery
As soon as a wire gets visually connected to an input- or bi-directional port, AnWin-
dows subscribes the port to the bus under the name of the corresponding wire. Messages
published to the bus are dispatched to all subscribed ports whose subscription name
matches the topic name (see section 3.2.1 for details about the matching algorithm).
If not overridden by the OCX, each input- or bi-directional port is associated with a
property-put function or method invocation of the attached OCX. The Publish/Subscribe
bus at the bottom of Figure 14 is connected to two circles representing ports. As soon as
a message is received by the port, the port will convert the arguments passed in the pay-
load of the message and invokes the associated function of the OCX through the OCX’s
IDispatch interface (see section 3.1.2 for details about dispatch interfaces). In order for
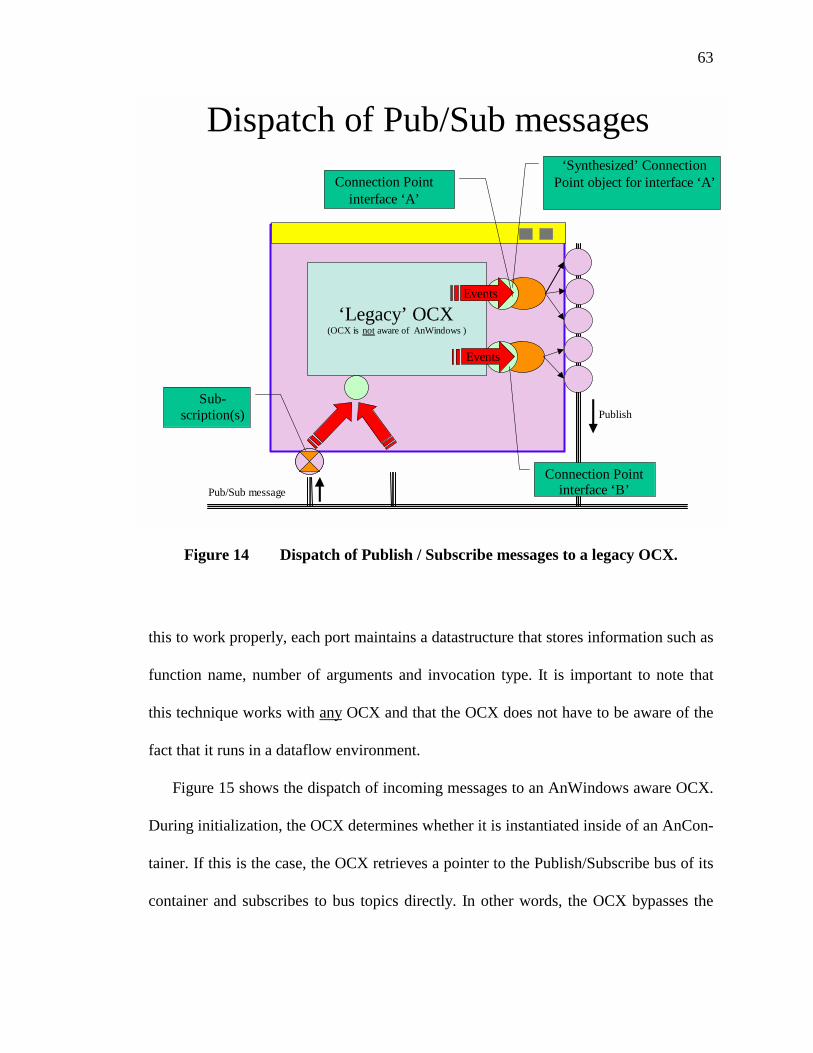
63
this to work properly, each port maintains a datastructure that stores information such as
function name, number of arguments and invocation type. It is important to note that
this technique works with any OCX and that the OCX does not have to be aware of the
fact that it runs in a dataflow environment.
Figure 15 shows the dispatch of incoming messages to an AnWindows aware OCX.
During initialization, the OCX determines whether it is instantiated inside of an AnCon-
tainer. If this is the case, the OCX retrieves a pointer to the Publish/Subscribe bus of its
container and subscribes to bus topics directly. In other words, the OCX bypasses the
Dispatch of Pub/Sub messages
‘Legacy’ OCX (OCX is not aware of AnWindows )
Events
Events
Connection Point interface ‘A’
‘Synthesized’ Connection Point object for interface ‘A’
Publish
Pub/Sub message
Sub-scription(s)
Connection Point interface ‘B’
Figure 14 Dispatch of Publish / Subscribe messages to a legacy OCX.
64
dispatch process described earlier and can publish and subscribe to connected wire(s)
directly.
3.4.8 Dispatch of OCX-events
Most interactive OCXs raise events when certain things happen (e.g., user clicked a
button or when a lengthy computation was finished). According to the COM specifica-
tion, OCX events are dispatched through the IConnectionPoint interface which is used
to enumerate all outgoing (event-) interfaces of an object. Each outgoing interface is de-
fined by the OCX (the event source) and is implemented by the OCX container (the
Dispatch of Pub/Sub messages
(1) OCX creates ports and subscribes them to
the bus
(2) OCX waits for messages and forward
them to IAnOCX interface of the contained OCX
(1) OCX creates ports
(2) OCX calls SendData () function of
port
In - ports
Out - ports
Pub/Sub message
IAnOCX
OCX
Pub/Sub
Pub/Sub message
IAnOCX
OCX
Pub/Sub
OCX is AnWindows aware Custom OCX, that knows
about AnWindows
AnContainerObj
Figure 15 Dispatch of Pub/Sub messages to AnWindows aware OCX.

65
event sink). In order to sink events of any OCX, an OCX container has to be capable of
synthesizing the implementation of an interface by parsing the OCX’s typelibrary. Dur-
ing the parsing process of the typelibrary, the container initializes a data structure that
mimics a virtual function table (a collection of function pointers) of an object imple-
menting the interface that is currently being parsed. Some of the more complex issues
are handling of the calling convention (e.g., C or PASCAL calling convention) as well
as the correct handling of the arguments passed to the synthesized function.
For a special type of outgoing interface, so-called DispInterfaces, the event source
dispatches events via calls to a dynamic implementation of an IDispatch interface. In-
stead of making direct calls to synthesized functions implemented by the container, calls
are channeled through an instance of an IDispatch interface created on the fly by the
container. A dynamically created lookup table maintained by the synthesized object
maps the unique ID of each function of the user-defined event interface to its function
name. Arguments to the event sink function are passed as variant arrays and have to be
decoded with the help of the type library. OCXs can define many incoming and outgo-
ing interfaces which requires cleverness on the side of the container.
As described in section 3.4.4, the typelibrary parser recognizes connection point in-
terfaces and creates visual connection points for each function in one of these interfaces.
For each connection point interface the parser instantiates a small, lightweight COM
object with a hash table that gets initialized when the typelibrary is parsed and that is
used to map the unique function ID to the associated outgoing port. A pointer to this
dynamically created COM object is passed to the OCX. In case an event is about to be
raised, the OCX calls a dispatch function through this pointer and passes the function
66
identifier and event-argument(s) along. A lookup in the hash table reveals the associated
port which is used to lookup connected wires. Through each connected wire the argu-
ments that were originally passed to the event sink function, are broadcast to registered
listeners as described in section 3.4.4.
This quite complicated process is illustrated on the right hand side of Figure 14. The
legacy OCX exposes two outgoing event interfaces and each event interface is imple-
mented by the AnContainerObj wrapping the legacy OCX. After the OCX raises the
event, the synthesized event handler inside the AnContainerObj gets called and trans-
lates the function arguments into a message that can be broadcast via the
Publish/Subscribe bus. This message gets published to all wires connected to the port.
In case the OCX is AnWindows aware, it can choose to bypass this mechanism and pub-
lish messages directly to the bus.
3.4.9 Serialization
Most of the objects used in AnWindows are capable of serializing their state to and
from a binary data stream such as a file or compound data structure. In principle seriali-
zation is quite simple. Each object reads and writes the contents of its datamembers to a
file sequentially. This works very well for simple datatypes such as numbers and charac-
ters but gets more complicated if entire structures or arrays have to be serialized. As
soon as structures or objects to be serialized are allocated on the heap, serialization gets
difficult because the restore process has to allocate memory and return pointers to the
newly created structure or object. For obvious reasons, the value of the returned pointer
67
will be different each time the object is restored and cannot be used for a direct, unique
identification of the returned object or structure.
A common workaround is to assign a unique identifier to each object in the system
that gets serialized as part of the object’s state. In conjunction with a global symbol ta-
ble that maps identifiers to and from the associated pointer this technique allows
programs to serialize entire pointer structures. As long as global identifiers are unique,
this technique works very well but fails miserably, if for some reason two objects were
assigned the same ID.
The assignment of a globally unique ID to a COM object is nothing new to COM
programmers, making use of one of the Win32 API functions that uses the MAC ad-
dress of the Ethernet adapter in conjunction with the system timer to create a 32-Byte
number. Unfortunately, due to the limited resolution of the system timer, this function
cannot be called too frequently. In addition, serializing 32 bytes for every reference to
an object is quite inefficient and will increase the size of the serialized data stream con-
siderably.
In order to solve this problem, we devised the following technique. Each object gets
a program-unique (not system-unique!) 64-bit number assigned which is registered with
the object’s IUnknown pointer in a symbol table called ROT (Running Object Table).
The high-word of the 64-bit ID corresponds to the program-unique namespace while the
low-word corresponds to the unique number assigned to the object. After the creation of
an object, a unique ID is assigned in the zero namespace (all bits in the high-word are
set to zero). When the state of the object is written to disk, only the low-word of the ID
is written to disk (32 bit). Each time a serialized drawing gets restored, a new, program-

68
unique, temporary namespace is created (by adding ‘+1” to the namespace counter) and
the object gets registered in the ROT under this newly created namespace combined
with the restored 32-bit ID value in the low-word. After restoring the serialized pointer
structure by combining the temporary namespace with the serialized 32bit ID, the regis-
tration of the object in the temporary namespace gets revoked and the object gets
registered in the default/zero namespace under a new program-unique ID where it re-
mains registered until it gets destroyed. Seen from a language perspective, a part of a
program gets loaded into a temporary namespace in another program. After all internal
references of the loaded program are resolved, both programs are merged by moving
and renaming all identifiers from the temporary namespace to the global namespace.
So far we have only looked at how object identities are preserved across serializa-
tion. Remaining issues are how an OCX of any type gets created, how it restores its state
and how nesting of contained OCXs is handled. OCXs are COM objects. Depending
whether a COM object is designed to be serializable or not, it supports one (or more) of
three serialization interfaces. One method of any of the three interfaces returns the Class
ID (CLSID) of the object that can be used to determine the type of the object at runtime
and can be passed to the CreateObject function of the Win32 API. In case the OCX does
not support any of these interfaces, AnWindows uses the cached CLSID that was used
when the object was instantiated the first time.
After the object is created as part of the serialization process, it reads its serialized
state including the low-word of its serialized object ID and passes the serialization call
to its child components (if it has any). After the entire recursive structure has been read,
all objects are initialized through three consecutive phases. During the first phase, all
69
objects register themselves in the temporary namespace as described earlier. After the
first phase has been completed, the ROT is properly initialized and is capable of resolv-
ing all lookup requests during the next phase. Phase II walks the structure of all objects,
ports and wires and resolves all serialized object identifiers to valid pointers. Phase III is
used to revoke the registration of the temporary IDs and to register the object under its
final, program-unique ID.
A disadvantage of simple binary data streams (as opposed to saving properties in
ASCII files) is that a change in the serialization-layout (the order or number of bytes it
reads/writes to disk) of any of the serialized components will result in a corrupt file. In
order to prevent this problem without paying the high overhead for storing properties in
ASCII, AnWindows makes use of OLE compound files, which provide a complete re-
cursive filesystem within a file. The serialized state of each OCX is put into a separate
binary stream and subdirectories are used to handle the recursive nature of nested draw-
ings. If any of the streams becomes corrupt, it will not affect the restoration of the other
objects.
3.5 ActiveNode performance library
The ActiveNode performance library is another cornerstone of our agent-based
measurement system. ActiveNodes are examples of custom OCXs that either run stand-
alone or can be plugged into the AnWindows visual environment (Section 3.4). In addi-
tion, the ActiveNode performance library contains several other COM objects geared
towards building agent-based measurement systems. Figure 16 shows an example of a
conceptual measurement hierarchy built out of several ActiveNodes. Performance
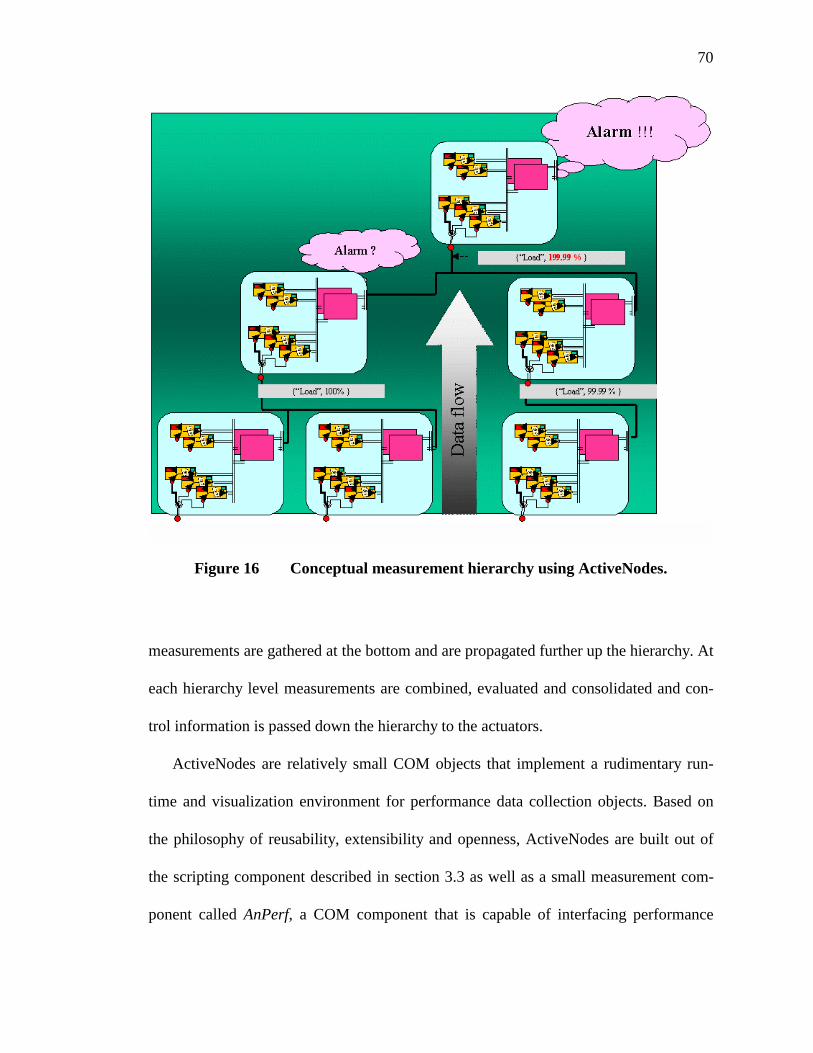
70
measurements are gathered at the bottom and are propagated further up the hierarchy. At
each hierarchy level measurements are combined, evaluated and consolidated and con-
trol information is passed down the hierarchy to the actuators.
ActiveNodes are relatively small COM objects that implement a rudimentary run-
time and visualization environment for performance data collection objects. Based on
the philosophy of reusability, extensibility and openness, ActiveNodes are built out of
the scripting component described in section 3.3 as well as a small measurement com-
ponent called AnPerf, a COM component that is capable of interfacing performance
Figure 16 Conceptual measurement hierarchy using ActiveNodes.
71
counters on a local or remote Windows NT machine. Each ActiveNode can run an
unlimited number of event-based scripts in parallel and can be used as a testbed for con-
current measurement- or programming tasks. In addition, each computer can host an
unlimited number of ActiveNodes and therefore can be used to simulate a larger than
physically existing number of measurement sites.
3.5.1 Agent-based performance measurements
Following the vision “It’s just another measurement” [41] small, domain specific
measurement-scripts are loaded into ActiveNodes, which can be distributed throughout
a network and are capable of executing short pieces of script code. ActiveNodes are
general-purpose enough to be used for all kinds of measurements such as measuring
CPU-/network load or measuring other real-world data. Due to their scriptability and
extensibility via OLE-plug-ins, ActiveNodes can be used as hosts for measurement
agents and can act like a virtual agent machine by providing a runtime environment for
one or more measurement agents.
A careful requirements analysis has shown that agents hosted in ActiveNodes do not
necessarily require mobility and built-in intelligence capability (e.g., reasoning and in-
ference). We believe that a highly adaptable agent architecture in conjunction with the
ability to add OLE-plug-ins (such as a KQML-based negotiation module [46] or a freely
available XML interpreter) to the agent-host is more versatile and can be used to im-
plement missing features found in other agent infrastructures. In contrast to other
research projects the ActiveNode architecture is designed to be a testbed for Distributed
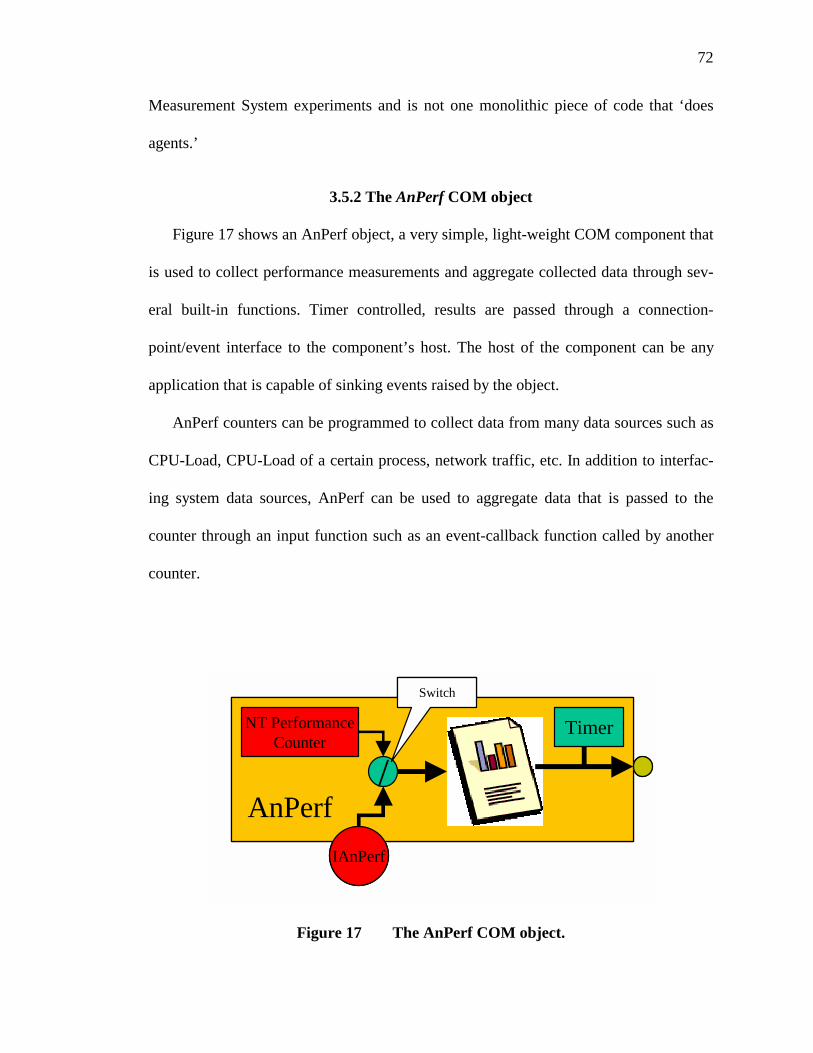
72
Measurement System experiments and is not one monolithic piece of code that ‘does
agents.’
3.5.2 The AnPerf COM object
Figure 17 shows an AnPerf object, a very simple, light-weight COM component that
is used to collect performance measurements and aggregate collected data through sev-
eral built-in functions. Timer controlled, results are passed through a connection-
point/event interface to the component’s host. The host of the component can be any
application that is capable of sinking events raised by the object.
AnPerf counters can be programmed to collect data from many data sources such as
CPU-Load, CPU-Load of a certain process, network traffic, etc. In addition to interfac-
ing system data sources, AnPerf can be used to aggregate data that is passed to the
counter through an input function such as an event-callback function called by another
counter.
S/
Switch
NT PerformanceCounter
IAnPerf
AnPerf
TimerS/
Switch
NT PerformanceCounter
IAnPerf
AnPerf
Timer
Figure 17 The AnPerf COM object.
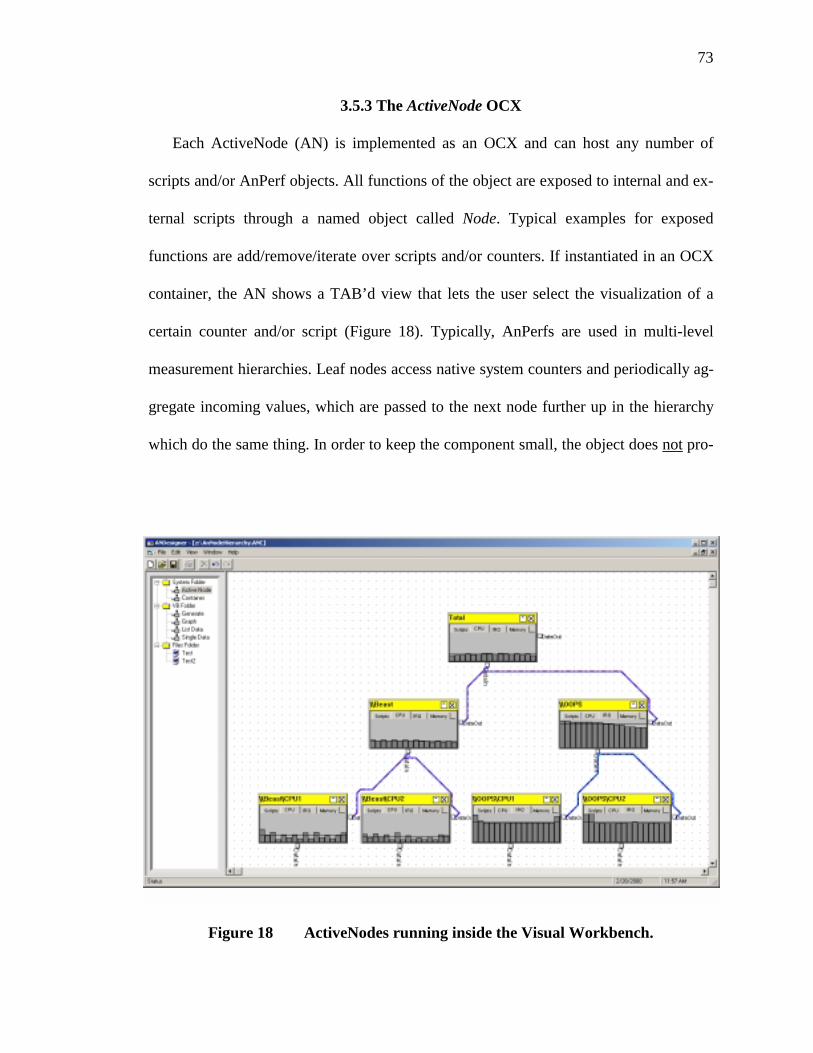
73
3.5.3 The ActiveNode OCX
Each ActiveNode (AN) is implemented as an OCX and can host any number of
scripts and/or AnPerf objects. All functions of the object are exposed to internal and ex-
ternal scripts through a named object called Node. Typical examples for exposed
functions are add/remove/iterate over scripts and/or counters. If instantiated in an OCX
container, the AN shows a TAB’d view that lets the user select the visualization of a
certain counter and/or script (Figure 18). Typically, AnPerfs are used in multi-level
measurement hierarchies. Leaf nodes access native system counters and periodically ag-
gregate incoming values, which are passed to the next node further up in the hierarchy
which do the same thing. In order to keep the component small, the object does not pro-
Figure 18 ActiveNodes running inside the Visual Workbench.
74
vide any kind of visualization- or user interface but provides a rich set of scriptable ac-
cess functions that allow users to customize and program the counter.
3.5.4 Hosting agents with ActiveNodes
ActiveNode OCXs are used as hosts for our measurement agents and can be used to
“agenti-fy” almost any type of COM application. Examples include instantiating the
OCX in a web-page that gives agents the possibility to roam the network allowing them
to monitor the behavior of a remote web browser, and to instantiate the OCX in Micro-
soft’s Windows 2000 Management Console (MMC) which allows the agent to perform
any type of administrative task (such as defragmenting the disk if a certain criterion is
met or increasing the bandwith of a web server if too many requests are currently
queued).
3.5.5 Using ActiveNodes in the Visual Workbench
Although ActiveNodes are quite flexible and can host any number of agent scripts,
they lack functionality to visually manipulate or clone themselves. This is where the
Visual workbench (see section 3.4 for details) comes into play. The workbench can be
used to seamlessly drag-and-drop scripts and/or ActiveNodes from a palette to the draw-
ing surface. Figure 18 shows seven instances of ActiveNodes running inside the Visual
Workbench. The four nodes at the bottom measure the CPU load of two dual-CPU multi
processor systems. Through the mechanisms described in section 3.4.4 the performance
data flows through wires to the nodes further up in the hierarchy which aggregate the
data collected by their child nodes. Each ActiveNode provides several different views
and either shows a histogram of the performance data or iconized scripts.
CHAPTER 4
EVALUATION
“Software agents combined with a visual programming envirnment will greatly sim-
plify the creation and evolution of Distributed Measurement and Control Systems.”
In order to show that our thesis statement is true, we had to combine our visual pro-
gramming workbench with our custom agent system and apply both to the distributed
measurement domain. The resulting system is used to visually monitor and control a set
of distributed applications that has to meet some quality of service (QOS) goal. The
combined system, called the Visual Agent Workbench is mostly written in Visual Basic,
a language that is ideal for rapid prototyping of COM-based applications.
We begin this chapter with anecdotal evidence where we describe some of our learn-
ing experiences while building the system. Section 4.2 deals with flexibility issues and
is based on the assumption that for a visual programming system to be successful, the
system has to be easily integratable into existing tools and application, has to provide an
easy way for creating components and has to have facilities to handle the problem of
visual clutter.
Since visually managing agents and distributed measurements is of no use if per-
formance is inadequate, we measure the performance of parts of the system and test the
scalability of the overall system in a distributed environment. Section 4.2.3 gives a de-
tailed description of the Publish/Subscribe software bus performance as this was
76
expected to be the most performance limiting factor of the system. Section 4.4 deals
with the scalability of the overall system in two different network environments.
4.1 Anecdotal evidence
The current implementation of the CWave 2000 dataflow toolkit is based on research
and development over the last four years. Our first prototype of CWave was built in
C++ and provided capabilities to load component libraries at design and runtime. Simi-
lar to SCIRun [6], a dataflow visualization environment developed at the University of
Utah, components had to be written (or wrapped) in C++ by deriving from a common
base class. Unlike SCIRun, our first CWave prototype provided zooming capabilities as
well as static faceplates (bitmaps or vector graphics) to hide complexity of subgroups of
components. The flexibility and extensibility of CWave was successfully demonstrated
several times and used as the basis for several system management products at Hewlett
Packard Labs.
With the availability of COM and DCOM we completely re-implemented our sys-
tem. Instead of requiring component writers to be experts in C++ and to understand the
class hierarchy of a visual dataflow system, we provided a way to leverage components
written according to the OCX component standard. Our new technology in conjunction
with the availability of commercially available compilers, code wizards and develop-
ment tools allows even a novice programmer to develop custom components in minutes
and relieves component writers from the burden of writing and understanding dataflow
compatible code. The current implementation uses a Publish/Subscribe software bus,
originally developed as a communications medium for a research project at HP-Labs.
77
Our software bus comes in several flavors. It can run as a local bus (only trusted objects
can get access to the bus) or as a global bus (everyone with valid NT access permissions
can retrieve a pointer to the bus). In contrast to many shared memory dataflow imple-
mentations of visual programming systems, our bus is designed to support cross-
machine communications and is capable of broadcasting objects by value or by refer-
ence. Comparing the first generation of CWave with the current implementation on a
higher level is quite interesting and reflects current trends in state-of-the-art software
design. Instead of one monolithic (but quite powerful) dataflow-, visualization- and de-
velopment environment we have componentized everything. Progress has been made in
other parts of the system as well. In the first implementation of the agent system, agents
were implemented primarily in scripting language and agent scripts tended to be very
long. For the second implementation we factored out common behavior and functional-
ity and the average agent script shrunk to about 50-100 lines of very simple glue code.
4.2 Flexibility
According to our thesis, a successful agent system requires a flexible visual pro-
gramming environment in order to deal with management issues of a large-scale
distributed measurement system. Key points are the integration of this programming en-
vironment with existing operating systems and management tools and the ability to
create components easily.
4.2.1 Integration
Experiences with our system showed that an OCX-based programming environment
with optional scripting support provides the ultimate level of integration with existing
78
tools in a Microsoft Windows environment. The consistent use of Microsoft’s COM
technology in conjunction with self-descriptive interfaces allows users to customize fea-
tures of the system via simple scripts. The modularized implementation of the system
allowed us to call our research project a visual dataflow toolkit. Similar to a box of
LEGOTM bricks, users can build their favorite visual design application by plugging
building blocks together and use any COM enabled language to write a thin layer of
glue code. Our visual design environment component is centered around the idea of
wrapping custom written or preexisting OCXs. It should not be a surprise to the reader
that the design environment itself is an OCX, which can be embedded in itself or in a
wide variety of OCX containers such as Microsoft’s Management Console or Visual
Basic.
4.2.2 Authoring of components
Even the best-integrated programming system will not be successful if a user of av-
erage skill cannot create components easily. Visual programming requires fairly high-
level components in order to avoid visual clutter problems. Unfortunately, ‘high-level
components’ also implies problem specific and reduced reusability, which in return em-
phasizes the need to create components more easily. Our visual programming
workbench explores a novel way of creating components. Components in our system
conform to the OCX standard and can be created in almost any programming language.
As an example, Table 4 shows nine steps to create two OCXs in Viusal Basic, which
will be used to build a visual dataflow application in the CWave 2000 environment.
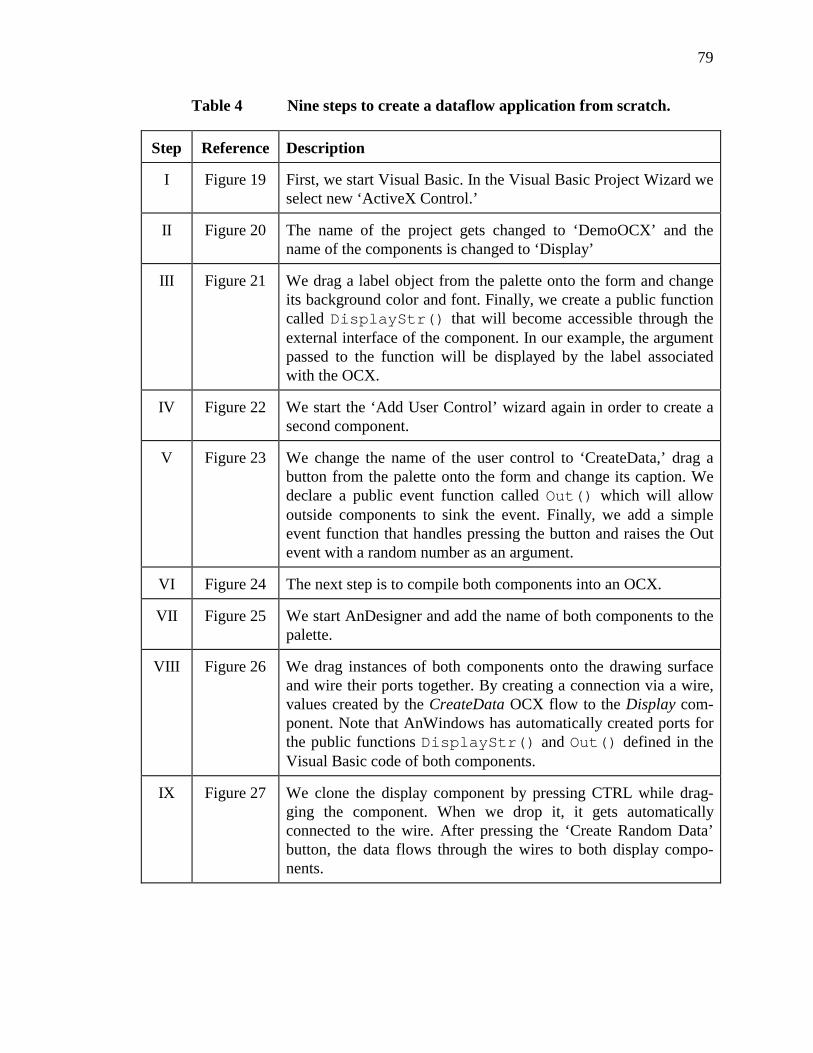
79
Table 4 Nine steps to create a dataflow application from scratch.
Step Reference Description
I Figure 19 First, we start Visual Basic. In the Visual Basic Project Wizard we select new ‘ActiveX Control.’
II Figure 20 The name of the project gets changed to ‘DemoOCX’ and the name of the components is changed to ‘Display’
III Figure 21 We drag a label object from the palette onto the form and change its background color and font. Finally, we create a public function called DisplayStr() that will become accessible through the external interface of the component. In our example, the argument passed to the function will be displayed by the label associated with the OCX.
IV Figure 22 We start the ‘Add User Control’ wizard again in order to create a second component.
V Figure 23 We change the name of the user control to ‘CreateData,’ drag a button from the palette onto the form and change its caption. We declare a public event function called Out() which will allow outside components to sink the event. Finally, we add a simple event function that handles pressing the button and raises the Out event with a random number as an argument.
VI Figure 24 The next step is to compile both components into an OCX.
VII Figure 25 We start AnDesigner and add the name of both components to the palette.
VIII Figure 26 We drag instances of both components onto the drawing surface and wire their ports together. By creating a connection via a wire, values created by the CreateData OCX flow to the Display com-ponent. Note that AnWindows has automatically created ports for the public functions DisplayStr() and Out() defined in the Visual Basic code of both components.
IX Figure 27 We clone the display component by pressing CTRL while drag-ging the component. When we drop it, it gets automatically connected to the wire. After pressing the ‘Create Random Data’ button, the data flows through the wires to both display compo-nents.
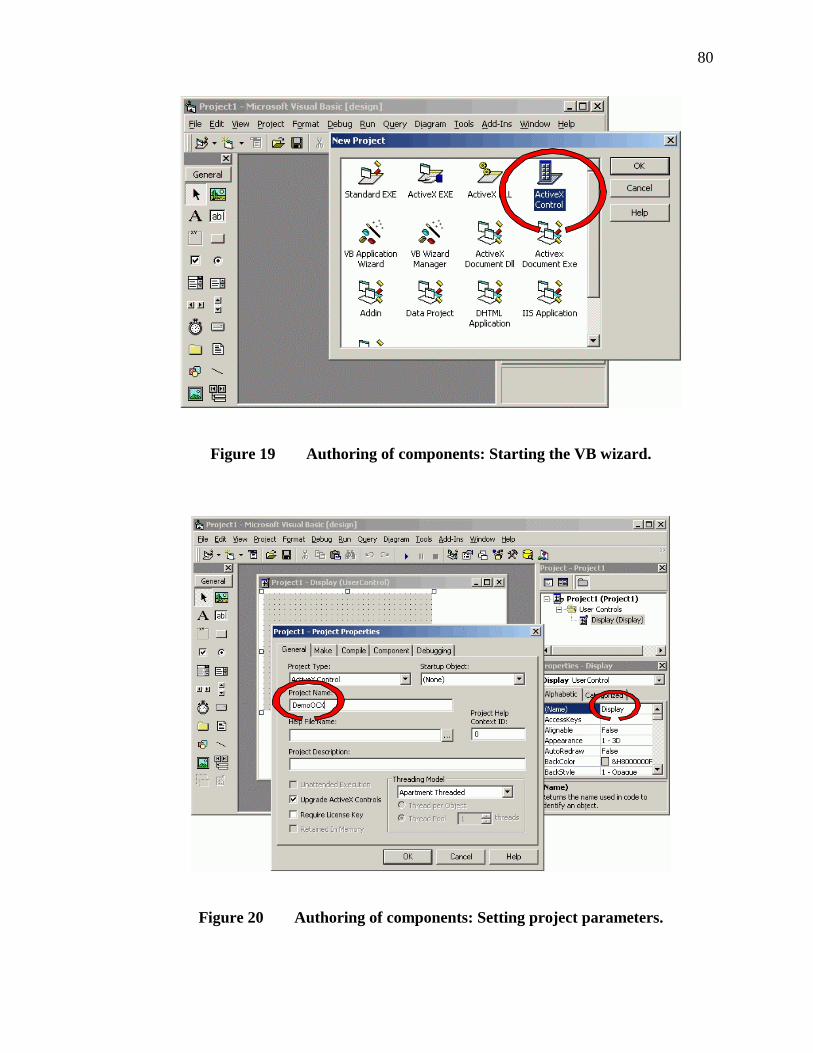
80
Figure 19 Authoring of components: Starting the VB wizard.
Figure 20 Authoring of components: Setting project parameters.
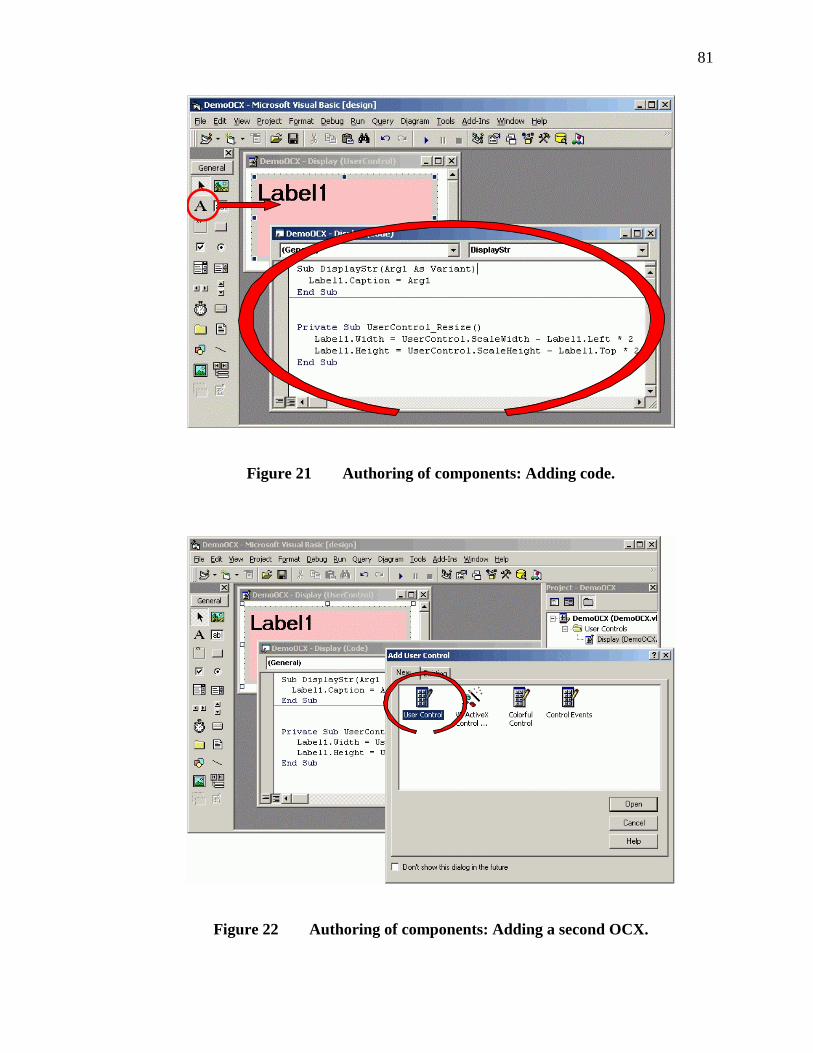
81
Figure 21 Authoring of components: Adding code.
Figure 22 Authoring of components: Adding a second OCX.
82
Figure 23 Authoring of components: Writing more code.
Figure 24 Authoring of components: Compilation of both OCXs.
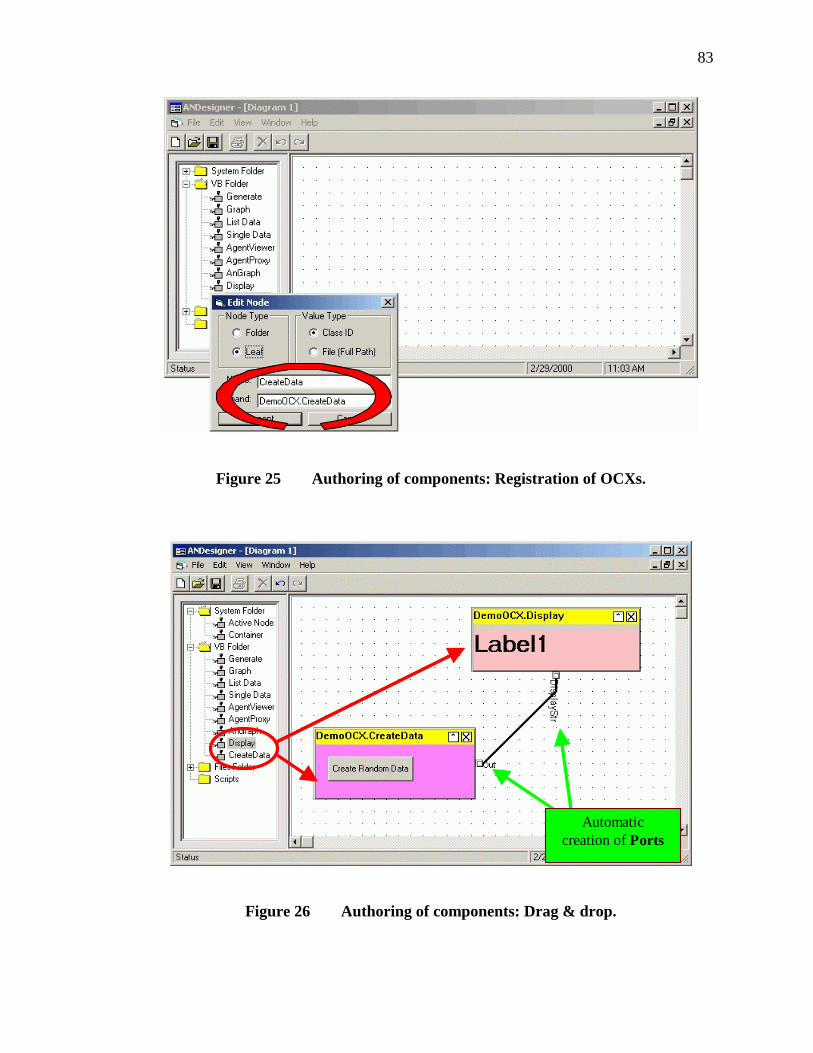
83
Figure 25 Authoring of components: Registration of OCXs.
Automatic creation of Ports
Figure 26 Authoring of components: Drag & drop.
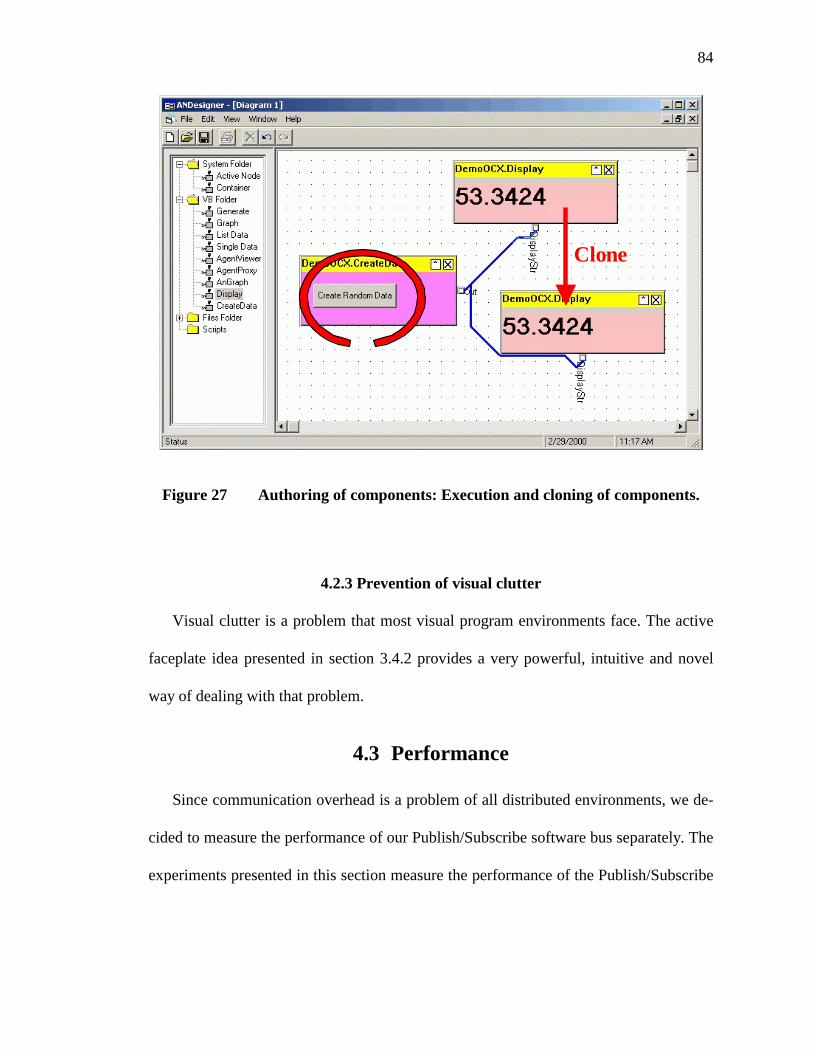
84
Clone
Figure 27 Authoring of components: Execution and cloning of components.
4.2.3 Prevention of visual clutter
Visual clutter is a problem that most visual program environments face. The active
faceplate idea presented in section 3.4.2 provides a very powerful, intuitive and novel
way of dealing with that problem.
4.3 Performance
Since communication overhead is a problem of all distributed environments, we de-
cided to measure the performance of our Publish/Subscribe software bus separately. The
experiments presented in this section measure the performance of the Publish/Subscribe
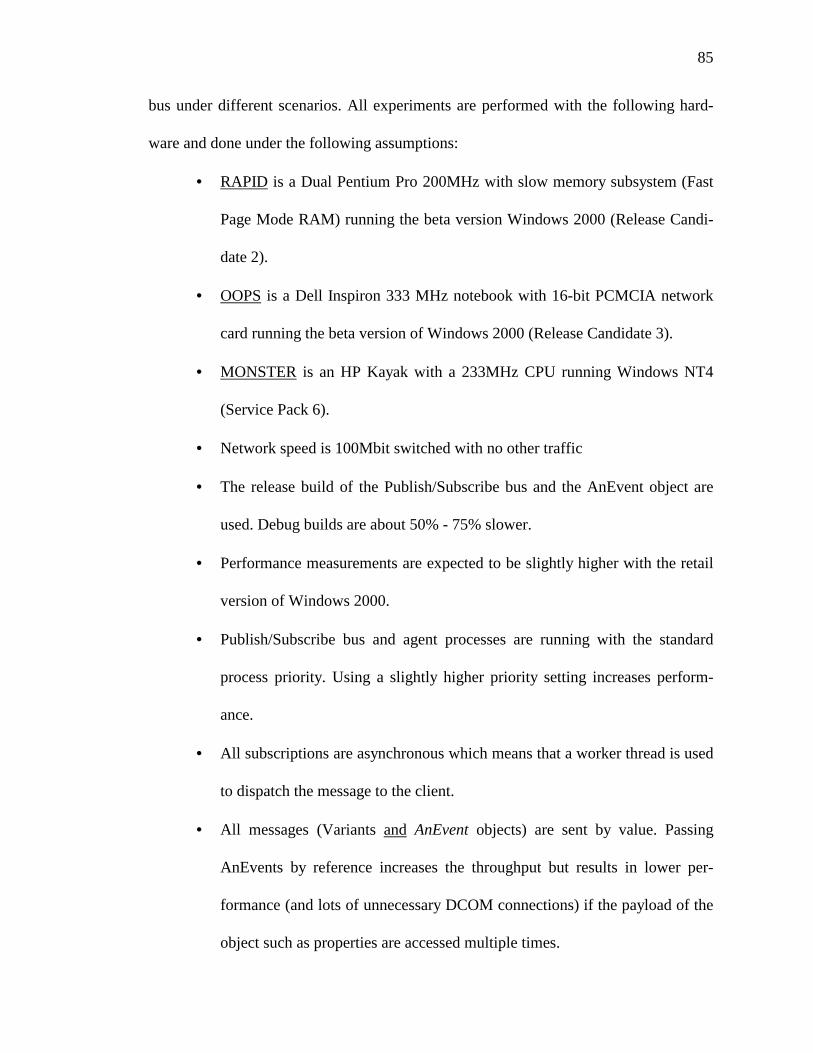
85
bus under different scenarios. All experiments are performed with the following hard-
ware and done under the following assumptions:
• RAPID is a Dual Pentium Pro 200MHz with slow memory subsystem (Fast
Page Mode RAM) running the beta version Windows 2000 (Release Candi-
date 2).
• OOPS is a Dell Inspiron 333 MHz notebook with 16-bit PCMCIA network
card running the beta version of Windows 2000 (Release Candidate 3).
• MONSTER is an HP Kayak with a 233MHz CPU running Windows NT4
(Service Pack 6).
• Network speed is 100Mbit switched with no other traffic
• The release build of the Publish/Subscribe bus and the AnEvent object are
used. Debug builds are about 50% - 75% slower.
• Performance measurements are expected to be slightly higher with the retail
version of Windows 2000.
• Publish/Subscribe bus and agent processes are running with the standard
process priority. Using a slightly higher priority setting increases perform-
ance.
• All subscriptions are asynchronous which means that a worker thread is used
to dispatch the message to the client.
• All messages (Variants and AnEvent objects) are sent by value. Passing
AnEvents by reference increases the throughput but results in lower per-
formance (and lots of unnecessary DCOM connections) if the payload of the
object such as properties are accessed multiple times.
86
The purpose of the following measurements is to determine the maximum through-
put of the Publish/Subscribe bus under various scenarios. All measurements are
performed using the global (out-of-process) bus. Each experiment is run twice. The first
time 64000 Variants12 are sent across the bus. Figure 28 shows the throughput of pub-
lishing 64000 AnEvent objects (see section 3.2.6 for details). The X-axis shows time
with the most recent measurement to the left (the chart scrolls to the right). The Y-axis
shows throughput of the bus (number of messages per second).
4.3.1 Message send/delivery on same machine
Figure 28 and Figure 29 show the throughput of the bus with sender and receiver
running on the same machine as the bus. Sending variants is significantly more efficient
(2200 Msg/sec versus 1600 Msg/sec) but does not provide the flexibility and self-
descriptiveness of publishing AnEvent objects. Figure 28 shows that each message sent
to the bus (blue/dark graph) gets immediately sent out again (pink/gray graph) while in
Figure 29 sending messages out of the bus (pink/gray graph) lags slightly behind (ini-
tially more messages are sent to the bus, are buffered by the bus and dispatched after the
sender is done).
In order to establish a baseline for experiments that involve multiple machines, we
have included the two measurements shown in Figure 30 and Figure 31. Other than run-
ning on different hardware, all parameters are the same as in the previous experiment.
Note that the throughput in both charts is higher which is most likely caused by a faster
CPU speed.
12 Variants are a multi purpose datatype that can be used to store any scalar datatype as well as objects.
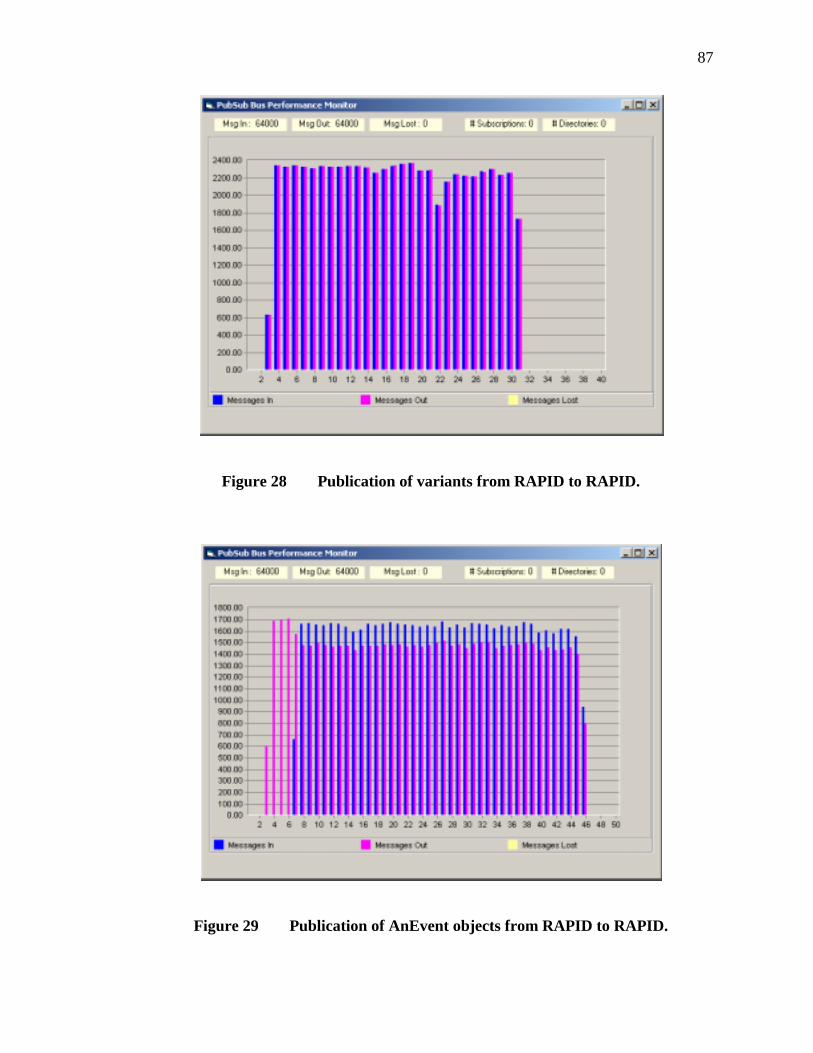
87
Figure 28 Publication of variants from RAPID to RAPID.
Figure 29 Publication of AnEvent objects from RAPID to RAPID.
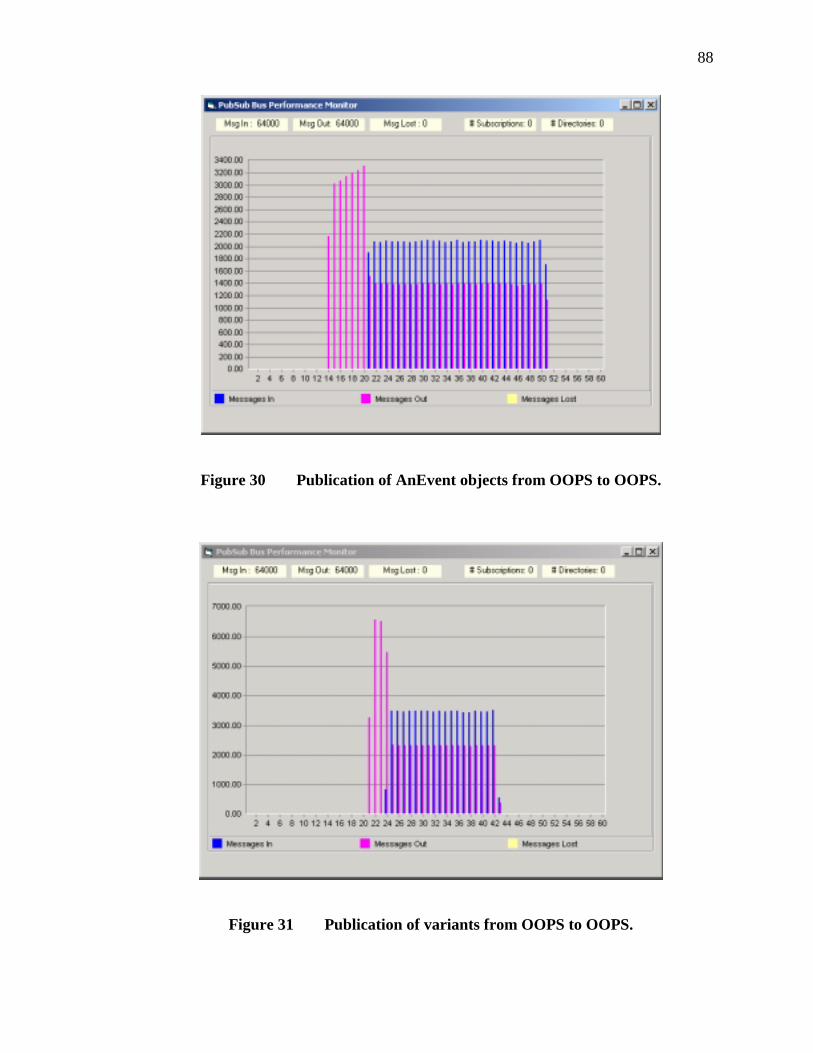
88
Figure 30 Publication of AnEvent objects from OOPS to OOPS.
Figure 31 Publication of variants from OOPS to OOPS.
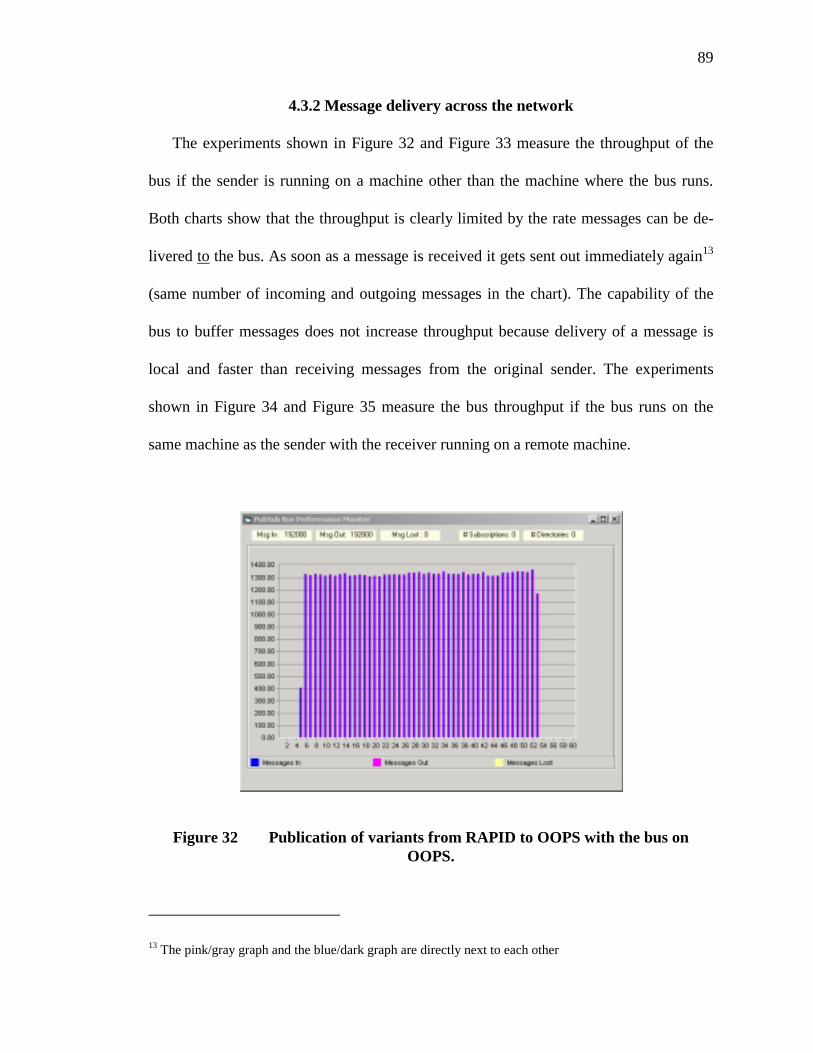
89
4.3.2 Message delivery across the network
The experiments shown in Figure 32 and Figure 33 measure the throughput of the
bus if the sender is running on a machine other than the machine where the bus runs.
Both charts show that the throughput is clearly limited by the rate messages can be de-
livered to the bus. As soon as a message is received it gets sent out immediately again13
(same number of incoming and outgoing messages in the chart). The capability of the
bus to buffer messages does not increase throughput because delivery of a message is
local and faster than receiving messages from the original sender. The experiments
shown in Figure 34 and Figure 35 measure the bus throughput if the bus runs on the
same machine as the sender with the receiver running on a remote machine.
Figure 32 Publication of variants from RAPID to OOPS with the bus on OOPS.
13 The pink/gray graph and the blue/dark graph are directly next to each other
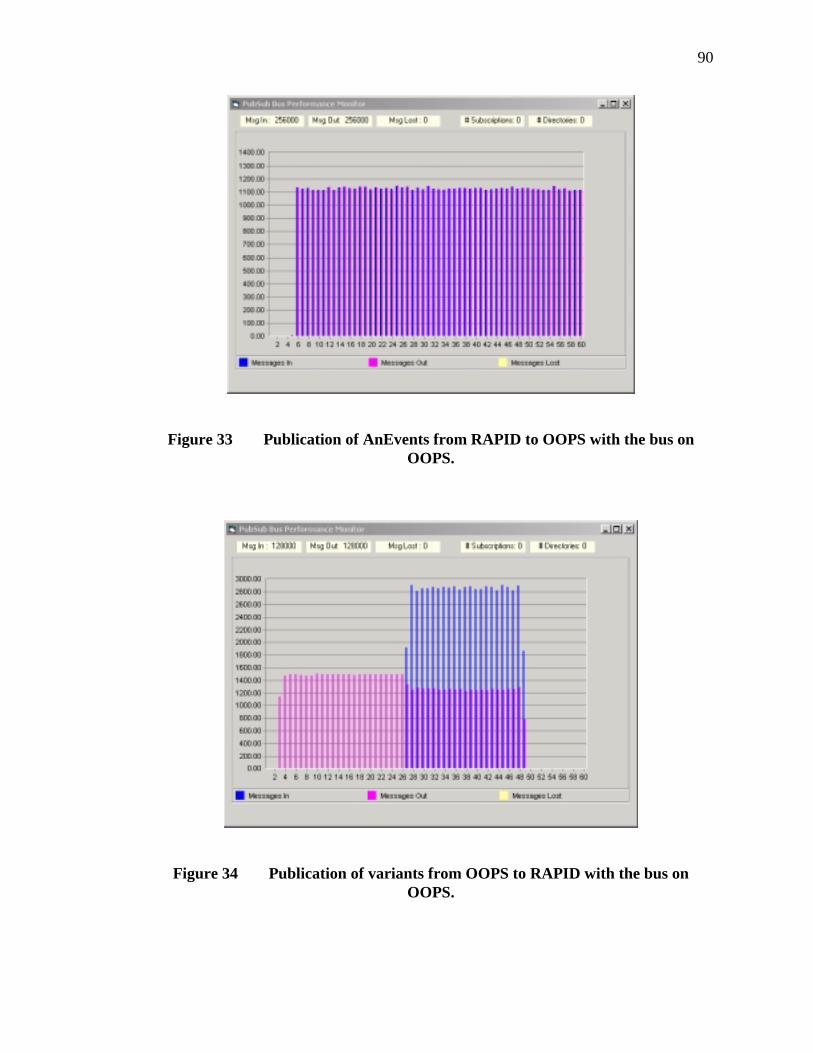
90
Figure 33 Publication of AnEvents from RAPID to OOPS with the bus on OOPS.
Figure 34 Publication of variants from OOPS to RAPID with the bus on OOPS.
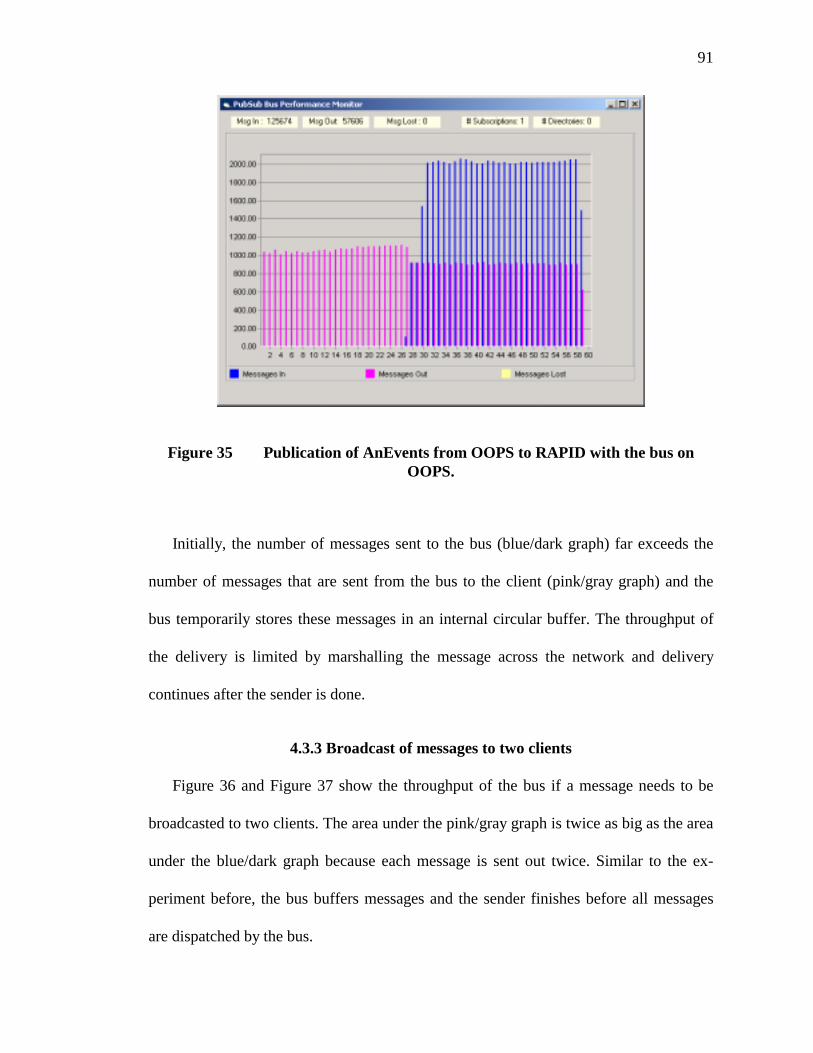
91
Figure 35 Publication of AnEvents from OOPS to RAPID with the bus on OOPS.
Initially, the number of messages sent to the bus (blue/dark graph) far exceeds the
number of messages that are sent from the bus to the client (pink/gray graph) and the
bus temporarily stores these messages in an internal circular buffer. The throughput of
the delivery is limited by marshalling the message across the network and delivery
continues after the sender is done.
4.3.3 Broadcast of messages to two clients
Figure 36 and Figure 37 show the throughput of the bus if a message needs to be
broadcasted to two clients. The area under the pink/gray graph is twice as big as the area
under the blue/dark graph because each message is sent out twice. Similar to the ex-
periment before, the bus buffers messages and the sender finishes before all messages
are dispatched by the bus.
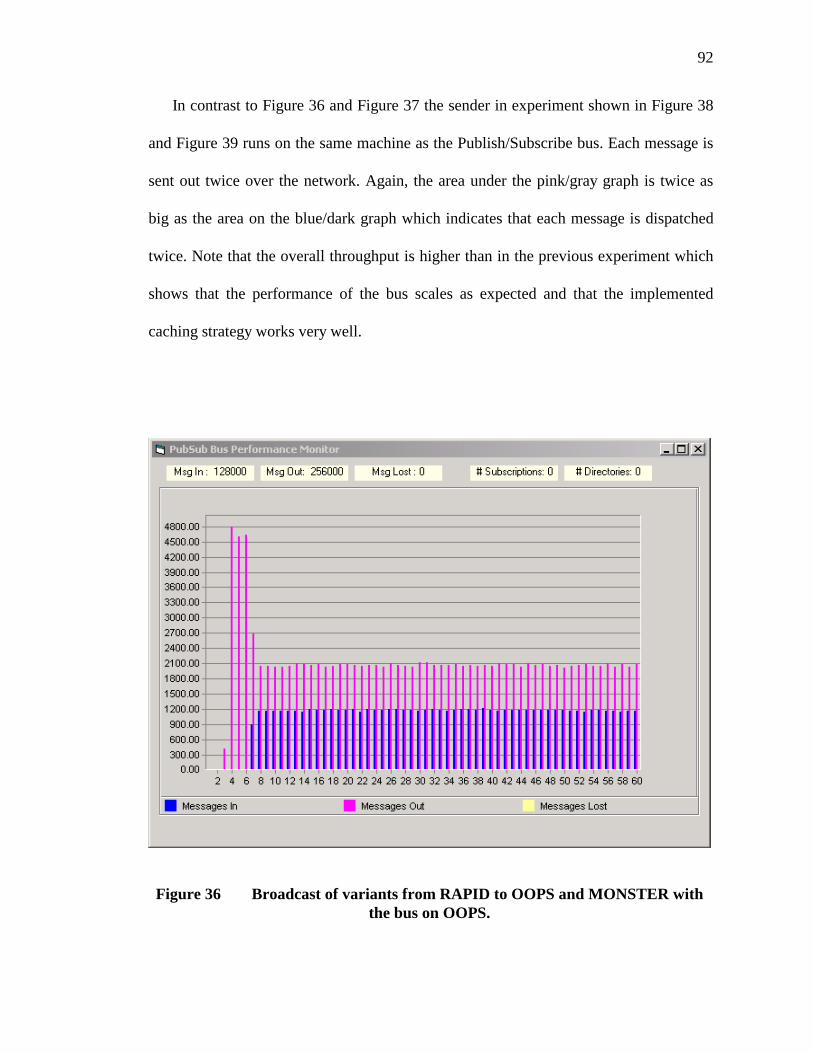
92
In contrast to Figure 36 and Figure 37 the sender in experiment shown in Figure 38
and Figure 39 runs on the same machine as the Publish/Subscribe bus. Each message is
sent out twice over the network. Again, the area under the pink/gray graph is twice as
big as the area on the blue/dark graph which indicates that each message is dispatched
twice. Note that the overall throughput is higher than in the previous experiment which
shows that the performance of the bus scales as expected and that the implemented
caching strategy works very well.
Figure 36 Broadcast of variants from RAPID to OOPS and MONSTER with the bus on OOPS.
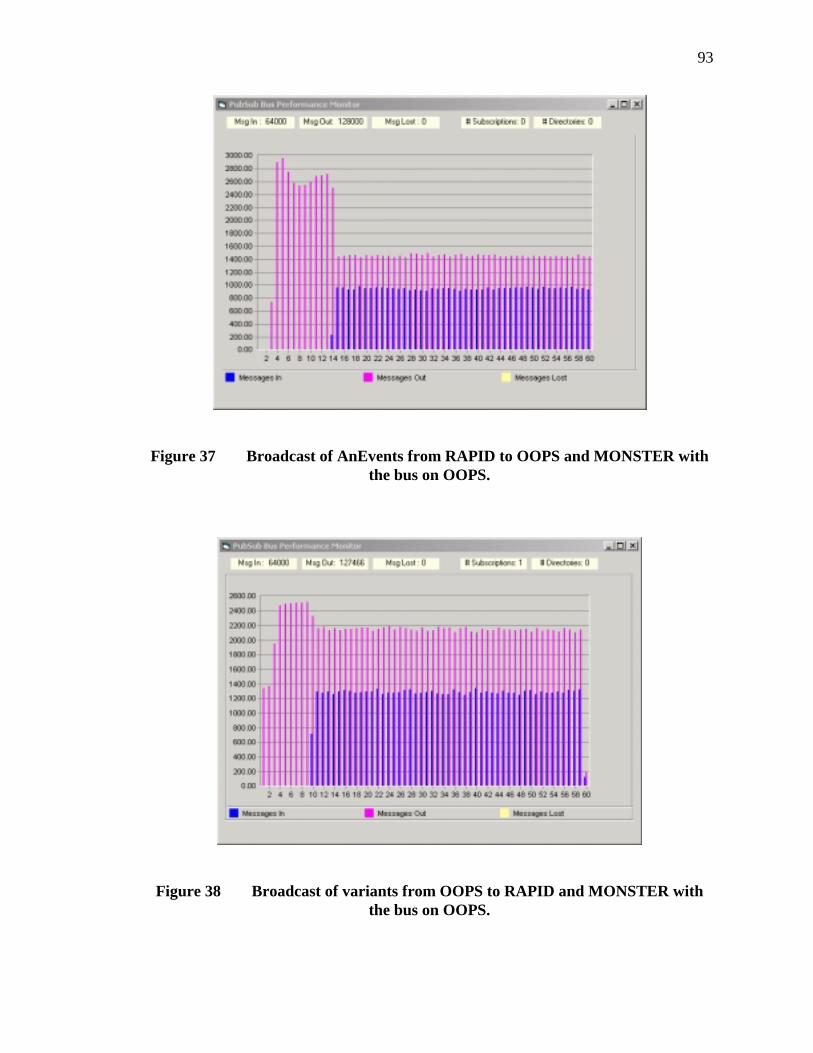
93
Figure 37 Broadcast of AnEvents from RAPID to OOPS and MONSTER with the bus on OOPS.
Figure 38 Broadcast of variants from OOPS to RAPID and MONSTER with the bus on OOPS.
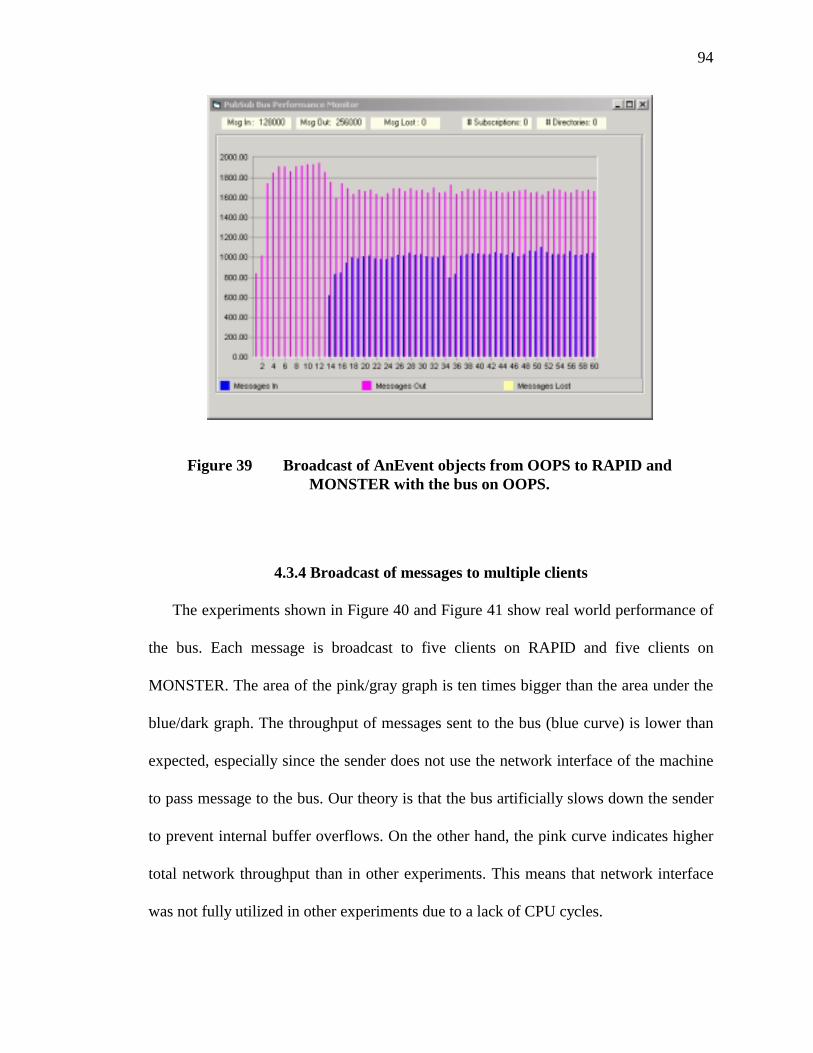
94
Figure 39 Broadcast of AnEvent objects from OOPS to RAPID and MONSTER with the bus on OOPS.
4.3.4 Broadcast of messages to multiple clients
The experiments shown in Figure 40 and Figure 41 show real world performance of
the bus. Each message is broadcast to five clients on RAPID and five clients on
MONSTER. The area of the pink/gray graph is ten times bigger than the area under the
blue/dark graph. The throughput of messages sent to the bus (blue curve) is lower than
expected, especially since the sender does not use the network interface of the machine
to pass message to the bus. Our theory is that the bus artificially slows down the sender
to prevent internal buffer overflows. On the other hand, the pink curve indicates higher
total network throughput than in other experiments. This means that network interface
was not fully utilized in other experiments due to a lack of CPU cycles.
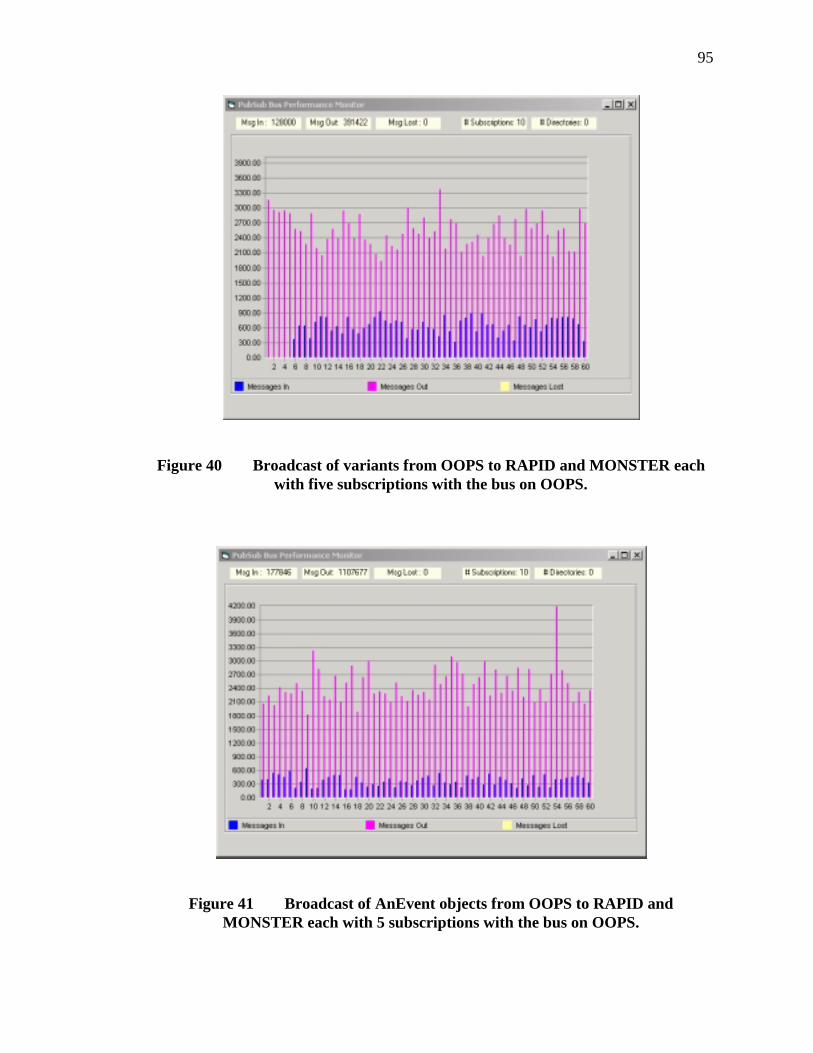
95
Figure 40 Broadcast of variants from OOPS to RAPID and MONSTER each with five subscriptions with the bus on OOPS.
Figure 41 Broadcast of AnEvent objects from OOPS to RAPID and MONSTER each with 5 subscriptions with the bus on OOPS.
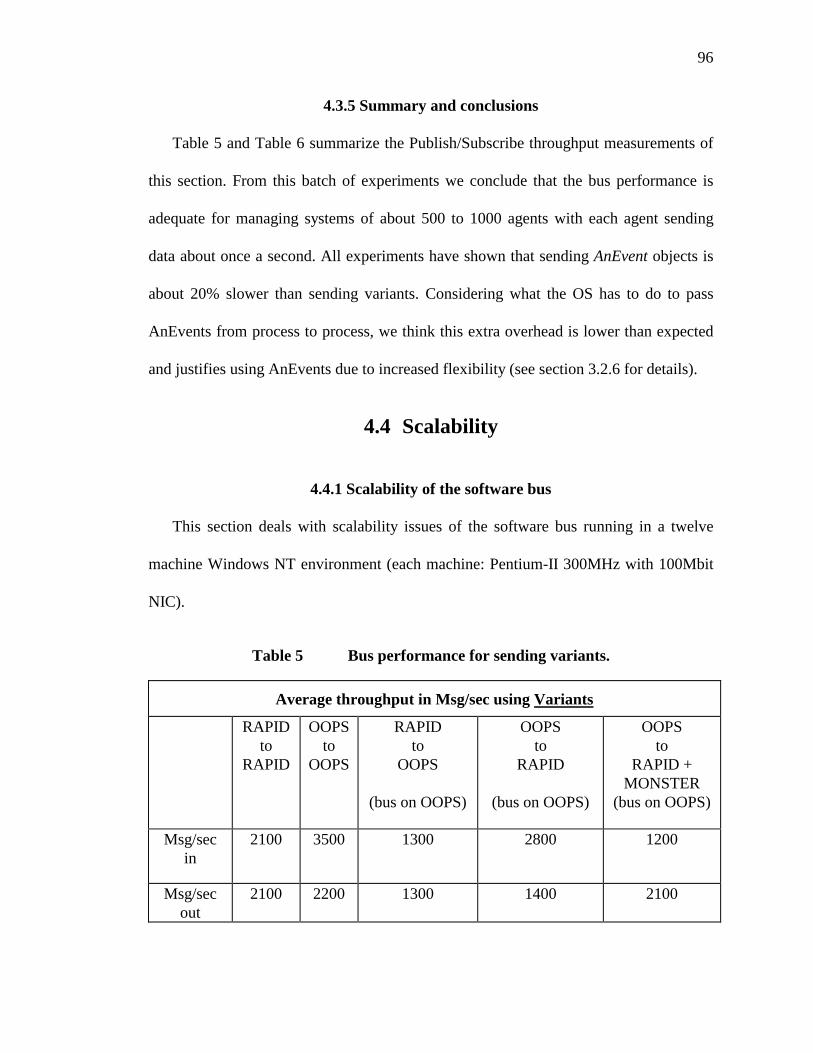
96
4.3.5 Summary and conclusions
Table 5 and Table 6 summarize the Publish/Subscribe throughput measurements of
this section. From this batch of experiments we conclude that the bus performance is
adequate for managing systems of about 500 to 1000 agents with each agent sending
data about once a second. All experiments have shown that sending AnEvent objects is
about 20% slower than sending variants. Considering what the OS has to do to pass
AnEvents from process to process, we think this extra overhead is lower than expected
and justifies using AnEvents due to increased flexibility (see section 3.2.6 for details).
4.4 Scalability
4.4.1 Scalability of the software bus
This section deals with scalability issues of the software bus running in a twelve
machine Windows NT environment (each machine: Pentium-II 300MHz with 100Mbit
NIC).
Table 5 Bus performance for sending variants.
Average throughput in Msg/sec using Variants
RAPID to
RAPID
OOPS to
OOPS
RAPID to
OOPS
(bus on OOPS)
OOPS to
RAPID
(bus on OOPS)
OOPS to
RAPID + MONSTER
(bus on OOPS)
Msg/sec in
2100 3500 1300 2800 1200
Msg/sec out
2100 2200 1300 1400 2100
97
Table 6 Bus performance for sending AnEvent objects. 14
Average throughput in Msg/sec using AnEvents
RAPID to
RAPID
OOPS to
OOPS
RAPID to
OOPS
(bus on OOPS)
OOPS to
RAPID
(bus on OOPS)
OOPS to
RAPID + MONSTER
(bus on OOPS)
Msg/sec in
1600 2100 1100 2000 1000
Msg/sec out
1500 1700 1100 1000 1800
Figure 42 shows the result of an experiment that tests the throughput of the bus de-
livering messages to one remote machine. The average throughput is similar to Figure
29 (same test in a different network environment). The experiment shown in Figure 43
tests the throughput of the bus of one machine sending messages to two other machines.
Ideally, the area under the pink/gray graph should be twice as large as the area under the
blue/gray graph because each message received by the bus is sent out twice. Figures 44
to 46 show the throughput of the bus delivering messages to four, eight and ten clients.
All experiments show, that four, eight and ten times as many messages are dispatched
by the bus. Figure 47 shows the same as Figure 46 but uses variants instead of AnEvent
objects. As concluded in section 4.3.5, sending variants across the network is about 20%
faster. The next set of experiments tests the bus if multiple data sources send messages
to one client. Figures 48 to 51 show the results of two, four, eight and ten machines
sending messages to one receiver. Tables 7 and 8 summarize the results of this section.
14 Note that If a message is sent to n clients, the delivery of the message will be counted n times.
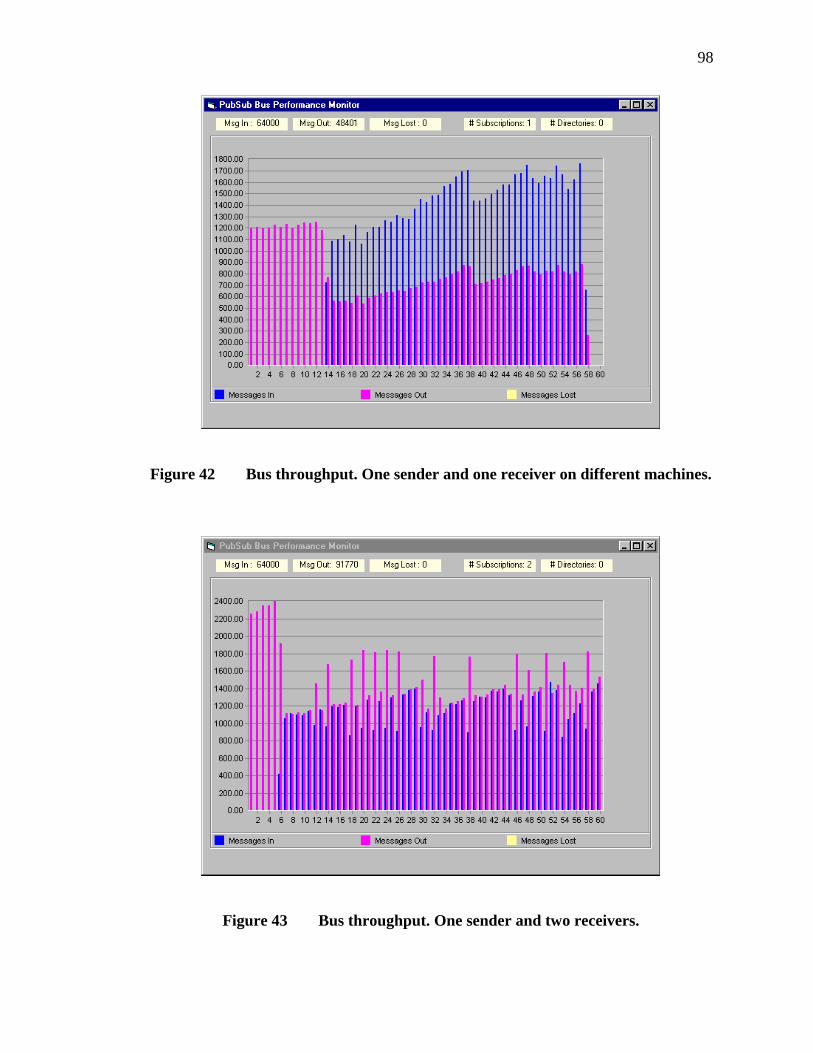
98
Figure 42 Bus throughput. One sender and one receiver on different machines.
Figure 43 Bus throughput. One sender and two receivers.
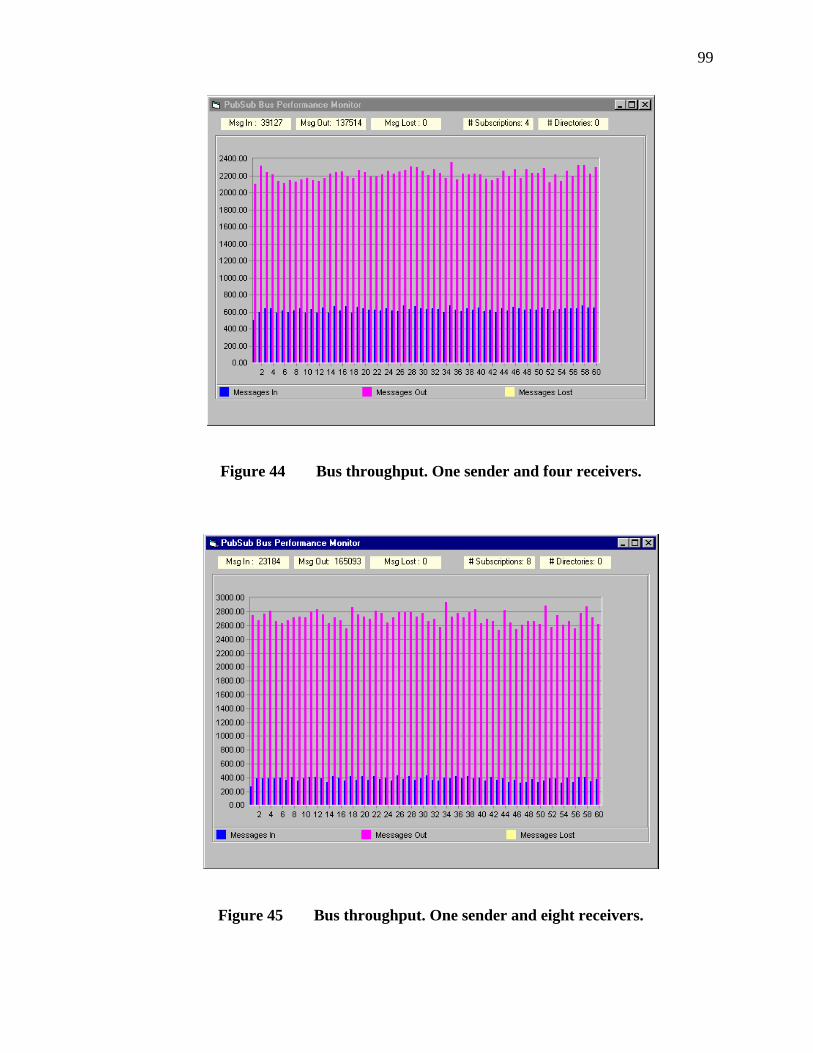
99
Figure 44 Bus throughput. One sender and four receivers.
Figure 45 Bus throughput. One sender and eight receivers.
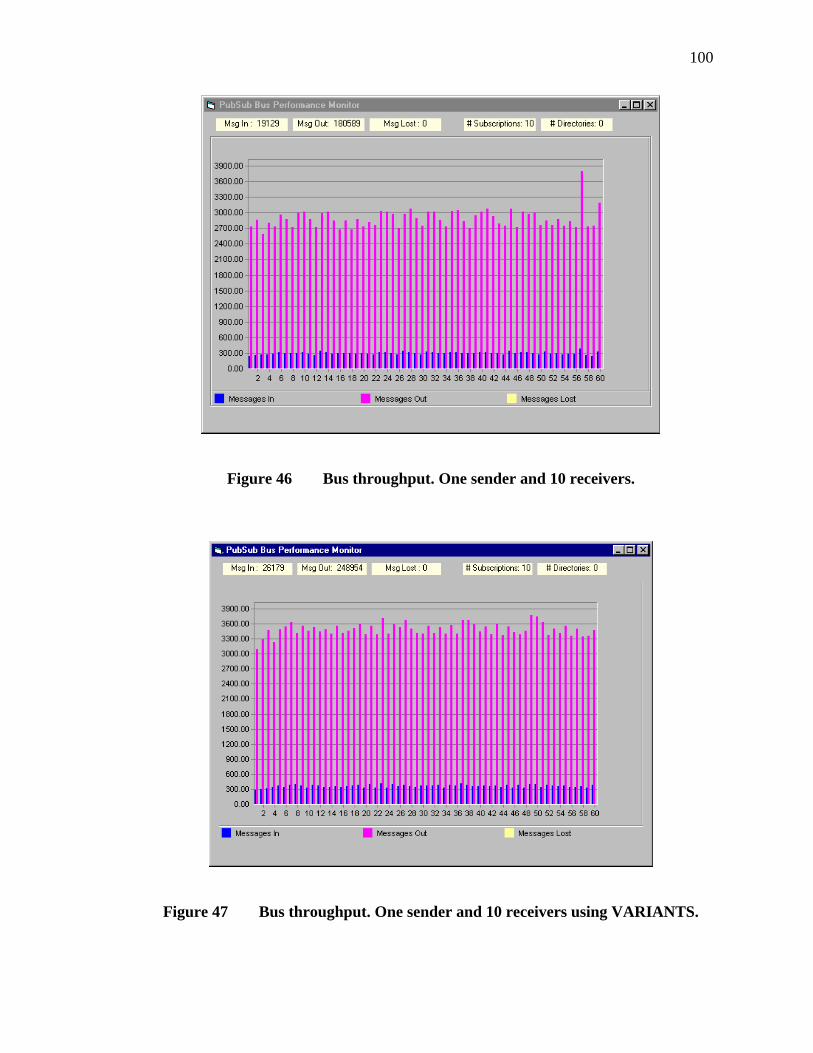
100
Figure 46 Bus throughput. One sender and 10 receivers.
Figure 47 Bus throughput. One sender and 10 receivers using VARIANTS.

101
Figure 48 Bus throughput. Two senders and one receiver.
Figure 49 Bus throughput. Four senders and one receiver.
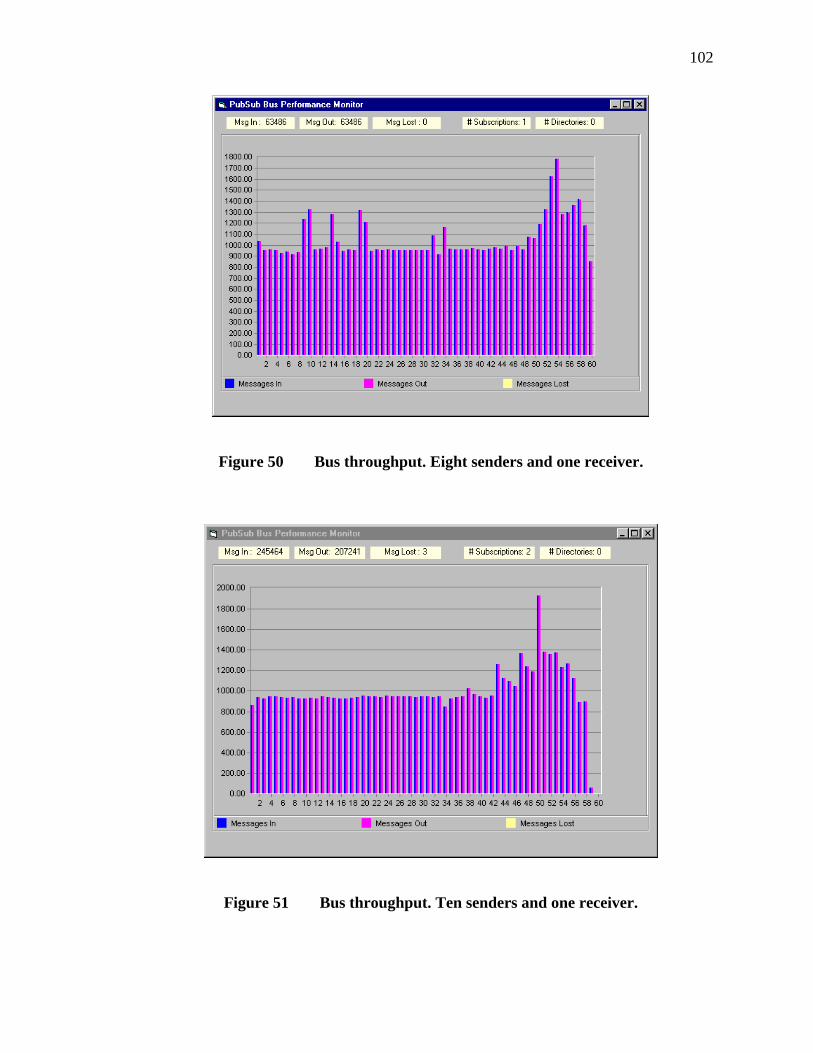
102
Figure 50 Bus throughput. Eight senders and one receiver.
Figure 51 Bus throughput. Ten senders and one receiver.
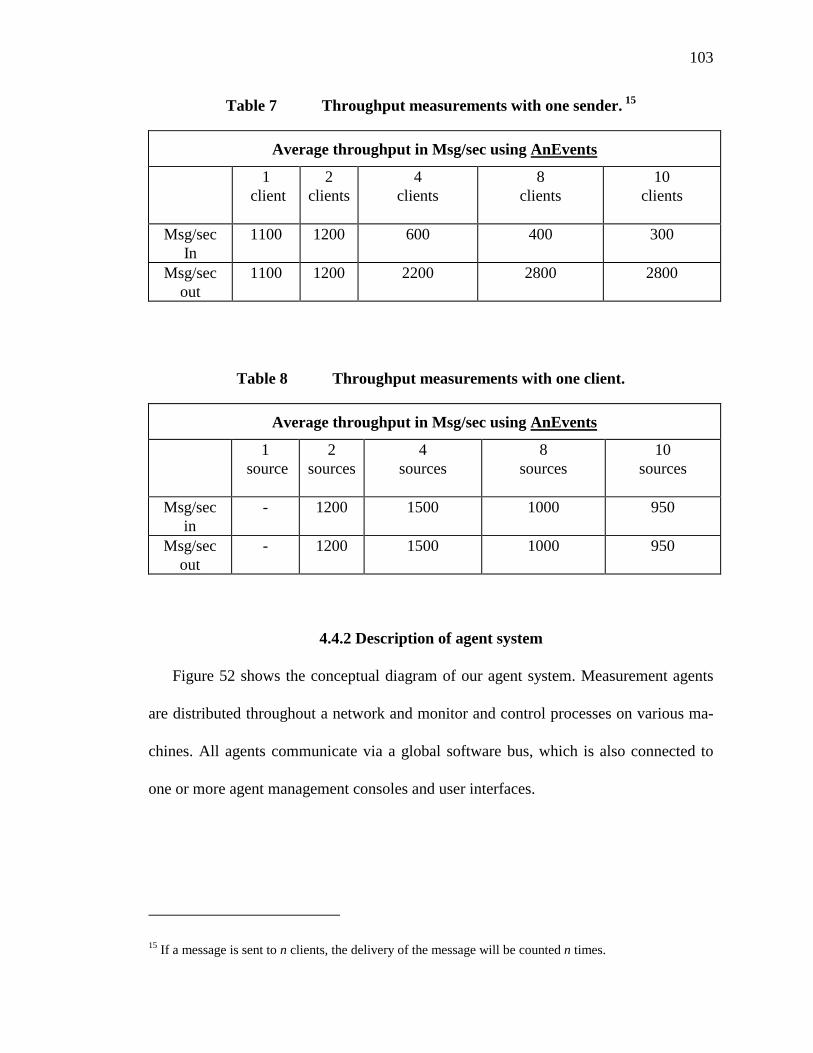
103
Table 7 Throughput measurements with one sender. 15
Average throughput in Msg/sec using AnEvents
1 client
2 clients
4 clients
8 clients
10 clients
Msg/sec In
1100 1200 600 400 300
Msg/sec out
1100 1200 2200 2800 2800
Table 8 Throughput measurements with one client.
Average throughput in Msg/sec using AnEvents
1 source
2 sources
4 sources
8 sources
10 sources
Msg/sec in
- 1200 1500 1000 950
Msg/sec out
- 1200 1500 1000 950
4.4.2 Description of agent system
Figure 52 shows the conceptual diagram of our agent system. Measurement agents
are distributed throughout a network and monitor and control processes on various ma-
chines. All agents communicate via a global software bus, which is also connected to
one or more agent management consoles and user interfaces.
15 If a message is sent to n clients, the delivery of the message will be counted n times.
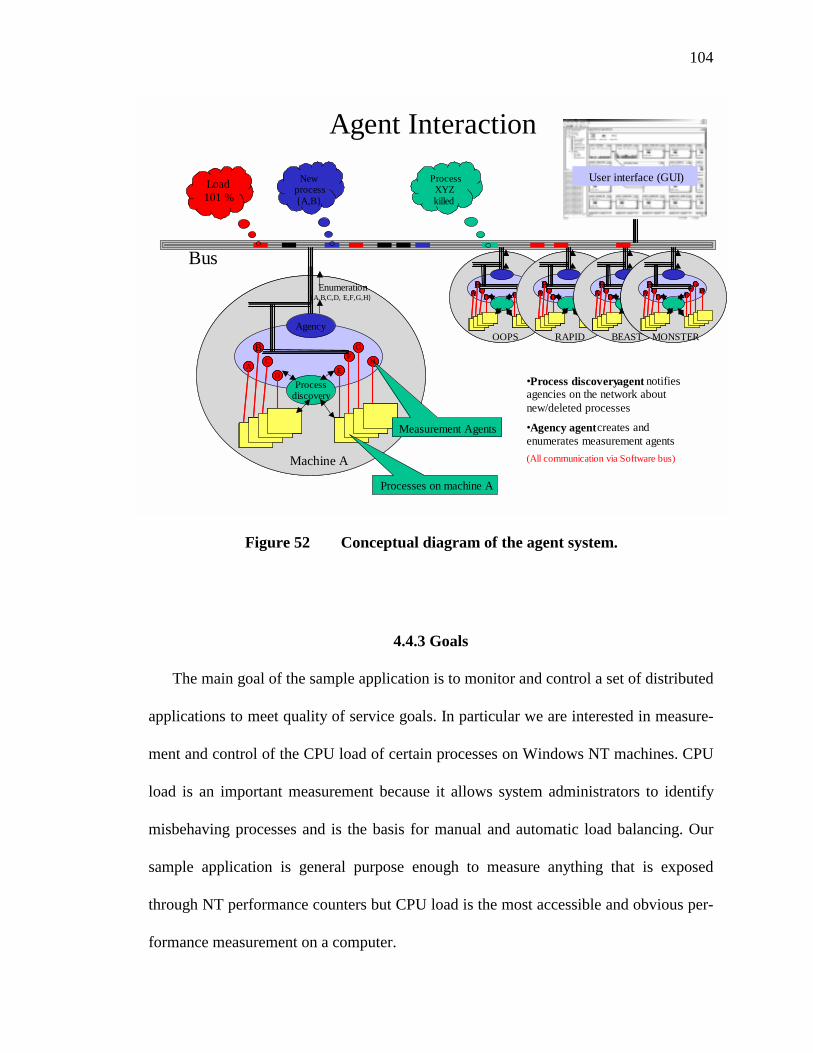
104
4.4.3 Goals
The main goal of the sample application is to monitor and control a set of distributed
applications to meet quality of service goals. In particular we are interested in measure-
ment and control of the CPU load of certain processes on Windows NT machines. CPU
load is an important measurement because it allows system administrators to identify
misbehaving processes and is the basis for manual and automatic load balancing. Our
sample application is general purpose enough to measure anything that is exposed
through NT performance counters but CPU load is the most accessible and obvious per-
formance measurement on a computer.
Agent Interaction
A B
C D
H
GF
E
Agency
Enumeration{A,B,C,D, E,F,G,H}
Machine A
Process discovery
A B
C D A
B C
D H
GF
EH
GF
E
Agency
Enumeration{A,B,C,D, E,F,G,H}
Machine A
Process discovery
AB
CD
HGF
EAB
CDA
BC
DH
GFE H
GFE A
BC
DH G F
E AB
CDA
BC
DH G F
E H G F E
Measurement Agents
Processes on machine A
A B C
D HG F
E A B C
D A B C
D HG F
E HG F
E A B CD
HGF
EA B CDA B
CD
HGF
E HGF
E
OOPS RAPID BEAST MONSTER
Load 101 %
New process {A,B}
Process XYZ killed
•Process discovery agent notifies agencies on the network about new/deleted processes •Agency agent creates and enumerates measurement agents(All communication via Software bus)
User interface (GUI)
Bus
Figure 52 Conceptual diagram of the agent system.
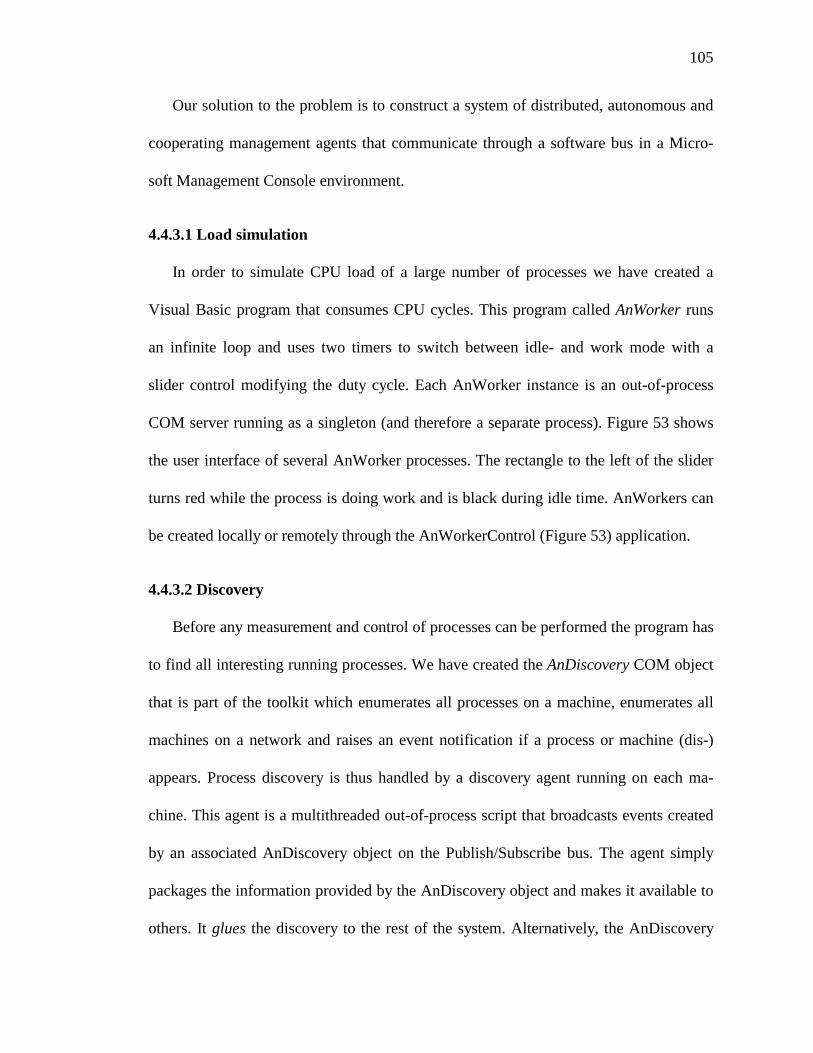
105
Our solution to the problem is to construct a system of distributed, autonomous and
cooperating management agents that communicate through a software bus in a Micro-
soft Management Console environment.
4.4.3.1 Load simulation
In order to simulate CPU load of a large number of processes we have created a
Visual Basic program that consumes CPU cycles. This program called AnWorker runs
an infinite loop and uses two timers to switch between idle- and work mode with a
slider control modifying the duty cycle. Each AnWorker instance is an out-of-process
COM server running as a singleton (and therefore a separate process). Figure 53 shows
the user interface of several AnWorker processes. The rectangle to the left of the slider
turns red while the process is doing work and is black during idle time. AnWorkers can
be created locally or remotely through the AnWorkerControl (Figure 53) application.
4.4.3.2 Discovery
Before any measurement and control of processes can be performed the program has
to find all interesting running processes. We have created the AnDiscovery COM object
that is part of the toolkit which enumerates all processes on a machine, enumerates all
machines on a network and raises an event notification if a process or machine (dis-)
appears. Process discovery is thus handled by a discovery agent running on each ma-
chine. This agent is a multithreaded out-of-process script that broadcasts events created
by an associated AnDiscovery object on the Publish/Subscribe bus. The agent simply
packages the information provided by the AnDiscovery object and makes it available to
others. It glues the discovery to the rest of the system. Alternatively, the AnDiscovery
106
COM object also supports discovery of processes on a remote machine. Since this re-
sults in higher network traffic we do not use that option and rather run one local agent
4.4.3.3 Agency agent
Even autonomous agents need an agent home and a dispatcher that creates and as-
signs tasks to them. In our agent system the agency agent takes on that role. It is
assumed that at least one agency is running somewhere on the network and listens for
broadcasts from the individual discovery agents. In order to avoid a single point of fail-
ure it is possible to start more than one agency agent. For each discovered process
instance the agency agent consults a VB database that allows the agent to instantiate a
specialized process monitor agent that knows how to monitor and control the perform-
ance of a certain process type.
Figure 53 AnWorker and AnWorker Control.
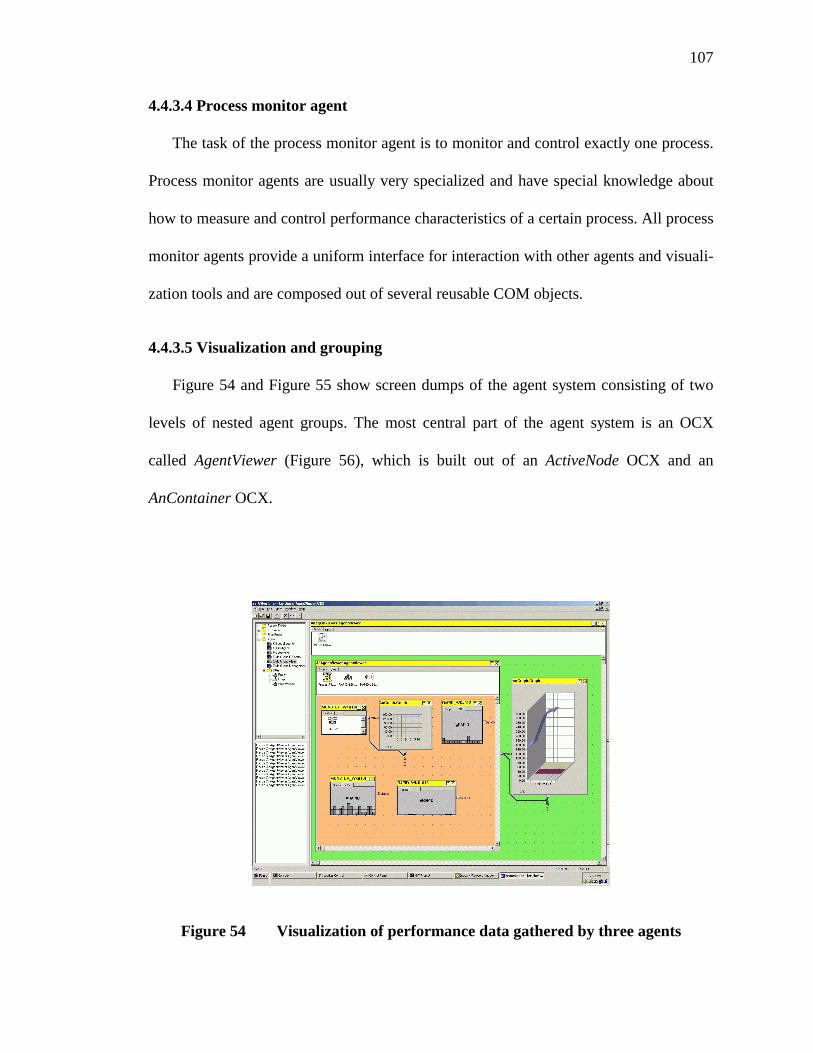
107
4.4.3.4 Process monitor agent
The task of the process monitor agent is to monitor and control exactly one process.
Process monitor agents are usually very specialized and have special knowledge about
how to measure and control performance characteristics of a certain process. All process
monitor agents provide a uniform interface for interaction with other agents and visuali-
zation tools and are composed out of several reusable COM objects.
4.4.3.5 Visualization and grouping
Figure 54 and Figure 55 show screen dumps of the agent system consisting of two
levels of nested agent groups. The most central part of the agent system is an OCX
called AgentViewer (Figure 56), which is built out of an ActiveNode OCX and an
AnContainer OCX.
Figure 54 Visualization of performance data gathered by three agents
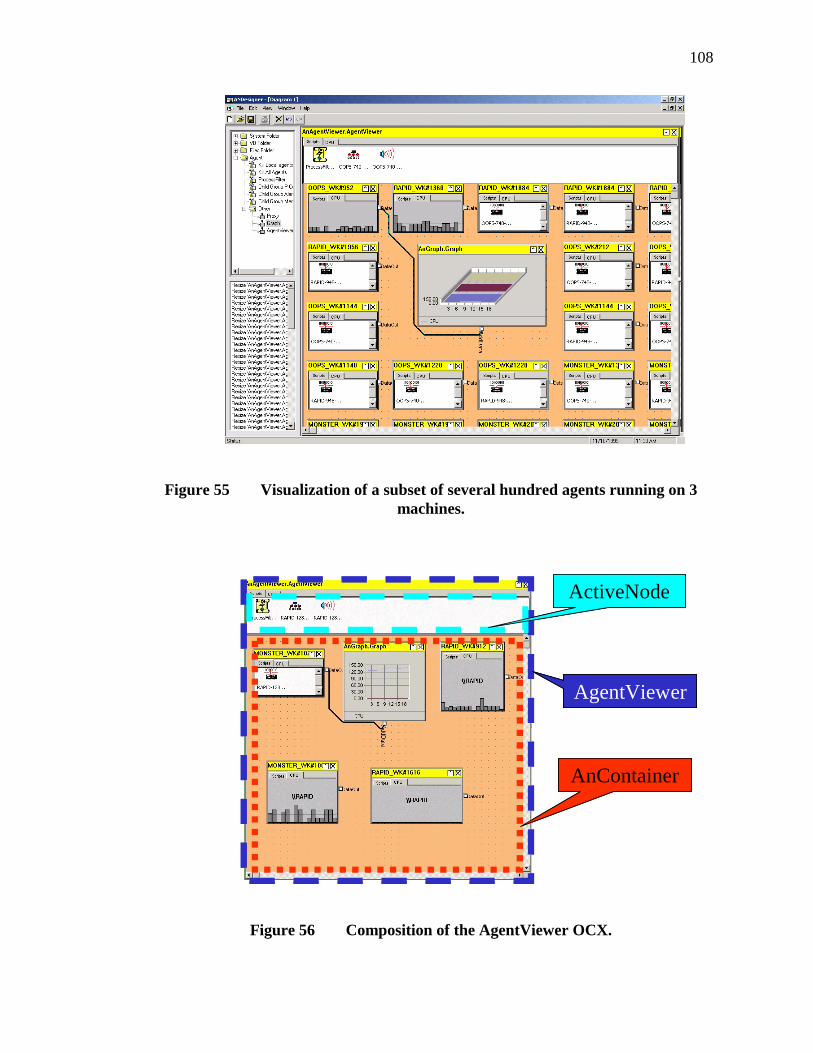
108
Figure 55 Visualization of a subset of several hundred agents running on 3 machines.
AgentViewer
AnContainer
ActiveNode
AgentViewer
AnContainer
ActiveNode
Figure 56 Composition of the AgentViewer OCX.
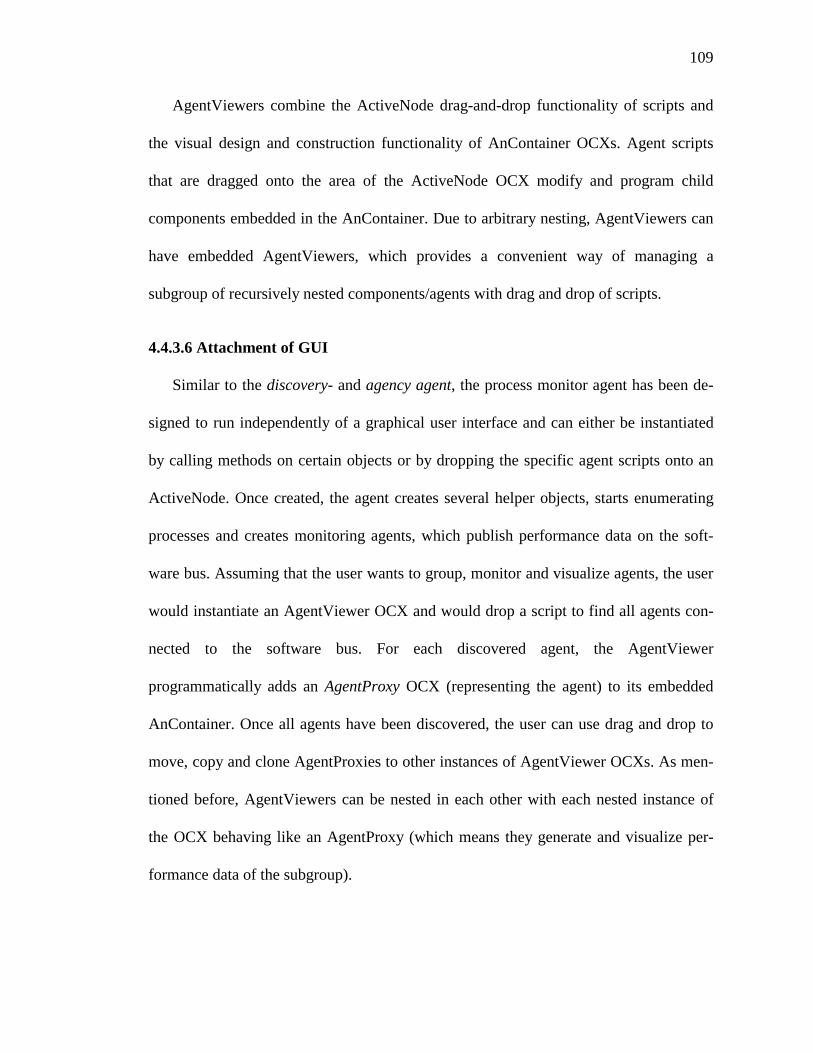
109
AgentViewers combine the ActiveNode drag-and-drop functionality of scripts and
the visual design and construction functionality of AnContainer OCXs. Agent scripts
that are dragged onto the area of the ActiveNode OCX modify and program child
components embedded in the AnContainer. Due to arbitrary nesting, AgentViewers can
have embedded AgentViewers, which provides a convenient way of managing a
subgroup of recursively nested components/agents with drag and drop of scripts.
4.4.3.6 Attachment of GUI
Similar to the discovery- and agency agent, the process monitor agent has been de-
signed to run independently of a graphical user interface and can either be instantiated
by calling methods on certain objects or by dropping the specific agent scripts onto an
ActiveNode. Once created, the agent creates several helper objects, starts enumerating
processes and creates monitoring agents, which publish performance data on the soft-
ware bus. Assuming that the user wants to group, monitor and visualize agents, the user
would instantiate an AgentViewer OCX and would drop a script to find all agents con-
nected to the software bus. For each discovered agent, the AgentViewer
programmatically adds an AgentProxy OCX (representing the agent) to its embedded
AnContainer. Once all agents have been discovered, the user can use drag and drop to
move, copy and clone AgentProxies to other instances of AgentViewer OCXs. As men-
tioned before, AgentViewers can be nested in each other with each nested instance of
the OCX behaving like an AgentProxy (which means they generate and visualize per-
formance data of the subgroup).
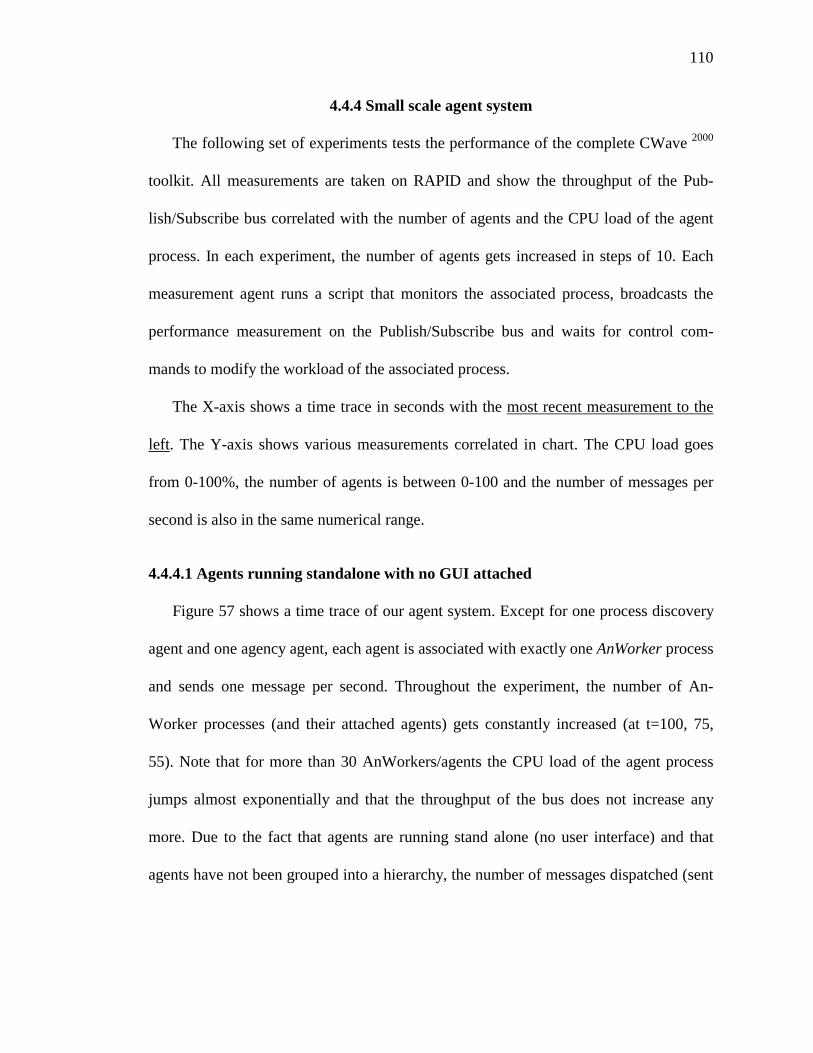
110
4.4.4 Small scale agent system
The following set of experiments tests the performance of the complete CWave 2000
toolkit. All measurements are taken on RAPID and show the throughput of the Pub-
lish/Subscribe bus correlated with the number of agents and the CPU load of the agent
process. In each experiment, the number of agents gets increased in steps of 10. Each
measurement agent runs a script that monitors the associated process, broadcasts the
performance measurement on the Publish/Subscribe bus and waits for control com-
mands to modify the workload of the associated process.
The X-axis shows a time trace in seconds with the most recent measurement to the
left. The Y-axis shows various measurements correlated in chart. The CPU load goes
from 0-100%, the number of agents is between 0-100 and the number of messages per
second is also in the same numerical range.
4.4.4.1 Agents running standalone with no GUI attached
Figure 57 shows a time trace of our agent system. Except for one process discovery
agent and one agency agent, each agent is associated with exactly one AnWorker process
and sends one message per second. Throughout the experiment, the number of An-
Worker processes (and their attached agents) gets constantly increased (at t=100, 75,
55). Note that for more than 30 AnWorkers/agents the CPU load of the agent process
jumps almost exponentially and that the throughput of the bus does not increase any
more. Due to the fact that agents are running stand alone (no user interface) and that
agents have not been grouped into a hierarchy, the number of messages dispatched (sent
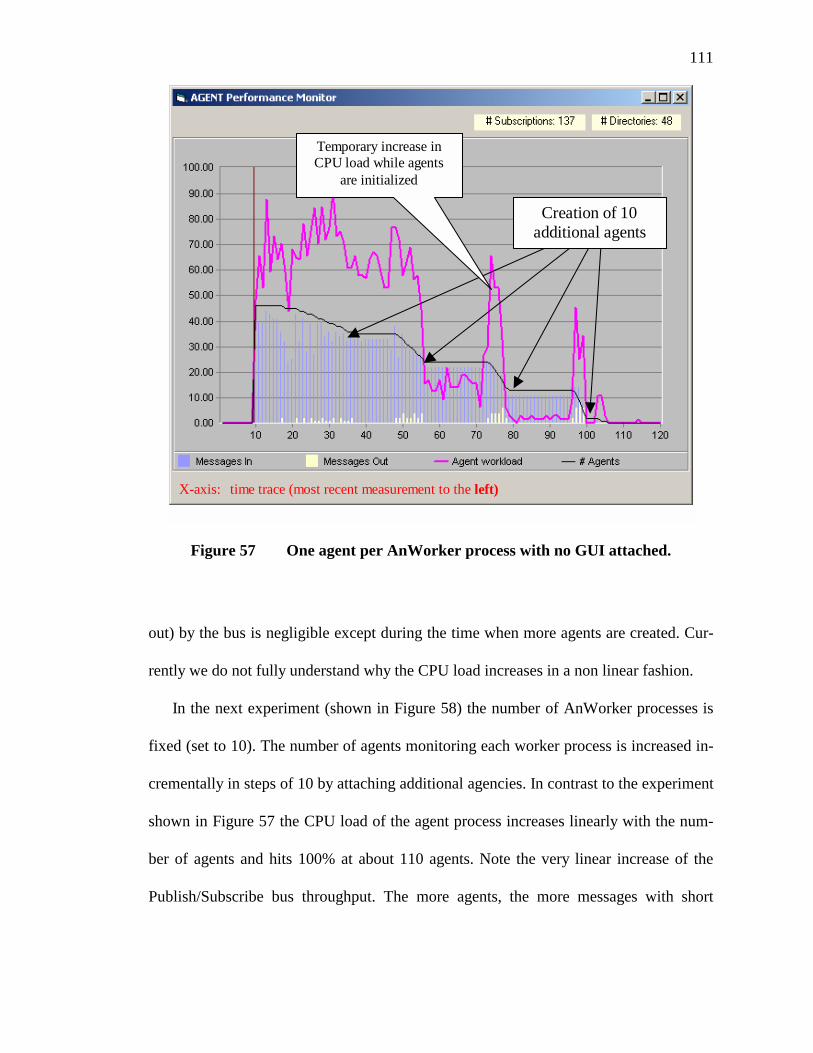
111
out) by the bus is negligible except during the time when more agents are created. Cur-
rently we do not fully understand why the CPU load increases in a non linear fashion.
In the next experiment (shown in Figure 58) the number of AnWorker processes is
fixed (set to 10). The number of agents monitoring each worker process is increased in-
crementally in steps of 10 by attaching additional agencies. In contrast to the experiment
shown in Figure 57 the CPU load of the agent process increases linearly with the num-
ber of agents and hits 100% at about 110 agents. Note the very linear increase of the
Publish/Subscribe bus throughput. The more agents, the more messages with short
X-axis: time trace (most recent measurement to the left)
Creation of 10 additional agents
Temporary increase in CPU load while agents
are initialized
Figure 57 One agent per AnWorker process with no GUI attached.
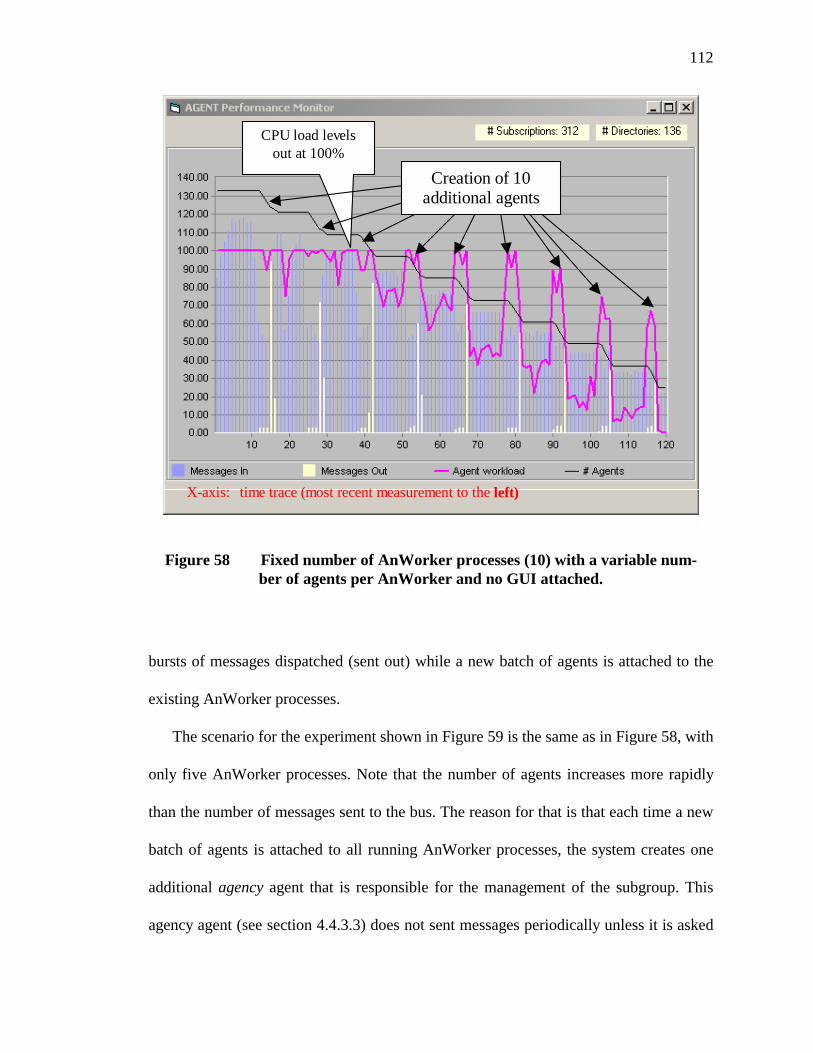
112
bursts of messages dispatched (sent out) while a new batch of agents is attached to the
existing AnWorker processes.
The scenario for the experiment shown in Figure 59 is the same as in Figure 58, with
only five AnWorker processes. Note that the number of agents increases more rapidly
than the number of messages sent to the bus. The reason for that is that each time a new
batch of agents is attached to all running AnWorker processes, the system creates one
additional agency agent that is responsible for the management of the subgroup. This
agency agent (see section 4.4.3.3) does not sent messages periodically unless it is asked
X-axis: time trace (most recent measurement to the left)
CPU load levels out at 100%
Creation of 10 additional agents
Figure 58 Fixed number of AnWorker processes (10) with a variable num-ber of agents per AnWorker and no GUI attached.
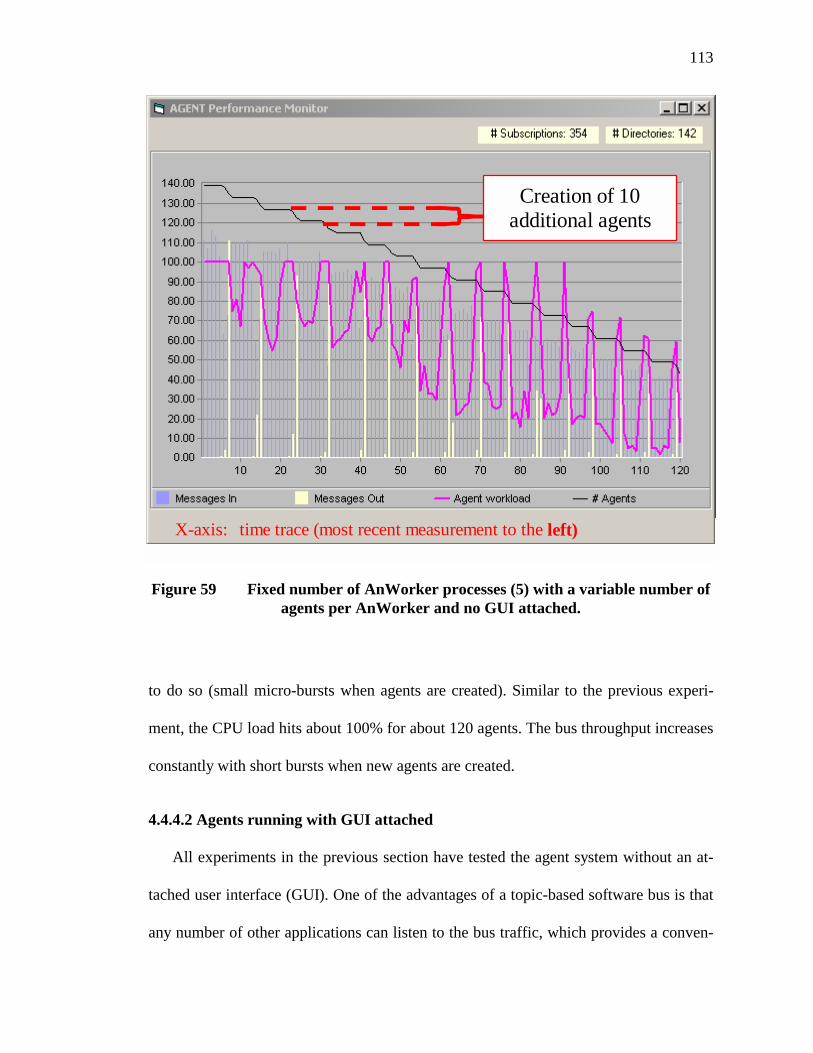
113
to do so (small micro-bursts when agents are created). Similar to the previous experi-
ment, the CPU load hits about 100% for about 120 agents. The bus throughput increases
constantly with short bursts when new agents are created.
4.4.4.2 Agents running with GUI attached
All experiments in the previous section have tested the agent system without an at-
tached user interface (GUI). One of the advantages of a topic-based software bus is that
any number of other applications can listen to the bus traffic, which provides a conven-
X-axis: time trace (most recent measurement to the left)
Creation of 10 additional agents
Figure 59 Fixed number of AnWorker processes (5) with a variable number of agents per AnWorker and no GUI attached.
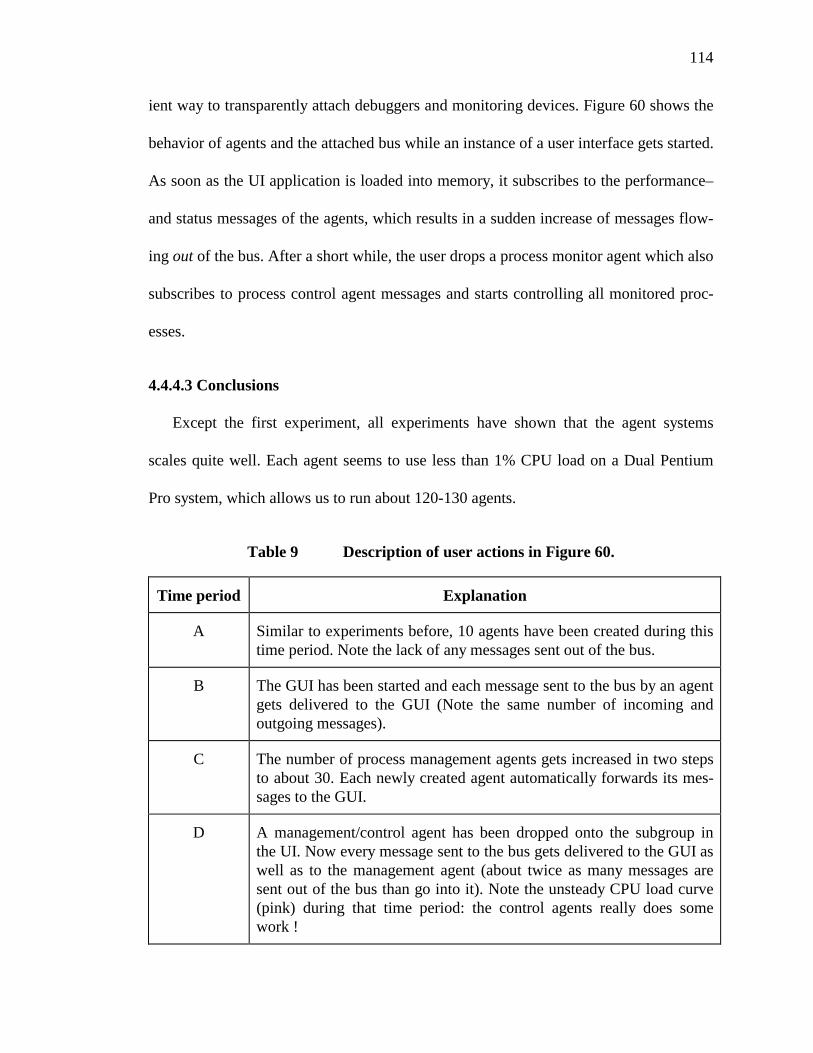
114
ient way to transparently attach debuggers and monitoring devices. Figure 60 shows the
behavior of agents and the attached bus while an instance of a user interface gets started.
As soon as the UI application is loaded into memory, it subscribes to the performance–
and status messages of the agents, which results in a sudden increase of messages flow-
ing out of the bus. After a short while, the user drops a process monitor agent which also
subscribes to process control agent messages and starts controlling all monitored proc-
esses.
4.4.4.3 Conclusions
Except the first experiment, all experiments have shown that the agent systems
scales quite well. Each agent seems to use less than 1% CPU load on a Dual Pentium
Pro system, which allows us to run about 120-130 agents.
Table 9 Description of user actions in Figure 60.
Time period Explanation
A Similar to experiments before, 10 agents have been created during this time period. Note the lack of any messages sent out of the bus.
B The GUI has been started and each message sent to the bus by an agent gets delivered to the GUI (Note the same number of incoming and outgoing messages).
C The number of process management agents gets increased in two steps to about 30. Each newly created agent automatically forwards its mes-sages to the GUI.
D A management/control agent has been dropped onto the subgroup in the UI. Now every message sent to the bus gets delivered to the GUI as well as to the management agent (about twice as many messages are sent out of the bus than go into it). Note the unsteady CPU load curve (pink) during that time period: the control agents really does some work !
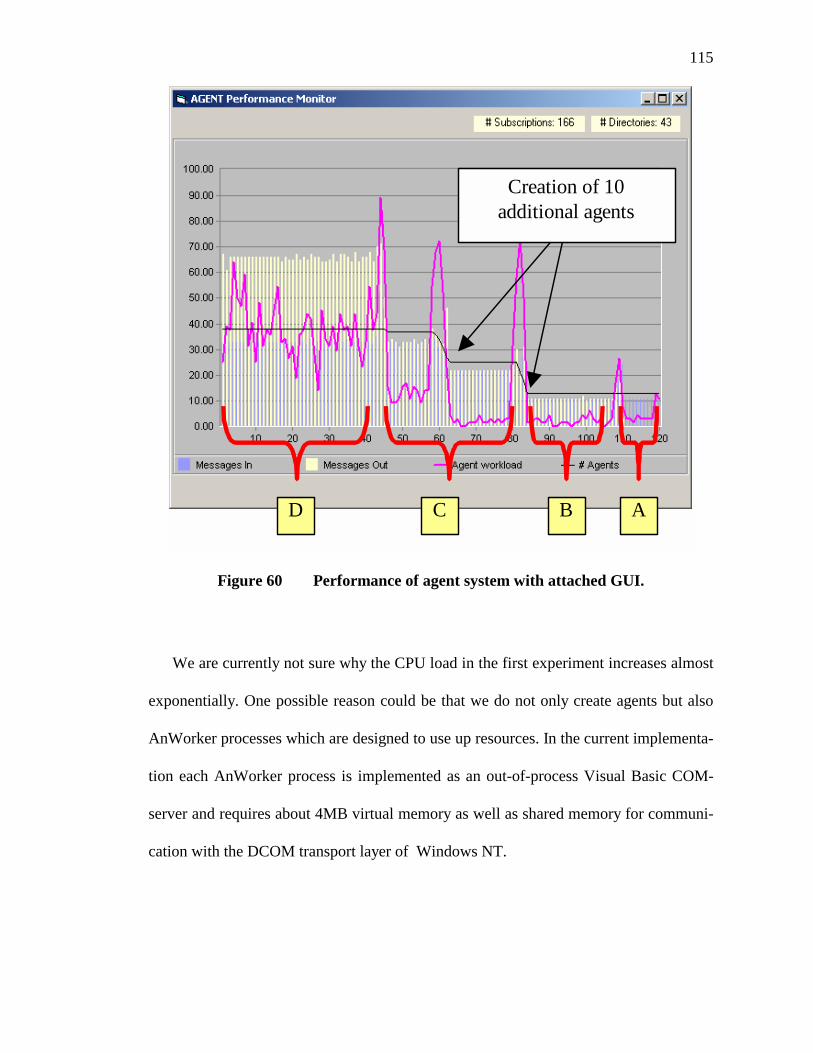
115
We are currently not sure why the CPU load in the first experiment increases almost
exponentially. One possible reason could be that we do not only create agents but also
AnWorker processes which are designed to use up resources. In the current implementa-
tion each AnWorker process is implemented as an out-of-process Visual Basic COM-
server and requires about 4MB virtual memory as well as shared memory for communi-
cation with the DCOM transport layer of Windows NT.
D C B A
Creation of 10 additional agents
Figure 60 Performance of agent system with attached GUI.
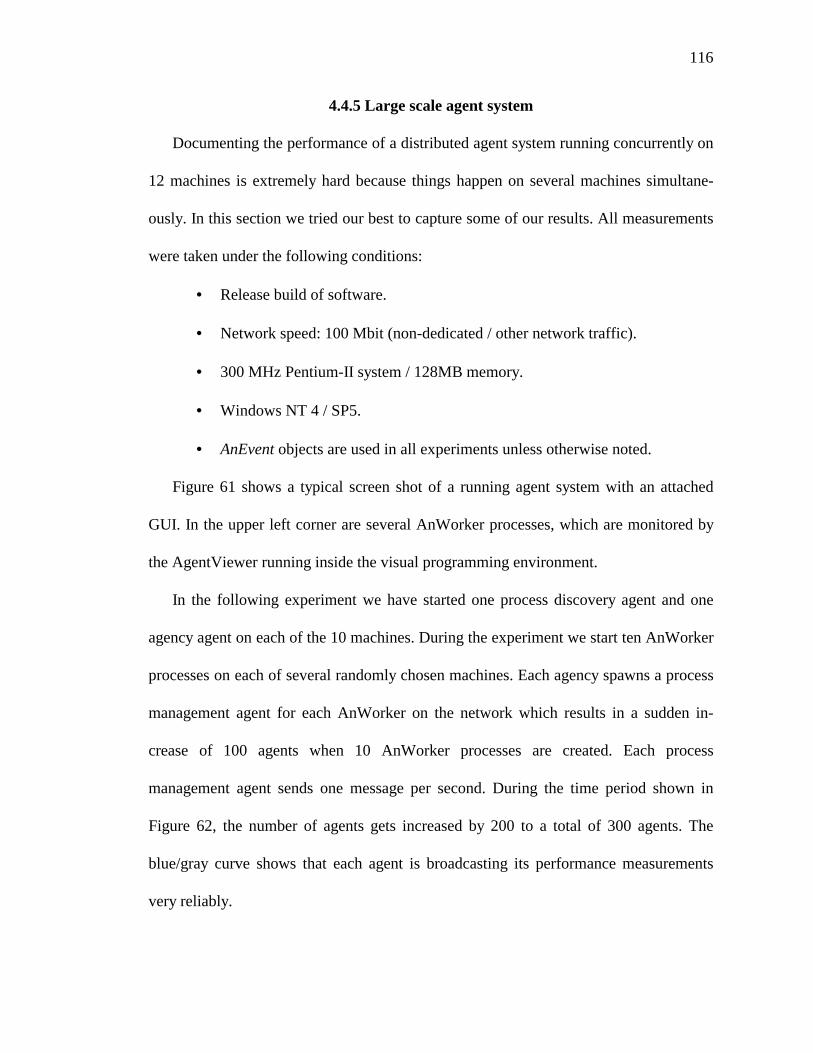
116
4.4.5 Large scale agent system
Documenting the performance of a distributed agent system running concurrently on
12 machines is extremely hard because things happen on several machines simultane-
ously. In this section we tried our best to capture some of our results. All measurements
were taken under the following conditions:
• Release build of software.
• Network speed: 100 Mbit (non-dedicated / other network traffic).
• 300 MHz Pentium-II system / 128MB memory.
• Windows NT 4 / SP5.
• AnEvent objects are used in all experiments unless otherwise noted.
Figure 61 shows a typical screen shot of a running agent system with an attached
GUI. In the upper left corner are several AnWorker processes, which are monitored by
the AgentViewer running inside the visual programming environment.
In the following experiment we have started one process discovery agent and one
agency agent on each of the 10 machines. During the experiment we start ten AnWorker
processes on each of several randomly chosen machines. Each agency spawns a process
management agent for each AnWorker on the network which results in a sudden in-
crease of 100 agents when 10 AnWorker processes are created. Each process
management agent sends one message per second. During the time period shown in
Figure 62, the number of agents gets increased by 200 to a total of 300 agents. The
blue/gray curve shows that each agent is broadcasting its performance measurements
very reliably.
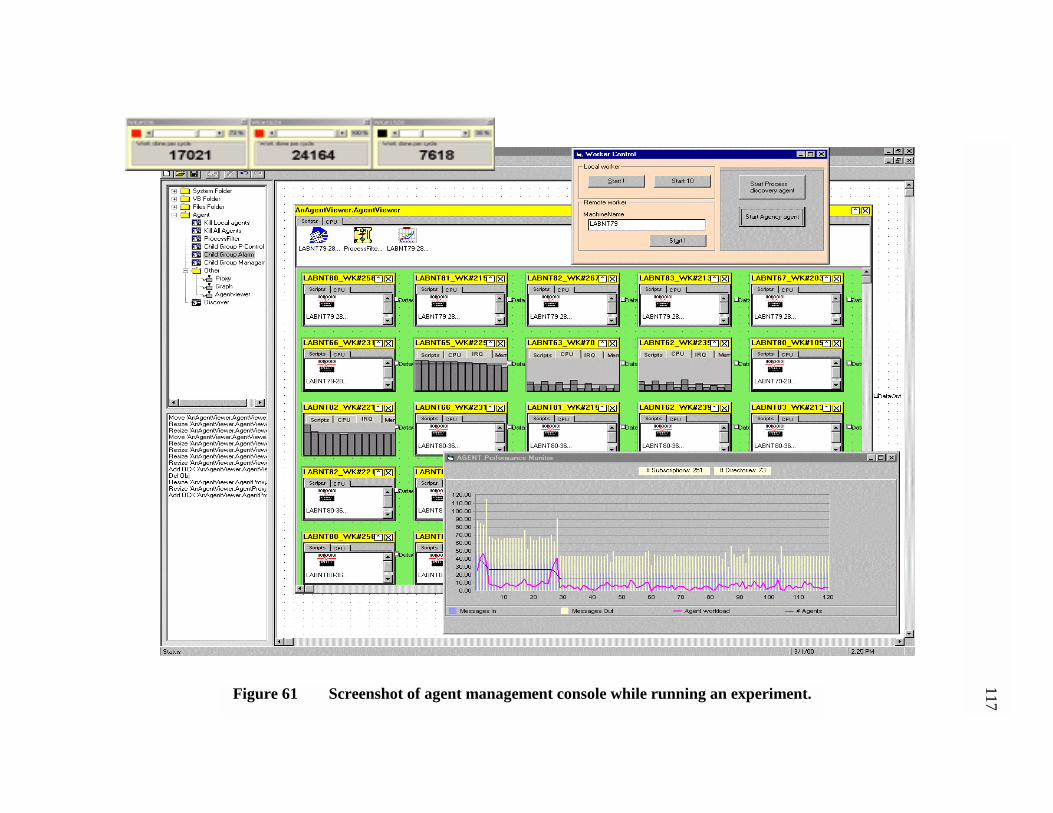
Figure 61 Screenshot of agent management console while running an experiment.
117
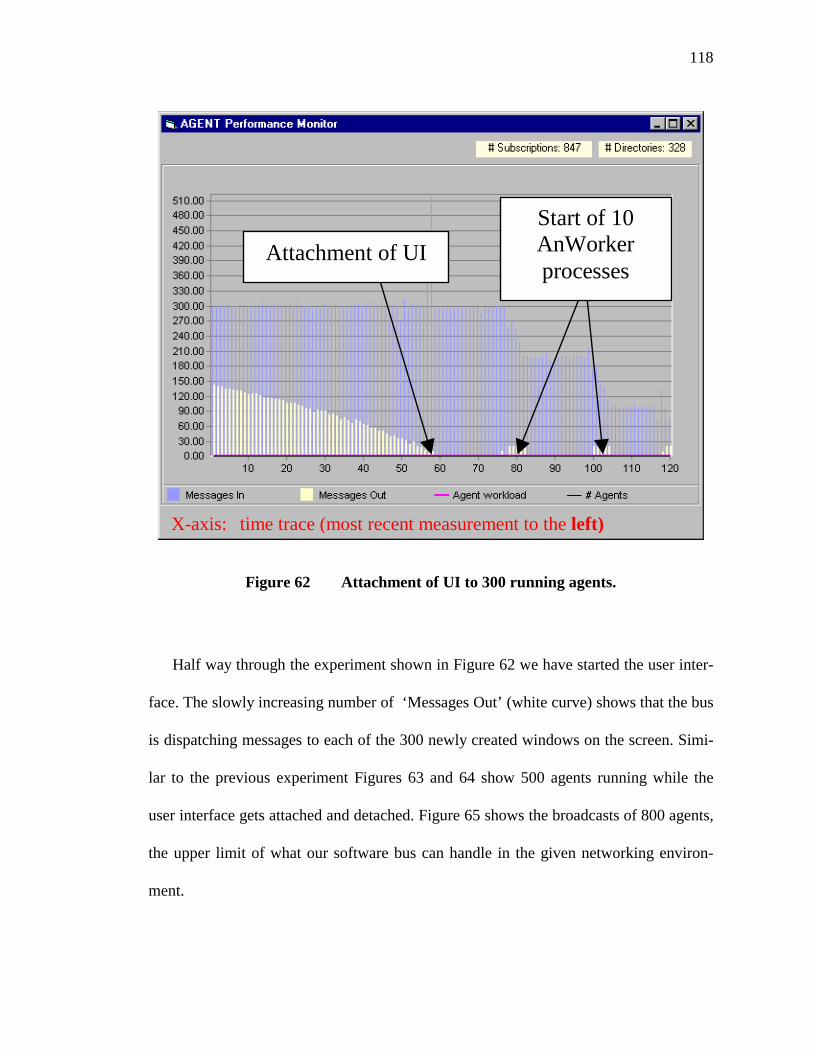
118
Half way through the experiment shown in Figure 62 we have started the user inter-
face. The slowly increasing number of ‘Messages Out’ (white curve) shows that the bus
is dispatching messages to each of the 300 newly created windows on the screen. Simi-
lar to the previous experiment Figures 63 and 64 show 500 agents running while the
user interface gets attached and detached. Figure 65 shows the broadcasts of 800 agents,
the upper limit of what our software bus can handle in the given networking environ-
ment.
Start of 10 AnWorker processes
Attachment of UI
X-axis: time trace (most recent measurement to the left)
Figure 62 Attachment of UI to 300 running agents.
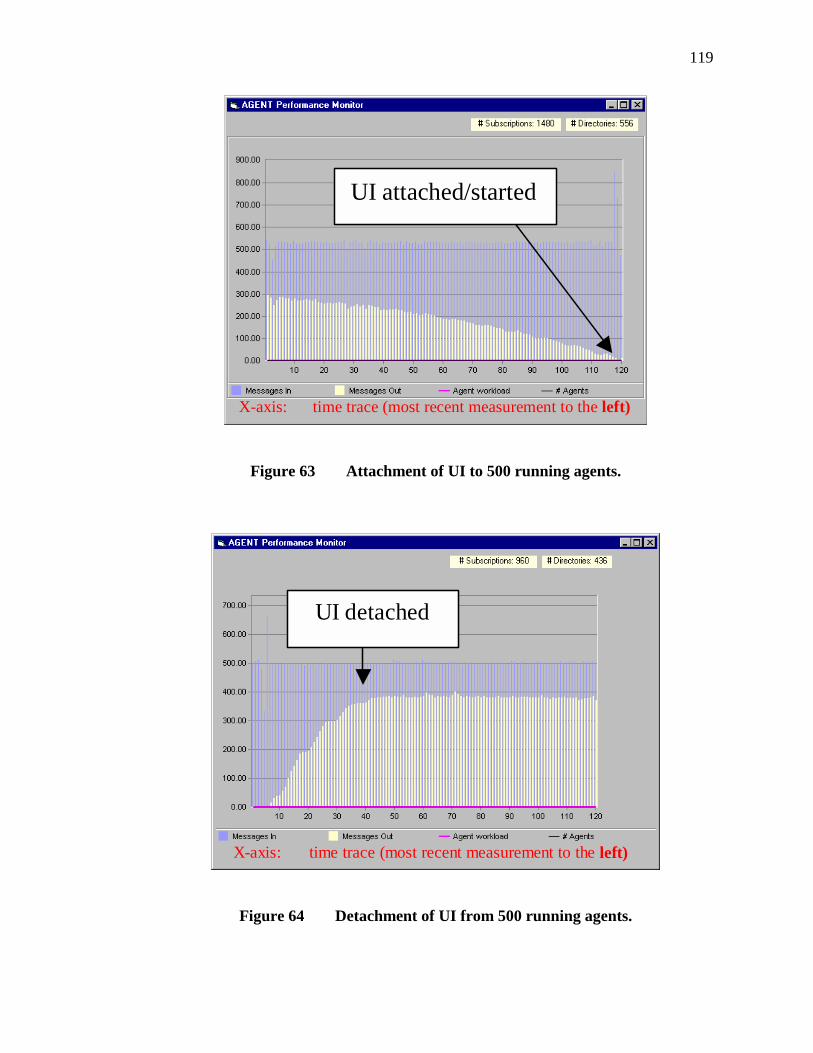
119
X-axis: time trace (most recent measurement to the left)
UI attached/started
Figure 63 Attachment of UI to 500 running agents.
X-axis: time trace (most recent measurement to the left)
UI detached
Figure 64 Detachment of UI from 500 running agents.
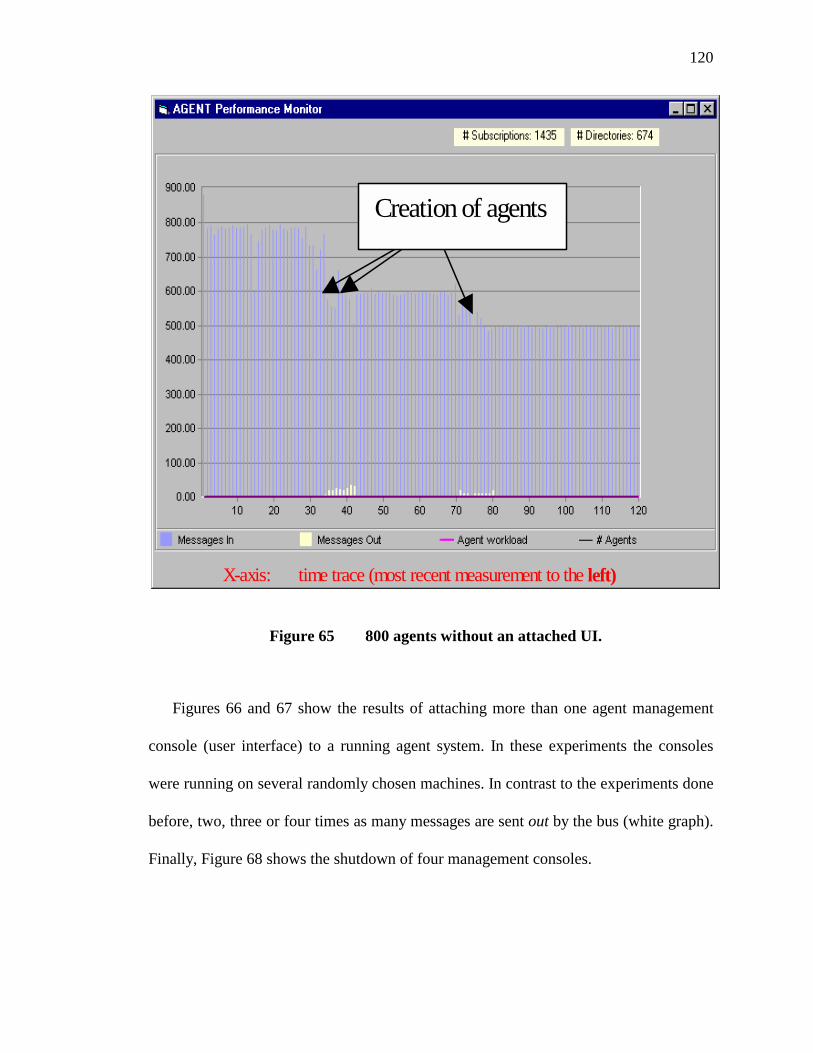
120
X-axis: time trace (most recent measurement to the left)
Creation of agents
Figure 65 800 agents without an attached UI.
Figures 66 and 67 show the results of attaching more than one agent management
console (user interface) to a running agent system. In these experiments the consoles
were running on several randomly chosen machines. In contrast to the experiments done
before, two, three or four times as many messages are sent out by the bus (white graph).
Finally, Figure 68 shows the shutdown of four management consoles.
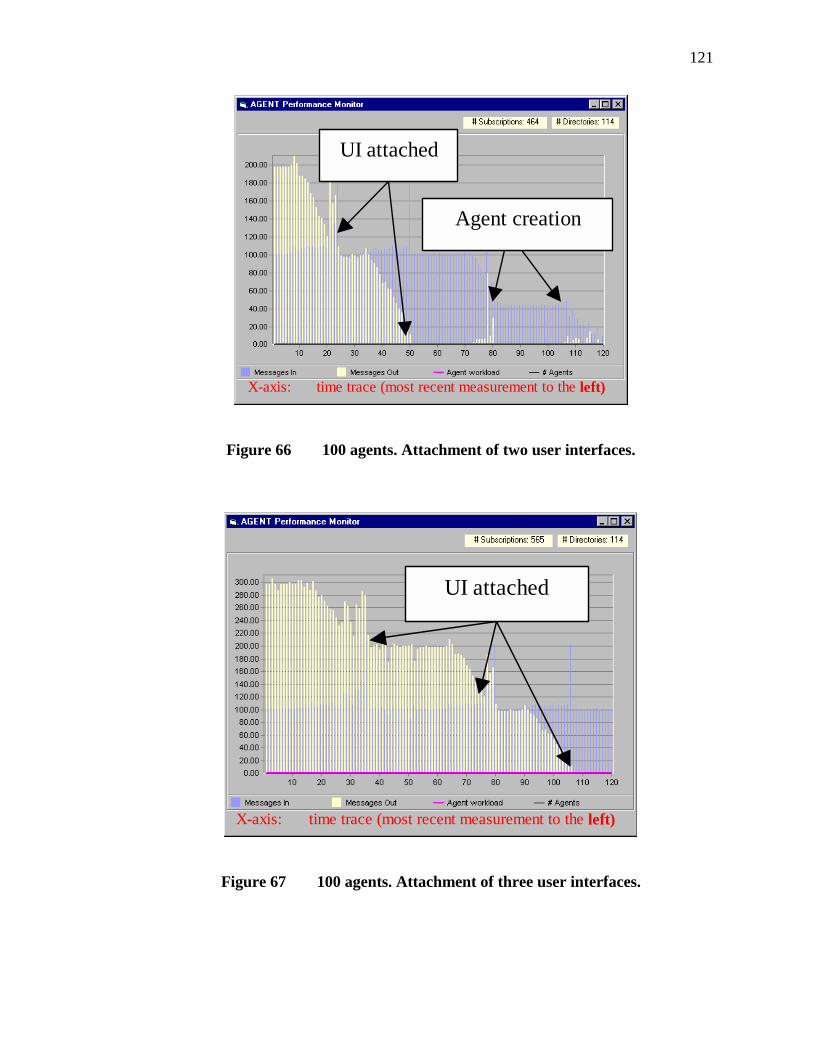
121
X-axis: time trace (most recent measurement to the left)
UI attached
Agent creation
Figure 66 100 agents. Attachment of two user interfaces.
X-axis: time trace (most recent measurement to the left)
UI attached
Figure 67 100 agents. Attachment of three user interfaces.
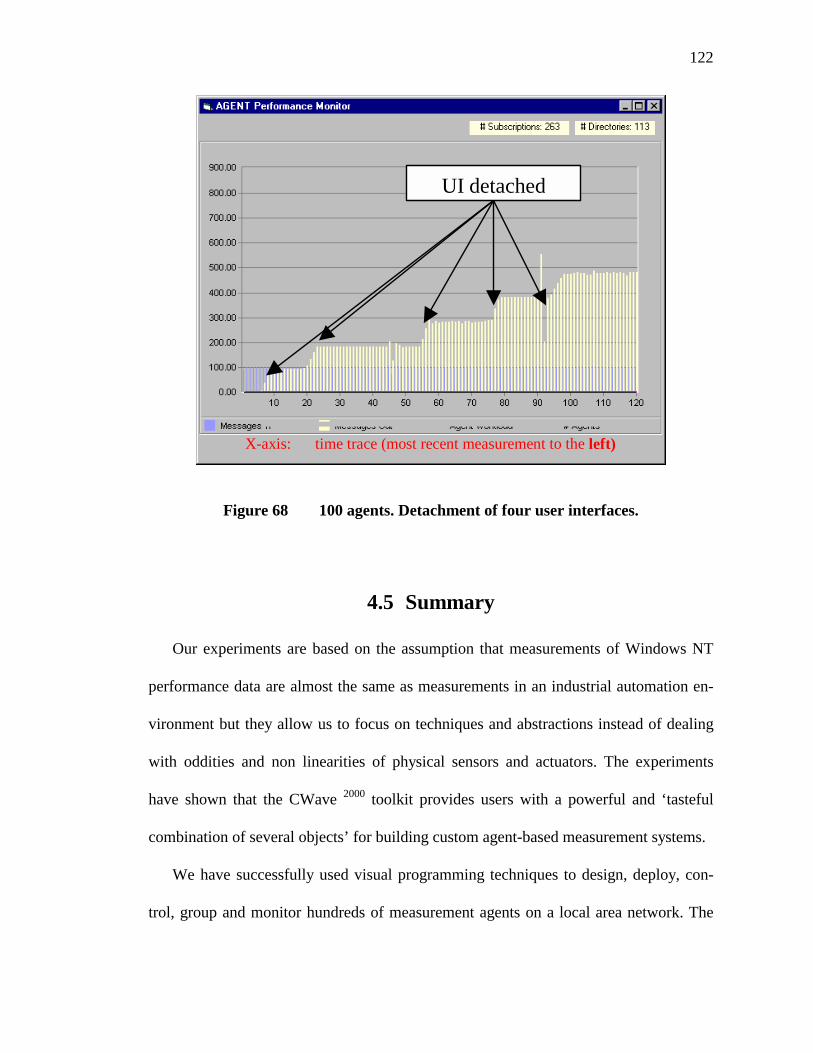
122
X-axis: time trace (most recent measurement to the left)
UI detached
Figure 68 100 agents. Detachment of four user interfaces.
4.5 Summary
Our experiments are based on the assumption that measurements of Windows NT
performance data are almost the same as measurements in an industrial automation en-
vironment but they allow us to focus on techniques and abstractions instead of dealing
with oddities and non linearities of physical sensors and actuators. The experiments
have shown that the CWave 2000 toolkit provides users with a powerful and ‘tasteful
combination of several objects’ for building custom agent-based measurement systems.
We have successfully used visual programming techniques to design, deploy, con-
trol, group and monitor hundreds of measurement agents on a local area network. The
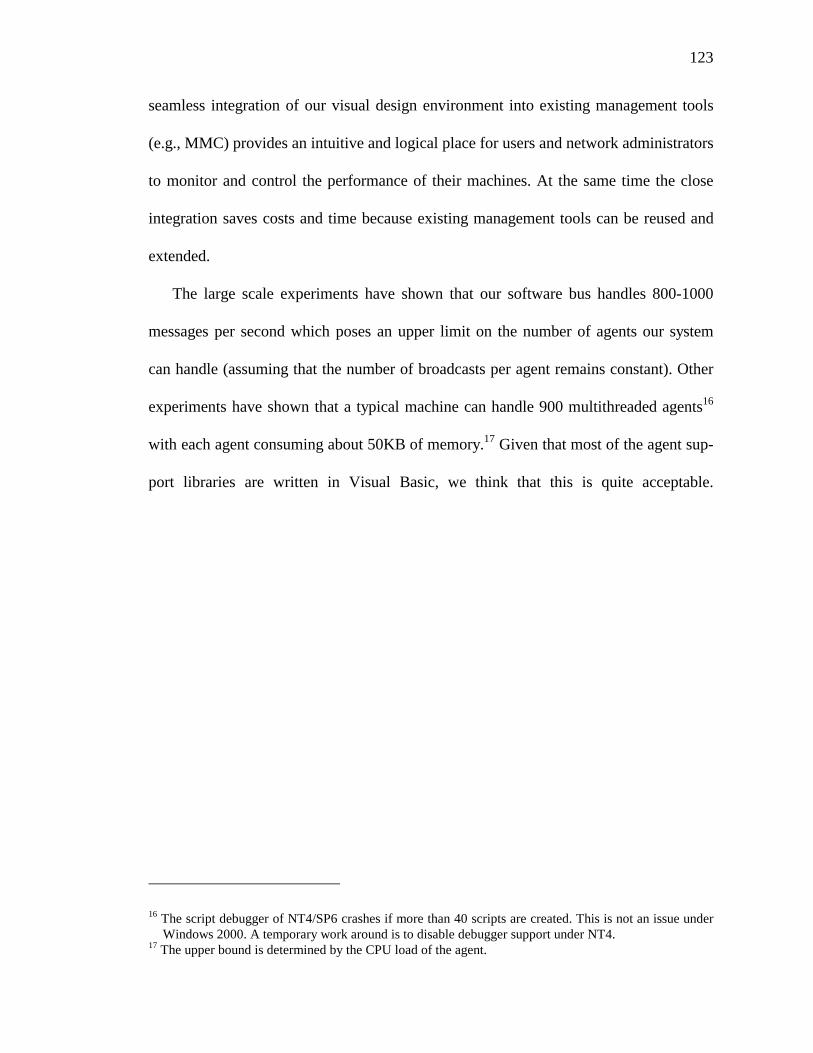
123
seamless integration of our visual design environment into existing management tools
(e.g., MMC) provides an intuitive and logical place for users and network administrators
to monitor and control the performance of their machines. At the same time the close
integration saves costs and time because existing management tools can be reused and
extended.
The large scale experiments have shown that our software bus handles 800-1000
messages per second which poses an upper limit on the number of agents our system
can handle (assuming that the number of broadcasts per agent remains constant). Other
experiments have shown that a typical machine can handle 900 multithreaded agents16
with each agent consuming about 50KB of memory.17 Given that most of the agent sup-
port libraries are written in Visual Basic, we think that this is quite acceptable.
16 The script debugger of NT4/SP6 crashes if more than 40 scripts are created. This is not an issue under Windows 2000. A temporary work around is to disable debugger support under NT4.
17 The upper bound is determined by the CPU load of the agent.
CHAPTER 5
FUTURE WORK
Every large scale project has some loose ends. This is not different in our system. In
order to demonstrate the viability of a visual dataflow toolkit based on OCX technology
we had to develop a lot of code, probably more than in the average computer science
dissertation. It is therefore no big surprise that most of the future work is related to cod-
ing:
• User interface: Currently, we are at the point where the toolkit functionality
is almost complete but we have not spent much time to provide a flashy user
interface for the visual environment. In fact, the lists of features and gim-
micks of our first prototype were longer than it is in the current
implementation. Examples for missing features are MDI windows and resiz-
able toolbars.
• Components: Another area that requires more work is the development of a
standard set of components. So far we have argued that because it is so easy
for the user to create specific components we do not have to provide general-
purpose components. As the system grows, we will need a standard library of
components.
125
• Dataflow: Adding code to the OCX wrapper would offload the responsibil-
ity of a component to synchronize and buffer data coming in through
multiple input ports.
• Software agents: In order to advance our research in agent systems, our
agents have to become smarter. So far our research has focused on an agent
infrastructure that is flexible enough to be used in the measurement domain.
The next big challenge is to define more agent services that can be used by
an agent to make smart decisions on its own and to visualize these decisions
interactively with our system. Another interesting field is the visualization of
agent-agent interaction.
REFERENCES
[1] A. Lingnau, O. Drobnik. “An Infrastructure for Mobile Agents: Requirements and Architecture,” Proc. 13th DIS Workshop, Orlando, Florida; 1995 Sep.
[2] A. Lingnau, R. Brand, A. Möbs, O. Drobnik. “Produktrecherche mit mobilen Agenten in einem elektronischen Markt,“ 'Workshop `Kooperationsnetze und Elektronische Koordination'; 1998 Sep.
[3] Barbara Nelson. Personal Communications. 1997 May.
[4] E.F. Camacho, A. Bordons, D. Carlos. Model Predictive Control. Springer Verlag; 1999 Jun. ISBN 3540762418.
[5] C. Sturdevant. “HP Introduces HP OpenView ManageX Smart Plug-In for Effective, In-Depth Management of Microsoft Exchange Environments,” PC Week; 1998 Mar 11.
[6] C. Johnson, S. Parker. “The SCIRun parallel scientific computing problem solving environment,” Ninth SIAM Conference on Parallel Processing for Scientific Computing; Adam's Mark San Antonio-Riverwalk Hotel, San Antonio, Texas.
[7] C.G. Harrison, D. M. Chess, A. Kershenbaum. “Mobile agents: are they a good idea ?,” IBM Research Division T. J. Watson Research Center, http://www.research.ibm.com/massive/mobag.ps
[8] D. Gelernter. „Generative Communication in Linda,“ ACM Transactions on Programming Languages and Systems, 7(1):80-112; 1985 Jan.
[9] Dale Rogerson. Inside COM. Microsoft Press; 1997. ISBN 1-57231-349-8.
[10] D. B. Lange, M. Oshima. “Mobile Agents with Java: The Aglet API,” World Wide Web Journal; 1998.
127
[11] D. Lange and M. Oshima. „Programming and Deploying Java Mobile Agents with Aglets,” Addison Wesley; 1998. ISBN 0-201-32582-9.
[12] D. Harold. “HP Vantera Helps Companies with Deregulation,” Control Engineering, Cahners Business Information. http://www.manufacturing.net/magazine/ce/archives/1998/ctl0501.98/05g501.htm.
[13] D. Wong, N. Paciorek, T. Walsh, J. DiCelie, M. Young, B. Peet. “An Infrastructure for Collaborating Mobile Agents,” First International Workshop on Mobile Agents 97 (MA'97); Berlin, Germany. 1997.
[14] D. Dietrich, L. Loy, D. Schweinzer. LON-Technology. Vienna, Austria: Huethig Buchverlag; 1998. ISBN 3-7785-2581-6.
[15] Echelon [Web Page]. http://www.echelon.com/.
[16] F. Frei, A. Weller, R.Williams. “A Graphics-based Programming-Support System,” ACM Computer Graphics, SIGGRAPH 12:3 ; 1978 Aug: 43-49.
[17] Hewlett Packard Corporation. “Introducing HP VEE 5.0,” http://www.tmo.hp.com/tmo/pia/HPVEE/PIAProd/English/HPVEE_5_SubHome.html.
[18] Hewlett Packard Corporation. “HP Introduces HP OpenView ManageX Smart Plug-In for Effective, In-Depth Management of Microsoft Exchange Environments,” HP Press release. 1998 Sep 8 http://www.hp.com/pressrel/sep98/08sep98e.htm.
[19] H. Peine, T. Stolpmann. “The Architecture of the Ara Platform for Mobile Agents,” First International Workshop on Mobile Agents, MA'97Berlin, Germany: Kurt Rothermel, Radu Popescu-Zeletin; 1997.
[20] I. Jacobson, M. Griss, P. Jonsson. Software Reuse : Architecture Process and Organization for Business Success. Palo Alto, CA: Addison-Wesley; ISBN 0-201-924765.
[21] J.P. Morrison. Flow Based Programming: A New Approach to Application Development. International Thomson Computer Press; 1994. ISBN 0-442-01771-5.
128
[22] J.P. Morrison. “Flow based programming,” 1st International Workshop on Software Engineering for Parallel and Distributed Systems, Berlin, Germany; 1996.
[23] J. B. Dennis. “A Preliminary Architecture for a Basic Data Flow Processor,” ISCA '98. 25 Years of the International Symposia on Computer Architecture (Selected Papers). 1998; 2-4.
[24] J. R. McGraw. “The VAL Language: Description and Analysis,” ACM Transactions on Programming Languages and Systems. 1982 Jan; 4-1:44-82.
[25] J. K. Ousterhout. Tcl and the Tk Toolkit. Berkeley, CA 94720: Addison-Wesley Publishing Company, Inc; 1993. ISBN 0-201-63337X.
[26] J. McCarthy. “Elephant 2000: A Programming Language Based on Speech Acts. Stanford University,” http://www-formal.stanford.edu/jmc/elephant/elephant.html.
[27] J. Leva, A. Bartolini, C.A. Maffezzoni. “Process Simulation Environment Based on Visual Programming and Dynamic Decoupling,” Simulation. 1998 Sep; 71(3):183-193.
[28] M. L. Griss. “Software Bus Architectures,” OOPSLA'92 Workshop "Towards an Architecture Handbook". 1992 Oct.
[29] M. L. Griss. Personal Communications. 1998.
[30] M. L. Griss. “My Agent Will Call Your Agent ... But Will It Respond ?,” Palo Alto, CA: HP Laboratories Technical Report; 1999; HPL-1999-159 20000113 (also published in Software Development Magazine, February 2000).
[31] M. L. Griss, R. R. Kessler. “Visual Basic Does Lego,” Palo Alto, CA: HP Laboratories Technical Report; 1995 Sep; HPL-95-107.
[32] M. Hirschl, D. Kotz. “AGDB: A Debugger for Agent Tcl,” Hanover, NH; 1997 Dartmouth PCS-TR97-306.
[33] M. Merle, C. Gransart, J.M. Geib. “Corbaweb: a Generic Object Navigator,” Computer Networks and Isdn Systems. 1996 May; 28(7-11):1269-1281.
129
[34] M. Wooldridge, N. Jennings. “Intelligent Agents: Theory and Practice,” Knowledge Engineering Review Volume. 1995 Jun; 10 No 2.
[35] National Instruments. Labview. http://www.natinst.com/labview/.
[36] Nuview Corporation. ManageX http://www.nuview.com/.
[37] O. Ousterhout. “Scripting: Higher Level Programming for the 21st Century,” Computer. 1998 Mar; 31(3):23-+.
[38] Pictorius. Prograph for Windows http://www.pictorius.com/.
[39] Purtilo. “The Polylith Software Bus,” Acm Transactions on Programming Languages and Systems. 1994 Jan; 16(1):151-174.
[40] Purtilo, R. Snodgrass. “Software Bus Organization: Reference Model and Comparison of Existing Systems,” 1991 Apr; Draft.
[41] R. Kessler. Personal Communications. 1998.
[42] Siemens. SIMATIC Process Control System PCS http://www.aut.sea.siemens.com/pcs/index.htm.
[43] Sisal. Sisal Language Project http://www.llnl.gov/sisal/.
[44] Smedley. “Visual Programming With Prograph,” Dr Dobbs Journal. 1998 Sep; 23(9):76-+.
[45] TIBCO Software Inc. “TIBCO Software Unveils Next-Generation Internet Infrastructure Software Suites,” http://www.tibco.com/press/releases/index.html.
[46] F. Finin, Y. Labrou, J. Mayfield. “KQML as an agent communication language,” Software Agents. 1997.
[47] T. Martinsson. “Active Scripting with PerlScript,” http://www.microsoft.com/mind/0899/inthisissue0899.htm.
[48] W. White. “Telescript technology: The foundation for the electronic marketplace,” 2465 Latham Street, Mountain View, CA 94040: General Magic, Inc.; 1994.