the curse and blessing effects of natural resources in
TRANSCRIPT

CE
UeT
DC
olle
ctio
n
The Curse and Blessing Effects of Natural Resources in
Central Asia: Turkmenistan and Tajikistan
By: Rovshen Charyyev
Submitted to Central European University,
Department of Political Science
In partial fulfillment of the requirements for the degree of Masters of Arts/Sciences
Supervised by: Professor Attila Folsz
Budapest, Hungary
2015

CE
UeT
DC
olle
ctio
n
i
Abstract
This research is dedicated to analyzing the curse or blessing effects of two forms of external rents,
natural resources and foreign aid. Previous studies mainly focus on negative macroeconomic
effects of external rents. This research expands the scope by analyzing the application of natural
resources and foreign aid in Central Asia in course of development since independence from Soviet
Union. The initial socioeconomic conditions after the collapse of the Soviet Empire and the strong
political elite with control over the distribution of resource rents developed some curse symptoms.
Nevertheless, hydrocarbon wealth had more positive contributions than that of foreign aid. To
understand the degree of curse and blessing effects of resources, this research is based on
comparative case studies. The study compares resource-rich and resource-poor Central Asian
states to contrast the contribution of hydrocarbon wealth. Upon it, this study argues that resource-
rich Central Asian states managed the resource revenues better and had more positive effects than
resource-poor states with foreign aid.

CE
UeT
DC
olle
ctio
n
ii
Table of Contents Abstract ............................................................................................................................................ i
Table of figures and tables: ............................................................................................................ iv
Introduction. .................................................................................................................................... 1
Relevance of the study, hypotheses and methods ....................................................................... 2
Principal findings and contribution ............................................................................................. 3
Structure ...................................................................................................................................... 5
1 Chapter 1: Development of Central Asian states .................................................................... 6
1.1 History before 1991 .......................................................................................................... 6
1.2 Initial Conditions in 1991. ................................................................................................ 7
1.3 Development and economic performances since 1990s .................................................. 8
1.3.1 Overview of political development in 1990s ............................................................ 8
1.3.2 Economic development policies in 1990s................................................................. 9
1.3.3 Conclusion .............................................................................................................. 13
2 Chapter 2 -Literature review ................................................................................................. 16
2.1 Concept definition and natural resource characteristics and conditions ........................ 17
2.1.1 Rentier State ............................................................................................................ 17
2.1.2 Natural resource characteristics .............................................................................. 18
2.1.3 Necessary conditions of resource curse .................................................................. 19
2.2 Causal Mechanisms and symptoms of Resource curse in the past studies .................... 19
2.2.1 “Petrolization of the Policy Environment” ............................................................. 19
2.2.2 “Private interest as barriers to change” ................................................................... 22
2.2.3 “The Rentier State as a Barrier to Change” ............................................................ 24
2.2.4 The “Boom Effect” ................................................................................................. 25
2.2.5 Conclusion .............................................................................................................. 27
2.3 Theory ............................................................................................................................ 28
3 Chapter 3 ............................................................................................................................... 35
3.1 Methodology .................................................................................................................. 35
3.2 Data ................................................................................................................................ 37
3.3 Independent and dependent variables ............................................................................ 38
3.3.1 Expected findings.................................................................................................... 40

CE
UeT
DC
olle
ctio
n
iii
4 Chapter 4 ............................................................................................................................... 41
4.1 Securing de jure political powers ................................................................................... 41
4.2 Control of de facto political powers ............................................................................... 43
4.3 Political institutions at (t) 1991 ...................................................................................... 46
4.4 Distribution of resources ................................................................................................ 47
4.5 Evaluation the curse/blessing degree of resource rents and foreign aid ........................ 53
Conclusions. .................................................................................................................................. 57
Appendices:................................................................................................................................... 61
References: .................................................................................................................................... 82

CE
UeT
DC
olle
ctio
n
iv
Table of figures and tables:
Figure 1: Map of Central Asia with international borders ....................................................... 1
Table 1: Curse symptoms 1 ........................................................................................................ 22
Table 2: Curse symptoms 2 ........................................................................................................ 24
Table 3: Curse symptoms 3 ........................................................................................................ 25
Table 4: Boom effect ................................................................................................................... 26
Figure 2: Scheme of Long-Run growth (Acemoglu, Johnson, & Robinson, 2005) ............... 29
Figure 3: distribution of resources ............................................................................................ 32
Figure 4: Map of natural resources in Turkmenistan ............................................................. 52
Figure 5: Turkmenistan resource curse degree ....................................................................... 53
Figure 6: Evaluation of curse effects of foreign aid in Tajikistan .......................................... 55
Table 5: The sample for systematic table of resource curse symptoms ................................. 61
Table 11: Crude oil historical prices ......................................................................................... 80
Table 12: Demographics of Turkmenistan and Tajikistan ..................................................... 81

CE
UeT
DC
olle
ctio
n
1
Introduction.
There are five states in the Central Asia: Kazakhstan, Kyrgyzstan, Tajikistan, Turkmenistan and
Uzbekistan. All five nations share similar history. Before the Tsarist take-over, none of the nations
had a nation-state experience. The territorial borders of the states were only set under Soviet ruling.
Kazakhstan, Kyrgyzstan, Tajikistan, Turkmenistan and Uzbekistan gained their independence
from Soviet Union in the year of 1991(Anderson, 1997; Gretsky, 2003; Najman et al., 2008; R. W.
T. Pomfret, 2006). Thus, all five states share a common starting point in establishing nation-states
(R. W. T. Pomfret, 2006).After the collapse of the Soviet Union, all five states adopted similar
political regimes and institutions.
Figure 1: Map of Central Asia with international borders
(Nations Online Project, http://www.nationsonline.org/oneworld/map/central-asia-map.htm)

CE
UeT
DC
olle
ctio
n
2
According to Mahdavy (1970) resource revenues and foreign aid are considered as external rents.
All five states in Central Asia are dependent on some form of external rent. Three of five states,
Kazakhstan, Turkmenistan and Uzbekistan are labeled as resource-cursed states due to their
heavily dependence on oil and gas exports. Remaining two, Kyrgyzstan and Tajikistan do not
possess wealth in hydrocarbon minerals. Therefore, these two republics remained dependent on
foreign aid and external debt. Thus, the development of economic policies and economic
performances in all five states deviated throughout the time.
All Central Asian states have ethnic and clannish divisions within the population. According to
Karl (1997) and Ross (2006), existence of external rents intensifies ethnic cleavages and could
even spur civil war within the state (Ross 2006). Yet, resource-rich states in the region did not
experience civil war or revolution. Tajikistan and Kyrgyzstan are the only states that experienced
massive civil unrest. Kyrgyzstan has civil war that continued on and off throughout the most of
1990’s. Kyrgyzstan underwent two revolutions, Tulip revolution in 2005 and Second Kyrgyz
Revolution in 2010. Therefore, there derives a question: Which form of external rents, resource
revenues or foreign aid have had more curse effects in Central Asia?
Relevance of the study, hypotheses and methods
In the last two decades, many studies have been conducted in the phenomenon of “resource curse”.
Classic scholars of resource curse phenomenon, such as Mahdavy (1970), Karl (1997) and Ross
(1999) claim that dependence on any kind of external rents, including revenues from hydrocarbon
reserves and foreign aid, hinders socioeconomic development. Scholars such as Karl (1997)
provide resource boom in 16th century Spain and 19th century Venezuela and Nigeria as classic
examples of resource curse phenomenon. In addition, Ross (2006) theorizes that conflict over the

CE
UeT
DC
olle
ctio
n
3
distribution of resource rents can intensify already existing ethnic or clannish cleavages and even
result a civil war. The concentration of resources in a single region creates the threat for secession
The assumption of the study is that resource rich Central Asian states managed external rents better
than Kyrgyzstan and Tajikistan with foreign aid and what the aforementioned classic scholars
theorized on the hydrocarbon curse phenomenon. Therefore, the research question above reveals
several separate sub-questions: Who controls the distribution of resources? How did Central Asian
states use their external rents? And in what aspects do the resource-abundant Central Asian states
deviate from the findings of traditional external rent studies?
The hypotheses regarding the curse degree of foreign aid and hydrocarbon wealth are following:
H0: More dependent on foreign aid the state is, less control it has over its distribution.
H1: More hydrocarbon wealth the state possesses, more people and interest groups it can satisfy
and more power it has.
The deviation of resource-rich Central Asian states from the classic examples of Venezuela and
Nigeria during the resource boom period is hypothesized as following:
H3: Resource rich Central Asian states directed investments in savings fund and other production
sectors to avoid the stagnation of the economy.
The study applies the method of congruence and process tracing (van Evera, 1997) by reading the
history forward (Cappocia and Ziblat, 2008). In the method of congruence the researcher intends
to discover deviation in similar independent and dependent variables. In the method of process
tracing, the study investigates the chain of events that led to the deviation of the study variables.
Principal findings and contribution
Tajikistan did and does not have hydrocarbon wealth. Thus, the elite did neither have resources to
control nor distribute. Moreover, due to the clannish divisions the government did not control the
military power of the state. Consequently, the elite had weak control over the de facto political

CE
UeT
DC
olle
ctio
n
4
powers. Due to the disoriented socioeconomic conditions after the collapse of the Soviet Empire,
unsatisfied demands, rising clannish tensions, and mismanagement of rents, Tajikistan
experienced the civil war.
Considering resource-rich states of the region, the elites of Kazakhstan, Turkmenistan and
Uzbekistan came into power controlling the ownership over the natural resources. The presence of
hydrocarbon wealth attracted investments from other national governments and international
financial institutions. Thus, not only resource rich Central Asian governments, but also external
actors invested in development of hydrocarbon production sector. Consequently, the elite had more
revenues to distribute. In addition, resource rents allowed the elite to secure its power by
strengthening the security sectors and adopting its own desired political and economic institutions.
Unlike Venezuela, Nigeria and Spain during the resource boom, Central Asian states did not
stagnate agriculture. Therefore, Kazakhstan, Turkmenistan and Uzbekistan did not rely on imports
of foods and staples. The states could feed their own population. Moreover, resource-abundant
governments of the region direct cash flows into savings fund and kept up with payments of
external liabilities. Thus, the degree of resource curse in Central Asia is less than what Mahdavy
(1970), Karl (1997) and Ross (1999, 2006) claimed in their studies as common resource cursed
states.
The contribution of the research is expansion of rentier state theory and resource curse
phenomenon studies. In addition, the study, for the first time, presents the degree of rentier state
by comparing two forms of external rents, resource rents and foreign aid in Central Asian states.
The research compares two cases, resource-rent dependent Turkmenistan and foreign aid
dependent Tajikistan from 1991 till present. Similarities in pre-Soviet, Soviet and post-Soviet

CE
UeT
DC
olle
ctio
n
5
history, political structure, and ethnic/clannish composition of all five states make the findings
applicable to the whole region.
Structure
The structure of the paper is following. First chapter of the study provides brief historical
development background of Central Asian states. This information draws out the similarities and
differences of nations in adopting political and economic institutions and development policies.
Second chapter defines necessary concepts. The chapter also provides literature review on resource
curse and rentier state studies. Based on literature, I also design systematic table of curse
symptoms. This table assists in evaluating the curse degree of hydrocarbon rents and foreign aid
in Central Asia. The third chapter covers the theoretical framework. This study makes use of
Acemoglu, Johnson and Robinson’s (2005) theory on the role of institutions in long term growth.
The theory is applied to establish the actor controlling the de jure and de facto political powers,
and explain the choices in political and economic institutions applied since 1991. Moreover, the
chapter provides the theory on the distribution and usage of hydrocarbon rents and foreign aid in
Central Asian republics. This theory assists in mapping how the resources were used in Central
Asia after the collapse of the Soviet Union. In addition, the theory will allow to compare the
blessing and curse effects of external rents. The chapter concludes with description of research
methodology, the scope of the study and the data. Fourth chapter proceeds with findings and results
based on Turkmenistan and Tajikistan. The chapter provides the evaluation of resource curse
degree in Turkmenistan. The paper draws out conclusions with brief summary of aims, findings
and achievements of the research. The conclusions also presents weaknesses and further research
venues in the future.

CE
UeT
DC
olle
ctio
n
6
1 Chapter 1: Development of Central Asian states
This Chapter provides historical background of Central Asian states. The chapter presents how the
new independent republics developed in political and economic dimensions since 1991. The
intention of this chapter is to present what political and economic issues Kazakhstan, Kyrgyzstan,
Tajikistan and Uzbekistan faced and face in their course of establishing nation-state since
independence.
1.1 History before 1991
Prior to the Tsarist take-over, Kazakh, Kyrgyz, Tajik, Turkmen, and Uzbek nations lived in tribes
and clans under the ruling of different kingdoms and empires (Najman et al., 2008). This is one of
the reasons why all five Central Asian states have different ethnic groups from their neighbor states
(especially Kazakhstan and Kyrgyzstan have more percentage of ethnic diversity than other three
states). In early 19th century Russia began its expansion to Central Asia. Lack of unity among
nations as well as tribal and clannish divisions within the five nations made the take-over less
resistible for the Russian Army (Gretsky, 2003). Later, once Russia turned into Soviet Union, after
the Great October Socialist Revolution, all five Central Asian nations were constructed as
republics.
There were fifteen republics under Soviet ruling. Thus, the population of the empire was
heterogeneous. In order to avoid the threats of secession the central government suppressed the
population to maintain peace and stability. The Soviet government used secret police to monitor
and control the people. The elites banned the exercises of national and religious holidays, traditions
and customs (Najman et al., 2008). Therefore, due to such regulations and fear of punishment, the
notion of national identity, during the Soviet era, was absent in all five Central Asian nations.

CE
UeT
DC
olle
ctio
n
7
In political and economic plans, The Soviet government did not incorporate the republics as
separate economies but rather as part of the single unit (DiFranceisco and Gitelman, 1984; Jones
Luong and Weinthal, n.d.; Najman et al., 2008; White et al., n.d.). Each member state specialized
in producing and supplying certain products and services (Najman et al., 2008; R. Pomfret, 2006).
Central Asian region specialized in supplying agricultural goods. Yet, Kazakhstan, Turkmenistan
and Uzbekistan, in addition, exported gas and oil resources. Approximately ninety percent of the
total production was being sent to Moscow for redistribution purposes among fifteen Soviet
republics.
1.2 Initial Conditions in 1991.
In 1989, the Soviet Empire started to collapse. In 1991, Kazakhstan, Kyrgyz Republic, Tajikistan,
Turkmenistan and Uzbekistan claimed to become independent states. The sudden collapse of the
Soviet Union left the Central Asian states in politically and economically disoriented conditions
(Akiner, 2004; Gill, 2000; Najman et al., 2008; R. Pomfret, 2006; R. W. T. Pomfret, 2006; Rosser,
2006; White et al., n.d.). According to Pomfret (2006) the five nations faced three major economic
shocks.
First was ‘transition from central planning’ (Najman et al., 2008; R. Pomfret, 2006). Due to the
specialization in producing and supplying certain type of goods, each of the new independent states
had several underdeveloped economic sectors. Thus, none of the new independent Central Asian
republics could fully sustain its population. Second major economic shock was the disruption of
supply of goods and services (Ibid). Due the fact that there were some underdeveloped economic
sectors, Central Asian republics were dependent on the other member states from the former Soviet
Empire for the supply of certain goods, such as machinery, medical supplies and etc. The end of
the Soviet ruling disrupted the supply of such products (Gill, 2002; Jones Luong and Weinthal,

CE
UeT
DC
olle
ctio
n
8
n.d.; Najman et al., 2008). Third major shock was hyperinflation (Pomfret, 2006). Kazakh, Kyrgyz,
Tajik, Turkmen and Uzbek governments tried to keep the ruble as a common currency (Pomfret,
2006; and 1996). As a result, hyperinflation developed immediately after the collapse of the
Empire.
These three economic shocks increased the unemployment and poverty rates drastically in Central
Asia. The new independent republics needed to structure their own independent nation-states
urgently (Civil Society and Political Change in Asia: Expanding and Contracting Democratic
Space, 2004; Gill, 2002; Grzymala-Busse, n.d.; Møller, n.d.; Najman et al., 2008). Taking into
consideration the lack of experience as an independent state, all five Central Asian nations had to
construct entire political arena, foreign policies and public administration from the scratch (R.
Pomfret, 2006). Nevertheless, the new independent republics had to develop their foreign, fiscal,
economic and international trade policies immediately to secure foreign aid and investments.
Kazakhstan, Turkmenistan and Uzbekistan especially were in need of foreign services in order to
extract and export gas and oil resources.
1.3 Development and economic performances since 1990s
1.3.1 Overview of political development in 1990s
Thus, the year of 1991 was a common starting point in course of political, social and economic
development for all five Central Asian states. Four of the republics, Kazakhstan, Kyrgyzstan,
Turkmenistan and Uzbekistan had peaceful transition. Tajikistan is the only case to experience two
civil wars, in 1992-93 and in 1996-97. Kyrgyzstan, however, underwent two revolutions, Tulip
revolution in 2005 and Second Kyrgyz Revolution in 2010.

CE
UeT
DC
olle
ctio
n
9
All five states adopted the same political regimes. The first national leaders of the republics were
former first secretaries during the Soviet Union. The executive branches in all three countries have
been dominant over the other two, judicial and legislative, branches since independence. The heads
of the states have full power to appoint and dismiss the ministers. The presidents are also in control
of the national army and all other security forces. In addition to aforementioned powers, the leaders
of the Central Asian states have been in control of designing and implementing political and
economic policies and institutions.
1.3.2 Economic development policies in 1990s
The first major economic shock that Central Asian republics were faced to solve was
hyperinflation, which developed immediately in1991 (Pomfret, 2006 and Pomfret, 1996). By 1993
four of the states, Kazakhstan, Kyrgyzstan, Turkmenistan and Uzbekistan introduced their own
national currency (Anderson, 2003; Gill, 2002; Grzymala-Busse, n.d.; Møller, n.d.; Najman et al.,
2008; R. W. T. Pomfret, 2006). Tajikistan adopted its national currency only by 1995; because it
was still dealing with the aftereffects of the civil war from 1992-93. However, adoption of currency
was not enough to stabilize the inflation. Neither was it sufficient to stabilize the overall economic
conditions in any of the states.
Kazakhstan, Turkmenistan and Uzbekistan are resource-rich states in the Central Asia. Although,
these three republics made use of their hydrocarbon wealth in building their own nation-states,
they led rather slow economic transition than did their resource-poor neighbor, Kyrgyzstan. All
the resource-rich governments adopted rentier economy instead of market economy. Thus, the
resource rents were mostly spent internally for consumption purposes (Curtis, 1997; Heritage
foundation, 2015 (http://www.heritage.org)). All three republics had wide range of social benefits,
such as flat income tax rates, free healthcare, education, free/cheap utilities and others. In addition,

CE
UeT
DC
olle
ctio
n
10
due to their resource abundance, GDP decline, in early 1990s, in resource-rich economies of the
region was not as severe as in the other two non-resource-rich republics. Yet, interestingly enough
none of the resource-rich states could manage to stabilize the inflation rate until 1996-1998 (Table
6, 7, 8). Kyrgyzstan was the only republic in the region to decrease inflation to 42.03% by 1995
(Table 10).
In Turkmenistan, adoption of national currency and first wave of privatization period altered the
GDP growth rate from -4.60% to 1.50% in 1993 (Table 6). Yet, decline in oil prices in the world
market decreased the GDP to -17.30% in 1994 from 1.50 in 1993(Table 6 and Table 11: Oil
historical prices). Consequently, the fell of oil prices worsened the GDP growth rates of the other
two resource-rich republics, Kazakhstan and Uzbekistan (Table 7; 8; & 11). In addition,
Turkmenistan’s dependence on Russian pipelines for the exports of gas and oil hindered the
economic growth of the state. Moreover, the supply of natural gas to the other CIS members for
credit resulted low economic performance until the end of 1990s. In 1997, President Niyazov
disrupted the exports of gas to the CIS members based on conclusions that the earnings would
never be paid off (R. Pomfret, 2006).
Nevertheless, the drastic price increase of oil from 18.40 $/bbl to 22.10 in 1996 (Table 11) and
tight monetary policies of the Central Bank stabilized the economy of Turkmenistan by the end of
1990s. In 1999 Niyazov regained the full control over the Central Bank and increased the
government budget for expenditure according to his own discretion (Gill, 2002; Jones Luong and
Weinthal, n.d.; Møller, n.d.; Najman et al., 2008; R. W. T. Pomfret, 2006). Nevertheless, the
president managed to decrease the dependence on Russian pipelines. Niyazov, initiated the
construction of new gas and oil pipeline routes directly to the targeted states. In addition, despite
high or low economic performances, Turkmen leader adopted and enforced populist policies.

CE
UeT
DC
olle
ctio
n
11
Niyazov provided wide range of social benefits to all the regions of the state, such as free utilities,
health care, education, low housing costs, low credit interest rates and others
Similarly to Turkmenistan, Kazakhstan also had slow economic reforms. Yet, the state achieved
price liberalization and enterprise reforms faster than others (R. W. T. Pomfret, 2006). However,
Russian Crises in 1998 hampered the economic growth of Kazakh economy (Jones Luong and
Weinthal, n.d.; Najman et al., 2008; R. W. T. Pomfret, 2006). Moreover, commodity price shifts
and delayed construction of new pipeline routes for exports of gas and oil resources slowed the
long term development of the state (Ibid). Nevertheless, like Turkmenistan, Kazakhstan also
enjoyed higher resource revenues from the increase of oil prices in the year of 1999. In addition,
discovery of Kashagan, new oil reserve in the same year increased the economic performance of
the state from -1.89% to 2.69% in 1999 and 10% in 2000 (Table 7). Kazakhstan was experiencing
oil boom. In 1999, the Kazakh economy was outperforming all other Central Asian neighbors
(Table 7).
Uzbekistan was the only state with least economic downturn in the region in 1990s (GDP growth
rate -0.49%, Table 8). This is explained due to the maintained public revenues and expenditures
as well as relatively high cotton and gold prices that the state still exported (Crivelli and Gupta,
2014; Jones Luong and Weinthal, n.d.; Najman et al., 2008; R. W. T. Pomfret, 2006). Nevertheless,
the prices for cotton and gold fell in 1995. However, by 1996 Uzbekistan already managed to adopt
open economic reforms. The government liberalized the prices and allowed privatization of
housing and small businesses. This reforms increased the GDP growth rate to 1.70% in 1996 from
-0.90% in 1995 (Table 8). Yet, Uzbek government attempted to further decrease the government
intervention. Thus, the attempt created problems with the accounts payable. The economy of
Uzbekistan started to fall. The Uzbek government once more regained the full state control over

CE
UeT
DC
olle
ctio
n
12
the economy and adopted tight exchange rate regulations. Strict constraints of exchange rates
widened the gap between the official and black market rates. Thus, the state developed major
capital misallocations. The GDP growth rate of the state slowed down to 4.3% in 1998 from 5.19%
in 1997.The negative effects of exchange rate was managed by 2003. Although, the GDP growth
rate increased to 7.3% in 2004 from 4.19% in 2003 (Table 8), Uzbek economy, as government
officials claim, remained slow due to the Andijan massacre in 2005 (Gill, 2002; Grzymala-Busse,
n.d.; R. W. T. Pomfret, 2006).
Tajikistan and Kyrgyzstan, unlike their three resource-rich neighbors, had to depend on foreign
aid and external debts to build their nation-states. However, unlike Kyrgyz Republic, Tajikistan
started to experience civil war in 1992. The war between Islamist/democratic coalition and the
ruling Communist elites in the beginning of 1990s not only disrupted implementation of any new
economic policies but also worsened the initial conditions from the collapse of the Soviet Union
(Anderson, 2003; Gretsky, 2003; R. W. T. Pomfret, 2006; Heritage foundation report, 2015).
Outbreak of the war further decreased the GDP growth rate to -29% in 1992 from -7% in 1991
(Table 9). By 1997, there were 100,000 casualties and 1.2 million refugees.
The official development assistance and aid started to inflow immediately. The net inflow of
foreign assistance and aid reached $85,940,000 in 1997 from $11,840,000 in 1992. Tajik
government could not borrow long term debt due to its low credit worthiness. Nevertheless, Tajik
elites kept borrowing short term debts from Russia and Uzbekistan. The short term debt eventually
accumulated large external debt that was 128% of the GDP (debt/GDP ratio) by 1999. Although
the Peace Accord was signed and the war ended in 1997, foreign investors still remained hesitant
to finance any development projects in Tajikistan (Najman et al., 2008). Tajik government and

CE
UeT
DC
olle
ctio
n
13
economy only survived due to the foreign aid from international financial institutions, such as
IMF, World Bank, EBRD, OSCE and others.
Unlike Tajikistan, Kyrgyzstan had several sources of revenues during the 1990s. Due to the high
rate of unemployment, more people migrated back to their villages. Thus urban-rural migration
increased the labor force in agriculture sector. Consequently, the value added of the farming
increased drastically from -7.7% to 15% of GDP (Table 10). Although, Kyrgyzstan was the first
to adopt market economic institutions, their practicality was and still is debated among scholars
(R. Pomfret, 2006). For example, from 1995 to 1997 the Kyrgyz economy experienced 15%
growth rate (Table 10) (“Kyrgyz Republic Economy: Population, GDP, Inflation, Business, Trade,
FDI, Corruption,” n.d.). However, this success is also attributed to Kumtor gold mine project (Gill,
2002; Jones Luong and Weinthal, n.d.; Najman et al., 2008; White et al., n.d.). In addition, when
the Kyrgyz republic experienced earthquake in 2002, the gold mine was disrupted. The economic
growth rate leveled to 0 (Table 10). Yet, acceptance to the World Trade Organization, in 1998,
had positive contribution to the GDP growth rate. The value added of international trade grew to
99% in 1999 from 84% in 1997 (Table 10).
1.3.3 Conclusion
Independence in 1991 was the same starting point for all five Central Asian states in building their
own statecrafts. At the beginning of 1990s all the states adopted similar economic development
policies as they faced the same economic problems, such as hyperinflation, high rate of
unemployment, poverty, disruption of supply of goods and services, lack of personnel, disoriented
bureaucracy and many more (Gill, 2002; Grzymala-Busse, n.d.; Jones Luong and Weinthal, n.d.;
Møller, n.d.; Najman et al., 2008). Yet, at the turn of the century the economic policies and
performance started to differentiate from state to state in the region.
CE
UeT
DC
olle
ctio
n
14
Three states of the region, Kazakhstan, Turkmenistan and Uzbekistan are resource-rich,
specifically in gas and oil. Revenues from natural resources allowed rather rapid pace of growth
for these states. In addition, because of oil and gas abundance leaders did not have to burden the
citizens with high tax rates. Revenues from hydrocarbon reserves allowed the elite to spend
excessively on building and strengthening political and economic institutions and provide wide
range of social benefits for free, such as free healthcare, free education, free utilities, low housing
costs and many more (Najman et al., 2008; R. W. T. Pomfret, 2006). With such patronage,
government strengthened its presence and controlled all economic sectors.
Kyrgyzstan and Tajikistan, mostly had to rely on foreign aid and external credit to build their own
nation-states. Kyrgyzstan had successful Kumtor gold mining project which promoted economic
growth from the year of 1995 (Table 10). Yet, the earthquake in 2002 disrupted the gold mine and
leveled the growth rate to 0 (Table 10). Kyrgyz and Tajik governments accrued large amount of
external debts. In addition, these two states are only cases that experienced civil wars (Tajikistan
most of 1990s) and revolutions (Kyrgyzstan in 2005 and 2010) in Central Asia. However, all five
republics have adopted similar political regimes - presidential systems with dominant power over
legislative and judicial branches.
Therefore, there derives a question: Which form of external rents, resource revenues or foreign
aid have had more curse effects in Central Asia? The assumption of the study is that resource rich
Central Asian states managed external rents better than Kyrgyzstan and Tajikistan with foreign aid
and what the aforementioned classic scholars theorized on the hydrocarbon curse phenomenon.
Therefore, the research question above reveals several separate sub-questions: Who controls the
distribution of resources? How did Central Asian states use their external rents? And in what

CE
UeT
DC
olle
ctio
n
15
aspects do the resource-abundant Central Asian states deviate from the findings of traditional
external rent studies?

CE
UeT
DC
olle
ctio
n
16
2 Chapter 2 -Literature review
Before attempting to answer the aforementioned questions, it is important to review the past studies
on rentier state, external rents and the resource curse phenomenon. Thus, the following chapter
provides the literature review, definitions of important concepts and causal theories on the topic.
The chapter concludes with applied theoretical framework of this study.
There is a large body of studies, with empirics from both positivist and case study approaches,
focusing in rentier state and “resource curse” phenomenon. The traditional theory implies that
external rents have negative impact on three dimensions: economic, social and political institutions
of the state (Mahdavy, 1970; Karl, 1997; Ross, 1999; Ross, 2001; Sachs and Warner, 2001; Smith,
2004; Goldberg, Wibbels, and Myukiyehe, 2008; Norman, 2008; Ross, 2009; Aslaksen, 2010;
Bruckner, 2010; and Ramsay, 2011). One of the scholars who based the foundations of resource
curse phenomenon is Terry Lynn Karl (1997). Karl (Ibid) provides Latin American and African
hydrocarbon-rich states as empirical evidence of states that failed in all three dimensions. Karl’s
main argument is that growth dependent on commodity revenues inhibits changes in property
rights, power of interest groups, and the role of the state (Karl, 1997).
Yet, there are also scholars who claim that under different conditions the effects of natural
resources vary in different countries (Stevens and Dietsche, 2007; Anshasy and Karsaiti, 2013;
Holden 2013; Jafari, 2013; Elbadawi and Soto, 2014; Gillespie and Henry, 1995; Bayulgen, 2005;
Dunning, 2008; Oskarsson and Ottosen, 2010; and Costa and dos Santos, 2013). Rulers from oil-
rich Arabian Peninsula, for instance, had a success in preserving authoritarian regime. States such
as Iraq did not, but neither had they success in establishing consolidated democracy. Wacziarg
(2012), in his empirical study over wide range of resource-rich countries in 25 year time period
analysis, succeeded in rejecting Friedman’s (2000) “The First Law of Petropolitics”. Wacziarg

CE
UeT
DC
olle
ctio
n
17
(Ibid) claims that there is no correlation between the rise of oil price and fall of freedom. Thus, in
order to understand how the resources can be a blessing or curse for the state, it is necessary to
review the causal mechanisms covered in the resource curse literature.
The following sections reviews the literature and at the same time present several important
resource curse concepts such as rentier state, petrolization of the state and others. The sections
also describe necessary conditions, causal mechanisms and curse symptoms of resources. The
literature is categorized according to the causal mechanisms and curse symptoms from Terry Lynn
Karl’s “The Paradox of Plenty: Oil Booms and Petrostates”. Because, Karl (1997) manages to
provide all the necessary concepts and causal mechanisms that influence political and economic
institutions. In addition, this study develops a systematic table to evaluate resource curse degree
based on Karl’s description of curse symptoms and the indicators where curse effects can be
observed. Thus, Karl’s work makes it easier and more comprehensible to categorize and link past
studies according to their study variables on resource curse phenomenon.
2.1 Concept definition and natural resource characteristics and conditions
2.1.1 Rentier State
Yet, before proceeding to the literature, it is important to define the most important concept of this
study – rentier state. In addition, it is necessary to present some characteristics of natural resources
and the necessary conditions to have rentier state.
Hossein Mahdavy introduced the concept of rentier state in the “The Patterns and Problems of
Economic Development in Rentier States: the Case of Iran” in 1970. Author (Mahdavy, 1970)
defines the rentier states as: “[…] those countries that receive on a regular basis substantial
amounts of external rent.” Mahdavy (Ibid) defines the external rents: “[…] as the rentals paid by
foreign individuals, concerns or governments to individuals, concerns or governments of a given

CE
UeT
DC
olle
ctio
n
18
country. Author (Ibid) gives an example of fees paid on transiting ships and oil exports through
the transit canal and pipelines in Middle Eastern countries. Mahdavy (Ibid) labels the oil revenues
as form of external rents. Author argues that even though some scholars consider oil revenues as
compensation for the extraction of non-renewable wealth, the resource rich states enjoy revenues
from “differential and monopolistic rents” of hydrocarbon wealth (Ibid). Author provides an
illustration of Iran, Kuwait and others that benefited from the oil extraction and exports.
Mahdavy (Ibid) also adds that external rents allow the governments to avoid accruals of debts
payable and inflation. Moreover, author adds that the oil revenues lead to the faster expansion of
public sector. Because, the resource-rich government’s expenditure depends more on oil extraction
and export and less on the revenues from taxes and loans. Thus, the government presence in the
economy of the state increases. Yet, with more dependence on oil exports leads to the stagnation
of other production sectors and export goods. Hence, the resource rich state commences to depend
more on imports. However, one of the characteristics of hydrocarbon abundance is its non-
renewability. Thus, oil rents are not constant source of revenues and do not promote long term
growth.
2.1.2 Natural resource characteristics
There are several other resource characteristics that are necessary to mention. One such
characteristic is that resource revenues are subject to a situation change (Karl, 1997.; Rosser,
2006). For example, windfall gain situation will result more hydrocarbon revenues. Resource
sectors are not labor intensive. Thus, they are not produced but extracted. In addition, there is no
high variable cost in extraction. Hence, the amount of resources sold minus the marginal costs
equals to the amount of resource revenue (Ross, 2009, 2000, 1999). Another characteristic, which
was mentioned before, is that hydrocarbon reserves are non-renewable wealth (Ibid). Thus,

CE
UeT
DC
olle
ctio
n
19
resource rents are limited to the amount of reserves in the land (Alexeev and Conrad, 2011; Karl,
1997; Ross, 2009, 2000, 1999). In other words, resource revenues are not permanent.
Similar to natural resources, foreign aid is aid is also limited in terms of its amount. In addition,
foreign aid is also subject to the situation change. For example, if corruption is widespread in the
state, international actors can limit the flow of foreign aid.
2.1.3 Necessary conditions of resource curse
There are certain conditions that must be present for the state to be rentier state. Luciani and
Beblawi (1990) provide four such conditions:
1) Rent situations predominant
2) The rentier economy is an economy which relies on a substantial external rent.
3) Only few are engaged in the generation of this rent, the majority being involved in the
distribution or the utilization of it.
4) The government is the principal recipient of the external rent in the economy.
(Luciani & Beeblawi, 1990)
Thus, according to Luciani and Beblawi (1990), Turkmenistan and Tajikistan are rentier states.
Both economies are dependent on external rents. Turkmenistan is dependent on oil and gas exports
while Tajikistan is dependent on foreign aid and external debt.
Now, the research turns to discuss the literature linked to Terry Lynn Karl’s (1997) causal
mechanisms of resource curse and their symptoms.
2.2 Causal Mechanisms and symptoms of Resource curse in the past studies
2.2.1 “Petrolization of the Policy Environment”
Terry Lynn Karl (1997) in his book of “The Paradox of Plenty: Oil Booms and Petrostates”
emphasizes on studying the interaction of structure and the agency. Karl (Ibid) argues that in a
given period of time the analysis of structure and agency relationship can reveal the range of policy

CE
UeT
DC
olle
ctio
n
20
choices that elites faced at time (t). Author proposes “Petrolization of the Policy Environment”
(Ibid) as one of the policy choices of resource rich states.
Karl (Ibid) argues that all oil rich states that are dependent on petrodollars hinder the
implementation of in property rights. Author describes the gold-boom in the 16th century Spain
and oil-boom in 19th century Venezuela for illustrations (Ibid). Karl (Ibid) argues that these states
stagnated other producing sectors because, the elite invested in oil producing sector and decreased
the competitiveness of other exported goods and economic sectors. Thus, all producing enterprises,
small or big, became discouraged to produce. Following, general consumption expenses increased
and became dependent on petrodollars. Petrolization in both states, Spain and Venezuela,
stagnated the development of agricultural sector and imported food and staples to supply the
population. Authors describes that Venezuela spent excessively in order to catch up to the US
standards of living. Karl (Ibid) states that Spain and Venezuela used the resource revenues to
expand the military forces as a symbol of powerful state in the region. In practice, elites bought
the military loyalty in order to secure their power and repress the population (Ibid). In case of lack
of capital the resource rich government borrowed foreign money and services with a promise to
pay from future resource rents. Therefore, Spain and Venezuela did not have any savings funds to
pay neither external nor domestic debts. As the result, the government accumulated large monetary
and service debts. Once the gold sources were depleted in Spain and prices for oil fell, both
countries experienced economic crises (Ibid). Consequently, Karl (Ibid) claims “petrolization of
the policy environment” hinders the enforcement of property rights which inhibits the economic
growth in the long term.
In line with enforcement of property rights and stagnation of other economic sectors, Corden
(1984), Gylfason et al (1999), Herbertsson et al (1999) and Frankel and Romer (1999) add that

CE
UeT
DC
olle
ctio
n
21
resource revenues leads to overvaluation of exchange rate. Consequently, it leads to inability to
compete in other production sectors. In other words, the volume and the variety of products in
exports decrease. Consequently, resource rich states switch to developing resource driven sectors
and exporting resource based products. We have already seen such example above. Venezuela
switched from agriculture driven exports to oil driven exports once it discovered oil reserves. At
the end, the state completely stagnated other production sectors. When the oil prices fell,
Venezuela could neither supply its nation with food nor bail the economy out of the crises. Because
agriculture remained underdeveloped and there was no reserve funds.
Crivellu and Gupta (2013), Bhattacharyya and Collier (2014), based on empirical study, also
concluded that GDP increase from resource revenues have negative impact on domestic revenues
and public capital stock. Najman, Pomfret and Raballand (2010) found that developing states with
resource abundance rarely improve citizens’ lives equally and for long term. Citizens are limited
in freedom of property rights. Authors claim that the elite of resource rich states, instead, chooses
to use the resource rents to provide patronage and invest in “showy projects”.
However, institutionalist scholars such as Mehlum, Moene and Torvik, (2006) and Sambit
Bhattacharyya and Roland Hodler (2013) claim that such petrolization of the state depend on the
quality of political institutions. Scholars argue that if political institutions are weak then natural
resource revenues deteriorate rule of law and contract enforcement. Thus, it leads to high
expenditure and low financial development. Rational choice theory proponents also Wantchekon
(2002) and Caselli arrive to similar conclusion. Authors argue that rent seeking behavior of the
elites hinders the development in human capital, and investments in long term growth projects. In
addition to the counterargument of overvaluation of exchange rates, Egert and Leonard’s (2007)
empirical study concluded that resource revenues do not affect the exchange rates.

CE
UeT
DC
olle
ctio
n
22
Nevertheless, based on the literature covered above it can be concluded that external rents hinder
the exercise of property rights which leads to the misallocation of resources. Thus, the following
systematic table will look as following.
Table 1: Curse symptoms 1
Heavy investment in
development of resource
sector
Yes
High number of Exits of
private businesses
Yes
Dominating percentage of oil
and gas rents
Yes
High imports of goods Yes
Stagnation of agricultural
sector
Yes
High food imports Yes
High expenditure on military Yes
High total external debt Yes
Low or no gross domestic
savings
Yes
Low investment in public
capital stock
Yes
Overvaluation of exchange
rates
Yes
Low or no diversity of export
sector
Yes
2.2.2 “Private interest as barriers to change”
Second mechanism of resource curse effect is “Private Interest as Barriers to Change” (Karl, 1997).
Author (Ibid) argues that oil driven states create certain social classes whose interests and gains
are linked to the oil and dominant over the interests of general public. These classes support the

CE
UeT
DC
olle
ctio
n
23
“Petrolization of policy environment” (Ibid). In other words, these interest groups are in favor of
expanding the hydrocarbon producing sector.
Karl (Ibid) also gives an example of rent seeking warlords and settlements near the oil fields in
Venezuela and Nigeria. Author claims that concentration of resources in specific region divides
the society. Resource-rich region of the state desires to use the hydrocarbon wealth in its own
development without sharing it with poor region. In Nigeria, regional war lords engaged in
physical violence over the distribution of resource rents. Thus, if the state does not control the
distribution of resources, resource rents can be reason for cleavages between rich and poor regions
and among regional warlords (Sachs and Warner, 1995; Sachs and Warner, 2001; Gylfason, 2001;
Papyrakis and Gerlagh, 2004; Gylfason and Zoega, 2006; Papyrakis and Gerlagh, 2007; Zhang et
al, 2008; Mehrara, 2009; Shao and Qi, 2009; Shao and Yang, 2010 and James and Aadland, 2011;
and Elbadawi and Soto, 2014).
In line with regional cleavages over the distribution of resources, Dunning (2008), Elbadawi and
Soto (2014) claim that resource abundance can even promote civil war among resource rich and
resource poor regions within the state. Elbadawi and Soto (2014) provide robust and positive
empirical evidence between “resource rents per capita and the occurrence of an armed civil
conflict.” Palley presents Sudan and Indonesia as two cases where natural resources create tensions
between different tribes and regions. Authors (Ibid) argue that disagreement in distribution of
resource revenues can also intensify existing ethnic divisions and even lead to the demand of
secessionism.
Foreign aid also can intensify the ethnic cleavages. Foreign aid is form of external rent which is
limited in amount. In addition, rent seeking behavior of elites will influence its distribution not

CE
UeT
DC
olle
ctio
n
24
only in the population but also within the government. The leader will have to keep his supporters
loyal in order to secure his power.
Concerning the oil rents, Obeng-Odoom (2012), based on study of Skondi-Takoradi in West
Africa, argues that oil in ethnically diverse society can also be a blessing depending on how society
shapes and defines the power relations and institutions. Elbadawi and Soto (2014) state:” […],
good economic and political institutions reduce the hazard of conflict.”
Hence, from the literature above the following table of symptoms of external rents can be drawn:
Table 2: Curse symptoms 2
Concentration of natural
resource in one region
Yes
Creates rich – poor regional
cleavages over the
distribution of resources
Yes
Creates/intensifies violent
form of political unrest/ civil
war
Yes
Threat for Secessionism Yes
Petrolization of the state Yes
2.2.3 “The Rentier State as a Barrier to Change”
Third, Karl (Ibid) causal mechanism is “The Rentier State as a Barrier to Change”. Author claims
that resource rich government implements high cost distribution policies based on oil revenues,
which “[…] expands state jurisdiction and weakens authority” (Ibid). Karl describes Venezuela as
a rentier state. The Venezuelan elites lowered the tax rates and provided wide range of social
benefits to decrease the pressure of accountability. However, once the price for oil fell and rents
decreased, the government tightened the budgets of the welfare programs and directed it toward
government spending. The supply of social benefits decreased substantially. As the result, it led to
further decrease of the government capacity (Ibid). In other words, government could not enforce

CE
UeT
DC
olle
ctio
n
25
the policies and regulations in all the territorial areas of the state. Hence, we can draw the table for
curse symptoms as following:
Table 3: Curse symptoms 3
High general government
final consumption
expenditure
Yes
High central government
debt
Yes
High budget for supply of
social benefits for free. Ex:
Free health care, free
education, low housing
costs, cheap utilities and etc
Yes
If price for oil falls, high
general government final
consumption expenditure
Yes
If price for oil falls, High
budget for supply of social
benefits for free. Ex: Free
health care, free education,
low housing costs, cheap
utilities and etc
No or decreases substantially
2.2.4 The “Boom Effect”
The last causal mechanism that Karl (1997) presents is “Boom Effect”. The oil rich states which
are heavily dependent on oil revenues develop illusions of self-development. Karl (Ibid) states that
once the leaders of oil rich states start gaining revenues they start spending on luxurious
infrastructure projects. Author argues that the elite takes total control over political and economic
institution designs and implementations. In addition, the incumbents shape political institutions to
their own favor leaving no room for competition for a challenger in elections. Such behavior
encourages the challenger to compete through politically violent means. As the result, the state
experiences political instability

CE
UeT
DC
olle
ctio
n
26
Caselli (2009) also claims that challengers in resource rich states are more motivated to change the
leadership by force. Therefore, incumbents limit the rights and freedoms of citizens in establishing
political in order to secure their power. Michael Ross (1999), by applying statistical tools for over
200 states, establishes that resource rich governments implement low tax rates and patronage in
order to decrease the level of accountability. Thus, it is most likely to be observed that there are
low number of protests in resource rich states. In addition, Karl (1997) states that due to the rent
seeking behavior and path dependence of institutions, some states do not adopt more constraining
institutions. Author supports his claim describing autocratic institutions in Spain, Venezuela and
Nigeria during resource boom period.
Considering the symptoms and indicators of resource curse, the table for systematic analysis can
be presented in the following manner.
Table 4: Boom effect
High GDP growth rate Yes
Construction of luxurious
infrastructure
Yes
Executive branch dominance/
cult of personality of the
leader
Yes
Autocratic regime Yes
Incumbent and challenger
conflict
Yes
Low freedom for citizens Yes
Dominant single party Yes
No or repressed opposition Yes
Analysis of the past studies reveal that the resource rents are directed toward internal consumption
purposes than to the development of other production sectors. Moreover, resource rich states
develop unbalanced input and output economy with heavy reliance on resource rents. Yet, these

CE
UeT
DC
olle
ctio
n
27
negative outcomes are due to mismanagement of resource rents. In addition, Boschini, Pettersson
and Roine (2013) find, through empirical study, that the resource curse and its reversal depends
on the type of resources. Authors find that ores and metals as primary export goods have more
negative impact on growth than hydrocarbon wealth. Moreover, Haber and Menaldo (2011);
Boschini, Pettersson and Roine (2013); and Bhattacharyya and Hodler (2013) argue that the
proponents of resource curse tend to apply weak resource measures or overlook time-series
analysis as well as counterfactual paths of political development. This distorts the final findings
and concluding interpretations of results.
2.2.5 Conclusion
Concluding, past studies focus on the macroeconomic effects of the resource abundance. As Rosser
(2006) argues, the existing studies on resource curse do not take into consideration the role of
social forces or external political and economic environments in development outcomes of
resource abundant countries. For example, states like Nigeria which were colonized retained the
colonial institutions. Thus, these institutions were one of the reasons of economic downfall.
Moreover, all the aforementioned authors do not mention the cases where resource rich countries
have developing agricultural sector, established reserve funds, low foreign debt and low imports.
The contribution of the research is expansion of rentier state theory and resource curse
phenomenon studies. In addition, the study, for the first time, presents the degree of rentier state
by comparing two forms of external rents, resource rents and foreign aid in Central Asian states.
The research compares two cases, resource-rent dependent Turkmenistan and foreign aid
dependent Tajikistan from 1991 till present. Similarities in pre-Soviet, Soviet and post-Soviet
history, political structure, and ethnic/clannish composition of all five states make the findings
applicable to the whole region.

CE
UeT
DC
olle
ctio
n
28
The research attempts to show not only the positive contribution of natural wealth in terms by
comparing the processes of building nation, redistribution and welfare policies of resource rich
state, Turkmenistan, with non-resource rich country, Tajikistan. In addition, the research will
evaluate the degree of resource curse in Turkmenistan. The illustration of the symptoms in a table
format (Appendix: Table 5) will allow to pin point the contributions of hydrocarbon wealth.
The next section of the chapter will describe the causal theory of contribution of natural resources
in Central Asia after the break-up of Soviet Union.
2.3 Theory
The research question of the study is: Which form of external rents, resource revenues or foreign
aid have had more curse effects in Central Asia? The assumption of the study is that resource rich
Central Asian states managed external rents better than Kyrgyzstan and Tajikistan with foreign aid
and what the aforementioned classic scholars theorized on the hydrocarbon curse phenomenon.
Therefore, the research question above reveals several separate sub-questions: Who controls the
distribution of resources? How did Central Asian states use their external rents? And in what
aspects do the resource-abundant Central Asian states deviate from the findings of traditional
external rent studies?
The hypotheses regarding the curse degree of foreign aid and hydrocarbon wealth are following:
H0: More dependent on foreign aid the state is, less control it has over its distribution.
H1: More hydrocarbon wealth the state possesses, more people and interest groups it can satisfy
and more power it has.
The deviation of resource-rich Central Asian states from the classic examples of Venezuela and
Nigeria during the resource boom period is hypothesized as following:
H3: Resource rich Central Asian states directed investments in savings fund and other production
sectors to avoid the stagnation of the economy.
CE
UeT
DC
olle
ctio
n
29
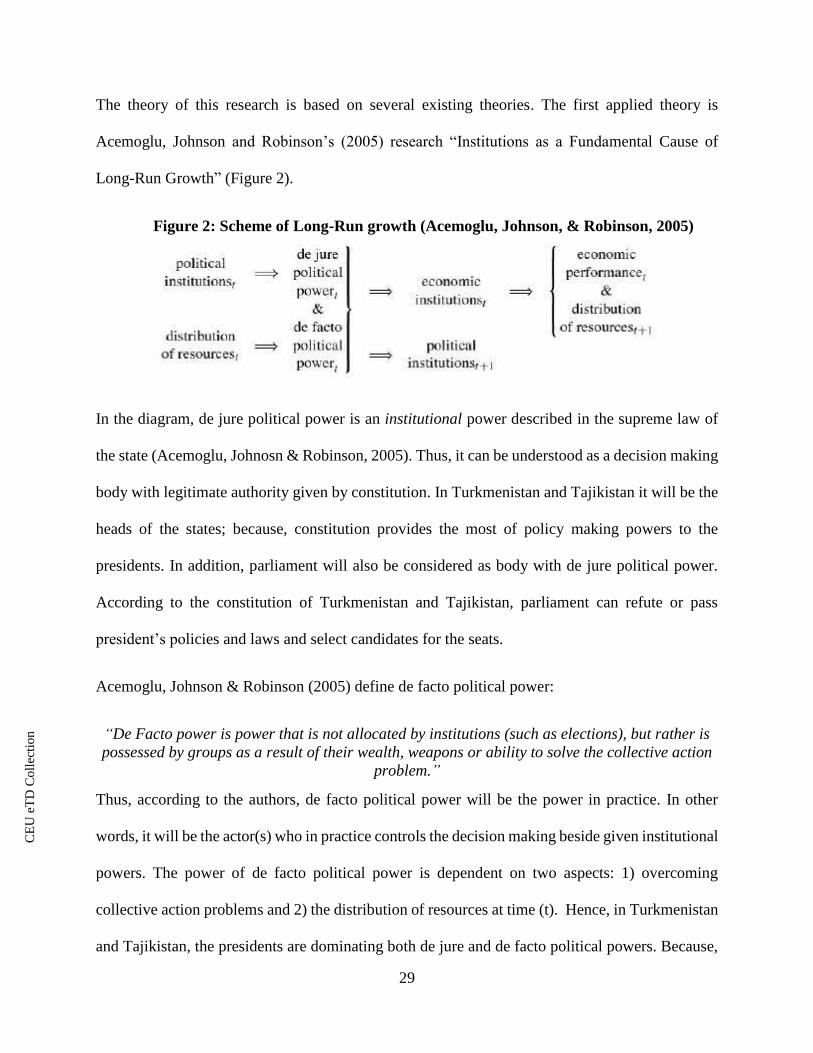
The theory of this research is based on several existing theories. The first applied theory is
Acemoglu, Johnson and Robinson’s (2005) research “Institutions as a Fundamental Cause of
Long-Run Growth” (Figure 2).
Figure 2: Scheme of Long-Run growth (Acemoglu, Johnson, & Robinson, 2005)
In the diagram, de jure political power is an institutional power described in the supreme law of
the state (Acemoglu, Johnosn & Robinson, 2005). Thus, it can be understood as a decision making
body with legitimate authority given by constitution. In Turkmenistan and Tajikistan it will be the
heads of the states; because, constitution provides the most of policy making powers to the
presidents. In addition, parliament will also be considered as body with de jure political power.
According to the constitution of Turkmenistan and Tajikistan, parliament can refute or pass
president’s policies and laws and select candidates for the seats.
Acemoglu, Johnson & Robinson (2005) define de facto political power:
“De Facto power is power that is not allocated by institutions (such as elections), but rather is
possessed by groups as a result of their wealth, weapons or ability to solve the collective action
problem.”
Thus, according to the authors, de facto political power will be the power in practice. In other
words, it will be the actor(s) who in practice controls the decision making beside given institutional
powers. The power of de facto political power is dependent on two aspects: 1) overcoming
collective action problems and 2) the distribution of resources at time (t). Hence, in Turkmenistan
and Tajikistan, the presidents are dominating both de jure and de facto political powers. Because,

CE
UeT
DC
olle
ctio
n
30
they control the military, distribution of resources and policy making environment. In addition, the
elite has influence in the decision making in all the levels of government.
Distribution of resources, in addition to political institutions, influences whose choices of
economic institutions at time (t) will be implemented. It also determines the trajectory of the
political institutions at time (t+1). Therefore, economic performance at (t) and distribution of
resources at (t+1) are dependent on choice of economic institutions at (t) which are determined by
political institutions and distribution of resources. In change of next government the chain repeats
itself with application of institutions at (t+1) as a time (t) base.
Acemoglu, Johnson and Robinson (2005) do not explain how institutions are created or how far
the researcher should investigate in the history. However, authors claim that economic and political
institutions at time (t) are endogenous. Therefore, the assumption is that state inherits political
institutions and economic distribution from prior governing regime whether it was monarchy or
colony.
Acemoglu, Johnson and Robinson (2005) also claim that political institutions are durable and hard
to alter. Especially, if the group controls has the de jure and de facto political powers, it will attempt
to fulfill its own incentives and push forward own economic and political institutions. Yet, authors
also argue that exogenous shocks such as changes in international arena, can influence the political
institutions and the power of de jure political power. Yet, Acemoglu, Johnson and Robinson (2005)
do not mention the examples in controlled regimes.
This theory will assist the research to explain who and how the of most de jure and de facto political
powers were controlled. It will also help to understand the choice of political and economic
CE
UeT
DC
olle
ctio
n
31
institutions adopted since 1991. Hence, the theory will also explain the economic performances in
Turkmenistan and Tajikistan.
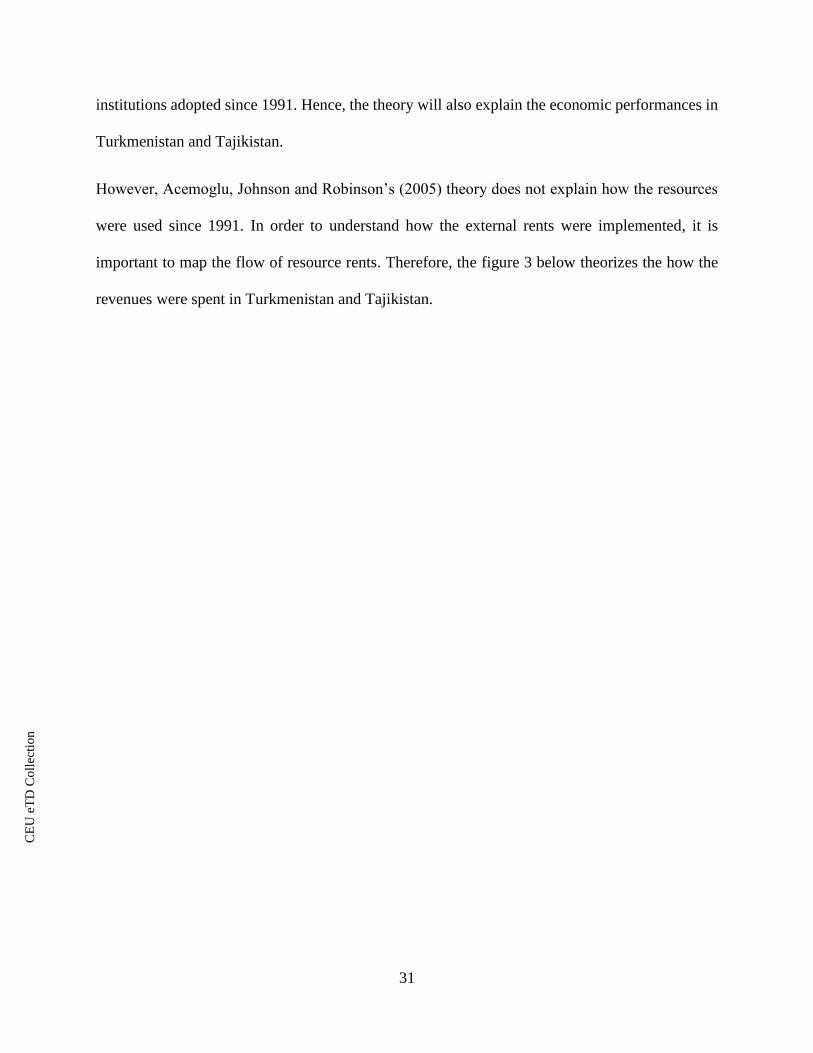
However, Acemoglu, Johnson and Robinson’s (2005) theory does not explain how the resources
were used since 1991. In order to understand how the external rents were implemented, it is
important to map the flow of resource rents. Therefore, the figure 3 below theorizes the how the
revenues were spent in Turkmenistan and Tajikistan.

CE
UeT
DC
olle
ctio
n
32
Figure 3: distribution of resources
Resource rents
b) Low taxes and
patronage – ‘rentier
effect’ Stage I) a) Investment in
security and peace
control
Stage II) a) Investment in
infrastructure
Stage III) a) Establish a
reserve fund
b) Investment in
agriculture
b) Pay off lenders and
maintain low debt
c) Maintain de jure
political power

CE
UeT
DC
olle
ctio
n
33
The scheme is divided into three stages. In the first stage it is theorized that resource-rich Central
Asian states used the revenues to monopolize the means of violence. The elites established and
strengthened national security forces. This would symbolize as being an independent state with
means of defending itself from external enemies. It is also assumed that military and other forms
of security forces were expanded to maintain the peace within the state. Considering the initial
socioeconomic conditions the elites had to provide to improve standards of livings. Thus, the
resource rich states delivered patronage to satisfy the demands of the population. In case of
resource-poor states, the government used the foreign aid to satisfy the demands of the population.
In addition with this patronage, the elite further secured its own power by cleansing the state from
opposition groups and hiring trusted personnel. In this stage we observe curse effects of external
rents.
After establishing its own power and decreasing the level of accountability in front of public, in
the second stage, the elite invested in infrastructure. Although, this is one of the characteristics of
resource curse, this research attempts to show the positive effect of such investment. Because,
building infrastructure can also promote economic development and growth. The study attempts
present that except for new palaces and luxurious government buildings, resource-rich Central
Asian states initiated the construction of new roads, pipelines, factories, textiles and etc., to avoid
the full stagnation of other producing sectors. Thus, investment in infrastructure does not only
stand for curse symptom but also for blessing effect of external rents.
Another blessing effect of resource rents in Central Asia is constraining borrowing and paying off
debts. Unlike, Karl’s description of Venezuela and Nigeria’s investment in showy projects and
accumulation of external debts, the study assumes that Central Asian states managed to keep low
CE
UeT
DC
olle
ctio
n
34
debts with constant payments. This assisted in avoiding the economic crises that Nigeria and
Venezuela (Karl, 1997) experienced after their first fall of the oil prices in the world market.
Third stage is also another argument against Karl’s (1997) theory. This stage involves establishing
the savings fund and investment in agriculture. In the “Paradox of Plenty: Oil booms and
Petrostates” Terry Lynn Karl describes that petrostates did not have savings funds that could be
used to bail out the states in case of oil price declines and economic crises. In case of Central Asia,
the research assumes that the resource rich Kazakhstan, Turkmenistan and Uzbekistan established
official savings funds with regular cash in-flows from resource rents. Investment in agriculture
ensured the Central Asian states with capability to provide food and staples to their own
population. Therefore, the nations were not greatly depended on the imports of agricultural and
food products.
The last sub-question, regarding the deviation of resource-rich Central Asian states from classical
resource-cursed Venezuela and Nigeria in 19th century (Karl, 1997) will be evaluated using the
systematic table constructed in chapter 2, literature review section. Table 5 (Appendices) will assist
to evaluate the degree of external rent curses.

CE
UeT
DC
olle
ctio
n
35
3 Chapter 3
3.1 Methodology
Methodologically, literature on resource curse is heterogeneous. As it has been mentioned before,
most of the literature on “resource curse” concentrate on macroeconomic effects of resource
abundance. Large-N studies allow constructing theories with wider range of coverage. Henceforth,
scholars analyzing large-N data overlook difference in processes and mechanisms where resources
are curse and blessing. In addition, some positivist studies apply weak measurements of resources
and do not account for changes in time series. The positivist studies conducted in region of Central
Asia ran regressions on the data they collected from surveys and panel data. They generate both
primary (surveys collected from 26 post-communist states) and secondary data such as reports
from the US Department of State and World Bank (Gill, 2002; Dawisha, 1997, Dawisha and Parrot,
1997; and Wanye, 2004). Hybrid qualitative and quantitative studies concentrate on the
exploitation of political tools and mechanisms for the expansion of state administration, are rely
upon primary data (Alina-Pisano, 2010; Gryzymala-Busse, 2008; Dunning, 2008; Oskarsson and
Ottosen, 2010; Gillespie and Henry 1995; and Bayulgen 2005).
Institutionalist scholars rely mainly on case studies and primary data, legal institutions (White, Gill
and Slider, 1993; Møller and Skaaning, 2009; Møller 2009; Ishiyаma and Velten, 1998; and
Dosmukhаmedov, 2002; Costa and dos Santos 2013; Holden 2013; Jones, 2002; Grzymała-Busse
2007; and Gаlasinska and Galasinski. 2010, Obeng-Odoom, 2012). These scholars mainly focus
the effects of bad governance and low institutional quality. Therefore, there is scarcely any case
study that describes the utilization of natural resources in building politics and promoting social
and economic development in Central Asia. Moreover, there is hardly any study that compares
how resource rich and non-resource rich state managed to build nation state in Central Asia after

CE
UeT
DC
olle
ctio
n
36
the end of Soviet ruling. Thus, this study will apply case study and congruence procedures and
process tracing methods on cases selected using Mill’s method of difference.
Mill’s method of difference serves as inductive method of theory-making. This method analyzes
cases with similar background characteristics but different values on the variables studied or
presence of different antecedent conditions (van Evera, 1997). The main objective is to discover
the differences in cases. One particular advantage of applying Mill’s method of difference in case
selection is that it aids in reducing and spotting the number of possible causes for different values
in variables (Ibid). There are only five countries in Central Asia. Out of five states, Tajikistan and
Turkmenistan are most compatible due to their ethnic composition and existing clannish divisions
(Table 11). Moreover, Turkmenistan is resource-rich and mainly dependent on oil and gas exports.
Tajikistan, on the contrary, is resource-poor and mainly relies on the foreign aid. Therefore,
analysis of Turkmenistan and Tajikistan are most compatible for the research.
There are five main purposes of case studies: 1) testing theories; 2) creating theories; 3) finding
antecedent conditions; 4) testing the importance of the antecedent conditions; and 5) explaining
cases of intrinsic importance (van Evera, 1997). This study concentrates on testing the importance
of antecedent condition which is testing the contribution of resource wealth in building nation state
in Central Asia.
The format of testing the importance of resource curse in building politics and promoting social
and economic development will follow the steps as described in Van Evera’s book “Guide to
Methods for Students of Political Science” (1997). Author describes these three steps as following:
“1) state the theory; 2) state expectations about what we should observe in the case if the theory is
valid, and what we should observe if it is false; and 3) explore the case (or cases) looking for
congruence and incongruity between expectation and observation.”
CE
UeT
DC
olle
ctio
n
37
In the method of congruence procedures, the researcher looks for the similarities and differences
in or between values on independent and dependent variables. The depdent variables were already
collected in the process of literature review. They are also described below in independent and
dependent variables section.
In the method of process tracing, the study attempts to analyze the chain of events, specifically
how the elites in Turkmenistan and Tajikistan gained control over de jure and de facto political
powers. In addition, the research attempts to analyze how the resource rents and foreign aids were
distributed and applied in the economies. However, in the process tracing method, the study applies
the method of “reading the history forward” proposed by Capoccia and Ziblatt (2010). This means
that the study analyzes the chain of events starting from 1991 and onward instead of investigating
the events backward toward the year of 1991.
3.2 Data
The study mainly analyzes secondary data and, if available, some primary data such as public
budgets, fiscal policies and archives (depends on the access). This study will examine the time
period since 1991. This is the year when all Central Asian countries gained their independence
from Soviet Union. The research also investigates the ethnic and demographic compositions of
both countries. Post-soviet history presented by country webpages and outside historians should
assist in spotting previous ethnic and clannish conflicts, or active opposition between masses and
the government. This will allow to analyze for what reasons there were uprising in one country
and not in the other. Official webpages of organizations such as World Bank.org, OSCE, and others
will provide numerical observations on economic sectors and past development projects that these
two countries overtook. The economic indicators of Turkmenistan and Tajikistan will also assist
in analyzing the curse or blessing degree of external rents. The study makes use of the books

CE
UeT
DC
olle
ctio
n
38
concentrating on the historical events of and developments of Central Asia. This data will allow
to discover how the states developed and what political and economic policy choices were adopted
since 1991.
3.3 Independent and dependent variables
Turkmenistan and Tajikistan have similar ethnic composition and clannish culture. Both republics
have similar political regimes. In both states, president is a dominant figure in all the levels of
government. Moreover, Turkmenistan and Tajikistan are both rentier states. Turkmen and Tajik
economies depend on external rents. Turkmenistan depends on oil and gas exports and Tajikistan
relies on foreign aid for development. Both states have tribal cleavages within the state. This
research attempts to discover the curse and blessing effect of resource revenues and foreign aid
only. Therefore, political regime, existence of clannish cleavages, rentier state are controlled
variables. The independent variables are two forms of external rents and presidents controlling de
jure and de facto political powers. The dependent variables have already been established in the
literature review section (Table 5).
The justification for the choice of these years is the data availability. In addition, in 2006 Niyazov,
the first leader of Turkmenistan passed away. Thus, Turkmenistan had new elected president. The
data series in the table below are extracted from the external rents and resource curse studies that
was covered in Chapter 2 of the thesis. However, in this section the study includes numerical
information of the indicators. Nevertheless, information is not perfect. Thus, some of the indicators
have “Yes/No” ‘degree’. Yet, this is the next best possible indicator that can be given based on the
case study discussion above and available data on other economic indicators. The data for
evaluation are extracted from the data obtained from World Bank. These tables are also presented
in appendices. (Table 6a; 6b; 6c: Turkmenistan economic indicators and Table 9a; 9b; 9c:

CE
UeT
DC
olle
ctio
n
39
Tajikistan economic indicators). Therefore, the effect of resource rents and foreign aid should be
observed in following indicators:
Series: 2006 2012
Heavy investment in
development of resource
sector
High number of exists of
private businesses
Percentage of oil and gas
rents
Percentage of Imports of
goods vs exports of goods
Stagnation of agricultural
sector (value added
agriculture % GDP)
Value added of Industry and
Services (% of GDP)
Military personnel (% of
labor force)
Total external debt
Gross domestic savings (% of
GDP)
Overvaluation of exchange
rates
Low or no diversity of export
sector
Concentration of natural
resource in one region
Rich – poor regional
cleavages over the
distribution of resources
Creates/intensifies violent
form of political unrest/ civil
war
Threat for Secessionism
Petrolization of the state
General government final
consumption expenditure (%
of GDP)
Central government debt
High budget for supply of
social benefits for free. Ex:
Free health care, free

CE
UeT
DC
olle
ctio
n
40
education, low housing
costs, cheap utilities and etc
GDP growth rate
Construction of luxurious
infrastructure
Executive branch dominance/
cult of personality of the
leader
Autocratic regime
Incumbent and challenger
conflict
Low freedom for citizens
Dominant single party
No or repressed opposition
3.3.1 Expected findings
The major expectations of the research is to find deviations in the series given in the table above.
According to the H0 “More dependent is the state on foreign aid, less power it has over its
distribution”, the research expects to find more observations in clannish disputes, protests, and
power struggles in the government. Because, foreign aid in resource-poor state is the only form of
resource that different powerful interest groups would demand some share. In addition, the state
would have to adopt certain policies and reforms to show compliance to the terms and conditions
of international donors. Moreover, the study expects to discover accumulation of external debts,
higher import expenditure than income from export of outputs.
Regarding the state depending on resource rents, the study expects to discover less imports
expenditure and higher export of outputs, investment toward development of agriculture, and
domestic savings fund. The research also expects to find curse effects of external rents such as
some external debt, high percentage resource rents in GDP, and fast GDP growth rate. The study
anticipates finding similarities in persistence of autocratic ruling, suppression of opposition and
the population, low level of freedom and violation of property rights in both case studies.

CE
UeT
DC
olle
ctio
n
41
4 Chapter 4
It is important to understand who controls the distribution of resources in order to find which form
of external rents, resource revenues or foreign aid, has more curse effects in Central Asia.
According to Acemoglu Johnson and Robinson (2005) the actor possessing more resources,
economic, military power and etc. have greater influence in shaping the political institutions and
realizing his own economic goals. Thus, the section below tries to discover the actors with de jure
and de facto political powers in Turkmenistan and Tajikistan who controls the distribution of
resources and determine the trajectories of political institutions.
4.1 Securing de jure political powers
All five Central Asian states adopted their constitutions in the period of 1992-1994. After three
months of debates Turkmenistan was the first state in the region to declare the adoption of its first
constitution. Before becoming an independent state, in Soviet era Turkmenistan was ruled by
Turkmen leaders who were disciplined and trained under Russian system who were also called
“Euroturkmens” (Kadyrov,1990 and 1993). After the collapse of the Soviet Union, Saparmurat
Niyazov inherited this form of ruling in the new independent state. In other words, Niyazov
selected his own subordinates who would be loyal to him. The supreme law constituted presidential
system type government. Most of the policy making powers were given to the head of the state.
Thus, Niyazov used his institutional power to combine the office of the prime minister and the
president into one and secured the most of the de jure political powers. Therefore, according to
Acemoglu, Johnson and Robinson (2005), Niyazov was the actor with the most share of
institutional powers.
In Tajikistan, Qahhor Mahkamov became the first President of the new independent state.
However, Mahkamov was forced to step down from the office; because, he supported failed
CE
UeT
DC
olle
ctio
n
42
Communist coup d’etat, August Coup, in Moscow. In addition, former first secretary of
Communist party was incapable to deal with tribal conflicts and bad economic conditions. Regular
protest turned into violent form of civil unrest.
After Mahkamov, Rahmon Nabiyev from Leninabada clan and another former communist leader
took over the office. Rahmon Nabiyev’s victory aggravated the tension between the clans as the
latter blamed the former of mischiefs in elections. Thus the newly established government could
not alleviate the clannish conflicts and set up its political foundations. Although, Nabiyev adopted
policies to retain Islamic traditions, he rejected to recognize the opposition groups and adopt their
reforms. Consequently, Tajikistan experienced second round of pro-government and anti-
government violence along with conflicts among Tajik clans. The second president also resigned
from office. Akbarsho Iskandarov acted as the new head of state. Yet, Iskanadarov could not end
the civil war and stepped down from office.
Finally, former apparatchik of Soviet nomenklatura and the speaker of the Parliament, Emamoli
Rahmon succeeded into power. Sayed Abdullo Nuri from Untied Tajik Opposition and Rahmon
were engaged in equal military deadlock until 1997. Althogh, Rahmon received strong support
from Russia and Uzbekistan, neither Rahmon nor Nuri could end the war. Neither side had popular
support from the citizens Yet, Rahmon was the first president to have successful adoption of the
constitution, in 1994. The leader limited the public debate of the supreme law by placing
censorship and excluding opposition groups (Civil Society and Political Change in Asia:
Expanding and Contracting Democratic Space, 2004; Gill, 2002; Grzymala-Busse, n.d.; Møller,
n.d.; Najman et al., 2008; R. W. T. Pomfret, 2006). Therefore, the proposal of presidential system
resulted further division among the clans as well as between the government and the population.
Nevertheless, in 1997 with involvement of external actors, such as UN, Russia and Iran, the Peace

CE
UeT
DC
olle
ctio
n
43
Accord was signed. Although, the peace agreement was signed under the condition of sharing
political powers with United Tajik Opposition, Rahmon managed to maintain the most of de jure
political powers in his own hands by limiting opposition’s access to decision making processes.
Thus, according to Acemoglu, Johnson and Robinson’s theory, Tajikistan’s leader Rahmon,
similar to Niyazov, controlled most of the de jure political powers. However, unlike Niyazov, Tajik
leader did not have full control of de facto political powers. United Tajik Opposition was the main
threat for Imamoli Rahmon.
4.2 Control of de facto political powers
Elites of Turkmenistan and Tajikistan used para-constitutional methods in extending the terms in
office. The leaders reargued that disoriented conditions after the collapse of the Soviet Union and
transition of the economy required strong leadership and quick decision making (McGlinchey,
2009). In addition, they claimed that the priority of maintaining internal peace and stability as well
as awareness of external threats were the reason for the presidents to expand their control.
In Turkmenistan, Niyazov established “Halk Maslahaty”, People’s Council. People’s Council is
not a legislative power. Yet, it can overrule President’s and the parliament’s decision. Thus, Halk
Maslahaty is a de facto form of political power. However, in practice, this organization was closely
linked to the head of state. In 1999, Halk Maslahaty promoted the president to the lifetime term.
With this promotion, Niyazov fully established his influence in all the branches of the government.
Although, institutionally natural resources remained under state control, Niyazov was the sole
figure who controlled the distribution of hydrocarbon wealth. Because, the leader constantly
altered the ministers. The president either re-appointed them to another sector or appointed new
staff. In addition, in the period of establishing nation-state the president used his far-reaching
authority to clear the state from Islamic activists and organized criminal organizations and other

CE
UeT
DC
olle
ctio
n
44
groups who could have protested for share of resources or oppose the against the extensive de facto
powers of the president (Anderson, 2003; Gretsky, 2003; Najman et al., 2008; R. W. T. Pomfret,
2006). Nevertheless, Niyazov as a symbol of compliance to the constitution and international
norms, lowered the threshold for the minimum number of members from 1000 to 500. The head
of state adopted multiparty system. However, there has been only one dominant party until 2012,
Democratic Party of Turkmenistan.
Tajikistan had similar symbolic acts which in practice functioned differently. After the presidential
elections in 1999, Rahmon appointed many candidates from the opposition parties to the
parliamentary election in order to show the foreign actors the intent of balance of powers. Another
example, after the 9/11 in the US, Rahmon announced that it would join the international campaign
against terrorism. Using this opportunity, Rahmon in practice was able to use and used militia to
fight the opposition groups (Gretsky, 2003).Moreover, like Niyazon, the Tajik president limited
the United Tajik Opposition from participating in public debates for adoption of policies and
institutions.
Nevertheless, the number of present NGOs and international organizations in Tajikistan and
Turkmenistan indicate that the elites should be to some degree constrained from using such para-
constitutional methods (The International Center for Not-for-Profit Law (ICNL)). Yet, ICNL
reports that the number of active organizations is low in both Turkmenistan and Tajikistan. Some
of the active organizations are funded by the national government or affiliated to it only because
of the requirement of fulfilling the terms and conditions of foreign aid providers (ICNL), especially
Tajikistan (Gretsky, 2003). Foreign aid donors warned that if Rahmon did not adopt policies to
fight corruption, they were going to discontinue the flow of foreign aid. Nevertheless, there are
certain organizations, such as women’s rights watch that has been active and successful. However,

CE
UeT
DC
olle
ctio
n
45
such NGO’s are limited from accessing and influencing to economic or political issues. Thus, the
leaders of Turkmenistan and Tajikistan even restrained the access of NGOs to secure the de facto
political powers.
Another reason for weak civil society and de facto powers in hands of the elite is division of
regional clans/tribes (Ibid). This was especially more evident in Tajikistan which experienced civil
war throughout the most of 1990s. The clans and Islamic activists in Leninabad, Kurgan-Tepe,
Kulob and Gorno-Badakshan still remain fragmented to this day. Neither the civil society nor the
NGOs could not reach unity in action concerning the clan/tribe divisions. In Tajikistan Leninabad,
Kurgantepe, and Garma regions have tribal grudges against each other. In Turkmenistan, there are
clannish divisions among capital and other five welayats (regions). There are eight main
distinguished clans which also divide into smaller branches of tribes within the clans. These main
tribes in the nation are: Geoklen, Bayandyr, Garadashly, Salyr, Chowdur, Arsari, Iomud and Tekke
(Gretsky, 2003). All tribes both in Turkmenistan and Tajikistan speak the state national languages
and capable of communicating and understanding each other but with the dialect which is
associated to the particular region. However the struggle among the clans is not due to the dialects
but rather because of certain pre-Soviet events (Ibid).
The Soviet Empire prioritized the internal peace and stability. Therefore, the communist
government had been controlling over all the social activities and attempting to eliminate self-
identity of the nations by all the methods including the terrorizing methods of secret police
(Gretsky, 2003). Therefore, after gaining independence Turkmen and Tajik leaders promoted their
own nationality to identify themselves as separate, independent nations in the world. This re-
developed the old clannish cleavages from pre-Soviet history.

CE
UeT
DC
olle
ctio
n
46
In 19th century, for example, Turkmen clans were not in peace with each other. Khiva iomud
wanted to weaken Tekke Turkmens. Therefore, they were in supported Russia when the Tsarist
Army arrived to take over the lands of Tekke Turkmens in 1881. The Akhal Tekke Turkmens did
not have military support in the Gokdepe battle from the Mary region Turkmens. This deepened
the tension between the two clans. Iomud Turkmens also had similar story as Akhal Tekke
Turkmens. Northern Iomud tribes did not provide any back-up to the southern Iomuds against the
Russian army. In addition, after the submission of Tekke Turkmens, Russian Tsar rewarded the
leaders of the Tekkes to please them and suppress the notion of secession. Tekke Turkmens were
granted to wear sword in public area and be able to fight in front lines in wars (First World War).
Promotion of Tekke Turkmens aggravated the tribal division among Turkmens. However, after
emergence of Communist Soviet Union, the Soviet government forced the Turkmens to unite as a
nation under one territory.
4.3 Political institutions at (t) 1991
The central question of the constitutional debate in Tajikistan and Turkmenistan was the power of
executive branch and the type of political system (R. W. T. Pomfret, 2006). The evolution of
political systems outside, international recognition and independence from Soviet Empire, placed
the elite in front of the dilemma of choosing democratic ruling or maintaining pluralist politics.
Yet, both states chose the pluralist politics in order to attract more foreign aid for Tajikistan, and
foreign direct investment for oil and gas sectors for Turkmenistan (R. Pomfret, 2006). In addition
to the fact that neither of the Central Asian nations experienced democratic governance, the leaders
of the states were skeptical and hesitant in committing to democratic form of ruling (Anderson,
2003; Najman et al., 2008). The heads of states feared the disruption of political stability within
the state (R. Pomfret, 2006). Part of the skepticism was due to Gorbachev’s attempt to adopt
democratic elements of governance. Moreover, civil war in Tajikistan only increased these fears

CE
UeT
DC
olle
ctio
n
47
and hesitations toward democracy. Therefore, both states adopted presidential systems with
controlled form of regime. Most of the political institutions were inherited from Soviet era ruling,
because, those were the only institutions that the former Communist Party elites of Turkmenistan
and Tajikistan knew the best. Hence, Acemoglu, Johnson, and Robinson’s (2005) theory on
inheriting political institutions from previous existing government holds true in this research.
4.4 Distribution of resources
Tajikistan commenced to reform its economy after 1997 signing the Peace Accord with other clans
and Islamic groups. Tajik government decreased the government final consumption expenditure
from 16.50% of GDP in 1997 to 9.52% in 1998 in order to stabilize its hyperinflation. Foreign
trade, privatization and tax regulations were loosened and simplified. Both, big and small
enterprises were allowed to be privatized. Tajik government adopted private farming. In 1999, the
state started to see some positive growth from industrial and agricultural sectors (Table 9 b). In
agriculture cotton and in industry aluminum were and still are the main exported goods. Even
though economy was improving Tajik ruble was losings its power to the US dollar. Thus, Tajik
government introduced .new currency Sommoni in year of 2000. Within five months the state
changed to using Sommoni. Inflation increased to 30.21% from 23% but, declined in 2002 to
18.82%. Despite its positive growth, Tajikistan remains one of the poorest countries in the world.
The state has the lowest average salary in Central Asian region, $12-$15 (Abazov, 2010).
Tajikistan is heavily dependent on foreign aid. During the civil war Russia provided necessary
goods in addition to the credit. After the war, Tajikistan received foreign aid international
organizations such as IMF, World Bank, and USAID. In 1998, World Bank provided $50 million,
IMF $123 million and USAID $20 million to reconstruct the city, buy food supply and promote
CE
UeT
DC
olle
ctio
n
48
growth in Tajikistan. However, the high rates of corruption was undermining the flow of foreign
aid. Rahmon used the advice of the NGO and fired several ministers and high ranked officials
under the claims of fighting corruption. The president even agreed to aid the US, after 9/11, in
providing land as a transit point for the US troops to fight war in Afghanistan. Later, the Tajik
government announced that it would participate in international terrorist fighting campaign along
with other western states. With such compliance and adjustments to the international terms and
circumstances Tajik government also anticipated that the foreign actors would delay the debt
payments (Cummings et.al, 2010). Nevertheless, the agreement to fight terrorism allowed Rahmon
to use forces against opposition groups and further secure his powers.
Thus, applying the theory on the distribution of resources, it can be observed that Tajikistan did
not have any resources to share. Even in 2006, according to the latest data available on cash deficit
/surplus of the state, Tajikistan had deficit of -6.61% of GDP (Table 9c). Net official foreign aid
and assistance, in 2006, increased to $253,420,000 from $148,110,000 in 2005 (Table 9c). GDP
for the 2006 was $2,076,148,710 (Table 9c). Yet, the gross national expenditure for the same year
equaled to $2,630,833,981.
Therefore, according to Acemoglu, Johnson and Robinson (2005) theory, there were scarce
economic resources to distribute. The only distributable resource was cash from foreign aid.
However, the elite did not have full control over the distribution of foreign aid. First, there were
exiting clannish tensions. Second, the Tajik government did not control all the militia in the state.
Third, foreign aid donors could discontinue the flow of foreign aid. It has been mentioned that
Tajikistan experienced the threat on discontinuity of foreign aid if the elites did not manage the
corruption in the state. Thus, the government had to act in attractive manner in order to maintain
the flow of external financial assistance

CE
UeT
DC
olle
ctio
n
49
Unlike other central Asian states, Turkmenistan did not seek economic liberalization but rater
economic independence. Therefore, the transition, from communism to nationalism, was rapid.
The economic development of the state was dependent on the development of foreign policy and
the decisions of the Turkmen leader, Saparmyrat Niyazov (R. Pomfret, 2006).
In 1993, Argentine company Bridas received a permission to develop onshore field for the
extraction of gas. Later Lamarg Enry Group signed an agreement with Ceheleken, Turkmen state
owned company to explore two offshore fields. In 1996, Malaysian company, Petronas, was
granted an opportunity two develop three large offshore fields both in gas and oil extraction. In
1998, Monument Oil and Gas from UK in partnership with the US Mobil joined to exploration of
hydrocarbon wealth in western part of Turkmenistan. Although, Turkmenistan invited foreign
companies for the extraction of resources, the state managed the terms and conditions of the
agreement.
Turkmenistan achieved price liberalization from Russian influence and aligned it to the world
prices. This realized 50% more profit from the export of natural resources. Yet, Niyazov still
retained price control to some extent. The President adopted a program “10 yil Abadanchylyk” or
“10 years of Stability” which supplied the nation with free electricity, water, gas and low housing
costs. The main export sectors of the state were and still are oil, gas and cotton. In the period of
1994-96, privatization procedures were taken place. This was the first privatization held in the
state thus most of the companies were small size businesses. Approximately 1698 enterprises were
privatized through auction and sales to the state institution employees.
The main objective of the Turkmen government was to establish independent economy. Thus, one
of the main objectives was to diversify the economy, especially to have an ability to generate self-
sufficient agricultural and food supplies. Therefore, Turkmen government allowed privatization of

CE
UeT
DC
olle
ctio
n
50
a land. During Soviet Union the land was owned by the state and distributed to the individual and
collective farmers with specific quota to fill. In 1997, by Niyazov’s decree all the state lands were
divided and allowed to be bought or leased by individual farmers. This increased the value added
of the agriculture in GDP from 13.3% in 1996 to 21.6% in 1997 and 26.1% in 1998 (Table 6a &
6b). Considering the economic situation of farmers, state allowed to obtain ownership of the land
based on farmer’s performance, harvest. Moreover, the state established farmers’ bank, “Dayhan
Bank”, which provided financial assistance to the agriculture sector.
Central Bank, in 1996-99, was granted some independence. The bank adopted tight monetary
policy in order to bring the ongoing hyperinflation. As the result, in 1998 inflation decreased to
17.63% from 61.7% in 1997 (Table 6a). In 1999, however, Niyazov regained the control over the
Central Bank. The fiscal and monetary policies were controlled by the executive branch. The
public budget data was made unavailable either for public or for NGOs. Thus, Turkmenistan still
inherited some elements of planned economy. Yet, the government did not regulate the prices of
small businesses. Nevertheless, since the privatization of small and medium enterprises, none of
the companies went bankrupt. Therefore, state assisted in building and maintaining small and
medium size businesses.
Similar to Tajikistan, Turkmenistan also used external debt. However, unlike Tajikistan,
Turkmenistan received long term debts. Fitch-Ibca or currently Fitch ratings, London credit rating
agency, rated Turkmen economy with score B for currency stability and credit payment ability.
The rating provided Turkmenistan with loans and investments from foreign governments, and
organizations such as EBRD, Japan Overseas Economic Co-operation Fund and others. The
investments and credits were directed toward developing oil and gas sector and other forms of

CE
UeT
DC
olle
ctio
n
51
infrastructure, such as improving the transportation routes in order to improve the access to and
from Turkmenistan (R. Pomfret, 2006).
As the revenues from resources and foreign aid started pouring in, appearances of major cities in
the state started to change with rapid pace. Palaces and buildings from white marbles with high
ceilings, golden national ornaments and elements from Islamic traditional architecture started to
appear all around the country. The social benefits increased; for example, with the birth of the third
child in the family the state provides lump-sum (single large payment) in addition to the free health
care; and with the birth of the fifth child, the family receives a new apartment in addition to
monetary aid and free health care. In addition to the investment in infrastructure and development
of social programs, Saparmurat Niyazov established savings fund in 2000. The gross domestic
savings in the year of 2000 went to 49% of the GDP from 12.3% in 1999 (Table 6b).
Analyzing the given information on distribution of the resources in Turkmenistan, it can be
observed that resources rents developed some of the resource curse symptoms such as patronage,
investment in luxurious projects. Yet, unlike classic examples of resource curse phenomenon such
as Venezule and Nigeria (Karl, 1997) Turkmenistan also invested in agriculture and direct flow of
cash to savings fund. These two reforms assisted avoiding complete stagnation of the Turkmen
economy and accumulating the risk of economic crises if prices for oil and gas were to fall in the
world market. The study also attempted to analyze the military expenditure and advancement of
Turkmen military in order to test further the application of resource curse. Unfortunately, there is
no data on the military expenditure. Yet, military personnel (Table 6a; 6b & 6c) present that the
personnel of the security forces did not significantly increase since independence. In fact it has
been 1% of the labor force since 2005 (Table 6b & 6c).

CE
UeT
DC
olle
ctio
n
52
In the process of research another finding has been discovered. The natural reserves in
Turkmenistan are not concentrated in one region only.
Figure 4: Map of natural resources in Turkmenistan
Thus, all the “welayats”, regions, benefited from the development of oil and gas fields. This could
be another factor that assisted in avoiding civil war that Ross (2006) theorized in the subject of
ethnic divisions and resource rents. In addition, in support of other past studies on the quality of
institutions and ethnic divisions, Turkmenistan had and has strong resource management
institutions. Although, these institutions are not in form of democratic ruling, they are strong
political institutions which contribute to the stability and persistence of political regime

CE
UeT
DC
olle
ctio
n
53
4.5 Evaluation the curse/blessing degree of resource rents and foreign aid
This section concludes with systematic evaluation of curse/blessing degree of resource rents and
foreign in Turkmenistan and Tajikistan for 2006 and 2012. The justification for the choice of these
years is the data availability. In addition, in 2006 Niyazov, the first leader of Turkmenistan passed
away. Thus, Turkmenistan had new elected president. The data series in the table below are
extracted from the external rents and resource curse studies that was covered in Chapter 2 of the
thesis. However, in this section the study includes numerical information of the indicators.
Nevertheless, information is not perfect. Thus, some of the indicators have “Yes/No” ‘degree’.
Yet, this is the next best possible indicator that can be given based on the case study discussion
above and available data on other economic indicators. The data for evaluation are extracted from
the data obtained from World Bank. These tables are also presented in appendices. (Table 6a; 6b;
6c: Turkmenistan economic indicators and Table 9a; 9b; 9c: Tajikistan economic indicators).
Hence, according to this data the evaluation of curse degree in Turkmenistan is presented in the
following table:
Figure 5: Turkmenistan resource curse degree
Series: 2006 2012
Heavy investment in
development of resource
sector
Yes
High number of exists of
private businesses
No No
Percentage of oil and gas
rents
0% of GDP 31% of GDP
Percentage of Imports of
goods vs exports of goods
35% vs 73% of GDP 44% vs 73% of GDP
Stagnation of agricultural
sector (value added
agriculture % GDP)
No (17% of GDP) No (15% of GDP)
Value added of Industry and
Services (% of GDP)
Industry: 36%
Services: 46%
Industry: 48%
Services: 37%
Military personnel (% of
labor force)
1% 1%

CE
UeT
DC
olle
ctio
n
54
Total external debt Multilateral debt 3%
Short term debt 15%
Multilateral debt: 9%
Short term: 18%
Gross domestic savings (% of
GDP)
58% 76%
Overvaluation of exchange
rates
No No
Low or no diversity of export
sector
No No
Concentration of natural
resource in one region
No No
Rich – poor regional
cleavages over the
distribution of resources
No No
Creates/intensifies violent
form of political unrest/ civil
war
Non-existent Non-existent
Threat for Secessionism No No
Petrolization of the state Yes Yes
General government final
consumption expenditure (%
of GDP)
10% 9%
Central government debt Not available Not avialable
High budget for supply of
social benefits for free. Ex:
Free health care, free
education, low housing
costs, cheap utilities and etc
Yes Yes
GDP growth rate 11% 11%
Construction of luxurious
infrastructure
Yes Yes
Executive branch dominance/
cult of personality of the
leader
Yes Yes
Autocratic regime Yes Yes
Incumbent and challenger
conflict
No incumbent No incumbent
Low freedom for citizens Yes Yes
Dominant single party Yes Yes
No or repressed opposition Yes Yes
Thus, from the Table above, it can be concluded that the resource curse degree of Turkmenistan is
less than what Mahdavy (1970), Karl (1997) and Ross (1999, 2001, and 2009) theorized in their

CE
UeT
DC
olle
ctio
n
55
studies of hydrocarbon curse phenomenon. Turkmenistan managed its resource rents better than
Venezuela and Nigeria in 19th century (gross domestic savings, imports vs exports, agriculture
value added).
Evaluating curse effect of Tajikistan, the table shows the following results:
Figure 6: Evaluation of curse effects of foreign aid in Tajikistan
Series: 2006 2012
Heavy investment in
development of resource
sector
Non-existent Non-existent
Number of registered private
businesses
849 1251
Percentage of oil and gas
rents
0% 0%
Percentage of Imports of
goods vs exports of goods
57% vs 23% of GDP 69% vs 22% of GDP
Stagnation of agricultural
sector (value added
agriculture % GDP)
No (24% of GDP) No (27% of GDP)
Value added of Industry and
Services (% of GDP)
Industry: 31%
Services: 45%
Industry: 23%
Services: 51%
Military personnel (% of
labor force)
Not available 1%
Total external debt Multilateral debt 56%
Short term debt 3%
Multilateral debt: 27%
Short term: 0%
Gross domestic savings (% of
GDP)
-20% -28%
Overvaluation of exchange
rates
Not available Not available
Low or no diversity of export
sector
No No
Concentration of foreign aid
in one region
Not-available Not-available
Rich – poor regional
cleavages over the
distribution of resources
Yes Yes
Creates/intensifies violent
form of political unrest/ civil
war
Yes Yes
Threat for Secessionism No No
Foreign aid dependence No No

CE
UeT
DC
olle
ctio
n
56
General government final
consumption expenditure (%
of GDP)
11% 9%
Central government debt Not available Not avialable
High budget for supply of
social benefits for free. Ex:
Free health care, free
education, low housing
costs, cheap utilities and etc
No No
GDP growth rate 7% 8%
Construction of luxurious
infrastructure
No No
Executive branch dominance/
cult of personality of the
leader
Yes Yes
Autocratic regime Yes Yes
Incumbent and challenger
conflict
Yes Yes
Low freedom for citizens Yes Yes
Dominant single party Yes Yes
No or repressed opposition Yes Yes
From the table above, it can be observed that Tajikistan has more curse symptoms from the
dependence on foreign aid. The Tajik government does not have any flow of cash into savings
fund. In addition, the state has more imports than exports. One of the curse attributes of external
rents was the state increasing the expenditure on imports. Tajikistan spends has higher % of
imports of its GDP. In addition, Tajik republic has bigger percentage of multilateral debt than
Turkmenistan. Nevertheless, none of the states has stagnated agriculture sector. Yet, comparing
the tables above, it can be observed that Turkmenistan has better development position and less
curse effects than Tajikistan. Thus, it can be implied that the curse effects of resources in Central
Asia is less than those of the foreign aid in resource-poor republics in the region.

CE
UeT
DC
olle
ctio
n
57
Conclusions.
Most of the literature on rentier state argue that dependence on external rents hinder the
socioeconomic development of the state ( Mahdavy, 1970; Karl, 1997; Jones Luong and
Weinthal, n.d.; Najman et al., 2008; Ramsay, 2011; Rosser, 2006; Ross, 1999).pdf,” n.d.) Yet,
most of the literature focus on macroeconomic effects of the hydrocarbon wealth. Thus, there
is scarcely any study conducted on the contribution of resources, specifically in Central Asian
region. Even more, there is hardly any study that compares the curse effects of two kinds of
external rents, resource revenues and foreign aid in Central Asia since 1991. This research
attempted to fill this gap.
In the first chapter, the study provided brief background on pre-Soviet, Soviet and post-Soviet
history. The research presented how all five new independent states, Kazakhstan, Kyrgyzstan,
Tajikistan, Turkmenistan and Uzbekistan developed since 1991. The second chapter defined
the important concepts, such as rentier state, necessary preconditions and others. This section
also covered literature review on rentier state, external rents and resource curse phenomenon.
The section on past studies assisted to collect indicators to evaluate the curse effects of external
rents in discussed republics. The second chapter concluded with theoretical framework of the
research.
The research applied Acemoglu, Johnson, and Robinson’s (2005) theory on the role of
institutions in long term economic growth. This theory assisted in discovering the actors with
the de jure and de facto political powers who also controlled the distribution of resources. The
theory assisted to explain the choice in political and economic institutions in resource-rich
Turkmenistan and resource-poor Tajikistan. The research also designed additional theory to
explain the distribution of resources in Turkmenistan and Tajikistan. This theory assisted to
map the flow of resources and discover curse attributes of resource revenues and foreign aid.

CE
UeT
DC
olle
ctio
n
58
The chapter three provided methodology of the research. The research used the method of
congruence and process tracing by reading the history forward. Method of congruence was
applied to establish and find deviations in the same study variables. Process tracing allowed to
investigate the deviations in the indicators. Reading the history forward was proposed by
Capoccia and Ziblatt (2010). This method helped to compare and contrast how two states
developed and evolved throughout the time. Thus, the description of events follows in
ascending chronological order, from past to the present, instead of moving backward from
present to past. The section concluded discussing the extracted and applied data in this research
and description of independent and dependent variables.
The last chapter, fourth chapter of the research provided the empirical analysis of the research.
In this section, the study attempted to answer the research question Which form of external
rents, resource revenues or foreign aid have had more curse effects in Central Asia? The
assumption of the study was that resource rich Central Asian states managed external rents
better than Kyrgyzstan and Tajikistan with foreign aid and what the aforementioned classic
scholars theorized on the hydrocarbon curse phenomenon. Therefore, the research question
above had several separate sub-questions: Who controls the distribution of resources? How did
Central Asian states use their external rents? And in what aspects do the resource-abundant
Central Asian states deviate from the findings of traditional external rent studies?
According to the theory, the research established that the president of Turkmenistan controlled
the most of the de jure and de facto political powers. In addition, Niyazov controlled the
distribution of the resources before the independence of Turkmenistan. The leader surround
himself with his own selected subordinates and inherited Soviet era political institutions.
Niyazov controlled the exports of gas and oil. Nevertheless, the president provided patronage
and spent on building luxurious homes and palaces. Although, these are the examples of

CE
UeT
DC
olle
ctio
n
59
resource curse symptoms, the Turkmen elite did not stagnate all the producing sectors of the
economy.
Turkmenistan did not hinder the development of agriculture and did not accumulate external
debt. Instead, the President established savings fund with annual cash inflow of petrodollars.
Turkmenistan paid off the long term external liabilities. In addition, Turkmenistan has
maintained higher exports and lower expenditure on imports. Agriculture sector was promoted
through land privatization and credit opportunities. The land ownership could also be obtained
depending on the harvest of the farmer. In other words, farmers could pay the land ownership
with harvest instead of cash. The indicators from Figure 5 imply that Turkmenistan did not lead
the same resource boom path as did Venezuela and Nigeria in 19th century.
Comparing with Turkmenistan, Tajikistan mainly heavily relied on foreign aid. Although
Tajikistan and Turkmenistan both had clannish divisions within the population, Tajik state was
the one to experience civil war in 1990s. The tensions between clans and conflicts over the
presidential office present that the elite did neither have full control over the da facto political
powersnor over the distribution of resources.
Foreign aid is form of external rent. Like natural resources, it is not form of constant income
and subject to the changing environment. In other words, the state or international arena could
change the flow of the foreign aid. In addition, the depending state had to fulfill certain terms
and conditions as well as comply international norms in order secure the flow of foreign aid.
Tajikistan adopted ‘fake’ reforms to secure the foreign aid. For example, Rahmon adopted
corruption fighting campaign and fired ministers from opposition groups. Another example,
when Rahmon announced Tajikistan’s joining international antiterrorist campaign. In practice,
the Tajik leader mobilized his militia to further suppress the opposition groups. Thus, the
foreign aid also developed rentier state and created rent seeking behavior of the elite.
CE
UeT
DC
olle
ctio
n
60
According to the figure 6, dependence on foreign aid had more curse effects than resource
revenues in Turkmenistan. Although, Tajikistan had percentage of value added into GDP, Tajik
government had negative savings and high percentage of multilateral debt (Figure 6). Moreover
Tajikistan had more expenditure than production of goods. The state spent more on imports of
goods than to the exports of outputs. Therefore, in comparison with Turkmenistan, it can be
established that resource revenues had less curse effects than that of foreign aid.
This research has its own weaknesses. The first weakness is non-availability of the data. Central
Asian states limit the access of the data. In addition, all the official international organizations
such as World Bank state that the data could have wrong indicator. In addition, this research
provides episodes of events. The curse effects of external rents are also presented in snapshot.
In other, words, the study does not provide year to year curse degree of natural resource rents
and foreign aid. Moreover, the degree of curses is not in measured in numerical degrees. Thus,
the study could be further researched using positivist approach.
Nevertheless, this case study has its own advantages. This research, for the first time, provides
comparison of curse effects of resource rents and foreign aid in Central Asia since 1991.
Moreover, the study tests Turkmenistan and Tajikistan according to the classical external rent
studies. Last, but not the least, the research expands rentier state, external rents and resource
curse studies.

CE
UeT
DC
olle
ctio
n
61
Appendices:
NOTE: This appendices provides tables mentioned in the text. Table of country economic
indicators show the data from 1991 to 2013. Although, the research does not refer to all the
years, the data is shown to present updated information. The data in this appendices are
extracted from World Bank with selected series, time. The time period of the data is from 1991
to 2013. The remaining two years are unavailable in all, including IMF, OSCE, and CIA
databanks. Information of Turkmenistan and Tajikistan are presented with extended series for
systematic comparison purposes. The data on the other three economies are provided with basic
economic indicators.
Table 5: The sample for systematic table of resource curse symptoms
Series: 2006 2009
Heavy investment in
development of resource
sector
Dominating percentage of oil
and gas exports
High imports of goods
Stagnation of agricultural
sector
High expenditure on military
High total external debt
Low or no gross domestic
savings
Low investment in public
capital stock
Overvaluation of exchange
rates
Low or no diversity of export
sector
Concentration of natural
resource in one region
Creates rich – poor regional
cleavages over the
distribution of resources
Creates/intensifies violent
form of political unrest/ civil
war
Threat for Secessionism
Petrolization of the state
High general government
final consumption
expenditure
Central government debt

CE
UeT
DC
olle
ctio
n
62
High budget for supply of
social benefits for free. Ex:
Free health care, free
education, low housing
costs, cheap utilities and etc
If price for oil falls, high
general government final
consumption expenditure
High GDP growth rate
Construction of luxurious
infrastructure
Executive branch
dominance/ cult of
personality of the leader
Autocratic regime
Incumbent and challenger
conflict
Low freedom for citizens
Dominant single party
No or repressed opposition

CE
UeT
DC
olle
ctio
n
Table 6a: Turkmenistan Economic indicators (World Bank)
63
1990 1991 1992 1993 1994 1995 1996 1997
Population, total 3,668,000 3,772,350.0 3,881,973.0 3,991,917.0 4,095,512.0 4,188,010.0 4,267,690.0 4,335,991.0
Population growth (annual %) 3 2.8 2.9 2.8 2.6 2.2 1.9 1.6
GNI, PPP (current international $) .. 17,782,518,341.2 15,445,198,173.1 14,232,938,855.3 15,457,912,909.9 14,312,505,228.0
GNI per capita, PPP (current international $) .. 4,450.0 3,770.0 3,400.0 3,620.0 3,300.0
GDP (current US$) 3,232,066,837 3,197,224,007.4 3,200,539,816.1 3,179,225,948.6 2,561,118,608.4 2,482,228,439.7 2,379,281,768.0 2,450,084,970.2
GDP growth (annual %) 35 (4.6) (15.0) 1.5 (17.3) (7.2) 6.7 (11.4)
Inflation, GDP deflator (annual %) -21 102.8 3,100.0 1,134.0 952.3 705.7 1,014.3 61.7
Agriculture, value added (% of GDP) 32 32.3 10.6 19.4 34.0 17.2 13.3 21.6
Industry, value added (% of GDP) 30 31.0 11.9 64.0 46.7 62.6 68.8 48.0
Services, etc., value added (% of GDP) 38 36.7 77.5 16.6 19.3 20.2 17.8 30.4
Exports of goods and services (% of GDP) .. 38.7 67.1 84.7 85.0 84.0 74.6 42.7
Imports of goods and services (% of GDP) .. 26.8 38.2 61.4 85.3 84.2 75.4 68.5
Domestic credit provided by financial sector (% of GDP) .. 24.9 (16.7) 1.1 (19.1) 8.4
Military expenditure (% of GDP) .. 1.8 2.3 2.0 4.0
Merchandise trade (% of GDP) .. 141.1 130.7 126.5 91.0
Total debt service (% of exports of goods, services and primary income) .. 10.2 22.1
Foreign direct investment, net inflows (BoP, current US$) .. 79,000,000.0 103,000,000.0 233,000,000.0 108,060,000.0 107,860,000.0
Net official development assistance and official aid received (current US$) .. 6,590,000.0 31,090,000.0 26,580,000.0 30,700,000.0 23,640,000.0 20,700,000.0
Armed forces personnel (% of total labor force) .. 2.0 1.9 1.0 0.7 1.2 1.1
External debt stocks (% of GNI) .. 8.6 16.3 16.1 31.6 73.6
Final consumption expenditure, etc. (% of GDP) 72 66.7 39.8 51.4 87.2
Foreign direct investment, net inflows (% of GDP) .. 2.5 4.0 9.4 4.5 4.4
Fuel exports (% of merchandise exports) .. 76.5
GINI index (World Bank estimate) .. 35.4
General government final consumption expenditure (% of GDP) 23 22.8 10.8 8.5 11.9 7.8 13.2
Gross domestic savings (% of GDP) 28 33.3 60.2 48.6 12.8
Gross domestic savings (current US$) 893,071,100 1,065,741,335.8 1,915,465,637.8 1,156,570,718.2 314,168,486.0
Gross national expenditure (% of GDP) 113 112.6 76.7 100.8 125.9
Gross national expenditure (constant 2005 US$) .. 7,288,823,797.2 5,595,243,890.1 5,878,374,710.0 5,483,545,610.3 5,086,268,864.7 5,440,559,904.4 5,436,431,844.4
Gross savings (% of GNI) .. 49.2 14.5
Gross savings (% of GDP) .. 49.5 15.0
Health expenditure, total (% of GDP) .. 3.1 3.1 5.0
Health expenditure, public (% of government expenditure) .. 9.2 13.9 13.9
Household final consumption expenditure, etc. (% of GDP) 49 43.9 29.0 43.6 74.0
Manufacturing, value added (% of GDP) .. 5.5 28.6 40.5 25.5 24.8
Merchandise exports (current US$) .. 2,145,000,000.0 1,880,000,000.0 1,695,000,000.0 1,000,000,000.0
Multilateral debt (% of total external debt) .. 9.1 12.4 14.5 0.4 1.0
Net flows on external debt, long-term (NFL, current US$) .. 231,082,000.0 65,392,000.0 32,752,000.0 91,498,000.0 886,574,000.0
Net flows on external debt, short-term (NFL, current US$) .. - - (72,000,000.0) 264,180,000.0 247,820,000.0
Net official development assistance received (current US$) .. 6,590,000.0 31,090,000.0 26,580,000.0 30,700,000.0 23,640,000.0 20,700,000.0
Oil rents (% of GDP) .. 14.4 15.9 24.0
Short-term debt (% of total external debt) .. - 19.7 4.3 37.9 28.3
Total debt service (% of GNI) .. 0.3 3.8 4.2 8.1 10.5
Total natural resources rents (% of GDP) 0 - - - 77.8 76.4 - 65.3
Created from: World Development Indicators
Country : Turkmenistan

CE
UeT
DC
olle
ctio
n
Table 6b: Turkmenistan Economic indicators (World Bank)
64
1998 1999 2000 2001 2002 2003 2004 2005
Population, total 4,395,293.0 4,449,427.0 4,501,419 4,551,762.0 4,600,171.0 4,648,037.0 4,696,876.0 4,747,839
Population growth (annual %) 1.4 1.2 1 1.1 1.1 1.0 1.0 1
GNI, PPP (current international $) 15,164,207,109.5 17,656,355,319.7 17,925,694,102 19,768,611,327.2 20,171,144,244.5 21,559,379,580.7 23,198,161,959.4 25,586,965,571
GNI per capita, PPP (current international $) 3,450.0 3,970.0 3,980 4,340.0 4,380.0 4,640.0 4,940.0 5,390
GDP (current US$) 2,605,688,065.1 2,450,686,659.8 2,904,662,605 3,534,771,968.5 4,462,028,988.7 5,977,440,582.8 6,838,351,088.5 8,104,355,717
GDP growth (annual %) 7.1 16.5 5 4.3 0.3 3.3 5.0 13
Inflation, GDP deflator (annual %) 17.6 23.0 23 32.3 25.2 27.2 18.3 7
Agriculture, value added (% of GDP) 26.2 26.2 24 24.4 22.0 20.3 19.4 19
Industry, value added (% of GDP) 42.2 46.0 44 44.3 42.4 41.3 40.1 38
Services, etc., value added (% of GDP) 31.6 27.8 31 31.4 35.6 38.4 40.4 44
Exports of goods and services (% of GDP) 32.7 56.1 96 81.4 69.0 62.3 61.7 65
Imports of goods and services (% of GDP) 70.8 83.5 81 76.9 53.4 56.6 59.5 48
Domestic credit provided by financial sector (% of GDP) 25.2 26.2 27 18.6 ..
Military expenditure (% of GDP) 3.1 2.9 .. ..
Merchandise trade (% of GDP) 60.3 108.7 148 140.0 111.4 102.8 105.1 97
Total debt service (% of exports of goods, services and primary income) .. ..
Foreign direct investment, net inflows (BoP, current US$) 62,300,000.0 125,000,000.0 131,000,000 170,000,000.0 276,000,000.0 226,000,000.0 353,700,000.0 418,200,000
Net official development assistance and official aid received (current US$) 27,410,000.0 24,980,000.0 35,300,000 75,260,000.0 43,730,000.0 28,560,000.0 54,260,000.0 30,370,000
Armed forces personnel (% of total labor force) 1.2 1.1 1 1.0 1.0 1.6 1.4 1
External debt stocks (% of GNI) 90.9 111.7 96 68.8 47.7 31.3 24.2 15
Final consumption expenditure, etc. (% of GDP) 92.7 87.7 51 63.8 56.8 68.9 74.8 60
Foreign direct investment, net inflows (% of GDP) 2.4 5.1 5 4.8 6.2 3.8 5.2 5
Fuel exports (% of merchandise exports) 58.5 64.1 81 ..
GINI index (World Bank estimate) 40.8 .. ..
General government final consumption expenditure (% of GDP) 16.2 11.9 14 11.4 11.1 12.0 12.7 13
Gross domestic savings (% of GDP) 7.3 12.3 49 36.2 43.2 31.1 25.2 40
Gross domestic savings (current US$) 191,453,084.0 301,761,102.2 1,432,040,749 1,280,970,259.0 1,927,720,986.5 1,859,889,829.1 1,721,487,431.0 3,255,381,488
Gross national expenditure (% of GDP) 138.1 127.4 85 95.5 84.4 94.3 97.9 83
Gross national expenditure (constant 2005 US$) 6,137,886,470.9 6,663,027,725.7 5,897,368,378 6,434,915,417.7 5,913,876,244.4 6,487,507,144.1 7,024,435,311.6 6,706,355,717
Gross savings (% of GNI) .. ..
Gross savings (% of GDP) .. ..
Health expenditure, total (% of GDP) 5.0 3.9 4 3.9 3.3 3.9 4.0 4
Health expenditure, public (% of government expenditure) 14.2 12.3 14 13.7 13.5 14.0 12.8 10
Household final consumption expenditure, etc. (% of GDP) 76.4 75.8 36 52.3 45.7 56.8 62.1 47
Manufacturing, value added (% of GDP) 18.0 18.1 11 14.6 15.3 18.6 21.7 ..
Merchandise exports (current US$) 590,000,000.0 1,187,000,000.0 2,506,000,000 2,700,000,000.0 2,850,000,000.0 3,632,000,000.0 3,870,000,000.0 4,944,000,000
Multilateral debt (% of total external debt) 1.6 0.9 2 2.3 2.6 2.6 2.8 3
Net flows on external debt, long-term (NFL, current US$) 486,859,000.0 336,048,000.0 77,145,000 (277,839,000.0) (374,187,000.0) (240,174,000.0) (225,855,000.0) -172,395,000
Net flows on external debt, short-term (NFL, current US$) (17,630,000.0) (198,300,000.0) -78,760,000 154,510,000.0 (38,942,000.0) (49,878,000.0) (41,000,000.0) -108,000,000
Net official development assistance received (current US$) 27,410,000.0 24,980,000.0 35,300,000 75,260,000.0 43,730,000.0 28,560,000.0 54,260,000.0 30,370,000
Oil rents (% of GDP) 15.0 26.3 .. ..
Short-term debt (% of total external debt) 21.3 11.4 9 16.5 16.7 16.0 15.6 13
Total debt service (% of GNI) 12.2 13.7 17 15.9 12.9 7.6 6.1 4
Total natural resources rents (% of GDP) 37.7 60.7 0 0.0 0.0 0.0 0.0 0
Created from: World Development Indicators
Country : Turkmenistan

CE
UeT
DC
olle
ctio
n
Table 6c: Turkmenistan Economic indicators (World Bank)
65
2006 2007 2008 2009 2010 2011 2012 2013
Population, total 4,801,595 4,858,236 4,917,543 4,978,962 5,041,995 5,106,668 5,172,931 5,240,072
Population growth (annual %) 1 1 1 1 1 1 1 1
GNI, PPP (current international $) 30,530,349,762 34,828,112,750 39,670,183,914 42,045,427,586 45,318,853,001 51,349,130,638 57,151,217,694 67,713,366,070
GNI per capita, PPP (current international $) 6,360 7,170 8,070 8,440 8,990 10,060 11,050 12,920
GDP (current US$) 10,277,598,152 12,664,165,103 19,271,523,179 20,214,385,965 22,148,070,175 29,233,333,333 35,164,210,526 41,850,877,193
GDP growth (annual %) 11 11 15 6 9 15 11 10
Inflation, GDP deflator (annual %) 12 9 60 10 0 15 8 8
Agriculture, value added (% of GDP) 17 19 12 12 15 15 15 ..
Industry, value added (% of GDP) 36 38 54 54 48 48 48 ..
Services, etc., value added (% of GDP) 46 43 34 34 37 37 37 ..
Exports of goods and services (% of GDP) 73 75 64 75 78 75 73 ..
Imports of goods and services (% of GDP) 35 39 40 45 45 44 44 ..
Domestic credit provided by financial sector (% of GDP) .. .. .. .. .. .. .. ..
Military expenditure (% of GDP) .. .. .. .. .. .. .. ..
Merchandise trade (% of GDP) 95 99 91 58 55 70 75 67
Total debt service (% of exports of goods, services and primary income) .. .. .. .. .. .. .. ..
Foreign direct investment, net inflows (BoP, current US$) 730,900,000 856,000,000 1,277,000,000 4,553,000,000 3,631,000,000 3,399,000,000 3,117,000,000 3,061,000,000
Net official development assistance and official aid received (current US$) 40,710,000 28,480,000 18,130,000 39,840,000 44,650,000 38,680,000 38,030,000 37,320,000
Armed forces personnel (% of total labor force) 1 1 1 1 1 1 1 1
External debt stocks (% of GNI) 10 7 4 3 3 2 2 1
Final consumption expenditure, etc. (% of GDP) 42 45 45 24 15 17 24 ..
Foreign direct investment, net inflows (% of GDP) 7 7 7 23 16 12 9 7
Fuel exports (% of merchandise exports) .. .. .. .. .. .. .. ..
GINI index (World Bank estimate) .. .. .. .. .. .. .. ..
General government final consumption expenditure (% of GDP) 10 9 7 10 9 9 9 ..
Gross domestic savings (% of GDP) 58 55 55 76 85 83 76 ..
Gross domestic savings (current US$) 5,927,152,552 7,002,534,709 10,673,072,848 15,353,903,860 18,906,903,339 24,291,915,182 26,747,624,689 ..
Gross national expenditure (% of GDP) 62 63 76 71 68 69 71 ..
Gross national expenditure (constant 2005 US$) 5,070,168,136 .. .. .. .. .. .. ..
Gross savings (% of GNI) .. .. .. .. .. .. .. ..
Gross savings (% of GDP) .. .. .. .. .. .. .. ..
Health expenditure, total (% of GDP) 3 2 2 2 2 2 2 2
Health expenditure, public (% of government expenditure) 10 10 9 9 9 9 9 9
Household final consumption expenditure, etc. (% of GDP) 32 36 37 14 5 8 15 ..
Manufacturing, value added (% of GDP) .. .. .. .. .. .. .. ..
Merchandise exports (current US$) 7,156,000,000 8,932,100,000 11,944,700,000 5,000,000,000 6,500,000,000 13,000,000,000 16,500,000,000 18,000,000,000
Multilateral debt (% of total external debt) 3 3 3 3 3 3 9 16
Net flows on external debt, long-term (NFL, current US$) -206,948,000 -127,424,000 -114,947,000 -111,204,000 -117,348,000 -76,489,000 13,647,000 17,432,000
Net flows on external debt, short-term (NFL, current US$) 6,000,000 -58,000,000 -40,000,000 24,000,000 -20,000,000 -7,000,000 44,000,000 -26,000,000
Net official development assistance received (current US$) 40,710,000 28,480,000 18,130,000 39,840,000 44,650,000 38,680,000 38,030,000 37,320,000
Oil rents (% of GDP) .. .. .. 18 22 23 19 16
Short-term debt (% of total external debt) 15 11 7 11 10 11 18 13
Total debt service (% of GNI) 3 2 1 1 1 1 0 0
Total natural resources rents (% of GDP) 0 0 0 41 45 49 37 31
Created from: World Development Indicators
Country : Turkmenistan

CE
UeT
DC
olle
ctio
n
Table 7a: Kazakhstan economic indicators (World Bank)
66
1990 1991 1992 1993 1994 1995 1996 1997 1998 1999
Population, total 16,348,000 16,450,500.0 16,439,095.0 16,330,419.0 16,095,199.0 15,815,626.0 15,577,894.0 15,333,703.0 15,071,300.0 14,928,426.0
Population growth (annual %) 1 0.6 (0.1) (0.7) (1.5) (1.8) (1.5) (1.6) (1.7) (1.0)
GDP (current US$) 26,932,728,899 24,881,135,586.4 24,906,939,560.1 23,409,027,475.7 21,250,839,258.1 20,374,307,047.1 21,035,357,832.8 22,165,932,063.0 22,135,245,413.2 16,870,817,134.8
GDP growth (annual %) .. (11.0) (5.3) (9.2) (12.6) (8.2) 0.5 1.7 (1.9) 2.7
Inflation, GDP deflator (annual %) .. 96.4 1,472.2 1,243.5 1,546.7 160.9 38.9 16.1 5.7 13.3
Agriculture, value added (% of GDP) .. 26.7 17.5 15.5 12.9 12.8 12.0 9.1 10.5
Industry, value added (% of GDP) .. 44.6 39.4 40.0 31.4 26.9 26.8 31.2 34.9
Services, etc., value added (% of GDP) .. 28.7 43.1 44.5 55.7 60.3 61.2 59.7 54.6
Exports of goods and services (% of GDP) .. 74.0 37.9 37.1 39.0 35.3 34.9 30.3 42.5
Imports of goods and services (% of GDP) .. 75.3 46.7 47.1 43.5 36.0 37.4 34.9 40.1
Revenue, excluding grants (% of GDP) .. 14.0 11.2 8.6
Cash surplus/deficit (% of GDP) .. (1.8) (2.5) (2.8)
Domestic credit provided by financial sector (%
of GDP) .. 49.6 29.1 9.5 7.9 6.5 8.7 10.1
Tax revenue (% of GDP) .. 6.8 7.3 7.7
Military expenditure (% of GDP) .. 1.0 0.9 1.1 1.2 1.1 1.1 0.9
Merchandise trade (% of GDP) .. 32.0 44.5 48.3 48.7 43.6 56.5
Total debt service (% of exports of goods,
services and primary income) .. 3.9 4.6 6.2 14.4 19.6
Personal remittances, received (current US$) .. 116,099,998.5 89,099,998.5 59,500,000.0 72,300,003.1 64,000,000.0
Foreign direct investment, net inflows (BoP,
current US$) .. 100,000,000.0 1,271,400,000.0 659,700,000.0 964,200,000.0 1,137,000,000.0 1,321,400,000.0 1,151,400,000.0 1,587,000,000.0
Net official development assistance and official
aid received (current US$) .. 111,500,000.0 12,070,000.0 15,350,000.0 53,270,000.0 64,830,000.0 124,450,000.0 141,150,000.0 223,260,000.0 174,980,000.0
Created from: World Development Indicators
Country : Kazakhstan

CE
UeT
DC
olle
ctio
n
Table 7b: Kazakhstan economic indicators (World Bank)
67
2000 2001 2002 2003 2004 2005 2006 2007 2008
Population, total 14,883,626 14,858,335.0 14,858,948.0 14,909,018.0 15,012,985.0 15,147,029 15,308,084 15,484,192 15,674,000
Population growth (annual %) 0 (0.2) 0.0 0.3 0.7 1 1 1 1
GDP (current US$) 18,291,990,619 22,152,689,129.6 24,636,598,581.0 30,833,692,831.4 43,151,647,002.6 57,123,671,734 81,003,864,916 104,849,886,826 133,441,612,247
GDP growth (annual %) 10 13.5 9.8 9.3 9.6 10 11 9 3
Inflation, GDP deflator (annual %) 17 10.2 5.8 11.7 16.1 18 22 16 21
Agriculture, value added (% of GDP) 9 9.4 8.6 8.4 7.6 7 6 6 6
Industry, value added (% of GDP) 40 38.8 38.6 37.6 37.6 40 42 41 43
Services, etc., value added (% of GDP) 51 51.8 52.8 53.9 54.8 53 52 53 51
Exports of goods and services (% of GDP) 57 45.9 47.0 48.4 52.5 53 51 49 57
Imports of goods and services (% of GDP) 49 47.0 47.0 43.0 43.9 45 40 43 37
Revenue, excluding grants (% of GDP) 11 11.4 13.2 13.9 15.1 .. .. .. ..
Cash surplus/deficit (% of GDP) 0 0.1 0.3 (0.6) 0.2 .. .. .. ..
Domestic credit provided by financial sector (% of GDP) 12 11.6 13.1 14.8 21.1 25 32 41 54
Tax revenue (% of GDP) 10 9.6 12.1 13.1 13.9 .. .. .. ..
Military expenditure (% of GDP) 1 1.0 1.0 1.0 1.0 1 1 1 1
Merchandise trade (% of GDP) 76 68.1 66.0 69.2 76.2 79 76 77 82
Total debt service (% of exports of goods, services and
primary income) 32 32.4 34.9 34.8 38.0 42 33 49 42
Personal remittances, received (current US$) 121,802,437 171,272,735.6 204,929,046.6 147,501,953.1 165,835,662.8 62,021,921 83,589,870 142,991,414 125,570,547
Foreign direct investment, net inflows (BoP, current US$) 1,282,524,399 2,834,998,600.0 2,590,217,570.0 2,092,028,800.0 4,157,208,487.0 2,546,065,710 7,611,168,450 11,972,842,989 16,818,890,680
Net official development assistance and official aid
received (current US$) 189,190,000 157,000,000.0 187,420,000.0 293,860,000.0 267,760,000.0 228,880,000 174,300,000 210,820,000 335,410,000
Created from: World Development Indicators
Country : Kazakhstan

CE
UeT
DC
olle
ctio
n
Table 7c: Kazakhstan economic indicators (World Bank)
68
2009 2010 2011 2012 2013
Population, total 16,092,701 16,321,581 16,556,600 16,791,425 17,035,275
Population growth (annual %) 3 1 1 1 1
GDP (current US$) 115,308,661,143 148,047,348,241 188,048,960,311 203,517,198,089 231,876,282,134
GDP growth (annual %) 1 7 8 5 6
Inflation, GDP deflator (annual %) 5 20 18 5 10
Agriculture, value added (% of GDP) 6 5 5 5 5
Industry, value added (% of GDP) 40 43 41 39 37
Services, etc., value added (% of GDP) 53 52 54 56 58
Exports of goods and services (% of GDP) 42 44 48 45 38
Imports of goods and services (% of GDP) 34 30 27 30 27
Revenue, excluding grants (% of GDP) .. .. .. .. ..
Cash surplus/deficit (% of GDP) .. .. .. .. ..
Domestic credit provided by financial sector (% of GDP) 55 45 40 41 39
Tax revenue (% of GDP) .. .. .. .. ..
Military expenditure (% of GDP) 1 1 1 1 1
Merchandise trade (% of GDP) 62 62 64 65 57
Total debt service (% of exports of goods, services and
primary income) 50 58 35 25 34
Personal remittances, received (current US$) 198,201,188 225,556,234 179,708,291 171,297,945 207,247,135
Foreign direct investment, net inflows (BoP, current US$) 14,275,888,207 7,456,117,901 13,760,291,529 13,784,782,314 9,738,521,652
Net official development assistance and official aid
received (current US$) 297,520,000 223,930,000 215,510,000 129,640,000 91,320,000
Created from: World Development Indicators
Country : Kazakhstan

CE
UeT
DC
olle
ctio
n
Table 8a: Uzbekistan economic indicators (World Bank)
69
1990 1991 1992 1993 1994 1995 1996 1997 1998
Population, total 20,510,000 20,952,000.00 21,449,000.00 21,942,000.00 22,377,000.00 22,785,000.00 23,225,000.00 23,667,000.00 24,051,000.00
Population growth (annual %) 2 2.13 2.34 2.27 1.96 1.81 1.91 1.89 1.61
GDP (current US$) 13,360,607,991 13,800,157,749.29 12,953,800,571.03 13,099,928,531.86 12,899,074,347.33 13,350,461,532.66 13,948,892,215.57 14,744,603,773.58 14,988,971,210.84
GDP growth (annual %) 2 (0.49) (11.20) (2.30) (5.20) (0.90) 1.70 5.20 4.30
Inflation, GDP deflator (annual %) 4 90.73 712.15 1,078.88 1,238.60 370.94 81.56 66.09 39.00
Agriculture, value added (% of GDP) 33 36.98 34.83 30.45 37.43 32.29 26.14 32.18 31.31
Industry, value added (% of GDP) 33 36.57 35.81 34.47 26.43 27.80 30.48 26.11 26.17
Services, etc., value added (% of GDP) 34 26.46 29.37 35.08 36.15 39.91 43.38 41.71 42.52
Exports of goods and services (% of GDP) 29 35.28 27.03 33.72 16.78 36.68 27.69 27.04 22.50
Imports of goods and services (% of GDP) 48 39.14 43.18 30.53 20.55 36.82 34.18 30.00 22.80
Military expenditure (% of GDP) .. 1.54 1.12 1.23 1.40
Merchandise trade (% of GDP) .. 39.96 46.29 63.95 55.68 45.50
Foreign direct investment, net inflows (BoP,
current US$) .. 9,000,000.00 48,000,000.00 73,000,000.00 (24,000,000.00) 90,000,000.00 166,800,000.00 139,600,000.00
Net official development assistance and official
aid received (current US$) .. 1,510,000.00 7,980,000.00 28,250,000.00 83,720,000.00 87,690,000.00 139,710,000.00 158,330,000.00
Created from: World Development Indicators
Country : Uzbekistan

CE
UeT
DC
olle
ctio
n
Table 8b: Uzbekistan economic indicators (World Bank)
70
1999 2000 2001 2002 2003 2004 2005 2006 2007
Population, total 24,311,650.00 24,650,400 24,964,450.00 25,271,850.00 25,567,650.00 25,864,350.00 26,167,000 26,488,250 26,868,000
Population growth (annual %) 1.08 1 1.27 1.22 1.16 1.15 1 1 1
GDP (current US$) 17,078,465,982.03 13,760,374,488 11,401,351,420.17 9,687,951,055.23 10,128,112,401.42 12,030,023,547.88 14,307,509,839 17,030,896,203 22,311,393,928
GDP growth (annual %) 4.30 4 4.20 4.00 4.20 7.70 7 7 10
Inflation, GDP deflator (annual %) 44.12 47 45.19 45.45 26.72 15.72 21 22 24
Agriculture, value added (% of GDP) 33.52 34 34.01 34.25 33.12 30.77 28 26 24
Industry, value added (% of GDP) 24.31 23 22.64 22.05 23.50 25.96 23 27 32
Services, etc., value added (% of GDP) 42.17 43 43.36 43.70 43.38 43.27 49 46 44
Exports of goods and services (% of GDP) 18.15 25 28.08 30.81 37.27 40.21 38 37 40
Imports of goods and services (% of GDP) 18.41 22 27.65 29.35 30.58 32.65 29 31 37
Military expenditure (% of GDP) 1.64 1 0.83 0.60 0.54 .. .. ..
Merchandise trade (% of GDP) 37.15 40 48.43 50.97 57.77 63.77 59 59 64
Foreign direct investment, net inflows (BoP,
current US$) 121,200,000.00 74,700,000 82,800,000.00 65,300,000.00 82,600,000.00 176,600,000.00 191,600,000 173,800,000 705,200,000
Net official development assistance and official
aid received (current US$) 155,400,000.00 185,750,000 153,880,000.00 189,250,000.00 194,550,000.00 245,890,000.00 169,790,000 149,300,000 169,850,000
Created from: World Development Indicators
Country : Uzbekistan

CE
UeT
DC
olle
ctio
n
Table 8c: Uzbekistan economic indicators (World Bank)
71
2008 2009 2010 2011 2012 2013
Population, total 27,302,800 27,767,400 28,562,400 29,339,400 29,774,500 30,243,200
Population growth (annual %) 2 2 3 3 1 2
GDP (current US$) 27,934,030,937 32,816,828,373 39,332,770,929 45,324,319,955 51,183,443,225 56,795,656,325
GDP growth (annual %) 9 8 8 8 8 8
Inflation, GDP deflator (annual %) 20 21 20 15 15 14
Agriculture, value added (% of GDP) 21 20 19 19 19 19
Industry, value added (% of GDP) 31 33 33 33 32 26
Services, etc., value added (% of GDP) 48 47 48 48 49 55
Exports of goods and services (% of GDP) 44 36 32 33 28 28
Imports of goods and services (% of GDP) 41 36 29 31 33 32
Military expenditure (% of GDP) .. .. .. .. .. ..
Merchandise trade (% of GDP) 70 60 52 52 45 45
Foreign direct investment, net inflows (BoP,
current US$) 711,300,000 842,000,000 1,628,000,000 1,651,000,000 674,000,000 1,077,000,000
Net official development assistance and official
aid received (current US$) 187,320,000 189,750,000 230,850,000 203,210,000 255,260,000 292,550,000
Created from: World Development Indicators
Country : Uzbekistan
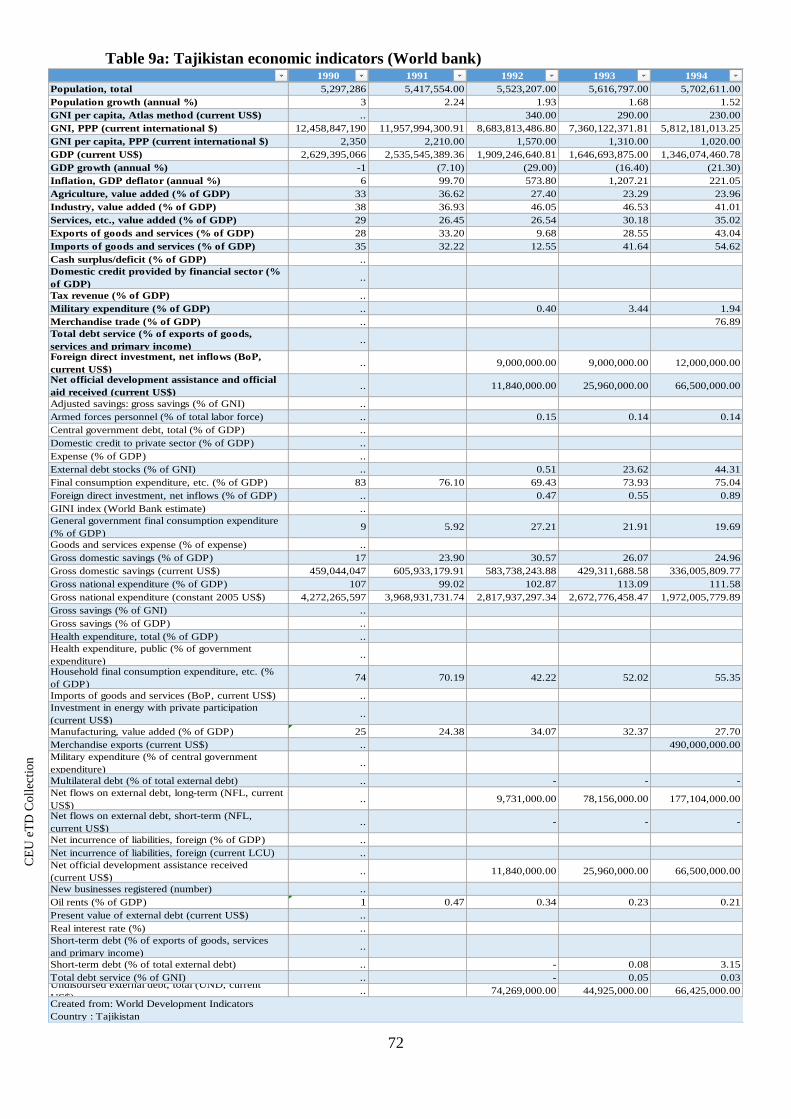
CE
UeT
DC
olle
ctio
n
Table 9a: Tajikistan economic indicators (World bank)
72
1990 1991 1992 1993 1994
Population, total 5,297,286 5,417,554.00 5,523,207.00 5,616,797.00 5,702,611.00
Population growth (annual %) 3 2.24 1.93 1.68 1.52
GNI per capita, Atlas method (current US$) .. 340.00 290.00 230.00
GNI, PPP (current international $) 12,458,847,190 11,957,994,300.91 8,683,813,486.80 7,360,122,371.81 5,812,181,013.25
GNI per capita, PPP (current international $) 2,350 2,210.00 1,570.00 1,310.00 1,020.00
GDP (current US$) 2,629,395,066 2,535,545,389.36 1,909,246,640.81 1,646,693,875.00 1,346,074,460.78
GDP growth (annual %) -1 (7.10) (29.00) (16.40) (21.30)
Inflation, GDP deflator (annual %) 6 99.70 573.80 1,207.21 221.05
Agriculture, value added (% of GDP) 33 36.62 27.40 23.29 23.96
Industry, value added (% of GDP) 38 36.93 46.05 46.53 41.01
Services, etc., value added (% of GDP) 29 26.45 26.54 30.18 35.02
Exports of goods and services (% of GDP) 28 33.20 9.68 28.55 43.04
Imports of goods and services (% of GDP) 35 32.22 12.55 41.64 54.62
Cash surplus/deficit (% of GDP) ..
Domestic credit provided by financial sector (%
of GDP) ..
Tax revenue (% of GDP) ..
Military expenditure (% of GDP) .. 0.40 3.44 1.94
Merchandise trade (% of GDP) .. 76.89
Total debt service (% of exports of goods,
services and primary income) ..
Foreign direct investment, net inflows (BoP,
current US$) .. 9,000,000.00 9,000,000.00 12,000,000.00
Net official development assistance and official
aid received (current US$) .. 11,840,000.00 25,960,000.00 66,500,000.00
Adjusted savings: gross savings (% of GNI) ..
Armed forces personnel (% of total labor force) .. 0.15 0.14 0.14
Central government debt, total (% of GDP) ..
Domestic credit to private sector (% of GDP) ..
Expense (% of GDP) ..
External debt stocks (% of GNI) .. 0.51 23.62 44.31
Final consumption expenditure, etc. (% of GDP) 83 76.10 69.43 73.93 75.04
Foreign direct investment, net inflows (% of GDP) .. 0.47 0.55 0.89
GINI index (World Bank estimate) ..
General government final consumption expenditure
(% of GDP) 9 5.92 27.21 21.91 19.69
Goods and services expense (% of expense) ..
Gross domestic savings (% of GDP) 17 23.90 30.57 26.07 24.96
Gross domestic savings (current US$) 459,044,047 605,933,179.91 583,738,243.88 429,311,688.58 336,005,809.77
Gross national expenditure (% of GDP) 107 99.02 102.87 113.09 111.58
Gross national expenditure (constant 2005 US$) 4,272,265,597 3,968,931,731.74 2,817,937,297.34 2,672,776,458.47 1,972,005,779.89
Gross savings (% of GNI) ..
Gross savings (% of GDP) ..
Health expenditure, total (% of GDP) ..
Health expenditure, public (% of government
expenditure) ..
Household final consumption expenditure, etc. (%
of GDP) 74 70.19 42.22 52.02 55.35
Imports of goods and services (BoP, current US$) ..
Investment in energy with private participation
(current US$) ..
Manufacturing, value added (% of GDP) 25 24.38 34.07 32.37 27.70
Merchandise exports (current US$) .. 490,000,000.00
Military expenditure (% of central government
expenditure) ..
Multilateral debt (% of total external debt) .. - - -
Net flows on external debt, long-term (NFL, current
US$) .. 9,731,000.00 78,156,000.00 177,104,000.00
Net flows on external debt, short-term (NFL,
current US$) .. - - -
Net incurrence of liabilities, foreign (% of GDP) ..
Net incurrence of liabilities, foreign (current LCU) ..
Net official development assistance received
(current US$) .. 11,840,000.00 25,960,000.00 66,500,000.00
New businesses registered (number) ..
Oil rents (% of GDP) 1 0.47 0.34 0.23 0.21
Present value of external debt (current US$) ..
Real interest rate (%) ..
Short-term debt (% of exports of goods, services
and primary income) ..
Short-term debt (% of total external debt) .. - 0.08 3.15
Total debt service (% of GNI) .. - 0.05 0.03 Undisbursed external debt, total (UND, current
US$) .. 74,269,000.00 44,925,000.00 66,425,000.00
Created from: World Development Indicators
Country : Tajikistan
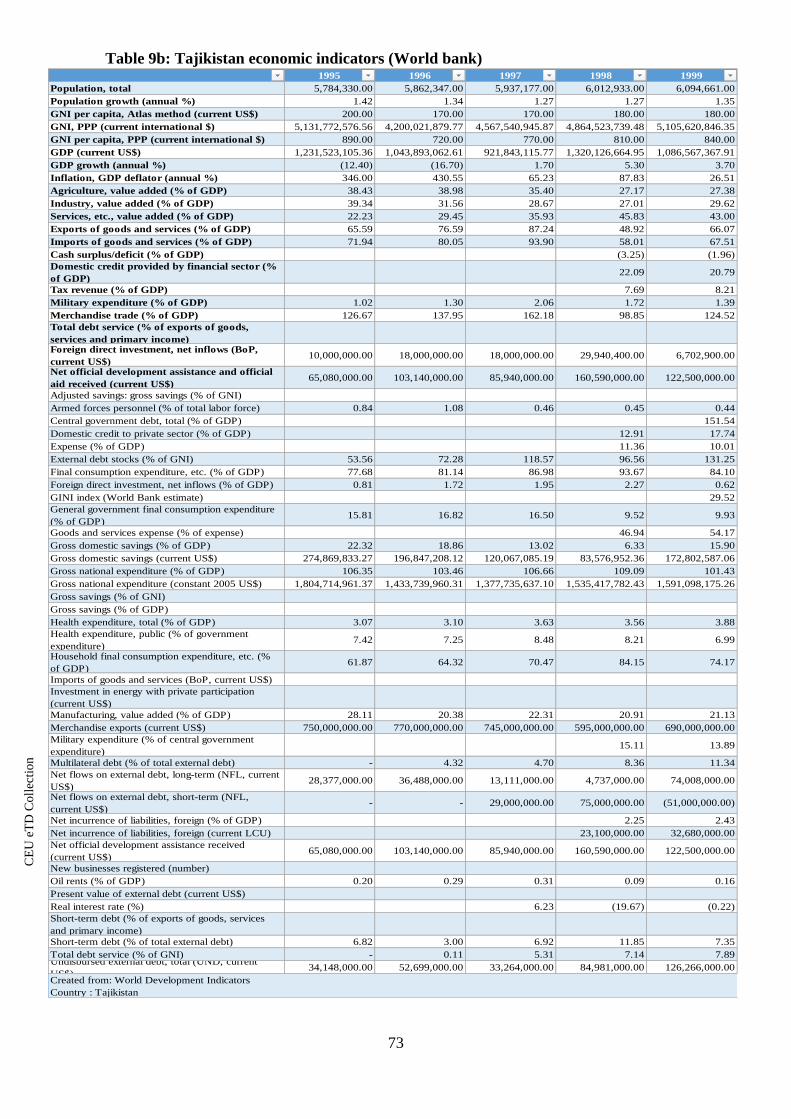
CE
UeT
DC
olle
ctio
n
Table 9b: Tajikistan economic indicators (World bank)
73
1995 1996 1997 1998 1999
Population, total 5,784,330.00 5,862,347.00 5,937,177.00 6,012,933.00 6,094,661.00
Population growth (annual %) 1.42 1.34 1.27 1.27 1.35
GNI per capita, Atlas method (current US$) 200.00 170.00 170.00 180.00 180.00
GNI, PPP (current international $) 5,131,772,576.56 4,200,021,879.77 4,567,540,945.87 4,864,523,739.48 5,105,620,846.35
GNI per capita, PPP (current international $) 890.00 720.00 770.00 810.00 840.00
GDP (current US$) 1,231,523,105.36 1,043,893,062.61 921,843,115.77 1,320,126,664.95 1,086,567,367.91
GDP growth (annual %) (12.40) (16.70) 1.70 5.30 3.70
Inflation, GDP deflator (annual %) 346.00 430.55 65.23 87.83 26.51
Agriculture, value added (% of GDP) 38.43 38.98 35.40 27.17 27.38
Industry, value added (% of GDP) 39.34 31.56 28.67 27.01 29.62
Services, etc., value added (% of GDP) 22.23 29.45 35.93 45.83 43.00
Exports of goods and services (% of GDP) 65.59 76.59 87.24 48.92 66.07
Imports of goods and services (% of GDP) 71.94 80.05 93.90 58.01 67.51
Cash surplus/deficit (% of GDP) (3.25) (1.96)
Domestic credit provided by financial sector (%
of GDP) 22.09 20.79
Tax revenue (% of GDP) 7.69 8.21
Military expenditure (% of GDP) 1.02 1.30 2.06 1.72 1.39
Merchandise trade (% of GDP) 126.67 137.95 162.18 98.85 124.52
Total debt service (% of exports of goods,
services and primary income)Foreign direct investment, net inflows (BoP,
current US$) 10,000,000.00 18,000,000.00 18,000,000.00 29,940,400.00 6,702,900.00
Net official development assistance and official
aid received (current US$) 65,080,000.00 103,140,000.00 85,940,000.00 160,590,000.00 122,500,000.00
Adjusted savings: gross savings (% of GNI)
Armed forces personnel (% of total labor force) 0.84 1.08 0.46 0.45 0.44
Central government debt, total (% of GDP) 151.54
Domestic credit to private sector (% of GDP) 12.91 17.74
Expense (% of GDP) 11.36 10.01
External debt stocks (% of GNI) 53.56 72.28 118.57 96.56 131.25
Final consumption expenditure, etc. (% of GDP) 77.68 81.14 86.98 93.67 84.10
Foreign direct investment, net inflows (% of GDP) 0.81 1.72 1.95 2.27 0.62
GINI index (World Bank estimate) 29.52
General government final consumption expenditure
(% of GDP) 15.81 16.82 16.50 9.52 9.93
Goods and services expense (% of expense) 46.94 54.17
Gross domestic savings (% of GDP) 22.32 18.86 13.02 6.33 15.90
Gross domestic savings (current US$) 274,869,833.27 196,847,208.12 120,067,085.19 83,576,952.36 172,802,587.06
Gross national expenditure (% of GDP) 106.35 103.46 106.66 109.09 101.43
Gross national expenditure (constant 2005 US$) 1,804,714,961.37 1,433,739,960.31 1,377,735,637.10 1,535,417,782.43 1,591,098,175.26
Gross savings (% of GNI)
Gross savings (% of GDP)
Health expenditure, total (% of GDP) 3.07 3.10 3.63 3.56 3.88
Health expenditure, public (% of government
expenditure) 7.42 7.25 8.48 8.21 6.99
Household final consumption expenditure, etc. (%
of GDP) 61.87 64.32 70.47 84.15 74.17
Imports of goods and services (BoP, current US$)
Investment in energy with private participation
(current US$)
Manufacturing, value added (% of GDP) 28.11 20.38 22.31 20.91 21.13
Merchandise exports (current US$) 750,000,000.00 770,000,000.00 745,000,000.00 595,000,000.00 690,000,000.00
Military expenditure (% of central government
expenditure) 15.11 13.89
Multilateral debt (% of total external debt) - 4.32 4.70 8.36 11.34
Net flows on external debt, long-term (NFL, current
US$) 28,377,000.00 36,488,000.00 13,111,000.00 4,737,000.00 74,008,000.00
Net flows on external debt, short-term (NFL,
current US$) - - 29,000,000.00 75,000,000.00 (51,000,000.00)
Net incurrence of liabilities, foreign (% of GDP) 2.25 2.43
Net incurrence of liabilities, foreign (current LCU) 23,100,000.00 32,680,000.00
Net official development assistance received
(current US$) 65,080,000.00 103,140,000.00 85,940,000.00 160,590,000.00 122,500,000.00
New businesses registered (number)
Oil rents (% of GDP) 0.20 0.29 0.31 0.09 0.16
Present value of external debt (current US$)
Real interest rate (%) 6.23 (19.67) (0.22)
Short-term debt (% of exports of goods, services
and primary income)
Short-term debt (% of total external debt) 6.82 3.00 6.92 11.85 7.35
Total debt service (% of GNI) - 0.11 5.31 7.14 7.89 Undisbursed external debt, total (UND, current
US$) 34,148,000.00 52,699,000.00 33,264,000.00 84,981,000.00 126,266,000.00
Created from: World Development Indicators
Country : Tajikistan

CE
UeT
DC
olle
ctio
n
Table 9c: Tajikistan economic indicators (World bank)
74
2000 2001 2002 2003 2004
Population, total 6,186,152 6,289,340.00 6,404,118.00 6,529,609.00 6,663,929.00
Population growth (annual %) 1 1.65 1.81 1.94 2.04
GNI per capita, Atlas method (current US$) 170 160.00 170.00 210.00 270.00
GNI, PPP (current international $) 5,569,286,920 6,244,926,802.57 7,028,388,856.30 7,860,513,191.24 9,108,743,429.03
GNI per capita, PPP (current international $) 900 990.00 1,100.00 1,200.00 1,370.00
GDP (current US$) 860,550,294 1,080,774,005.56 1,221,113,794.73 1,554,125,542.56 2,076,148,710.32
GDP growth (annual %) 8 10.20 10.80 11.00 10.30
Inflation, GDP deflator (annual %) 23 30.21 18.82 26.99 17.52
Agriculture, value added (% of GDP) 27 26.16 24.66 27.11 21.60
Industry, value added (% of GDP) 39 40.08 39.43 37.45 35.40
Services, etc., value added (% of GDP) 34 33.77 35.91 35.45 42.99
Exports of goods and services (% of GDP) 99 67.99 65.46 63.37 58.31
Imports of goods and services (% of GDP) 101 78.36 76.09 73.49 69.91
Cash surplus/deficit (% of GDP) -1 (0.15) (4.58) (6.61)
Domestic credit provided by financial sector (%
of GDP) 18 22.34 18.05 15.16 6.92
Tax revenue (% of GDP) 8 8.20 9.71 9.82
Military expenditure (% of GDP) 1 1.15 2.09 2.25 2.17
Merchandise trade (% of GDP) 170 123.80 119.48 107.97 101.45
Total debt service (% of exports of goods,
services and primary income) .. 12.69 8.43 8.31
Foreign direct investment, net inflows (BoP,
current US$) 23,543,300 9,495,400.00 36,066,400.00 31,649,700.00 272,025,100.00
Net official development assistance and official
aid received (current US$) 123,540,000 165,300,000.00 168,350,000.00 148,110,000.00 253,420,000.00
Adjusted savings: gross savings (% of GNI) .. 14.39 11.90 10.88
Armed forces personnel (% of total labor force) 0 0.30 0.29 0.28 0.45
Central government debt, total (% of GDP) 114 79.80
Domestic credit to private sector (% of GDP) 14 22.91 17.45 14.76 6.13
Expense (% of GDP) 9 9.48 11.18 13.75
External debt stocks (% of GNI) 138 112.81 107.62 86.73 58.19
Final consumption expenditure, etc. (% of GDP) 93 93.67 96.83 97.02 96.70
Foreign direct investment, net inflows (% of GDP) 3 0.88 2.95 2.04 13.10
GINI index (World Bank estimate) .. 32.72 33.60
General government final consumption expenditure
(% of GDP) 8 8.66 8.60 8.27 11.78
Goods and services expense (% of expense) 31 35.72 33.13 28.76
Gross domestic savings (% of GDP) 7 6.33 3.17 2.98 3.30
Gross domestic savings (current US$) 62,502,250 68,409,686.52 38,696,205.06 46,380,289.21 68,601,074.46
Gross national expenditure (% of GDP) 102 110.37 110.63 110.12 111.60
Gross national expenditure (constant 2005 US$) 1,758,036,621 1,861,185,219.18 2,074,955,240.61 2,320,578,213.87 2,630,833,981.27
Gross savings (% of GNI) .. 14.39 11.90 10.88
Gross savings (% of GDP) .. 13.72 11.21 10.48
Health expenditure, total (% of GDP) 5 4.59 4.48 4.46 5.07
Health expenditure, public (% of government
expenditure) 6 6.41 5.64 5.61 5.33
Household final consumption expenditure, etc. (%
of GDP) 84 85.01 88.23 88.75 84.91
Imports of goods and services (BoP, current US$) ..
Investment in energy with private participation
(current US$) .. 16,000,000.00
Manufacturing, value added (% of GDP) 34 34.12 34.24 31.35 24.29
Merchandise exports (current US$) 785,000,000 650,000,000.00 738,000,000.00 797,000,000.00 914,900,000.00
Military expenditure (% of central government
expenditure) 13 12.18 20.12 15.80
Multilateral debt (% of total external debt) 16 22.74 24.41 30.58 42.51
Net flows on external debt, long-term (NFL, current
US$) 9,135,000 53,689,000.00 (20,796,000.00) 7,370,000.00 37,044,000.00
Net flows on external debt, short-term (NFL,
current US$) -28,980,000 19,980,000.00 (1,000,000.00) 28,000,000.00 4,000,000.00
Net incurrence of liabilities, foreign (% of GDP) 0 0.17
Net incurrence of liabilities, foreign (current LCU) 8,811,000 4,255,000.00
Net official development assistance received
(current US$) 123,540,000 165,300,000.00 168,350,000.00 148,110,000.00 253,420,000.00
New businesses registered (number) .. 823.00
Oil rents (% of GDP) 0 0.20 0.18 0.17 0.21
Present value of external debt (current US$) ..
Real interest rate (%) 2 (7.03) (3.88) (8.08) 2.38
Short-term debt (% of exports of goods, services
and primary income) ..
Short-term debt (% of total external debt) 7 6.82 4.78 6.39 7.16
Total debt service (% of GNI) 8 8.09 8.39 5.73 5.08 Undisbursed external debt, total (UND, current
US$) 137,616,000 255,614,000.00 301,894,000.00 347,380,000.00 396,001,000.00
Created from: World Development Indicators
Country : Tajikistan

CE
UeT
DC
olle
ctio
n
Table 9d: Tajikistan economic indicators (World bank)
75
2005 2006 2007 2008 2009
Population, total 6,805,655 6,954,522 7,111,025 7,275,252 7,447,396
Population growth (annual %) 2 2 2 2 2
GNI per capita, Atlas method (current US$) 320 370 440 570 650
GNI, PPP (current international $) 10,062,101,776 11,076,119,619 12,420,153,304 13,839,397,859 14,419,140,890
GNI per capita, PPP (current international $) 1,480 1,590 1,750 1,900 1,940
GDP (current US$) 2,312,319,579 2,830,236,054 3,719,497,371 5,161,336,170 4,979,481,980
GDP growth (annual %) 7 7 8 8 4
Inflation, GDP deflator (annual %) 10 21 27 28 12
Agriculture, value added (% of GDP) 24 24 22 23 21
Industry, value added (% of GDP) 31 31 30 28 28
Services, etc., value added (% of GDP) 45 45 47 49 51
Exports of goods and services (% of GDP) 26 23 21 17 15
Imports of goods and services (% of GDP) 53 57 69 72 54
Cash surplus/deficit (% of GDP) .. .. .. .. ..
Domestic credit provided by financial sector (%
of GDP) 13 14 17 20 9
Tax revenue (% of GDP) .. .. .. .. ..
Military expenditure (% of GDP) .. .. .. .. ..
Merchandise trade (% of GDP) 97 110 105 91 72
Total debt service (% of exports of goods,
services and primary income) 6 4 4 7 38
Foreign direct investment, net inflows (BoP,
current US$) 54,479,300 338,627,400 359,967,400 375,787,400 15,819,400
Net official development assistance and official
aid received (current US$) 251,500,000 241,240,000 222,110,000 288,680,000 408,120,000
Adjusted savings: gross savings (% of GNI) 4 3 15 13 13
Armed forces personnel (% of total labor force) 0 1 1 1 1
Central government debt, total (% of GDP) .. .. .. .. ..
Domestic credit to private sector (% of GDP) 9 10 13 21 13
Expense (% of GDP) .. .. .. .. ..
External debt stocks (% of GNI) 50 39 37 49 54
Final consumption expenditure, etc. (% of GDP) 112 120 125 135 121
Foreign direct investment, net inflows (% of GDP) 2 12 10 7 0
GINI index (World Bank estimate) .. .. 32 .. 31
General government final consumption expenditure
(% of GDP) 15 11 9 9 12
Goods and services expense (% of expense) .. .. .. .. ..
Gross domestic savings (% of GDP) -12 -20 -25 -35 -21
Gross domestic savings (current US$) -277,465,710 -573,647,464 -936,101,358 -1,786,199,781 -1,021,930,745
Gross national expenditure (% of GDP) 127 134 148 155 139
Gross national expenditure (constant 2005 US$) 2,932,008,587 3,002,834,436 3,224,640,718 3,543,312,548 3,708,022,731
Gross savings (% of GNI) 4 3 15 13 13
Gross savings (% of GDP) 4 2 14 13 13
Health expenditure, total (% of GDP) 6 6 5 6 6
Health expenditure, public (% of government
expenditure) 6 6 4 5 5
Household final consumption expenditure, etc. (%
of GDP) 97 109 116 125 108
Imports of goods and services (BoP, current US$) 1,682,444,600 2,349,087,900 3,707,084,000 4,154,561,600 3,062,126,500
Investment in energy with private participation
(current US$) .. 720,000,000 .. 220,000,000 ..
Manufacturing, value added (% of GDP) 24 22 19 14 14
Merchandise exports (current US$) 909,000,000 1,399,000,000 1,468,000,000 1,408,700,000 1,010,300,000
Military expenditure (% of central government
expenditure) .. .. .. .. ..
Multilateral debt (% of total external debt) 46 56 50 29 31
Net flows on external debt, long-term (NFL, current
US$) 65,519,000 107,623,000 224,205,000 315,434,000 109,215,000
Net flows on external debt, short-term (NFL,
current US$) -57,600,000 3,800,000 43,200,000 17,700,000 -15,800,000
Net incurrence of liabilities, foreign (% of GDP) .. .. .. .. ..
Net incurrence of liabilities, foreign (current LCU) .. .. .. .. ..
Net official development assistance received
(current US$) 251,500,000 241,240,000 222,110,000 288,680,000 408,120,000
New businesses registered (number) 844 849 871 1,059 2,219
Oil rents (% of GDP) 0 0 0 0 0
Present value of external debt (current US$) .. .. .. .. ..
Real interest rate (%) 13 3 -3 -4 9
Short-term debt (% of exports of goods, services
and primary income) 2 2 4 5 6
Short-term debt (% of total external debt) 2 3 5 4 3
Total debt service (% of GNI) 3 3 2 2 9 Undisbursed external debt, total (UND, current
US$) 339,361,000 853,345,000 739,148,000 491,344,000 373,443,000
Created from: World Development Indicators
Country : Tajikistan

CE
UeT
DC
olle
ctio
n
Table 9e: Tajikistan economic indicators (World bank)
76
2010 2011 2012 2013
Population, total 7,627,326 7,814,850 8,008,990 8,207,834
Population growth (annual %) 2 2 2 2
GNI per capita, Atlas method (current US$) 730 780 880 990
GNI, PPP (current international $) 15,550,341,527 17,182,065,998 18,789,475,203 20,498,360,886
GNI per capita, PPP (current international $) 2,040 2,200 2,350 2,500
GDP (current US$) 5,642,178,580 6,522,732,203 7,633,049,792 8,508,103,456
GDP growth (annual %) 7 7 8 7
Inflation, GDP deflator (annual %) 12 13 12 4
Agriculture, value added (% of GDP) 22 27 27 27
Industry, value added (% of GDP) 28 22 23 22
Services, etc., value added (% of GDP) 50 50 51 51
Exports of goods and services (% of GDP) 15 18 22 19
Imports of goods and services (% of GDP) 53 67 69 68
Cash surplus/deficit (% of GDP) .. .. .. ..
Domestic credit provided by financial sector (%
of GDP) 7 11 13 19
Tax revenue (% of GDP) .. .. .. ..
Military expenditure (% of GDP) .. .. .. ..
Merchandise trade (% of GDP) 68 68 67 62
Total debt service (% of exports of goods,
services and primary income) 76 48 25 ..
Foreign direct investment, net inflows (BoP,
current US$) -15,675,300 67,496,200 198,280,200 107,812,500
Net official development assistance and official
aid received (current US$) 436,650,000 347,510,000 393,910,000 382,220,000
Adjusted savings: gross savings (% of GNI) 18 16 17 ..
Armed forces personnel (% of total labor force) 0 0 0 0
Central government debt, total (% of GDP) .. .. .. ..
Domestic credit to private sector (% of GDP) 13 13 13 18
Expense (% of GDP) .. .. .. ..
External debt stocks (% of GNI) 55 51 48 42
Final consumption expenditure, etc. (% of GDP) 119 129 128 130
Foreign direct investment, net inflows (% of GDP) 0 1 3 1
GINI index (World Bank estimate) .. .. .. ..
General government final consumption expenditure
(% of GDP) 11 14 9 12
Goods and services expense (% of expense) .. .. .. ..
Gross domestic savings (% of GDP) -19 -29 -28 -30
Gross domestic savings (current US$) -1,092,664,762 -1,879,897,159 -2,133,049,703 -2,557,046,339
Gross national expenditure (% of GDP) 137 149 148 149
Gross national expenditure (constant 2005 US$) 3,957,543,874 4,248,318,713 4,559,931,747 4,887,091,347
Gross savings (% of GNI) 18 16 17 ..
Gross savings (% of GDP) 18 16 17 ..
Health expenditure, total (% of GDP) 6 6 6 7
Health expenditure, public (% of government
expenditure) 6 6 7 7
Household final consumption expenditure, etc. (%
of GDP) 108 115 119 118
Imports of goods and services (BoP, current US$) 3,364,459,466 4,239,351,120 5,273,051,879 ..
Investment in energy with private participation
(current US$) .. .. .. ..
Manufacturing, value added (% of GDP) 15 11 11 11
Merchandise exports (current US$) 1,195,300,000 1,256,800,000 1,358,000,000 1,163,400,000
Military expenditure (% of central government
expenditure) .. .. .. ..
Multilateral debt (% of total external debt) 31 29 27 27
Net flows on external debt, long-term (NFL, current
US$) 293,937,000 210,342,000 221,606,000 -215,318,000
Net flows on external debt, short-term (NFL,
current US$) 47,340,000 7,360,000 -129,000,000 108,000,000
Net incurrence of liabilities, foreign (% of GDP) .. .. .. ..
Net incurrence of liabilities, foreign (current LCU) .. .. .. ..
Net official development assistance received
(current US$) 436,650,000 347,510,000 393,910,000 382,220,000
New businesses registered (number) 3,048 1,232 1,251 ..
Oil rents (% of GDP) 0 0 0 0
Present value of external debt (current US$) .. .. .. 2,357,775,390
Real interest rate (%) 10 8 8 19
Short-term debt (% of exports of goods, services
and primary income) 14 11 1 ..
Short-term debt (% of total external debt) 4 4 0 4
Total debt service (% of GNI) 12 9 6 5 Undisbursed external debt, total (UND, current
US$) 442,233,000 314,755,000 259,164,000 403,452,000
Created from: World Development Indicators
Country : Tajikistan

CE
UeT
DC
olle
ctio
n
Table 10a: Kyrgyzstan economic indicators (World Bank)
77
1990 1991 1992 1993 1994 1995 1996 1997 1998
Population, total 4,391,200 4,463,600.00 4,515,400.00 4,516,700.00 4,515,100.00 4,560,400.00 4,628,400.00 4,696,400.00 4,769,000.00
Population growth (annual %) 2 1.64 1.15 0.03 (0.04) 1.00 1.48 1.46 1.53
GDP (current US$) 2,674,000,000 2,570,833,333.33 2,316,562,400.00 2,028,295,454.55 1,681,006,993.01 1,661,018,518.52 1,827,570,586.17 1,767,864,035.72 1,645,963,749.83
GDP growth (annual %) 6 (7.85) (13.89) (15.46) (20.09) (5.42) 7.08 9.92 2.12
Inflation, GDP deflator (annual %) 8 134.75 830.16 754.43 180.87 42.03 35.34 19.31 9.08
Agriculture, value added (% of GDP) 34 36.98 39.05 41.01 40.88 43.90 49.75 44.61 39.53
Industry, value added (% of GDP) 35 35.46 37.79 32.00 25.45 19.54 18.29 22.81 22.76
Services, etc., value added (% of GDP) 31 27.57 23.16 26.99 33.67 36.55 31.96 32.58 37.70
Exports of goods and services (% of GDP) 29 35.33 35.59 33.53 33.76 29.47 30.74 38.29 36.48
Imports of goods and services (% of GDP) 50 36.63 47.59 41.18 40.07 42.36 56.56 46.19 58.03
Revenue, excluding grants (% of GDP) .. 15.49 15.57 16.67 14.84 15.34 17.56
Cash surplus/deficit (% of GDP) .. (10.75) (5.46) (5.98) (3.64)
Domestic credit provided by financial sector (%
of GDP) .. 25.65 25.14 18.18 20.04
Tax revenue (% of GDP) .. 14.86 14.68 15.06 12.59 12.51 14.23
Military expenditure (% of GDP) .. 1.64 1.53 2.59 3.46 2.99 3.11 2.67
Merchandise trade (% of GDP) .. 39.02 56.05 73.49 74.27 82.38
Total debt service (% of exports of goods,
services and primary income) .. 0.41 4.39 13.25 13.09 11.40 18.83
Personal remittances, received (current US$) .. 1,784,999.97 1,001,999.97 1,243,000.03 2,440,000.06 2,740,000.01 24,695,999.15
Foreign direct investment, net inflows (BoP,
current US$) .. 10,000,000.00 38,178,000.00 96,090,000.00 47,238,000.00 83,820,000.00 109,228,485.00
Net official development assistance and official
aid received (current US$) .. 21,080,000.00 95,010,000.00 173,500,000.00 284,670,000.00 230,450,000.00 239,550,000.00 239,450,000.00
Created from: World Development Indicators
Country : Kyrgyz Republic

CE
UeT
DC
olle
ctio
n
Table 10b: Kyrgyzstan economic indicators (World Bank)
78
1999 2000 2001 2002 2003 2004 2005 2006 2007
Population, total 4,840,400.00 4,898,400 4,945,100.00 4,990,700.00 5,043,300.00 5,104,700.00 5,162,600 5,218,400 5,268,400
Population growth (annual %) 1.49 1 0.95 0.92 1.05 1.21 1 1 1
GDP (current US$) 1,249,062,025.14 1,369,691,955 1,525,113,501.11 1,605,640,633.42 1,919,012,780.97 2,211,535,311.63 2,459,876,152 2,834,168,889 3,802,566,171
GDP growth (annual %) 3.66 5 5.32 (0.02) 7.03 7.03 0 3 9
Inflation, GDP deflator (annual %) 37.57 27 7.33 2.03 3.97 5.11 7 9 15
Agriculture, value added (% of GDP) 37.68 37 37.29 37.68 37.06 33.27 32 33 31
Industry, value added (% of GDP) 24.98 31 28.93 23.34 22.32 24.13 22 20 19
Services, etc., value added (% of GDP) 37.34 32 33.78 38.97 40.62 42.59 46 47 50
Exports of goods and services (% of GDP) 42.20 42 36.72 39.58 38.68 42.56 38 42 53
Imports of goods and services (% of GDP) 57.00 48 37.02 43.34 45.25 51.26 57 79 84
Revenue, excluding grants (% of GDP) 15.85 14 16.05 .. 16 21
Cash surplus/deficit (% of GDP) (2.99) -3 (0.76) .. -1 -2
Domestic credit provided by financial sector (%
of GDP) 14.79 12 10.01 11.61 11.61 8.38 9 12 14
Tax revenue (% of GDP) 12.21 12 12.44 .. 14 16
Military expenditure (% of GDP) 2.69 3 2.35 2.73 2.87 2.85 3 3 3
Merchandise trade (% of GDP) 84.38 77 61.83 66.78 67.68 75.05 72 100 108
Total debt service (% of exports of goods,
services and primary income) 21.19 30 31.15 20.48 21.89 17.87 15 8 9
Personal remittances, received (current US$) 18,477,300.64 8,844,515 11,113,728.52 36,716,598.51 78,157,081.60 188,672,546.40 313,250,258 473,071,916 704,004,668
Foreign direct investment, net inflows (BoP,
current US$) 44,412,800.00 -2,360,125 5,006,732.88 4,661,963.54 45,544,627.80 175,458,810.08 42,565,248 182,022,903 207,919,478
Net official development assistance and official
aid received (current US$) 283,130,000.00 214,710,000 187,940,000.00 185,610,000.00 200,100,000.00 261,370,000.00 267,880,000 310,550,000 274,450,000
Created from: World Development Indicators
Country : Kyrgyz Republic

CE
UeT
DC
olle
ctio
n
Table 10c: Kyrgyzstan economic indicators (World Bank)
79
2008 2009 2010 2011 2012 2013
Population, total 5,318,700 5,383,300 5,447,900 5,514,600 5,607,200 5,719,600
Population growth (annual %) 1 1 1 1 2 2
GDP (current US$) 5,139,957,785 4,690,062,255 4,794,357,795 6,197,766,119 6,605,139,933 7,226,303,261
GDP growth (annual %) 8 3 0 6 0 11
Inflation, GDP deflator (annual %) 22 4 10 22 9 2
Agriculture, value added (% of GDP) 27 21 19 19 19 18
Industry, value added (% of GDP) 24 27 29 31 26 27
Services, etc., value added (% of GDP) 49 52 51 51 55 56
Exports of goods and services (% of GDP) 54 55 52 55 44 47
Imports of goods and services (% of GDP) 93 79 82 82 95 96
Revenue, excluding grants (% of GDP) 20 19 19 21 23 ..
Cash surplus/deficit (% of GDP) 0 -1 -5 -5 -7 ..
Domestic credit provided by financial sector (%
of GDP) .. .. .. .. .. ..
Tax revenue (% of GDP) 17 15 15 16 18 ..
Military expenditure (% of GDP) 3 3 4 3 3 3
Merchandise trade (% of GDP) 115 100 104 101 110 109
Total debt service (% of exports of goods,
services and primary income) 12 11 23 13 12 12
Personal remittances, received (current US$) 1,223,272,673 981,964,002 1,266,195,469 1,708,694,028 2,031,374,213 2,277,998,114
Foreign direct investment, net inflows (BoP,
current US$) 376,992,152 189,377,400 437,586,100 693,528,000 292,663,900 757,642,400
Net official development assistance and official
aid received (current US$) 359,940,000 313,380,000 380,380,000 525,030,000 472,910,000 536,610,000
Created from: World Development Indicators
Country : Kyrgyz Republic

CE
UeT
DC
olle
ctio
n
80
Table 11: Crude oil historical prices
Year
Crude oil, Brendt, $/bbl,
nominal$
Crude oil, Dubai, $/bbl,
nominal$
Crude oil, WTI,
$/bbl, nominal$
1990 23.70 20.50 24.50
1991 20.10 16.60 21.50
1992 19.30 17.20 20.60
1993 17.00 14.90 18.60
1994 15.80 14.70 17.20
1995 17.10 16.10 18.40
1996 20.70 18.50 22.10
1997 19.10 18.10 20.30
1998 12.70 12.10 14.30
1999 17.80 17.20 19.20
2000 28.30 26.10 30.30
2001 24.40 22.70 25.90
2002 25.00 23.70 26.10
2003 28.90 26.70 31.10
2004 38.30 33.50 41.40
2005 54.40 49.30 56.40
2006 65.40 61.40 66.00
2007 72.70 68.40 72.30
2008 97.60 93.80 99.60
2009 61.90 61.80 61.70
2010 79.60 78.10 79.40
2011 110.90 106.00 95.10
2012 112.00 108.90 94.20
2013 108.90 105.40 97.90
2014 98.90 96.70 93.10
Created from: Global Economic Monitor (GEM) Commodities
Country : World
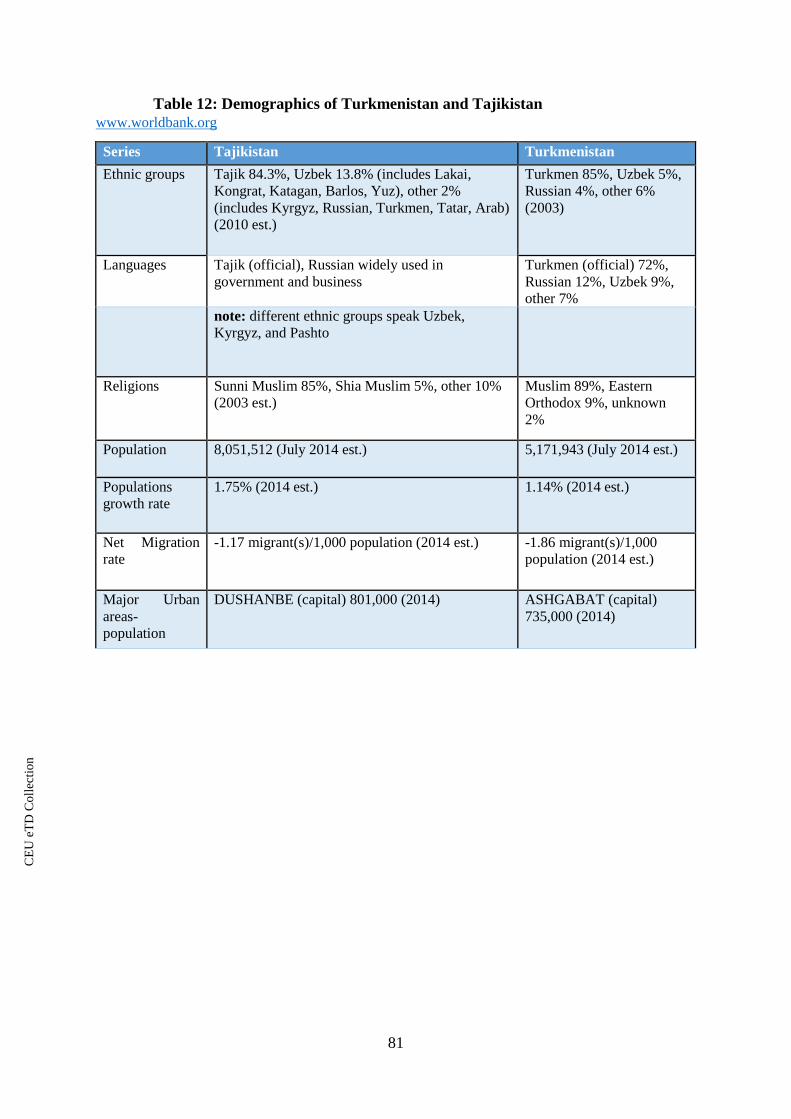
CE
UeT
DC
olle
ctio
n
81
Table 12: Demographics of Turkmenistan and Tajikistan
www.worldbank.org
Series Tajikistan Turkmenistan
Ethnic groups Tajik 84.3%, Uzbek 13.8% (includes Lakai,
Kongrat, Katagan, Barlos, Yuz), other 2%
(includes Kyrgyz, Russian, Turkmen, Tatar, Arab)
(2010 est.)
Turkmen 85%, Uzbek 5%,
Russian 4%, other 6%
(2003)
Languages Tajik (official), Russian widely used in
government and business
Turkmen (official) 72%,
Russian 12%, Uzbek 9%,
other 7%
note: different ethnic groups speak Uzbek,
Kyrgyz, and Pashto
Religions Sunni Muslim 85%, Shia Muslim 5%, other 10%
(2003 est.)
Muslim 89%, Eastern
Orthodox 9%, unknown
2%
Population 8,051,512 (July 2014 est.) 5,171,943 (July 2014 est.)
Populations
growth rate
1.75% (2014 est.) 1.14% (2014 est.)
Net Migration
rate
-1.17 migrant(s)/1,000 population (2014 est.) -1.86 migrant(s)/1,000
population (2014 est.)
Major Urban
areas-
population
DUSHANBE (capital) 801,000 (2014) ASHGABAT (capital)
735,000 (2014)
CE
UeT
DC
olle
ctio
n
82
References:
1. Аllina-Pisano, Jessica. "Social Contracts and Authoritarian Projects in Post-Soviet
Space: The Use of Administrative Resource." Communist and Post-Communist
Studies 43.4 (2010): 373-82. Print.
2. Abazov, R. “Policy of Economic Transition in Kyrgyzstan”, Central Asian Survey,
Vol 18, No2 (1999): 197-223
3. Acemoglu, D., Johnson, S. and Robinson, J. “Institutions as the fundamental cause of
long-run growth”, in Aghion, P. and Durlauf, S. N. (eds.) Handbook of Economic
Growth, Amsterdam: North-Holland / Elsevie, (2005). Web
4. Alexeev, Michael, and Robert Conrad. “The Natural Resource Curse and Economic
Transition.” Economic Systems 35.4 (2011): 445–461. Web.
5. Ayelazuno, Jasper. “Oil Wealth and the Well-Being of the Subaltern Classes in Sub-
Saharan Africa: A Critical Analysis of the Resource Curse in Ghana.” Resources
Policy 40 (2014): 66–73. Web.
6. Acemoglu, D., Robinson, J. Why Nations Fail. Great Britain: Profile Books LTD,
(2012)
7. Bakwena, Malebogo. “The Nature of Resource Endowment vs. the Potency of Good
Institutions as a Remedy for the Resource Curse.” Asian-African Journal of
Economics and Econometrics 13.2 (2013): 99–116. Web.
8. Bhattacharyya, Sambit, and Paul Collier. “Public Capital in Resource Rich
Economies: Is There a Curse?” Oxford Economic Papers 66.1 (2014): 1–24. Web.
9. Brown, Jason P. “Production of Natural Gas From Shale in Local Economies: A
Resource Blessing or Curse?” Economic Review (01612387) (2014): 5–33. Web.
10. Busse, Matthias, and Steffen Gröning. “The Resource Curse Revisited: Governance
and Natural Resources.” Public Choice 154.1/2 (2013): 1–20. Web.
11. Bаyulgen, Oksan. "Foreign Investment, Oil Curse, and Democratization: A
Comparison of Azerbaijan and Russia." Business and Politics 7.1 (2005): 1-37. Print.
12. Вirgerson, Susanne Michele. “The Central Asian Successor States.” After the
Breakup of a Multi-ethnic Empire: Russia, Successor States, and Eurasian Security.
Westport, CT: Praeger, (2002). Print.
13. Benjamin Smith, “Oil Wealth and Regime Survival in the Developing World, 1960–
1999,” American Journal of Political Science 48 (Mar. 2004): 232–246.
14. Beblawi, H. “The Rentier State in the Arab World,” in The Arab State, ed. G. Luciani.
London: Routledge. (1990): 85-98
15. Campbell, Gary A. “Resource Curse.” Salem Press Encyclopedia of Science (2013):
n. pag. Web.
16. Capoccia, G. and Ziblatt, D. “The Historical Turn in Democratization Studies: A New
Research Agenda for Europe and Beyond”, Comparative Political Studies, 43(8-9)
(2010): 931-968.
17. Catherine Norman, “Rule of Law and the Resource Curse: Abundance versus
Intensity,” Environmental and Resource Economics 43 (Aug. 2008): 183-207.
18. Caselli, Francesco. “Power struggles and the natural resource curse.” (2006): 1–22.
Web.
19. Caselli, Francesco, and Tom Cunningham. “Leader Behaviour and the Natural
Resource Curse.” Oxford Economic Papers 61.4 (2009): 628–650. Web.
20. Costa, Hirdan Katarina de Medeiros, and Edmilson Moutinho dos Santos.
“Institutional Analysis and the ‘Resource Curse’ in Developing Countries.” Energy
Policy 63 (2013): 788–795. Web.

CE
UeT
DC
olle
ctio
n
83
21. Crivelli, Ernesto, and Sanjeev Gupta. “Resource Blessing, Revenue Curse? Domestic
Revenue Effort in Resource-Rich Countries.” European Journal of Political Economy
35 (2014): 88–101. Web.
22. Curtis, Glenn E. Kazakstan, Kyrgyzstan, Tajikistan, Turkmenistan, and Uzbekistan :
Country Studies. 1st ed. Washington, D.C: Federal Research Division, Library of
Congress, 1997. Print.
23. Dаwisha, Karen, and Bruce Parrott. Conflict, Cleavage, and Change in Central Asia
and the Caucasus. Cambridge, U.K.: Cambridge UP, (1997). Print.
24. Dаwisha, Karen. The International Dimension of Post-Communist Transitions in
Russia and the New States of Eurasia. Armonk, NY: M.E. Sharpe, (1997). Print.
25. Dosmukhаmedov, E. K. “Foreign Direct Investment in Kazakhstan: Politico-legal
Aspects of Post-Communist Transition.” Houndmills, Basingstoke, Hampshire:
Palgrave in Association with St. Antony's College, Oxford, (2002). Print.
26. Dunning, Thad. Crude Democracy: Natural Resource Wealth and Political Regimes.
Cambridge: Cambridge UP, (2008). Print.
27. Durdiyev, M. and Kadyrov Sh., (1991), “The Turkmen of the World” (A Historical
and Demographic Survey) [In Russian], Ashgabat Kharp, 1991, p 18.
28. Djankov, S., Montalvo, J. and Reynal-Querol, M. “The Curse of Aid”, Journal of
Economic Growth. Vol. 13 (2009): 169-194
29. Elbadawi, Ibrahim Ahmed, and Raimundo Soto. “Resource Rents, Institutions, and
Violent Civil Conflicts.” Defence & Peace Economics 26.1 (2015): 89–113. Web.
30. Ellis Goldberg, Erik Wibbels and Eric Mvukiyehe, “Lessons from Strange Cases
Democracy, Development, and the Resource Curse in the US States,” Comparative
Political Studies 41 (Apr. 2008): 477-514.
31. Francesco Caselli and Tom Cunningham. “Leader Behaviour and the Natural
Resource Curse,” Oxford Economic Papers 61 (Jul. 2009): 628-650.
32. Gаlasinska, Аleksandra, and Dariusz Galasinski. The Post-communist Condition:
Public and Private Discourses of Transformation. Amsterdam: John Benjamins Pub.,
(2010). Print.
33. Gill, Grаeme J. “Civil society and the onset of negotiations” Democracy and Post-
communism: Political Change in the Post-communist World. London: Routledge,
2002. Print.
34. Gillespie, Kаte, and Clement M. Henry. Oil in the New World Order. Gainesville, FL:
University of Florida, (1995). Print.
35. Grzymała-Busse, Аnna Maria. “The Expansion of State Administration. Patronage or
Exploitation?” Rebuilding Leviathan: Party Competition and State Exploitation in
Post-communist Democracies. Cambridge: Cambridge UP, (2007). Print.
36. Grzymаla-Busse, A. "Beyond Clientelism: Incumbent State Capture and State
Formation." Comparative Political Studies 41.4-5 (2008): pp 638-73. Print.
37. Gylgason, T. “Natural resources, education, and economic development”, European
Economic Review. No. 45 (2001b): 847-859
38. Gylfason, T. “A Nordic Perspective on Natural Resource Abundance”, Resource
Abundance and Economic Development. Oxford University Press. (2001a): 296-311
39. Ishiyаma, John T., and Matthew Velten. "Presidential Power and Democratic
Development in Post-communist Politics1." Communist and Post-Communist Studies
31.3 (1998): pp 217-33. Print.
40. Jones, Luong Pauline. “Institutional Change and Political Continuity in Post-Soviet
Central Asia: Power, Perceptions, and Pacts.” Cambridge: Cambridge UP, 2002.
Print.

CE
UeT
DC
olle
ctio
n
84
41. Jones Luong, Pauline, and Erika Weinthal. Oil Is Not a Curse: Ownership Structure
and Institutions In Soviet Successor States. New York: Cambridge University Press,
2010. Print.
42. Kadyrov, Shohrat, (1990).”Demographic Development in the Central Asian Region
of the USSR”, Acta Universitatis Carolinae, Geographica, vol. XXV, no. 2, pp. 37-49
43. Kadyrov, Shokhrat (1993), (Some Questions on the Study of the Turkmen Family”,
Central Asian Survey, 1993, vol 12, no. 3, pp. 393-400
44. Kristopher Ramsay, “Revisiting the Resource Curse: Natural Disasters, the Price of
Oil, and Democracy,” International Organization 65 (Jul. 2011): 507-529.
45. Leonard Wantchekon, “Why Do Resource Dependent Countries Have Authoritarian
Governments?” Journal of African Finance and Economic Development 5 (2, 2002):
57–77. Print
46. Mahdavy, H. “The Pattern and Problems of Economic Development in Rentier State:
The Case of Iran”, in Studies in the Economic History of the Middle East, ed. M.A.
Cook. Oxford University Press. (1970): 428-467. Print
47. Merry, E. Wayne. "Governance in Central Asia: National in Form, Soviet in Content."
Cambridge Review of International Аffairs 17.2 (2004): pp 285-300. Print.
48. Møller, Jørgen. “An Actor-Centered Analysis of Post-Communist Political
Pathways.” Post-communist Regime Chаnge: A Comparative Study. London:
Routledge, (2009). Print.
49. Møller, Jørgen, and Svend-Erik Skaaning. "Post-communist Regime Types:
Hierarchies Across Attributes and Space." Communist and Post-Communist Studies
43.1 (2009): pp 51-71. Print.
50. Michael Ross, “Does Oil Hinder Democracy?” World politics 53 (Apr. 2001): 325-
361.
51. Michael Ross, “Oil and Democracy Revisited,” Unpublished paper, 2009.
52. Michael Ross, “Oil and Democracy Revisited,” Unpublished paper, 2009. Silje
Aslaksen, “Oil and Democracy: More than a Cross-country Correlation?” Journal of
Peace Research 47 (Jul. 2010): 421-431.
53. Mehlum, H., Moene, K., and Torvik, R. (2006). Institutions and the resource curse.
Economic Journal, 116(508), 1-20.
54. Oskarsson, Sven, and Eric Ottosen. "Does Oil Still Hinder Democracy?" Journal of
Development Studies 46.6 (2010): pp 1067-083. Print.
55. Obeng-Odoom, Franklin. “Resource Curse or Blessing in Africa’s Oil Cities?
Empirical Evidence from Sekondi-Takoradi, West Africa.” City, Culture and Society
4.4 (2013): 229–240. Web.
56. Ramsay, Kristopher W. "Revisiting the Resource Curse: Natural Disasters, the Price
of Oil, and Democracy." International Organization 65.3 (2011): pp 507-29. Print.
57. Romain Wacziarg, “The First Law of Petropolitics,” Economica 79 (Oct. 2012): 641-
657.
58. Robinson, Neil. "Economic and Political Hybridity: Patrimonial Capitalism in the
Post-Soviet Sphere." Journal of Eurasian Studies 4.2 (2013): pp 136-45. Print.
59. Ross, Michael Lewin. “Does Oil Hinder Democracy?” World Politics, 53, 3 (2001) pp
325-361. Print
60. Ross, Michael Lewin. “The Oil Curse: How Petroleum Wealth Shapes the
Development of Nations.” Princeton, NJ: Princeton UP, (2012). Print.
61. Rosser, Andrew. “The Political Economy of the Resource Curse: A Literature
Survey.” IDS Working Paper 268 (2006). Print.

CE
UeT
DC
olle
ctio
n
85
62. Sachs, J. D. and Warner, A. M. (1995). “Natural resource abundance and economic
growth”, NBER Working Paper No. 5398.
63. Sachs,J. D. and Warner, A. M. (2001). “The curse of natural resources” European
Economic Review, vol. 45, pp. 827-38.
64. Sarmidi, Tamat, Siong Hook Law, and Yaghoob Jafari. “Resource Curse: New
Evidence on the Role of Institutions.” International Economic Journal 28.1 (2014):
191–206. Web.
65. Shao, Shuai, and Lili Yang. “Natural Resource Dependence, Human Capital
Accumulation, and Economic Growth: A Combined Explanation for the Resource
Curse and the Resource Blessing.” Energy Policy 74 (2014): 632–642. Web.
66. Shaxson, Nicholas. “Oil, corruption and the resource curse.” International Affairs 83,
6 (2007) pp 1123-1140. Print
67. Smith, Benjamin. “Oil Wealth and Regime Survival in the Developing World, 1960-
1999” American Journal of Political Science, 48-2. (2004) pp 232-246. Print
68. Strakes, Jаson. "Tools of Political Management in the New Central Asian Republics
1." Journal of Muslim Minority Affairs 26.1 (2006): pp 87-99. Print.
69. Stephen van Evera, Guide to Methods for Students of Political Science (New York:
Cornell University Press, 1997), 58-63.
70. Stephen Haber and Victor Menaldo. “Do Natural Resources Fuel Authoritarianism? A
Reappraisal of the Resource Curse,” American Political Science Review 105 (Feb.
2011): 1-26.
71. Wacziarg, Romain. “The First Law of Petropolitics.” Economica 79.316 (2012): 641–
657. Web.
72. White, Stephen, Grаeme J. Gill, and Darrell Slider. “The Politics of Transition:
Shaping a Post-Soviet Future.” Cambridge [England: Cambridge UP, (1993). Print.
73. Thad Dunning, “Resource Dependence, Economic Performance, and Political
Stability,” Journal of Conflict Resolution 49 (Aug. 2005): 451-48

CE
UeT
DC
olle
ctio
n
86

CE
UeT
DC
olle
ctio
n
87