the cross-section of expected returns on penny stocks … · the cross-section of expected returns...
TRANSCRIPT
The Cross-section of Expected Returns on Penny Stocks
Are Low-hanging Fruits Not-so Sweet?
Ananjan Bhattacharyya∗ Abhijeet Chandra†
Abstract
In this paper, we study the determinants of expected returns on the listed penny stocks from two
perspectives. Traditionally financial economics literature has been devoted to study the macro and micro
determinants of expected returns on stocks ( Subrahmanyam, 2010). Very few research has been carried out
on penny stocks (Liu, Rhee, & Zhang, 2011; Nofsinger & Verma, 2014). Our study is an effort to contribute
more empirical evidence on penny stocks in the emerging market context. We see the return dynamics of
penny stocks from corporate governance perspective. Issues such as shareholding patters are considered to
be of much significance when it comes to understand the price movements. Using cross-sectional data on 167
penny stocks listed in the National Stock Exchange of India, we show that (i) Returns of portfolio of lower
market-cap penny stocks are significantly different(higher) than that of higher market-cap penny stocks. (ii)
Returns of portfolio lower P/E stocks are significantly different (higher) than that of higher P/E stocks.
Similarly, returns of portfolio of lower P/B stocks are significantly different (higher) than that of higher
P/B stocks, and returns of portfolio of lower priced penny stocks are significantly different(higher) than that
of higher priced penny stocks. (iii) Trading volume differences due to alphabetism are insignificant. (iv)
Differences in returns of portfolios based on beta and shareholding patterns are insignificant.
JEL Codes: G11, G14, G18
Keywords: Penny stocks, Asset pricing, Emerging markets, Behavioral biases, Alphabetism.
∗Undergraduate Student, Indian Institute of Technology Kharagpur. Email: [email protected].†Vinod Gupta School of Management, Indian Institute of Technology Kharagpur. Email: [email protected]
1
arX
iv:1
610.
0133
8v1
[q-
fin.
PR]
5 O
ct 2
016

1 Introduction
The literature on financial economics in general and asset pricing in particular has traditionally focused on
explaining the prices of financial assets in the context of large-cap, liquid assets which can be traded easily.
Originally the single-factor model of asset pricing such as Capital Asset Pricing Model (CAPM) assumes that
stocks (or, assets) are easily traded and there is very little price impact against trading. However, over the
years multi-factor asset pricing models, such as three-factor and four-factor models, have considered several
anomalies such as book-to-market, momentum, market capitalization, liquidity, and size being important ones
(see, for example, Banz, 1981; Stattman, 1980; Rosenberg et al., 1985; Fama and French, 1992, 1993, 1995, 1996,
1998, 2000; Jegadeesh and Titman, 1993; Carhart, 1997; Rouwenhorst, 1999). These models have empirically
taken into account the risk premium attributed to several factors. The price fluctuations attributed to such risk
factors result in the return differentials when compared to stocks of different sizes. The traditional asset pricing
theory suggests that there should be a risk premium for every risk factor and there exists a positive relationship
between risk and expected returns. It essentially implies that the higher the risk associated, the higher should
be the expected returns on that asset. However, sometimes it is observed that many asset managers generate
a negative relationship between risk and return because they raise the volatility of overvalued assets. Socially
optimal contracts provide steeper performance incentives and cause larger pricing distortions than privately
optimal contracts (Buffa et al., 2014). For the large-cap and mid-cap stocks that are highly liquid in terms of
tradability with little price impact, this positive risk-relationship holds true across markets, but it might not
remain valid when it comes to stocks that are not so liquid and sought-after by the investors. The stocks which
are cheap and less liquid may essentially show an entirely different behavior. With this background, it becomes
imperative to understand if this positive risk-return relationship prevails in case of stocks which are cheap, also
known as penny stocks.
Usually cheap products and services tempt consumers across markets. In the context of investment and
financial decision-making, it is always recommended to buy low and sell high. When investors find an opportunity
to invest in cheap stocks, they tend to ignore the risk factors associated with the opportunity. Although
buying cheap could be expensive (Briest & Krysta, 2007), investors and traders fail to note or choose to ignore
fundamentals when investing in cheap stocks. Very cheap stocks, also known as penny stocks, are deemed to
2
be illiquid and prone to more risk compared to mid-cap or even small-cap stocks. The pricing of such assets
become more complicated in an emerging market such as India, where there might exist information asymmetry
and other corporate governance-related issues. Ironically, in the movie ”The Wolf of Wall Street”, the key
protagonist Jordan Belfort, played by Leonardo DeCaprio is shown to have made huge sums of money out of
anomalous and fraudulent pricing of penny stocks. While in practice, it’s rarely achieved feat for retail investors.
In this paper, we attempt to understand if penny stocks are worth investments. Since they are cheap stocks,
they’re often ignored or discounted off easily. We try to find out if microstructral factors such as trading volume
or liquidity, risk characteristics, and market capitalization, and governance-related factors such as company’s life
(cycle), industry category, shareholding patterns, and so on, influence their expected returns? There have been
some instances wherein their prices were easily manipulated by the brokers/traders, and/or the retail investors
committed mistakes while trying to understand their risk-return dynamics. We provide empirical evidence in
the context of the penny stocks listed in the Indian stock market.
Specifically we study the determinants of expected returns on the listed penny stocks from two perspectives.
First, we show the relationship of microstructural factors with expected returns on the penny stocks. Substantial
literature in financial economics have been devoted to study the macro and micro determinants of expected
returns on stocks (see, for example, Subrahmanyam, 2010, for a comprehensive review of literature on the
issue). Very few research has been carried out on penny stocks (Liu, Rhee, & Zhang, 2011; Nofsinger & Verma,
2014). Our study is an effort to contribute more empirical evidence on penny stocks in the emerging market
context. Secondly, we see the return dynamics of penny stocks from corporate governance perspective. Issues
such as shareholding patters are considered to be of much significance when it comes to understand the price
movements. This study provides evidence in this context as well.
Using cross-sectional data on 167 penny stocks listed in the National Stock Exchange of India, we em-
ploy econometric methodologies to explain the relationship of expected returns on penny stocks with other
related variables. We show that (i) Returns of portfolio of lower market-cap penny stocks are significantly
different(higher) than that of higher market-cap penny stocks. (ii) Returns of portfolio lower P/E stocks are
significantly different(higher) than that of higher P/E stocks. Similarly, returns of portfolio of lower P/B stocks
are significantly different (higher) than that of higher P/B stocks, and returns of portfolio of lower priced
3

penny stocks are significantly different (higher) than that of higher priced penny stocks. (iii) Trading volume
differences due to alphabetism are insignificant. (iv) Differences in returns of portfolios based on beta and share-
holding patterns are insignificant. A series of t-tests is employed to check the statistical relationship between
two portfolios (top 50 percentile and bottom 50 percentile) after sorting with respect to the different factors.
Remaining of the paper is organized as following. Section 2 presents a detailed and comprehensive review of
literature relevant to the issues at hand. Precisely we are reviewing recent research carried out in the areas of
financial economics, behavioral finance and economics, and asset pricing. In Section 3, detailed description of
data variables, measures, and methodological tools used in this study is provided. The basic properties of the
data set is also discussed briefly. It also discusses the methods and metrics used for analyzing the data set, along
with the research objectives and functional hypotheses. Section 4 provides empirical results and estimations.
It also gives discussions and inferences drawn from the analysis. Finally, in Section 5, we present concluding
remarks and implications of the study.
2 Literature Review
Typically, in asset pricing literature, researchers tend to ignore the small, low-value stocks for examining and
explaining the dynamics of risk-return. This may be one of the ways to tackle the scarcity of data related to
such stocks. This problem arises mainly because, globally, penny stocks generally trade on the over-the-counter
markets, such as the OTC Bulletin Board or the Pink Sheets. However, they may also trade on stock exchanges.
In the United States, a significant number of penny stocks are traded on the electronic securities exchanges,
their price movements and trading activities have important impacts on the whole market. In India, such penny
stocks being traded on the stock exchange is very limited. The problem related to data on penny stocks in India
becomes even more severe, hence there is hardly any research on Indian penny stocks.
Penny stocks typically suffers with several fundamental and market microstructure-related issues. One of
the most significant characteristics of penny stocks is high illiquidity. As mentioned by Liu et al. (2011),
usually penny stocks have fewer shareholders; they may not trade as frequently as large cap stocks, and their
trading volumes are often very low. This lack of liquidity can cause high price volatility with a sudden change
in demand or supply of stocks. The lack of liquidity can also make it difficult to sell a stock and liquidate the
4

investment returns, especially when there are no buyers that day. Considering the liquidity problem of penny
stocks, the Securities & Exchange Commission (SEC) warns that, ”Penny stocks may trade infrequently, which
means that it may be difficult to sell penny stock shares once you own them. Because it may be difficult to
find quotations for certain penny stocks, they may be impossible to accurately price. Investors in penny stocks
should be prepared for the possibility that they may lose their whole investment.”
Another important attribute of penny stocks is that they carry huge potential for profits for those investors
who are high risk-seekers as these stocks carry high risk mainly because of information asymmetry, low liquidity,
and uncertainity related to the fundamentals of such companies. The asymmetric information leads to under-
valuation of penny stocks. This essentially enables aggressive investors to find the right kind of penny stocks
and presents huge profit potential. While the penny stocks are highly risky and carry high potential for returns,
they are cheaply available hence can be invested in easily by even small retail investors who might not have deep
pockets. It is, therefore, penny stocks seem a tempting investment choice for small retail investors. However,
due to high risk attribute, if wrongly traded, penny stocks might prove detrimental for small retail investors.
Limitations relating to the availability of data on penny stocks have resulted in very few empirical research
on such stocks. To quote Nofsinger and Verma (2014), the literature investigating penny stocks or describing
the general trading activity of investors who invest in them is sparse. Bollen and Christie (2009) study the
market-microstructure of Pink sheet stocks (subset of OTC stocks) and find that market participants have
endogenously selected price-dependent tick sizes for different stocks. Hanke and Hauser (2008) study the effects
of stock spam e-mails on prices of OTC securities (Pink Sheets and OTC Bulletin Board stocks) and find that
positive news contained in stock spam e-mails had no lasting positive effect on stock prices. Harris et al. (2008)
find that firms that are delisted from NASDAQ and are relegated to the OTC Bulletin Board and Pink Sheets
experience a large decline in liquidity, which is also associated with a significant decline in wealth. Bradley
et al. (2006) study penny stock IPOs and find that they have higher initial returns than ordinary IPOs, but
significantly worse long-run under-performance. Due to a lack of data, their study did not include IPOs that
initially started trading on the OTCBB, Pink Sheets, or the gray market. They do include offerings that initially
started trading on the Nasdaq Small Cap Market with an offer price of less than or equal to $5. Beatty and
Kadiyala (2003) find that the Penny Stock Reform Act of 1990 (PSRA) had the cosmetic effect of reducing the
5

number of IPOs priced below $5, but had no substantive impact on issuer quality.
Penny stocks are attractive investment avenues for small retail investors and most of them are aware that
such investments might be wiped out due to huge risk associated with the penny stocks. There exists information
idiosyncraticity leading to the likelihood of some investors making abnormal profits while many others losing
out their investments. Kumar (2009) finds that the individual investors demand for lottery type stocks (stocks
with high idiosyncratic variance, high idiosyncratic skewness, and low prices) increases when economic times
are poor and these demand shifts influence the returns of lottery type stocks. Also, Kumar (2009) documents
that socio-economic characteristics, like being younger and less affluent, are common for lottery buyers and
investors seeking lottery type stocks.
Several studies have been carried out with the data obtained from the over-the-counter markets. Across the
globe, majority of trading in penny stocks happens in the OTC market. For example, Shefrin and Statman (2000)
show that behavioral portfolio investors do not mean-variance optimize their entire portfolios. Instead they
form separate portfolio layers or mental accounts, each associated with unique goals or aspirations. Behavioral
portfolio theory is consistent with an investor holding safer assets for downside protection, while also preferring
risky assets to achieve certain wealth aspirations or to satisfy an innate sensation seeking desire. Dorn and
Sengmeuller (2009) carried out a detailed survey of German retail investors in order to find out how much they
enjoyed investing and gambling. Those who enjoyed them more traded twice as much as those who stated that
they did not gamble. Grinblatt and Keloharju (2009) study people in Finland. Their unique data set allow them
to merge stock brokerage data with other databases. For example, they know how many speeding tickets their
investors have received and have access to psychology tests given during mandatory military service, for males.
People who are sensation seeking in one area, like playing poker, tend to also be sensation seeking in other
areas. Thus, they can compare the investors activities of those people that are prone to sensation seeking (a
higher number of speeding tickets) with those who are not. After controlling for other investors characteristics,
they find that sensation seekers trade more than other investors. They seem to derive some entertainment from
trading. It may be that trading in OTC stocks is simply more fun because of their volatility. Unlike the typical
lottery buyers/gamblers, sensation seekers trade OTC stocks primarily for thrill and are not driven as much
by economic incentives. Most stocks traded on OTC markets simplylack good public information compared to
6

stocks listed on major stock exchanges. Another possible, though unlikely, explanation for trading OTC stocks
is that individuals possess some private or superior information about them.
Because of the unavailability of data pertaining to the trading of penny stocks in the OTC market, we
restrict our focus on those penny stocks being traded in the stock exchange. Effectively, we study the risk-return
dynamics of penny stocks traded on the National Stock Exchange (NSE) of India. Although the NSE advises its
small and retail investors against getting influenced into buying into fundamentally unsound companies (penny
stocks1) based on sudden spurts in trading volumes or prices or favourable articles/stories in the media, it has
been seeing growing interest of traders in penny stocks (NSE’s Investors’ Guide to the Capital Market, 2010).
Another issue that we are studying in this study is what we call as the prevalence of alphabetism in stock
market. Itzkowitz, Itzkowitz, and Rothbort, (RFS, 2015) show that because stock information is most frequently
presented in alphabetical order, stocks with names appearing early in the alphabet (early alphabet stocks) will
be traded more frequently than stocks with names that begin with letters that appear later in the alphabet (later
alphabet stocks). In psychology literature, it is shown that that individuals are quasi-rational economic agents
trying to satisfy their economic goals in their best possible ways, with some oblivious mistakes that they are most
likely to be unaware of. An investor, when faced with a large number of options, often choose the first acceptable
option, rather than the best possible option (Simon, 1957). Given the vast quantity of information available
and the widespread convention of listing stocks in alphabetical order, it is quite likely that investors are more
tempted to buy and sell stocks with early alphabet names. Consistent with this view, Itzkowitz et al. (2015)
find that early alphabet stocks are traded more frequently than later alphabet stocks and that alphabeticity
also affects firm value. They also document how these effects have changed over time. In this context, we try
to examine if such phenomena exists in the small universe of penny stocks listed in the Indian stock exchange.
Since the stocks available at dirt cheap prices are very few, we conjecture that investors should not fail to
see a complete list of stocks before they undertake trading decisions. Even the casual investor searching an
investment website is presented with the possibility of examining thousands of stocks. For each stock, there is
1Penny stocks are those stocks that trade at a very low price, have very low market capitalization, are mostly illiquid, and are
usually listed on a smaller exchange. Penny stocks in the Indian stock market can have prices below Rs 10. These stocks are very
speculative in nature and are considered highly risky because of lack of liquidity, smaller number of shareholders, large bid-ask
spreads and limited disclosure of information. (The Economic Times)
7

substantial information to consider such as the stocks price, 52-week high and low price, dividend, year-to-date
return, and volatility. Ideally, when making an investment, one should investigate all of the information about
each possible opportunity before deciding. However, due to limits inherent in humans cognitive capacity, and
given the vast quantity of options, full information search and use rarely occurs (Simon, 1957; Bettman, Luce,
and Payne, 1998). Consequently there should exist any possibility of one stock (from early alphabet stock list)
giving better returns than other stocks in the sample (for example, later alphabet stocks).
Through this research study, we attempt to examine several issues associated with the risk-return relationship
in the context of penny stocks in the Indian stock market. Following are the major research questions that this
paper is trying to answer:
1. Does the effect of risk factors on expected returns vary across penny stocks with different characteristics?
We are interested in examining if penny stocks with higher risk attribute, such as high beta, exhibit
return potential different from that of those penny stocks with lower risk attributes? If this holds true,
it essentially explains the basic quantitative rule of risk-return relationship. And if vice versa is true, the
risk-return relationship in the context of penny stocks requires further investigation.
2. If we see the examine the above problem from a risk-adjusted return perspective, can the results be any
different? Since risk-adjusted returns shall have less variation across risk factors, the observations should
ideally change. Mainly we are considering firm size, price-equity (P/E) ratio, price-to-book value (P/B)
ratio, shareholding pattern, beta, and liquidity as risk factors attributed to variation in returns. We are
considering both raw and risk-adjusted returns in our case.
3. To test the evidence the effect of alphabetism as one of the risk factors, we examine whether penny
stocks with names starting with upper percentile of alphabets, such as A, B, C, ... and so on, exhibit
different trading pattern in terms of trading volume compared to the stocks with names starting with
lower percentile of alphabets, such as N, O, P, ... and so on?
Although literature on financial economics and asset pricing have documented the role of several risk factors
as well as behavioral factors in determining the return, very few studies focus on this issue in the context of the
penny stocks. Moreover, this issue is rarely investigated in the Indian stock market. We believe that our article
8

is one of the first attempts to look at how these factors interplay. Furthermore, the results are distinct in that
they show how even for a small sample of listed penny stocks these traditional as well as unique risk factors are
important, implying the behavioral tendency of such stocks.
3 Measures and Methods
3.1 Data
The data come from a cross-section of penny stocks listed in the National Stock Exchange of India. Our sample
consists of a set of 167 listed penny stocks that are traded on the NSE electronic platform. These companies
were selected to represent the penny stock universe as their share prices, as on 31st July 2015, were below | 10,
which is the widely accepted cut-off price for classifying penny stocks in the Indian Stock Market. These stocks
are then studied for a period of one year from August 2015 to July 2016.
The data variables for the study consist of annualized average returns (defined as aari = 250ΣNd=1ri,d),
annualized average volatility (defined as aavi = 250ΣNd=1r2i,d), market capitalization, P/E Ratio, P/B Ratio,
beta, liquidity and promoters’ shareholding (defined as the percentage of shares held by promoters). The 365
day averages are computed over the period of one year from August 2015 to August 2016 and all the other data
for the purpose are taken for July 2015. The cut-off yield on 364 Day Treasury Bills issued by the RBI has been
used as the risk-free rate and the Sharpe Ratio, defined as 365 day average return - risk-free rate365 day average volatility is used to represent
the Risk Adjusted Returns.
The data have been collected mainly from the CMIE-PROWESS database of the Center for Monitoring
Indian Economy (CMIE) and the reports of the RBI available at the RBI Database on Indian Economy (RBI-
DBIE).
3.2 Methodology
We first begin with testing for the effect of different microstructural and corporate governance related factors
on the penny stock returns.
For our study, we consider one factor at a time. First, the stocks are ranked on the basis of the factor
9
and then they are grouped them into two portfolios - top 50 percentile and the bottom 50 percentile. We
then run the statistical t-test on the annualized average returns (aari) and the annualized average risk-adjusted
returns (365 Day Average Sharpe) for these two portfolios to find out whether there is any significant difference
between the returns of the portfolios formed. If a statistical significance is seen, then we conclude that the
micro-structural factor considered has an effect in influencing the returns of these penny stocks. Further, we
determine the nature of the influence, direct or inverse, by noting which portfolio gives the higher returns.
It is important to note here that we take the data for the factors on July 2015 while the returns and volatility
data are taken for the period of August 2015 to July 2016. By doing so, we inherently are considering the annual
average returns generated from following a buy and hold strategy where portfolios are formed in the month of
July 2015 and held for one year.
Given the background of the research problems, we derive the research hypotheses and test with the data
obtained as above. The baseline hypothesis is as following:
H0 : rax − rbx = 0 (1)
where, rax is the mean (risk-adjusted) returns of the stocks belonging to the top 50 percentile after sorting in
descending order w.r.t factor x, rbx is the mean (risk-adjusted) returns of the stocks belonging to the bottom
50 percentile after sorting in descending order w.r.t factor x, and x includes risk factors such as firm size, P/E
ratio, P/B ratio, price, shareholding pattern, beta, liquidity, and dummy for the alphabet with which the firm’s
name begins.
The statistical significance level (alpha) is taken to be 0.05 and all the hypotheses are tested with two-tailed
t-test carried out assuming unequal variances.
The functional alternate hypotheses (H1) are stated as follows:
(i) The impact of firm size on average observed returns for top half of the sample firms are different than
that of bottom half of the sample firms.
H1,1 : rtop 50,firm size − rbottom 50,firm size 6= 0 (2a)
(ii) The impact of firm’s P/E ratio on average observed returns for top half of the sample firms are different
10

than that of bottom half of the sample firms.
H1,2 : rtop 50,P/E ratio − rbottom 50,P/E ratio 6= 0 (2b)
(iii) The impact of firm’s P/B ratio on average observed returns for top half of the sample firms are different
than that of bottom half of the sample firms.
H1,3 : rtop 50,P/B ratio − rbottom 50,P/B ratio 6= 0 (2c)
(iv) The impact of average promoters’ shareholding on average observed returns for top half of the sample
firms are different than that of bottom half of the sample firms.
H1,4 : rtop 50,shareholding − rbottom 50,shareholding 6= 0 (2d)
(v) The impact of average beta on average observed returns for top half of the sample firms are different than
that of bottom half of the sample firms.
H1,5 : rtop 50,β − rbottom 50,β 6= 0 (2e)
(vi) The impact of average liquidity on average observed returns for top half of the sample firms are different
than that of bottom half of the sample firms.
H1,6 : rtop 50,liq − rbottom 50,liq 6= 0 (2f)
The hypotheses have been tested with both observed returns and risk-adjusted returns. The risk-adjusted
returns here imply the returns adjusted with the Sharpe ratio.
The above-mentioned hypotheses intend to test:
H0 : µrax = µrbx (3a)
versus
H1 : µrax6= µrbx (3b)
Our analysis uses the cross-sectional data observations, xi,j for stock i and variable j, are independently and
identically distributed random variables with normal distribution properties such that N(µj , σ2).
11

4 Results and Discussions
The traditional asset pricing framework as suggested by Sharpe (1964), Lintner (1965), and Black (1972) shows
that the average returns and risk associated with any asset have strong relationship. The argument of the
returns being a linear function of the associated risk have become as good as a power law. The relationship
between large fluctuations in prices, trading volume and number of trades has also been established empirically
(Gabrix et al., 2003). However, it has been observed that a typical risk-return relationship does not hold when
it comes to penny stocks. This behavior may be attributed to several factors including information asymmetry,
ownership structure, illiquidity, market microstructure issues, and so on. We basically examine whether stocks
within a group of penny stocks exhibit particular characteristics. Some of the basic research issues that we are
exploring are as following. Are the average returns on penny stocks with higher market capitalization (within
the group) different from that on penny stocks with lower market cap? Do stocks with higher P/E ratio or
P/B ratio show different average return generation capabilities compared to the stocks with lower P/E or P/B
ratio? Does shareholding pattern make any difference in terms of return generation by a penny stock? Do those
penny stocks with higher liquidity give any different returns than the penny stocks with less liquidity? These
issues are investigated in the context of penny stocks listed in the Indian stock market.
We begin with presenting the descriptive statistics and statistical properties of our sample data. In Table 1,
we show the calculated values of mean (along with standard error), standard deviation, maximum and minimum
values, skewness and kurtosis, and the number of observations for each of the sample variables. The average
return on our sample stock is about 6.27 percentage with a standard deviation of 0.27. As indicated by the
range (maximum and minimum values) and skewness the data series is negatively skewed. Similarly, we report
the central tendency and spread properties of our data variables, namely, firm size (as measured by market
capitalization as on the date), P/E ratio, P/B ratio, shareholding pattern, beta, and liquidity. These values are
obtained from the raw data collected from the sources as mentioned in the previous section.
Table 2 shows the Pearson’s correlations between pairs of sample variables. We can see that no variable is
highly and significantly correlated with any other variable, hence there is no issue of multicollinearity. Firm
size, P/E ratio, and P/B ratio are negatively correlated with the average return and the correlation coefficients
are statistically significant. However, beta is positively correlated with average return at a 5 percent significance
12
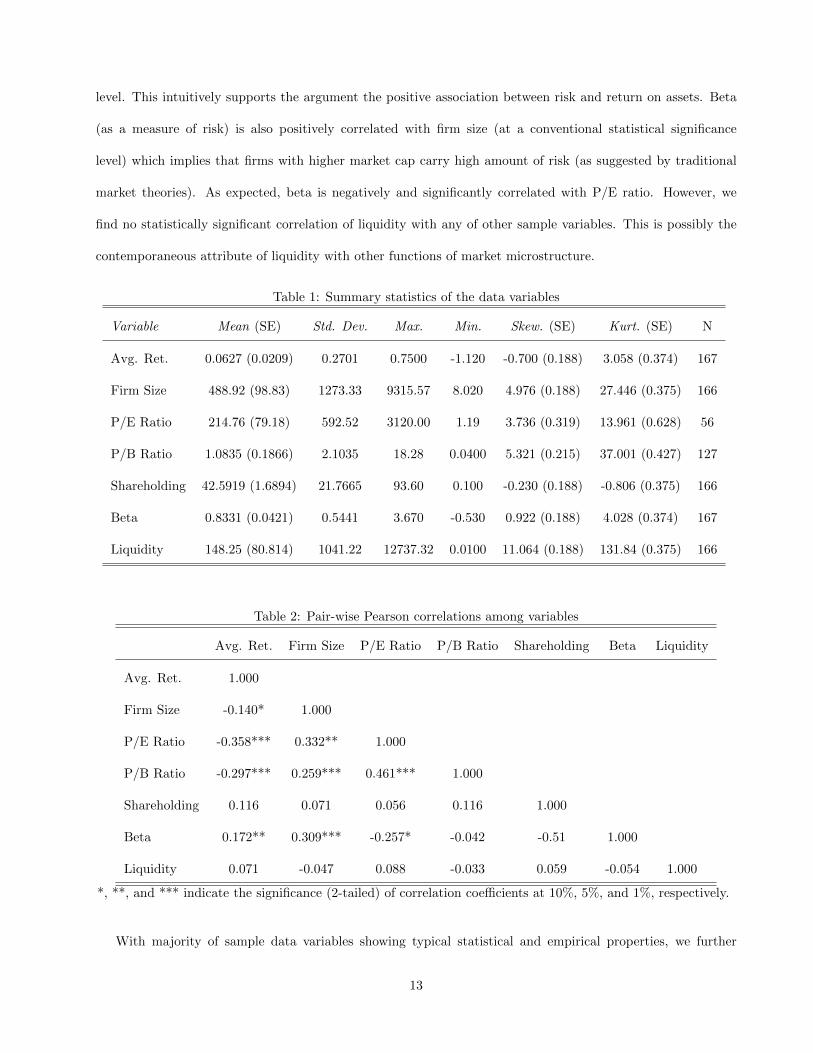
level. This intuitively supports the argument the positive association between risk and return on assets. Beta
(as a measure of risk) is also positively correlated with firm size (at a conventional statistical significance
level) which implies that firms with higher market cap carry high amount of risk (as suggested by traditional
market theories). As expected, beta is negatively and significantly correlated with P/E ratio. However, we
find no statistically significant correlation of liquidity with any of other sample variables. This is possibly the
contemporaneous attribute of liquidity with other functions of market microstructure.
Table 1: Summary statistics of the data variables
Variable Mean (SE) Std. Dev. Max. Min. Skew. (SE) Kurt. (SE) N
Avg. Ret. 0.0627 (0.0209) 0.2701 0.7500 -1.120 -0.700 (0.188) 3.058 (0.374) 167
Firm Size 488.92 (98.83) 1273.33 9315.57 8.020 4.976 (0.188) 27.446 (0.375) 166
P/E Ratio 214.76 (79.18) 592.52 3120.00 1.19 3.736 (0.319) 13.961 (0.628) 56
P/B Ratio 1.0835 (0.1866) 2.1035 18.28 0.0400 5.321 (0.215) 37.001 (0.427) 127
Shareholding 42.5919 (1.6894) 21.7665 93.60 0.100 -0.230 (0.188) -0.806 (0.375) 166
Beta 0.8331 (0.0421) 0.5441 3.670 -0.530 0.922 (0.188) 4.028 (0.374) 167
Liquidity 148.25 (80.814) 1041.22 12737.32 0.0100 11.064 (0.188) 131.84 (0.375) 166
Table 2: Pair-wise Pearson correlations among variables
Avg. Ret. Firm Size P/E Ratio P/B Ratio Shareholding Beta Liquidity
Avg. Ret. 1.000
Firm Size -0.140* 1.000
P/E Ratio -0.358*** 0.332** 1.000
P/B Ratio -0.297*** 0.259*** 0.461*** 1.000
Shareholding 0.116 0.071 0.056 0.116 1.000
Beta 0.172** 0.309*** -0.257* -0.042 -0.51 1.000
Liquidity 0.071 -0.047 0.088 -0.033 0.059 -0.054 1.000
*, **, and *** indicate the significance (2-tailed) of correlation coefficients at 10%, 5%, and 1%, respectively.
With majority of sample data variables showing typical statistical and empirical properties, we further
13
investigate whether our hypotheses as laid out before can be tested with the given data set. Since the number
of observations for our data variables are not same, we proceed with two-tailed t-test of the differences in means
of data, to check whether two groups of data obtained from same sample/population and grouped on the basis
of certain parameter(s) exhibit similar characteristic(s).
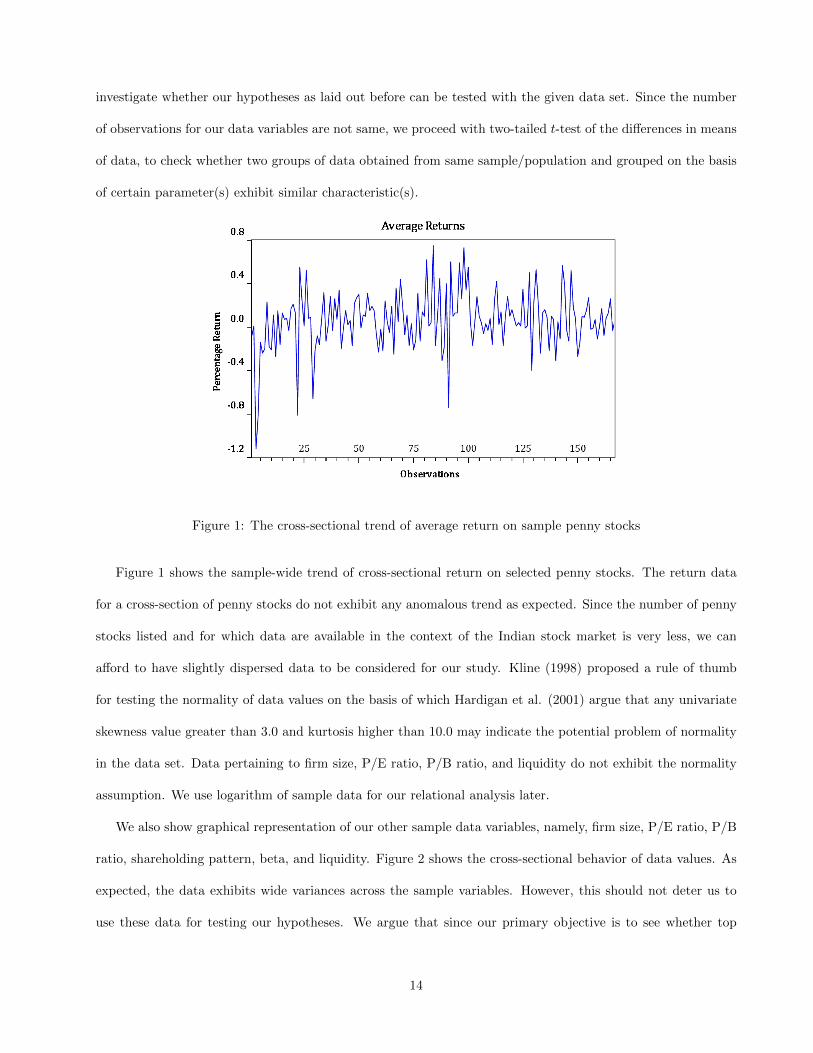
Figure 1: The cross-sectional trend of average return on sample penny stocks
Figure 1 shows the sample-wide trend of cross-sectional return on selected penny stocks. The return data
for a cross-section of penny stocks do not exhibit any anomalous trend as expected. Since the number of penny
stocks listed and for which data are available in the context of the Indian stock market is very less, we can
afford to have slightly dispersed data to be considered for our study. Kline (1998) proposed a rule of thumb
for testing the normality of data values on the basis of which Hardigan et al. (2001) argue that any univariate
skewness value greater than 3.0 and kurtosis higher than 10.0 may indicate the potential problem of normality
in the data set. Data pertaining to firm size, P/E ratio, P/B ratio, and liquidity do not exhibit the normality
assumption. We use logarithm of sample data for our relational analysis later.
We also show graphical representation of our other sample data variables, namely, firm size, P/E ratio, P/B
ratio, shareholding pattern, beta, and liquidity. Figure 2 shows the cross-sectional behavior of data values. As
expected, the data exhibits wide variances across the sample variables. However, this should not deter us to
use these data for testing our hypotheses. We argue that since our primary objective is to see whether top
14
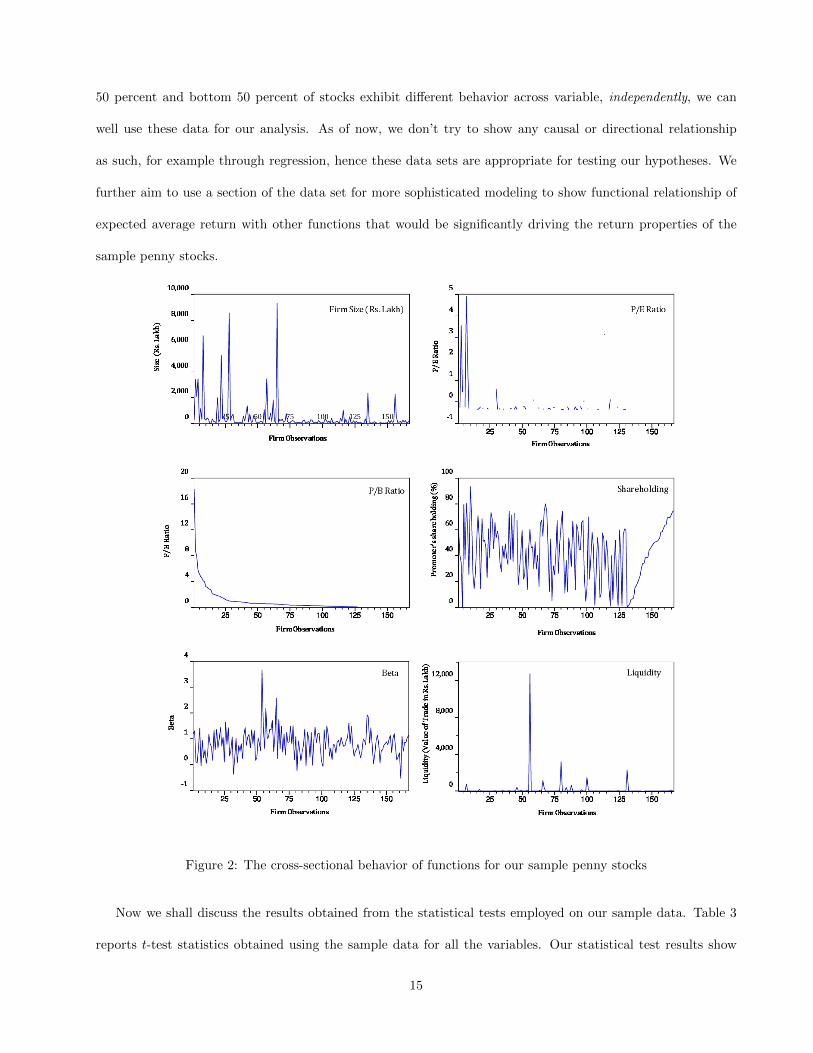
50 percent and bottom 50 percent of stocks exhibit different behavior across variable, independently, we can
well use these data for our analysis. As of now, we don’t try to show any causal or directional relationship
as such, for example through regression, hence these data sets are appropriate for testing our hypotheses. We
further aim to use a section of the data set for more sophisticated modeling to show functional relationship of
expected average return with other functions that would be significantly driving the return properties of the
sample penny stocks.
Figure 2: The cross-sectional behavior of functions for our sample penny stocks
Now we shall discuss the results obtained from the statistical tests employed on our sample data. Table 3
reports t-test statistics obtained using the sample data for all the variables. Our statistical test results show
15
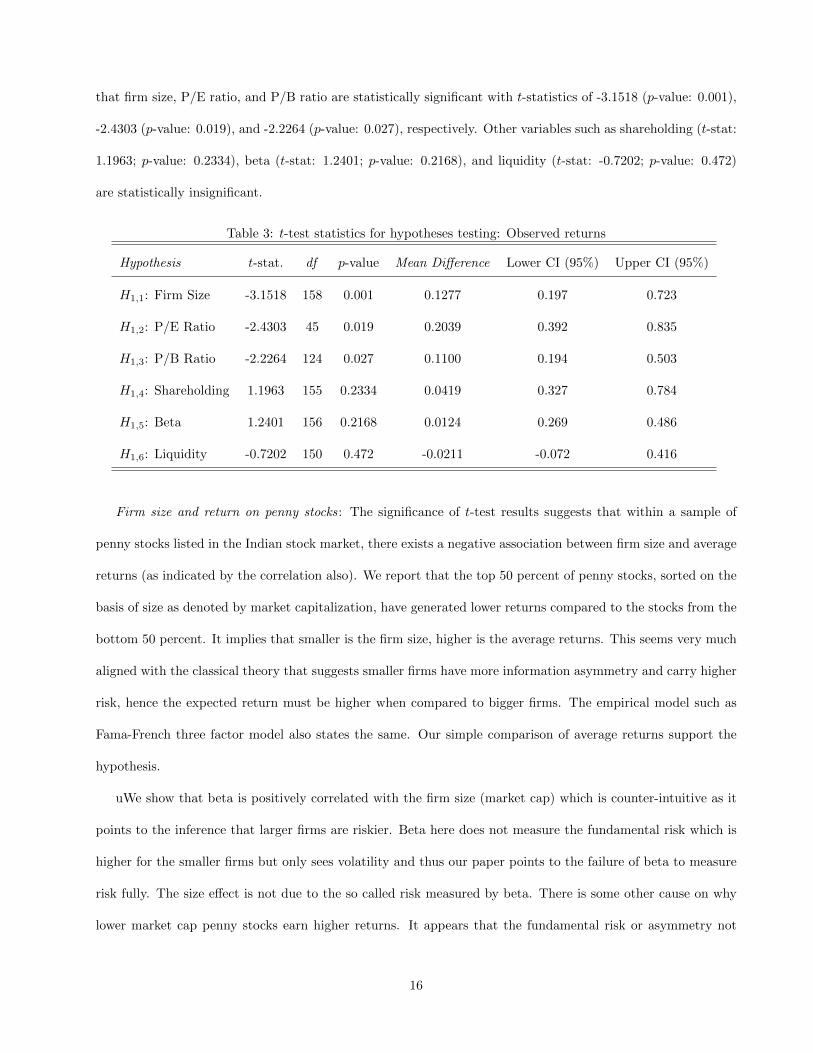
that firm size, P/E ratio, and P/B ratio are statistically significant with t-statistics of -3.1518 (p-value: 0.001),
-2.4303 (p-value: 0.019), and -2.2264 (p-value: 0.027), respectively. Other variables such as shareholding (t-stat:
1.1963; p-value: 0.2334), beta (t-stat: 1.2401; p-value: 0.2168), and liquidity (t-stat: -0.7202; p-value: 0.472)
are statistically insignificant.
Table 3: t-test statistics for hypotheses testing: Observed returns
Hypothesis t-stat. df p-value Mean Difference Lower CI (95%) Upper CI (95%)
H1,1: Firm Size -3.1518 158 0.001 0.1277 0.197 0.723
H1,2: P/E Ratio -2.4303 45 0.019 0.2039 0.392 0.835
H1,3: P/B Ratio -2.2264 124 0.027 0.1100 0.194 0.503
H1,4: Shareholding 1.1963 155 0.2334 0.0419 0.327 0.784
H1,5: Beta 1.2401 156 0.2168 0.0124 0.269 0.486
H1,6: Liquidity -0.7202 150 0.472 -0.0211 -0.072 0.416
Firm size and return on penny stocks: The significance of t-test results suggests that within a sample of
penny stocks listed in the Indian stock market, there exists a negative association between firm size and average
returns (as indicated by the correlation also). We report that the top 50 percent of penny stocks, sorted on the
basis of size as denoted by market capitalization, have generated lower returns compared to the stocks from the
bottom 50 percent. It implies that smaller is the firm size, higher is the average returns. This seems very much
aligned with the classical theory that suggests smaller firms have more information asymmetry and carry higher
risk, hence the expected return must be higher when compared to bigger firms. The empirical model such as
Fama-French three factor model also states the same. Our simple comparison of average returns support the
hypothesis.
uWe show that beta is positively correlated with the firm size (market cap) which is counter-intuitive as it
points to the inference that larger firms are riskier. Beta here does not measure the fundamental risk which is
higher for the smaller firms but only sees volatility and thus our paper points to the failure of beta to measure
risk fully. The size effect is not due to the so called risk measured by beta. There is some other cause on why
lower market cap penny stocks earn higher returns. It appears that the fundamental risk or asymmetry not
16
fully captured by the beta. Essentially then, a portfolio of low market cap penny stocks have higher returns as
well as low volatility which is great from investors point of view. Also, this reverse trend can explain why beta
is not statistically significant in t-test despite being correlated with returns.
P/E ratio and P/B ratio: A statistically significant t-statistic suggest that the returns on stocks belonging
to bottom 50 percent when sorted on their P/E ratios are substantially higher than the returns on penny stocks
from the top 50 percent of the P/E ratio-sorted stock group. A similar behavior is observed when we sorted
the stocks on the basis of P/B ratio and test for the differences in means of returns on top 50 percent stocks
and bottom 50 percent stocks. These two functions, namely, P/E and P/B ratios are established risk factors
validated both theoretically and empirically across the markets and our results support the hypotheses laid out
earlier.
The t-test results obtained for shareholding pattern, beta, and liquidity do not yield favorable results,
suggesting that the returns on top 50 percent penny stocks are statistically and significantly indifferent from
the returns on bottom 50 percent penny stocks when sorted on the basis or these functions. It appears that
since most of the penny stocks belong to the firms held largely by the families and small business operators,
shareholding pattern turns out to be an insignificant differentiator of returns on such stocks. Similarly, stocks
when sorted on the basis of beta do not exhibit different pattern across top and bottom 50 percentiles. Liquidity
factor is another redundant input as the sample penny stocks are very illiquid and rarely traded. It comes as
no surprise to us as liquidity can influence returns only when it is heavily traded, resulting into high trading
volume and price fluctuations.
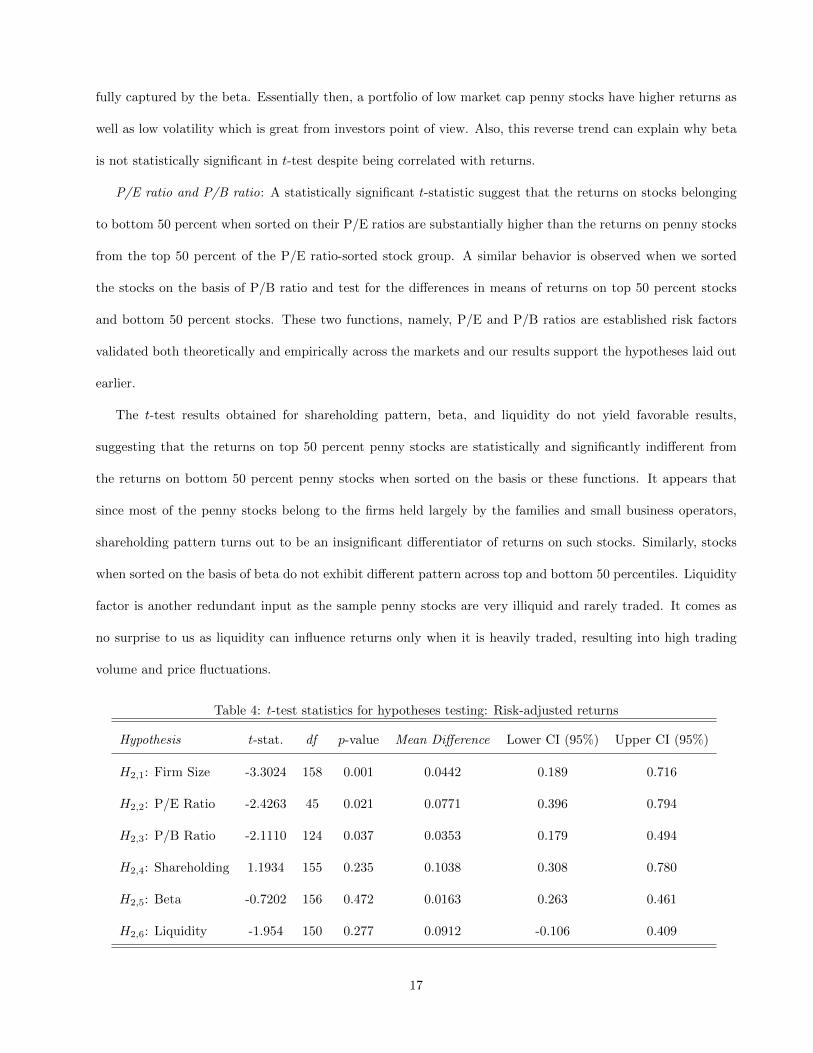
Table 4: t-test statistics for hypotheses testing: Risk-adjusted returns
Hypothesis t-stat. df p-value Mean Difference Lower CI (95%) Upper CI (95%)
H2,1: Firm Size -3.3024 158 0.001 0.0442 0.189 0.716
H2,2: P/E Ratio -2.4263 45 0.021 0.0771 0.396 0.794
H2,3: P/B Ratio -2.1110 124 0.037 0.0353 0.179 0.494
H2,4: Shareholding 1.1934 155 0.235 0.1038 0.308 0.780
H2,5: Beta -0.7202 156 0.472 0.0163 0.263 0.461
H2,6: Liquidity -1.954 150 0.277 0.0912 -0.106 0.409
17
In Table 4, we show the results of t-tests carried out with a slightly modified measure of returns. We adjusted
returns on penny stocks with Sharpe ratio, and use this risk-adjusted return to validate our argument whether
risk-adjusted returns show any different behavior across our sample stocks. The results are consistent and only
firm size, P/E and P/B ratios are statistically significant differentiators. Other functions such as shareholding,
beta, and liquidity are insignificant.
Alphabetism, behavioral biases and trading volume: We further test our hypothesis that stocks with names
starting with early/top 50 percent of alphabets (such as A, B, C, ..., L, M) have shown better average returns
compared to stocks with later (bottom 50 percent) alphabets (such as N, O, ..., Y, Z). The theoretical justification
of this hypothesis comes from early work by satisficing and the status-quo bias. Empirical and experimental
research in psychology and economics shows that when provided with a choice between a significantly large
number of alternatives, each with different risk and return characteristics, any economic agent tends to satisfice,
whereby search ceases after an economically acceptable option is found, even if a better option could be found
through continued search (Simon, 1956; Payne, 1976; Caplin, Dean, and Martin, 2011). Thus, in financial
markets, when stock traders browse through the lists of stocks possibly available for trading, they are more likely
to take positions against/for (either buy or sell) stocks appearing toward the beginning of the list, indicating early
alphabets when arrange alphabetically. Therefore, initial ordering and presentation of alternatives significantly
affects which stocks are selected for purchase or sale (Itzkowitz et al, 2015).
However, out simple two-tailed t-test statistic (t-stat: 0.3092; p−value: 0.7576) rejects the hypothesis of
the presence of alphabetism in our sample. One reason could be a small set of stocks being considered in our
study and the associated lack of data. It is hypothesized that investors find is easy to look through small set
of stocks available for investing and, therefore, no alphabetism-induced bias can be established. However, such
an exercise requires further investigation with larger sample and datasets.
5 Concluding Remarks
It is observed that Firm Size (measured in terms of market capitalization), P/E ratio, and P/B ratio significantly
influence the returns with penny stocks having lower values of these three factors generating higher raw as well
as risk adjusted returns. Penny stocks with lower prices generate higher raw returns but the premium vanishes
18

after adjusting for risk while promoters’ shareholding patterns, risk attributes (measured by beta) and liquidity
do not show statistically significant influence on returns of the penny stocks.
This points to the existence of the much debated size effect, price-to-earnings ratio effect and the book-to-
market effect in the Indian penny stock universe. It is possible to generate profits, even after adjusting for risk,
from these stocks in the Indian stock market by forming portfolios on the basis of these factors. Though this
paper explores a buy-and-hold strategy extending for a year, there can be other trading strategies which can
utilize the existence of the size and effect of P/E and P/B ratios to generate adequate profits.
19
References
1. Gabrix, X., P. Gopikrishnan, V. Plerou, and H. E. Stanley (2003). A theory of power-law distributions in
financial market fluctuations. Nature, Vol. 423, pp. 267-270.
2. Itzkowitz, J. J. Itzkowitz, and S. Rothbort (2015). ABCs of Trading: Behavioral Biases affect Stock
Turnover and Value. Review of Finance, doi: 10.1093/rof/rfv012.
3. Liu, Q., S. G. Rhee, and L. Zhang (2011). On the Trading Profitability of Penny Stocks. 24th Australasian
Finance and Banking Conference 2011 Paper. Available at SSRN (http://ssrn.com/abstract=1917300).
4. Moor, L. D., and P. Sercu (2015). The smallest stocks are not just smaller: Global evidence. The European
Journal of Finance, Vol. 21, No. 1, pp. 51-70.
5. Murdock, B. B. (1962). The serial position effect of free recall. Journal of Experimental Psychology, Vol.
64, pp. 482488.
6. Nofsinger, J. F., and A. Varma (2014). Pound wise and penny foolish? OTC stock investor behavior.
Review of Behavioral Finance, Vol. 6 Iss. 1, pp. 2-25.
7. Payne, J. W. (1976). Task complexity and contingent processing in decision making: an information
search and protocol analysis. Organizational Behavior and Human Performance, Vol. 16, pp. 366387.
8. Simon, H. A. (1956). Rational choice and structure of the environment. Psychological Review, Vol. 63,
pp. 129138.
9. Simon, H. A. (1957). Models of Man: Social and Rational, John Wiley and Sons, Inc., New York, New
York.
10. Subrahmanyam, A. (2010). The Cross-Section of Expected Stock Returns: What Have We Learnt from
the Past Twenty-Five Years of Research? European Financial Management, Vol. 16, No. 1, pp. 27-42.
11. Tversky, A. and Kahneman, D. (1973). Availability: a heuristic for judging frequency and probability.
Cognitive Psychology, Vol. 5, pp. 207232.
20