the critical assessment of the experimental techniques … · the critical assessment of the...
TRANSCRIPT
The Critical Assessment of the Experimental Techniques for
Cardiac Performance
Pages with reference to book, From 18 To 25 Shahid Rashid ( Department of Pharmacology, University of Karachi, Karachi. )
Naeema Ansari ( Department of Physiology, Sind Medical College, Karachi. )
Abstract
Clascical haemodynamks has been notably successful in defining the normal physiclogy of the
Cardiovascular sysP m, but failed te provide a clear definition and early diagnosis of a functional im?
airment of the myocardium, this failure is possibly attributable to madequacy of the moni osed
variables of the conventional haemodynamics studies.
In this article, two common parameters of cardiodynamics, viz., cardiac output and first derivatives of
the ventricular pressure (dP/dt), are discussed in order to find properties of cardiac muscle which could
help in dstinguisbing alterations of ventricular performance (JPMA: 33:18, 1983).
Introduction
Classical haernodynarrrics, notably successful in defining the normal physiology of the cardiovascular
system as well as the pathophysiology of congenital heart disease, has yet failed to provide a clear
definition and early diagnosis of a functional impairment of the myocardium. fThis failure could be due
to inadequacy of the monitored variables of the conventional haemodynamics studies. Apart from the
parameters of haemodynamics such as blood pressure and mean blood flow, which are very indirect
and insensitive indicators of myocardial function, parameters such as mean systolic ejection rate, stroke
work and power and dP/dt are equally wanting.
These considerations combined with the development of new techniques aroused the interest of
physiologists to appreciate that the heart is not only a pump but is also a muscle, the evaluation of
whose properties could help in distinguishing alterations of ventricular performance. The following list
of parameters of cardiac function shows some commonly used but not very sensitive expressions and
also includes the recent and specific indices in which both pressure and volume have been used.
1. Cardiac output (C.O.) and stroke volume. 2.Mean systolic ejection rate. 3. Left ventricular work and
contractility index. 4.Ventricular power. 5. Systolic time intervals. 6. Indices of cardiac response to
exercise. 7. Ventricular volume and ejection fraction. 8. Left ventricular mass. 9. First derivatives ofthe
ventricular pressure (dP/dt). 10. Haemodynamic correlates of myocardial 02 consumption. 11. External
mechanical efficiency.
All these parameters are significant in the assessment of cardiac performance, but C.O. and first
derivatives of the ventricular pressure will be discussed here in detail.
I.Cardiac Output (C.O.):- CO. is defined as the amount of blood ejected per unit of time (mVmin).
Commonly used as an index of ventricular function, the C.O. is a relatively insensitive parameter for its
assessment, being regulated by various factors, such as body O2 requirement, venous return,
mechanical loads and myocardial mass (Kelman, 1971). The C.O. of a normal man at rest is
approximately 5 Lit/mm hut under different physiological conditions this value changes, e.g., during
certain forms of anaesthesia C.O. may fall to 2. 5 L/min (Kelman, 1971), whereas it may increase to as
high as 30 L/min during streneous exercise (Astrand ct al., 1964).
Several methods are available for the indirect measurement of C.O. but the FICK and indicator dilution
methods arc the standard techniques for the measurement of C.O. because of their accuracy, safety,
reproducibility and simplicity (Yang et al., 1972a). These two, alongwhh other methods will be
discussed in detail.
1. Direct Fick Method. (Fick, 1870):- Blood flow through an organ can be determined if a substance is
re moved from or added to the blood during its flow through the org2n. The above Fick principle has
been used in lungs to calculate the volume of the blood required tran: -port the C2 sken up from the
alveoli per unit time. The direct Fick method employs the following formula C.C=O2Consumprion
m’ /min X 100
A-V2 difference
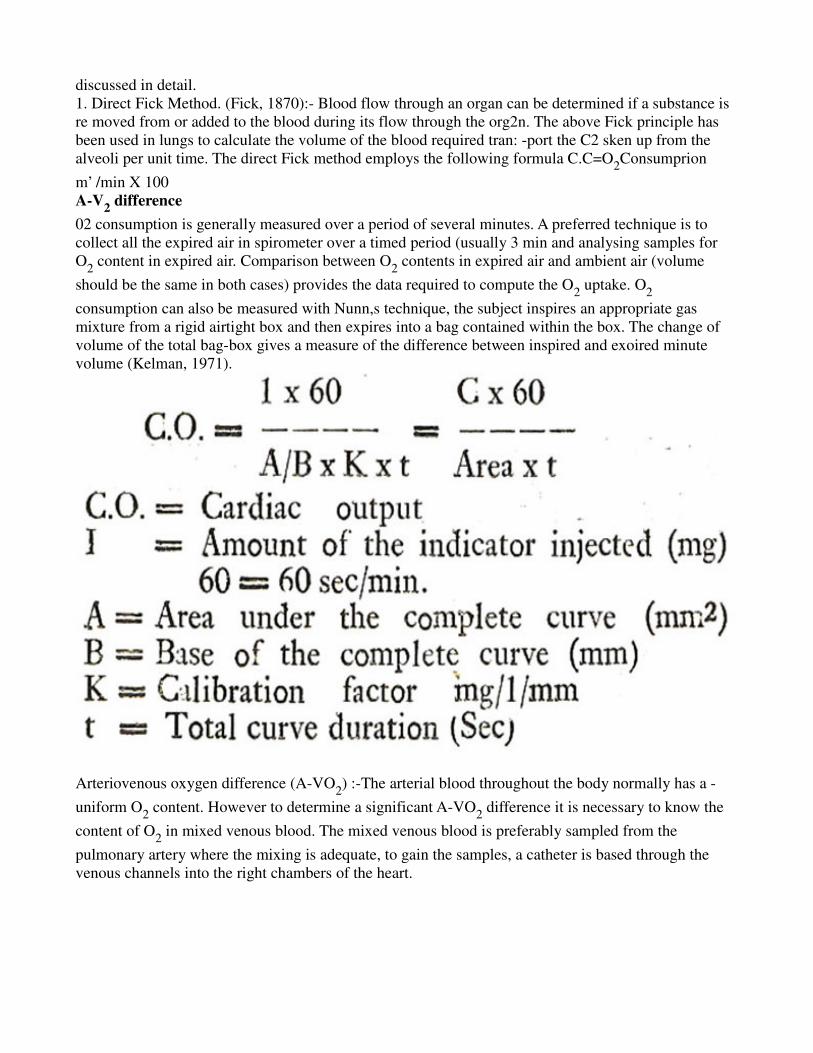
02 consumption is generally measured over a period of several minutes. A preferred technique is to
collect all the expired air in spirometer over a timed period (usually 3 min and analysing samples for
O2 content in expired air. Comparison between O
2 contents in expired air and ambient air (volume
should be the same in both cases) provides the data required to compute the O2 uptake. O
2
consumption can also be measured with Nunn,s technique, the subject inspires an appropriate gas
mixture from a rigid airtight box and then expires into a bag contained within the box. The change of
volume of the total bag-box gives a measure of the difference between inspired and exoired minute
volume (Kelman, 1971).
Arteriovenous oxygen difference (A-VO2) :-The arterial blood throughout the body normally has a -
uniform O2 content. However to determine a significant A-VO
2 difference it is necessary to know the
content of O2 in mixed venous blood. The mixed venous blood is preferably sampled from the
pulmonary artery where the mixing is adequate, to gain the samples, a catheter is based through the
venous channels into the right chambers of the heart.
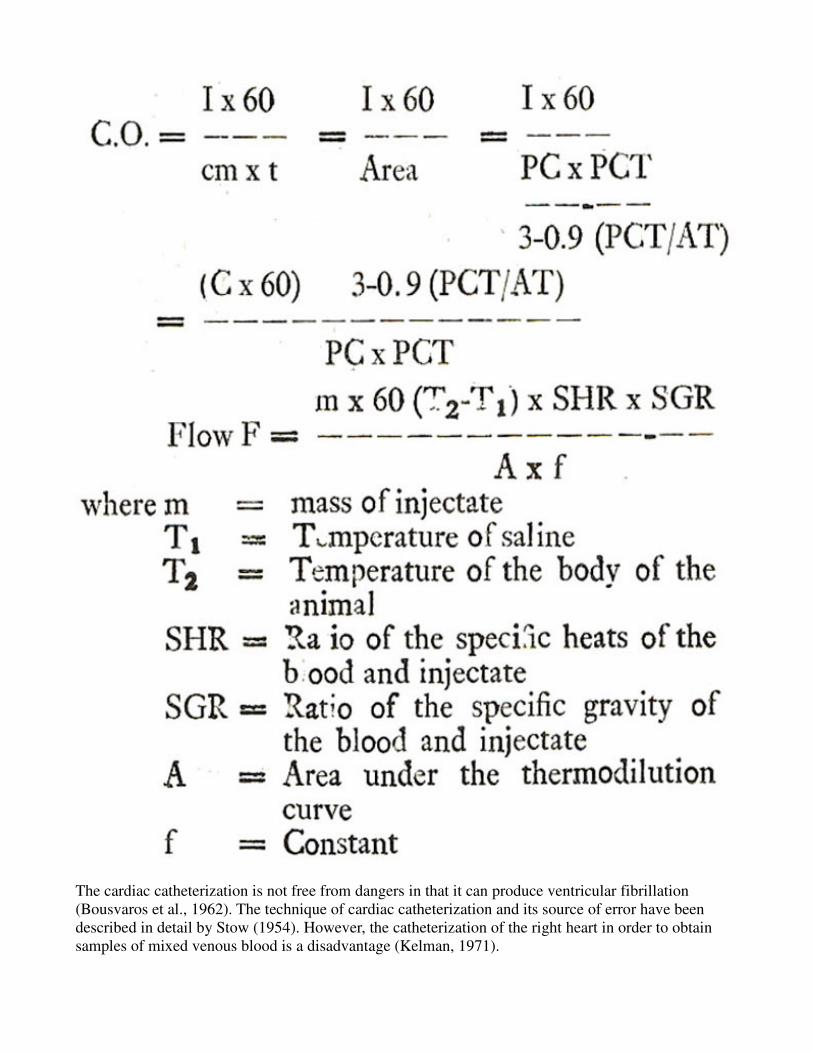
The cardiac catheterization is not free from dangers in that it can produce ventricular fibrillation
(Bousvaros et al., 1962). The technique of cardiac catheterization and its source of error have been
described in detail by Stow (1954). However, the catheterization of the right heart in order to obtain
samples of mixed venous blood is a disadvantage (Kelman, 1971).

Arterial and venous O2 content can be directly measured with vanslyke apparatus. This method though
is very accurate, carried out by a highly trained person, but is time consuming. For rapid determination
of blood O2 contents, photo-electric method compares favourably with vanslvke method.
Apart from the cardiac catheterization as a disadvantage, there are few more con. iderations to test the
validity of this method. Cardiac catheterization itself is too complicated a procedure to use in routine
studies and is not entirely suitable for use during exercise. The other assumption in this technique that
the rate o’ C2 removal by the blood equals the rate of C2 upcake at the mouth dots not apply at the start
of exercise. The compo. ;ition of arterial blood varies during respiratory or cardiac cycle. These
variations may cause errors in the calculated C.0. in rest as well as in exercise.
2. Indicator Dilution Method :- In recent years the Fick technique has been challenged by the
introduction of the indicator dilution method, being easier to ‘use and not requiring either samples of
mixed venous blood or the measurement of the body 02 consumption which may be experimentally
dtfficult particularlv during anaesthesia.
Introduced by Stewart (1897) this method was based on the principle that volume of a fluid in a
container can be calculated by adding a known quantity of dye and measuring the concentration of the
material following even dispersal through the fluid. The volume can be calculated by the formula:-
V = A’C
where T = volume of the fluid
A = amount of dye added
And C =concentration of the dye in each cubic centimeter of fluid.
Stewart (1921), showed that his method can also be applied to. fluids in motion. Its usefulness was
confirmed by Kin man et al. (1929) and Hamilton and Remington (1948), and its theoretical validity
shown by Zierler
(1962). This method employs the Hamilton equation which is as follows:-
PC = Peak Concentration.
PCT = Peak Concentration Time.
The dotted line is the terminal portion of the indicator dilution curve expected to be without reci
rculation.
A bolus injection of a certain amount of dye is given into the circulation via the jugular vein of the right
side of the heart and blood is withdrawn through brachial artery at a constant rate. A time concentration
curve can be recorded using a densitometer (Fig. 1).
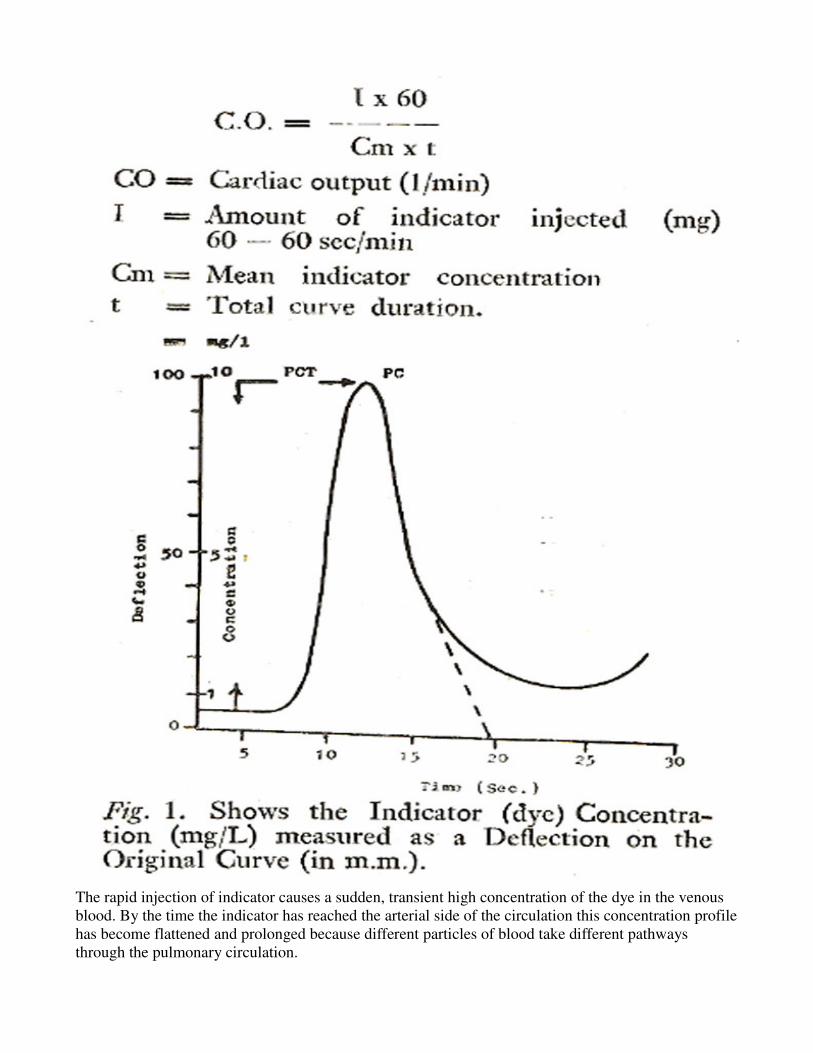
The rapid injection of indicator causes a sudden, transient high concentration of the dye in the venous
blood. By the time the indicator has reached the arterial side of the circulation this concentration profile
has become flattened and prolonged because different particles of blood take different pathways
through the pulmonary circulation.
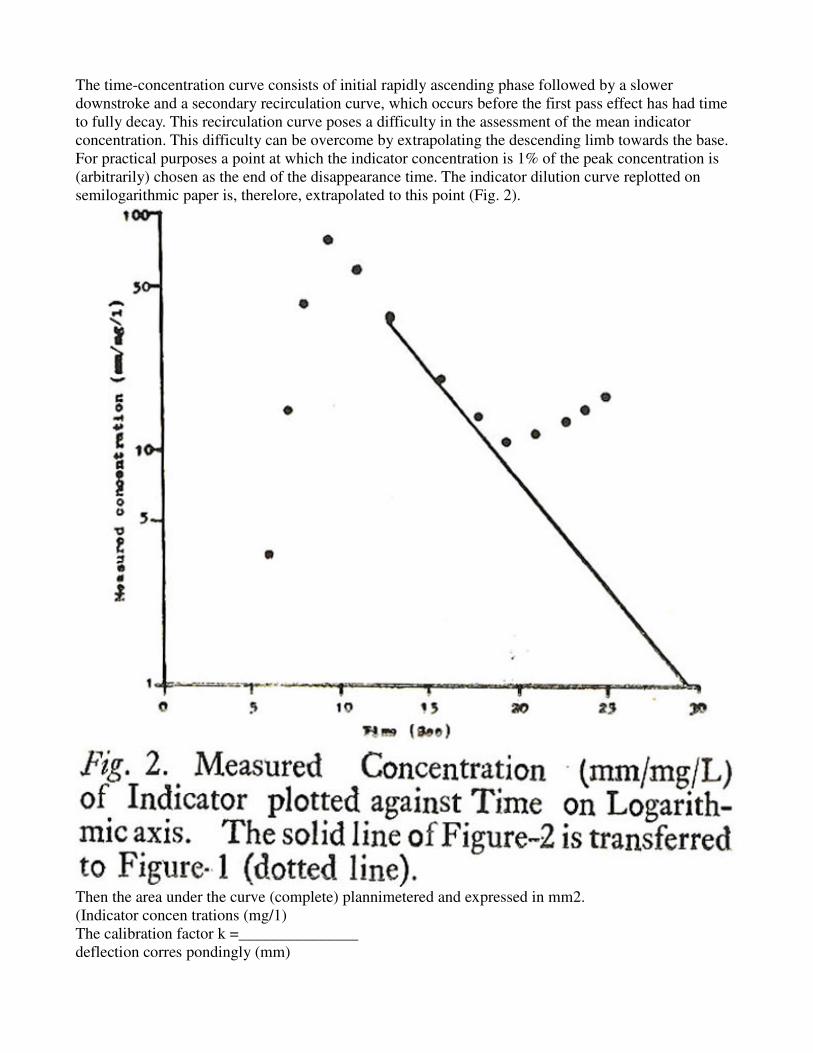
The time-concentration curve consists of initial rapidly ascending phase followed by a slower
downstroke and a secondary recirculation curve, which occurs before the first pass effect has had time
to fully decay. This recirculation curve poses a difficulty in the assessment of the mean indicator
concentration. This difficulty can be overcome by extrapolating the descending limb towards the base.
For practical purposes a point at which the indicator concentration is 1% of the peak concentration is
(arbitrarily) chosen as the end of the disappearance time. The indicator dilution curve replotted on
semilogarithmic paper is, therelore, extrapolated to this point (Fig. 2).
Then the area under the curve (complete) plannimetered and expressed in mm2.
(Indicator concen trations (mg/1)
The calibration factor k =_______________
deflection corres pondingly (mm)
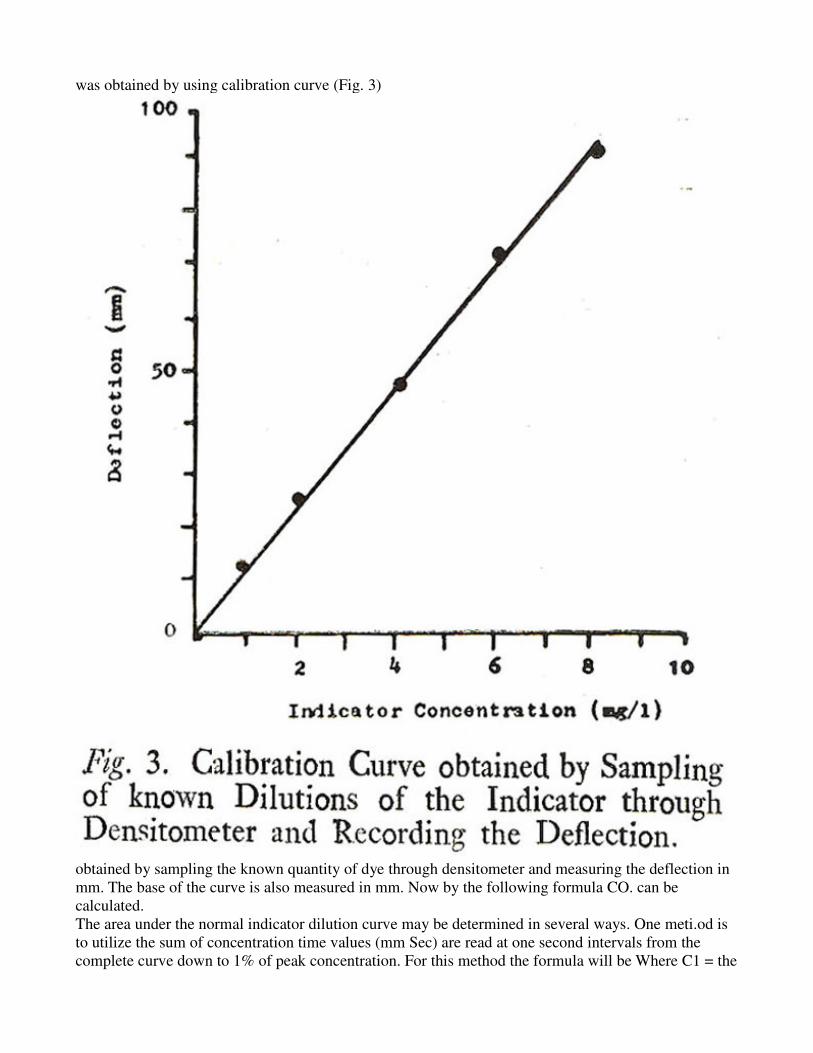
was obtained by using calibration curve (Fig. 3)
obtained by sampling the known quantity of dye through densitometer and measuring the deflection in
mm. The base of the curve is also measured in mm. Now by the following formula CO. can be
calculated.
The area under the normal indicator dilution curve may be determined in several ways. One meti.od is
to utilize the sum of concentration time values (mm Sec) are read at one second intervals from the
complete curve down to 1% of peak concentration. For this method the formula will be Where C1 = the
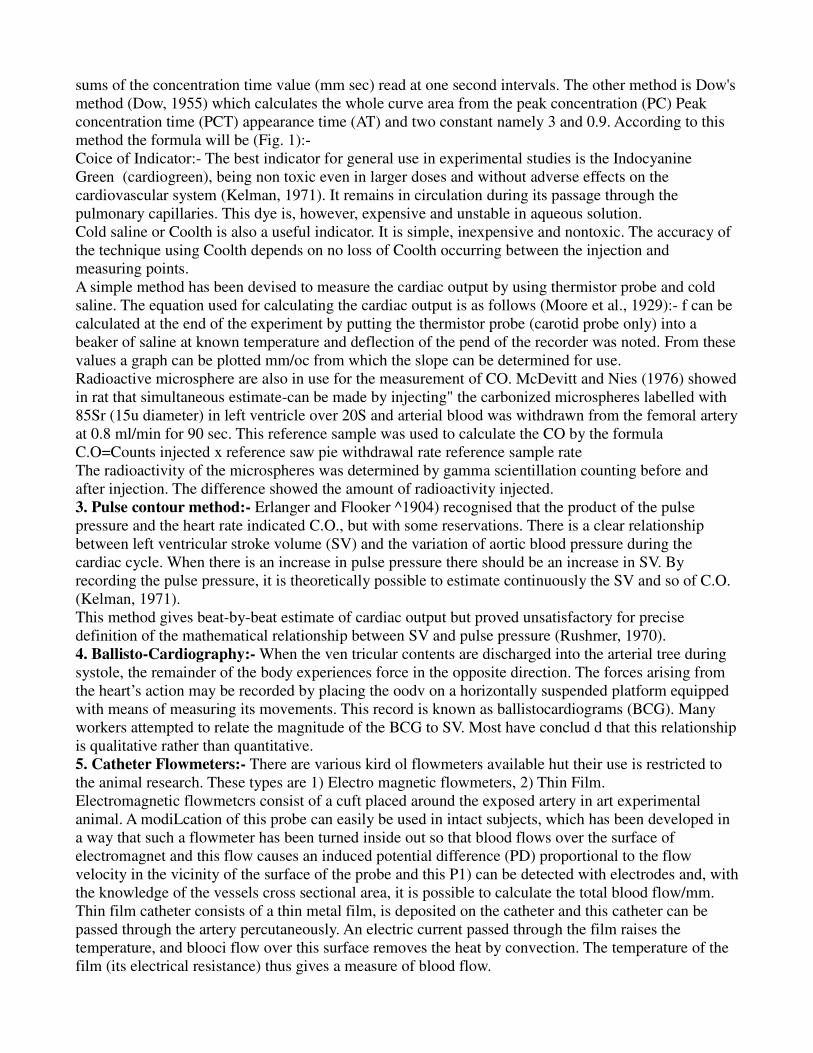
sums of the concentration time value (mm sec) read at one second intervals. The other method is Dow's
method (Dow, 1955) which calculates the whole curve area from the peak concentration (PC) Peak
concentration time (PCT) appearance time (AT) and two constant namely 3 and 0.9. According to this
method the formula will be (Fig. 1):-
Coice of Indicator:- The best indicator for general use in experimental studies is the Indocyanine
Green (cardiogreen), being non toxic even in larger doses and without adverse effects on the
cardiovascular system (Kelman, 1971). It remains in circulation during its passage through the
pulmonary capillaries. This dye is, however, expensive and unstable in aqueous solution.
Cold saline or Coolth is also a useful indicator. It is simple, inexpensive and nontoxic. The accuracy of
the technique using Coolth depends on no loss of Coolth occurring between the injection and
measuring points.
A simple method has been devised to measure the cardiac output by using thermistor probe and cold
saline. The equation used for calculating the cardiac output is as follows (Moore et al., 1929):- f can be
calculated at the end of the experiment by putting the thermistor probe (carotid probe only) into a
beaker of saline at known temperature and deflection of the pend of the recorder was noted. From these
values a graph can be plotted mm/oc from which the slope can be determined for use.
Radioactive microsphere are also in use for the measurement of CO. McDevitt and Nies (1976) showed
in rat that simultaneous estimate-can be made by injecting" the carbonized microspheres labelled with
85Sr (15u diameter) in left ventricle over 20S and arterial blood was withdrawn from the femoral artery
at 0.8 ml/min for 90 sec. This reference sample was used to calculate the CO by the formula
C.O=Counts injected x reference saw pie withdrawal rate reference sample rate
The radioactivity of the microspheres was determined by gamma scientillation counting before and
after injection. The difference showed the amount of radioactivity injected.
3. Pulse contour method:- Erlanger and Flooker ^1904) recognised that the product of the pulse
pressure and the heart rate indicated C.O., but with some reservations. There is a clear relationship
between left ventricular stroke volume (SV) and the variation of aortic blood pressure during the
cardiac cycle. When there is an increase in pulse pressure there should be an increase in SV. By
recording the pulse pressure, it is theoretically possible to estimate continuously the SV and so of C.O.
(Kelman, 1971).
This method gives beat-by-beat estimate of cardiac output but proved unsatisfactory for precise
definition of the mathematical relationship between SV and pulse pressure (Rushmer, 1970).
4. Ballisto-Cardiography:- When the ven tricular contents are discharged into the arterial tree during
systole, the remainder of the body experiences force in the opposite direction. The forces arising from
the heart’s action may be recorded by placing the oodv on a horizontally suspended platform equipped
with means of measuring its movements. This record is known as ballistocardiograms (BCG). Many
workers attempted to relate the magnitude of the BCG to SV. Most have conclud d that this relationship
is qualitative rather than quantitative.
5. Catheter Flowmeters:- There are various kird ol flowmeters available hut their use is restricted to
the animal research. These types are 1) Electro magnetic flowmeters, 2) Thin Film.
Electromagnetic flowmetcrs consist of a cuft placed around the exposed artery in art experimental
animal. A modiLcation of this probe can easily be used in intact subjects, which has been developed in
a way that such a flowmeter has been turned inside out so that blood flows over the surface of
electromagnet and this flow causes an induced potential difference (PD) proportional to the flow
velocity in the vicinity of the surface of the probe and this P1) can be detected with electrodes and, with
the knowledge of the vessels cross sectional area, it is possible to calculate the total blood flow/mm.
Thin film catheter consists of a thin metal film, is deposited on the catheter and this catheter can be
passed through the artery percutaneously. An electric current passed through the film raises the
temperature, and blooci flow over this surface removes the heat by convection. The temperature of the
film (its electrical resistance) thus gives a measure of blood flow.
In conclusion, the indicator dilution method seems to be better than others described above. In
experimental studies flowmeters method may not be physiological as such that the opening of the chest
of the animals is involved for the placement of the cuff round the aorta. Moreover it cannot be used in
routine experimental studies due to lengthy surgical intervention. Ballistocardiography has not been
reported in animal studies and it requires elaborate apparatus, even in clinical situation this method is
more qualitative than quantitative (Kelman, 1971). Another drawback in this method is that the results
may be seriously distorted by such factors as coupling between the body and the table, the elasticity of
the skin acts as a spring interposed between the moving body, and the table top.
The Fick method although reliable is complicated and time consuming. One aspect in particular is
hazardous in clinical situation, the cardiac catheterization. In experimental studies this method will not
be able to give results continuously witn the changes in CO as the measurements will be irtermittent.
The pulse contour method can give beat-to-beat measurement of C.O but to define the precise
mathematical relationship between stroke volume and pulse pressure have proved unsatisfactory.
When three methods have been compared, viz; pulse contour method, thermodi lution coil saline was
used and flowmeter method, the results showed that determination by mathematical index (Pulse
contour method) resulted in lower values for C.O., while thermodilution technique showed good
correlation to values obtained by electromagnetic flowmetery. The thermodilution method has the
advantage, however, of being less invasive than the electromagnetic flow method and provides absolute
flow values unlike the index. The main disadvantage of thermodilution is that continual readings can
not be made.
II. First Derivative of thc Ventricular Pressure.
The first time derivative of the ventricular pressure is “the rate of change of pressure with respect to
time ‘ and usually expressed as dP/dt. Maximum value attained during early systole is designated as
peak dP/dt (Yang etal., 1972 b). The maximal rate of left ventricular pressure rise (Max dP/dt and value
derived from it have been used to evaluate the inotropic state of the heart in clinical Gleason and
Braunwald, 1962; Mason, 1969) and in experimental situations (Reeves et al., 1960; Schaper et al.,
1965).
The peak dP/dt has been used in the assessment of myocardial function, as it increases with increased
contractility by digitalis action and the depressed myocardial contracti lity depresses the peak dP/dt.
However, peak dP/dt also affected by the factors which are not related to the inotropic changes.
Principal among these factors which alter peak dP/dt when contractility is stable are the loading
conditions under which the heart operates. These loading conditions are: (Braunwalci et al., 1976a):-
Preload:- In the intact heart ventricular end-diastolic wall stress or tension is called- pre-load and
determines the resting length of the muscle fibre. This preload on ventricular muscle can be altered
(increased or decreased) by changing the end-diastolic pressure EDP and volume. It has been shown
that increase in LVEDP also increased the peak dP/at (Wallace et al., 1963; Robie and Newman, 1975).
Afterload: It may be defined as the tension, force or stress in the ventricular wall during ventricular
ejcction (Braunwald Ct al., l976b). Arterial diastolic pressure is a determinant of ventricular afterload
(Mason, 1969). Elevation of arterial diastolic pressure influence the rate of rise of ventricular pressure
during systole (Wallace et al., 1963; Wildenthal et al., 1969).
The other factor which effects dPfdt is heart ra.e. Any increase in heart rate causes an increase in the
rate of rise of the ventricular pressure. Inherently related to an elevation of heart rate is an improvement
in the fundamental contractile properties of the heart rate (Wallace et al., 1963). A direct linear
correlation has been determined between peak dP/dt and heart rate in a variably paced canine atrial
preparation (Wallace et al., 1963).
The development of indices to estimate contractility (dP/dt.
The various indices used to estimate contractility by indirect means in either ana- esthetized or
conscious animals based on the appreciation of correction factors, which mainly concern the effect of
loading condition (such as preload and afterload) of the heart. The following indices have been
developed to separate the effect of preload conditions on dP/dt from the effect of changes in
contractility on dP/dt when afterload remains constant.
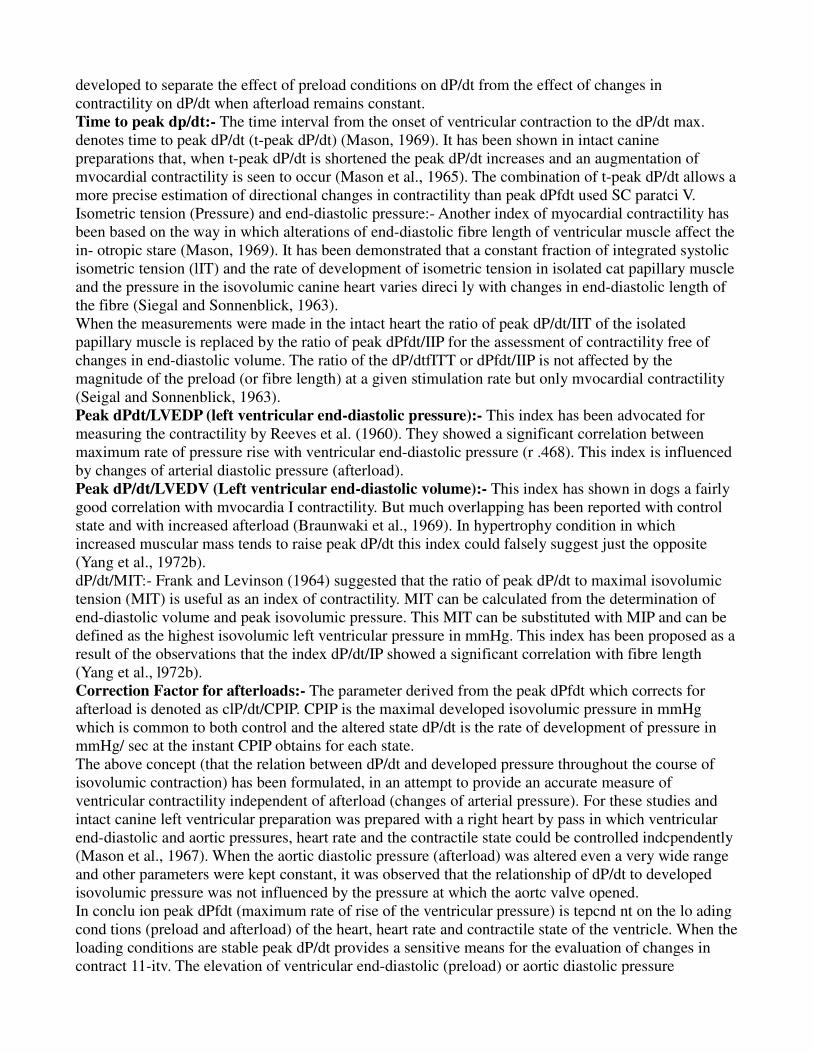
Time to peak dp/dt:- The time interval from the onset of ventricular contraction to the dP/dt max.
denotes time to peak dP/dt (t-peak dP/dt) (Mason, 1969). It has been shown in intact canine
preparations that, when t-peak dP/dt is shortened the peak dP/dt increases and an augmentation of
mvocardial contractility is seen to occur (Mason et al., 1965). The combination of t-peak dP/dt allows a
more precise estimation of directional changes in contractility than peak dPfdt used SC paratci V.
Isometric tension (Pressure) and end-diastolic pressure:- Another index of myocardial contractility has
been based on the way in which alterations of end-diastolic fibre length of ventricular muscle affect the
in- otropic stare (Mason, 1969). It has been demonstrated that a constant fraction of integrated systolic
isometric tension (lIT) and the rate of development of isometric tension in isolated cat papillary muscle
and the pressure in the isovolumic canine heart varies direci ly with changes in end-diastolic length of
the fibre (Siegal and Sonnenblick, 1963).
When the measurements were made in the intact heart the ratio of peak dP/dt/IIT of the isolated
papillary muscle is replaced by the ratio of peak dPfdt/IIP for the assessment of contractility free of
changes in end-diastolic volume. The ratio of the dP/dtfITT or dPfdt/IIP is not affected by the
magnitude of the preload (or fibre length) at a given stimulation rate but only mvocardial contractility
(Seigal and Sonnenblick, 1963).
Peak dPdt/LVEDP (left ventricular end-diastolic pressure):- This index has been advocated for
measuring the contractility by Reeves et al. (1960). They showed a significant correlation between
maximum rate of pressure rise with ventricular end-diastolic pressure (r .468). This index is influenced
by changes of arterial diastolic pressure (afterload).
Peak dP/dt/LVEDV (Left ventricular end-diastolic volume):- This index has shown in dogs a fairly
good correlation with mvocardia I contractility. But much overlapping has been reported with control
state and with increased afterload (Braunwaki et al., 1969). In hypertrophy condition in which
increased muscular mass tends to raise peak dP/dt this index could falsely suggest just the opposite
(Yang et al., 1972b).
dP/dt/MIT:- Frank and Levinson (1964) suggested that the ratio of peak dP/dt to maximal isovolumic
tension (MIT) is useful as an index of contractility. MIT can be calculated from the determination of
end-diastolic volume and peak isovolumic pressure. This MIT can be substituted with MIP and can be
defined as the highest isovolumic left ventricular pressure in mmHg. This index has been proposed as a
result of the observations that the index dP/dt/IP showed a significant correlation with fibre length
(Yang et al., l972b).
Correction Factor for afterloads:- The parameter derived from the peak dPfdt which corrects for
afterload is denoted as clP/dt/CPIP. CPIP is the maximal developed isovolumic pressure in mmHg
which is common to both control and the altered state dP/dt is the rate of development of pressure in
mmHg/ sec at the instant CPIP obtains for each state.
The above concept (that the relation between dP/dt and developed pressure throughout the course of
isovolumic contraction) has been formulated, in an attempt to provide an accurate measure of
ventricular contractility independent of afterload (changes of arterial pressure). For these studies and
intact canine left ventricular preparation was prepared with a right heart by pass in which ventricular
end-diastolic and aortic pressures, heart rate and the contractile state could be controlled indcpendently
(Mason et al., 1967). When the aortic diastolic pressure (afterload) was altered even a very wide range
and other parameters were kept constant, it was observed that the relationship of dP/dt to developed
isovolumic pressure was not influenced by the pressure at which the aortc valve opened.
In conclu ion peak dPfdt (maximum rate of rise of the ventricular pressure) is tepcnd nt on the lo ading
cond tions (preload and afterload) of the heart, heart rate and contractile state of the ventricle. When the
loading conditions are stable peak dP/dt provides a sensitive means for the evaluation of changes in
contract 11-itv. The elevation of ventricular end-diastolic (preload) or aortic diastolic pressure
(afterload) result in elevations of peak dP/dt. It has been shown in holated papillary muscle and intact
canine ventricles that, when preload is stable and afterload varies the effect of variation or aortic
diastolic pressure on dP/dt can be neutralized by comparing dP/dt at common isovolumic pressures. In
this way a simple and useful method for the assessment of myocardial contractility during alterations of
afterload has been provided.
The methods for measuring the cardiac performance which have been discussed are not free from
criticism, especially the incorporation of the findings in isolated cardiac muscle preparation (Papillary
muscle to the intact heart). Brutsaort and Paulus (1977) pointed out that pragmatic usefulness being
only the justification for applying isolated muscle concept to the intact ventricle is no longer a
sufficient argument.
The ventricle function is as a combined muscle-p7mp system and not as a papillary muscle and even
less a simple tension muscle. The nature of loading forces which occur during muscle shortening in the
ventricular wall in intaft heart arc quite different from those encountered in isolated muscle since the
ventricle is not called on to sustain a weight but to eject a viscous fluid into a viscoelastic vascular
system (Abbott and Gordon, 1975).
Moreover difficulties have been reported of attempts to use the method of extrapolating the plot of LV
dP/dtJP against P to Zero P to obtain Vmax (Van Den Bos et al., 1973). Suggestions have been put
forward to make progress in the field of measurement of ventricular function by conducting
experiments that should be designed to distinguish between the relative contributions of muscular
mechanisms and those of the ventricular configurational mechanisms underlying starlings law of the
heart (Brutsaort and Paulus, 1977). However so far the index of Vmax has been favoured both in
animals (Nejad et al., 1971) and in the clinic (Mason et al., 1970) as a suitable and accurate method
determining the rate of rise of pressure in ventricles.
References
1. Abbott, B.C. and Gordon, D.G. (1975) A commentary on muscle mechanics. Circ. Res., 36:1.
2. Astrand, P.O., Cuddy, T.E., Saltin, B. and Stenberg, J. (1964) Cardiac output during submaximal and
maximal work. J. AppI. Physiol., 19:268.
3. Bousvaros, G.A., Done, and Hopps, J.A. (1962) An electrical hazard of selective angiocardiography.
Canad. Med. Ass. J., 87 :286.
4. Braunwald, E., Ross, J. Jr., Gault, J.H., Mason, D.T., Mills, C., Gabe, I.T. and Epstein, S.E. (1969)
Assessment of cardiac function. Ann. Intern. Med., 70:369.
5. Braunwald, E., Ross, J. Jr. and Sonnenblick, E.H. Mechanics of contraction, in mechanisms of
contracting of the normal and failing heart. Little BroWn, 1976, pp. 39-71.
6. Braunwald, E., Ross, J. Jr. and Sonnenblick, E.H. Mechanism governing contractions of the whole
heart, mechanisms of contracting of the normal and failing heart. Little Brown, 1976, pp. 92-129.
7. Brutsaort, D.L. and Paulus, W.J. (1977) Loading and performance of the heart as a muscle and pumP
Cardiovasc. Res., II:1.
8. Dow, P. (1955) Dimensional relationships in dye-dilution curves from humans and dogs, with an
empirical formula for certain troublesome carves. J. Appi. Physiol., 7:399.
9. Erlanger, J. and Hooker, D.R. (1904) An experimental study of blood pressure and of pulse pressure
in man. John Hopkin Hosp. Rep., 12:145. (Quoted from Rush mer, R.F. (1970).
10. Fick, A. (1870) Uberffdie messung des Blutquantums der Herzventrikelin. S.B. Phys-Med. Ges
Wurzvurg 16 (Quoted from Yang et al., 1972).
11. Frank, M.J. and Levinson, G.E. (1964) Measurement of myocardial contractility in man. Clin. Res.,
12:182.
12. Gleason, W.L. and Braunwald, E. (1962) Studies on the first derivative of the ventricular pressure
pulse in man. J. Clin. Invest., 41:80.
13. Hamilton, W.F. and Remington, J.W. (1948) Comparison of time concentration curves in arterial
blood of diffusible and non-diffusible substances when injected at constant rate and when injected
instantaneously. Am. J. Physiol., 148 :3 5.
14. Kelman, G.R. Cardiovascular measurements, in applied cardiovascular physiology. London,
Butterworth, 1971, pp. 210-242.
15. Kinsman, J.M., Moore, J.W. and Hamilton, W.F. (1929) Studies on the circulation; injection
method: physical and mathematical consideration. Am. J. Physiol., 89: 321-330.
16. Mason, D.T. (1969) Usefulness and limitation of the rate of rise of intraventricular pressure (dpfdt)
in the evaluation of myocardial contractility in man. Am. J. Cardiol., 23 :516.
17. Mason, D.T., Sonnenblick, KU., Ross, j. Jr., Covell, J.W. and Braunwald, K (1965) Time to peak
dpfdt: A useful measurement for evaluating the contractile state of the human heart. Circulation, 32
(Suppl II): 145.
18. Mason, D.T., Sonnenblick, E.H., Covell, J.W., Ross, J. Jr. and Braunwald, E. (1967) Assessment of
myocardial contractility in man relationship between the rate of pressure rise and developed 7 pressure
throughout isometric left ventricular contraction. Circulation, 36 (Suppl II) :183.
19. Mason, D.T., Spann, J.F. Jr. and Zelis, R. (1970) Quantification of the contractile state of the intact
human heart. Maximal velocity of contractile element shortening determined by the instantaneous
relation between the rate of pressure rise and pressure in left ventricle during isovo lumic systole. Am J.
Cardiol., 26:248.
20. McDevitt, D.G. and Nies, A.S. (1976) Simultaneous measurement of cardiac output and its
distribution with microspheres in rat. Cardiovasc. Res., 10:494.
21. Moore, J.W., Kinsman, J.M., Hamilton, W.F. and Spurling, R.G. (1929) The circulation. II. Cardiac
output demonstrations; comparison of the injection method ss*h the direct Fick procedure. Am.
Physiol., 89:331.
22. Nejad, N.S., Klein, M.D., Mirsky, I. and Lown, B. (1971) Assessment of myocardial contractility
from ventricular pressure recordings. Qtrdiovasc. Res,, 5:15.
23. Reeves, T.J., Hefner, L.L., Jones, W.B., Coghlan, U., Prieto, G. and Carroll, J. (1960) The
haemodynamic determinants of the rate of change in pressure in the left ventricle during isometric
contraction. Am. Heart J., 60:745.
24. Robie, N.W. and Newman, W.H. (1975) The influence of preload measured as diastolic mural force,
on myocardial contractility indices. Proc. Soc. Rap. l3iol. Med., 148:69.
25. Rushmer, R.F. Cardiovascular dynamics. 3rd ed. Philadclphia, Saunders, 1970.
26. Schaper, W.K.A., Lewi, P. and Jageneau, A.H.M. (1965) The determinants of the rate of change of
the left ventricular pressure (dpfdr). Arch. Kreislauff ,orsch., 46:27.
27. Siegel, J.H. and Sonnenblick, E.H. (1963-) Isometric time-tension relationships as an index of
myocardial contractility. Circ, Res., 12:597.
28. Stewart, G.N. (1897) Researches on the circulation time and on the influences which effect it. IV.
The output of the heaft. J. Physiol., 22:159. (Quoted from Yang et al., 1972),
29. Stewart, U.N. (1921) The outPut of the heart in dogs. Am. J. Physiol., 57:27. (Quoted from Yang et
al., 1972).
30. Stow, R.W. (1954) Systematic errors in flow determinations by the Fick method. Minnesota Med.,
37:30.
31. Van Den Bos, G.C., Elzinga, G., Westerhoff, N. and Noble, M.1.M. (1973) Problems in the use of
indices of myocardial contractility. Cardiovasc. Res., 7:834.
32. Wallace, A.G., Skinner, N.S. Jr. and Mitchell, J.H, (1963) Haemodynamic determinants of the
maximal rate of rise of left ventricular pressure. Am. J. P ysiol., 205:30.
32. Wildenthal, K., Mierzwiak, D.S. and Mitchell, J.H. (1969) Effect of sudden changes in aortic
pressure on left ventricular dpfdt. Am. J. Physiol., 216:185.

34. Yang, S.S., Bentivoglio, L.G., Maranhao, -V. and Goldberg, H. Cardiac output, in cardiac
catheterization data to haemodynamic parameters. Philadelphia, Davis, 1972, pp. 21-36.
35. Yang, S.S,, Bentivoglio, L.G., Maranhao, V. and Goldberg, H. Assessment of ventricular function,
in cardiac catheterization data to haemodynamic parameters. Philadelphia, Davis, 1972, pp. 157-.--210.
36. Zierler, K.L. Circulation times and the theory of indicator-dilution methods for determining blood
flow and volume, in hand book of physiology. Sec. 2, vol. 1. washington, American Physiological
Society, 1962, p. 585.