the crisis, policy reactions and attitudes to ... · the crisis, policy reactions and attitudes to...
TRANSCRIPT

CH
AP
TE
R 3
The crisis, policy reactions and attitudes to globalization and jobs
David N.F. Bell and David G. Blanchflower
3
85
3.1 Introduction
This chapter considers the effects of the financial crisis and subsequent recession on world labour markets. It begins by cataloguing the adverse effects on output of the sudden collapse in demand brought about by the financial crisis in what has come to be called the Great Recession. Next we look at the labour market and how employment and unemployment have been impacted and document the very different responses by country. We then move on to look at attitudinal indicators of the impact of the rising levels of joblessness that we observe across most OECD countries. We examine data on well-being and on attitudes to employment. We also examine a number of questions about the impact of globalization that respondents across many European countries were asked in 2008 and 2010. Finally, we examine the policy responses of governments, and consider what lessons might be learned from the marked differences in labour market outcomes following the recession.
3.2 The Great Recession
The origins of the financial crisis lay with the excessive expansion of credit by financial institutions in some countries in the 1990s and early part of this century. Due to the growth of complex financial derivatives and the global extension of capital markets, it became difficult for governments, regulators and the banks themselves to measure the underlying risks associated with their loan books. Fears that some institutions were holding large amounts of bad debt led to a collapse in the supply of credit as financial institutions tried to rebuild their balance sheets. To remain solvent, some had to be recapitalized by their governments, so jeopardizing the public finances.
The financial crisis led to a rapid contraction of demand. Further, there was a sharp reduction in the availability of trade finance. Banks and suppliers reported that lack of finance was the second major cause of the collapse in trade. However, trade finance recovered rapidly, partly as a result of the US$ 250 billion additional financing announced at the April 2009 G20 meeting (Mora and Powers, 2009).
86 MAKING GLOBALIZATION SOCIALLY SUSTAINABLE
Almunia et al. (2009) and Eichengreen and O’Rourke (2009) compare the severity of the Great Recession with the Great Depression of 1929. They argue that trade flows fell faster in the Great Recession than they did during the Great Depression. The declines in trade across countries were also more synchronized. By the end of 2008, more than 90 per cent of OECD countries had experienced a decline in trade exceeding 10 per cent. Not surprisingly, with largely coincident trade cycles, variations in output during the recession were also broadly synchronized. Araújoand Martins (2009) term this the “Great Synchronization” and argue that it is an outcome of globalization. Brown (2010) argues that this is the “first crisis of globalization”. However, the mechanism linking globalization and the Great Synchronization is not clear. Baldwin (2009) argues that the drop in world trade was much larger than the drop in GDP because the fall in demand was particularly concentrated on traded goods which are disproportionately “postponable” compared with other components of GDP. Postponement of orders was a natural reaction to the increased uncertainty associated with the financial collapse. Further, the synchronicity of the decline in trade was not due to the internationalization of supply chains. The structure of these chains was not impacted by the trade collapse. Rather, companies simply cut back on the amount of product that they were selling through these chains: trading relationships remained intact. The globalization of uncertainty may perhaps be the common factor linking declines in trade across different parts of the world.
Gamberoni et al. (2010) argue that there is a significant contrast in the response of employment to debt and banking crises on the one hand and global trade crises on the other. The countries that experienced both a domestic debt crisis and the global downturn experienced much larger falls in employment than did those who “only” experienced the downturn in world demand. This may partly explain why Europe and the United States have experienced more adverse labour market consequences of the recession than have the rapidly growing economies of Asia. An additional influence, they argue, concerns the openness of the economy. Relatively open economies (for example, Germany and the Netherlands) are immediately affectedby the downturn in global demand, but are capable of recovering rapidly because their domestic demand is not constrained by debt issues. Thus, relatively closed economies which suffer crises of private or public sector debt take longer to recover. Gamberoni et al. (2010) also argue that higher severance pay mitigates the reduction in employment caused by a downturn in demand and may induce employers to adjust their labour input more on the intensive (hours) margin than the extensive (jobs) margin. In addition, they suggest that countries with higher unemployment benefits experience a greater decline in employment growth, perhaps because benefits set a floor on real wages. However, the empirical support for this proposition is mixed and may be affected by measurement error in poorer countries where there is a large informal sector.

REACTIONS AND ATTITUDES TO GLOBALIZATION AND JOBS 87
CH
AP
TE
R 3
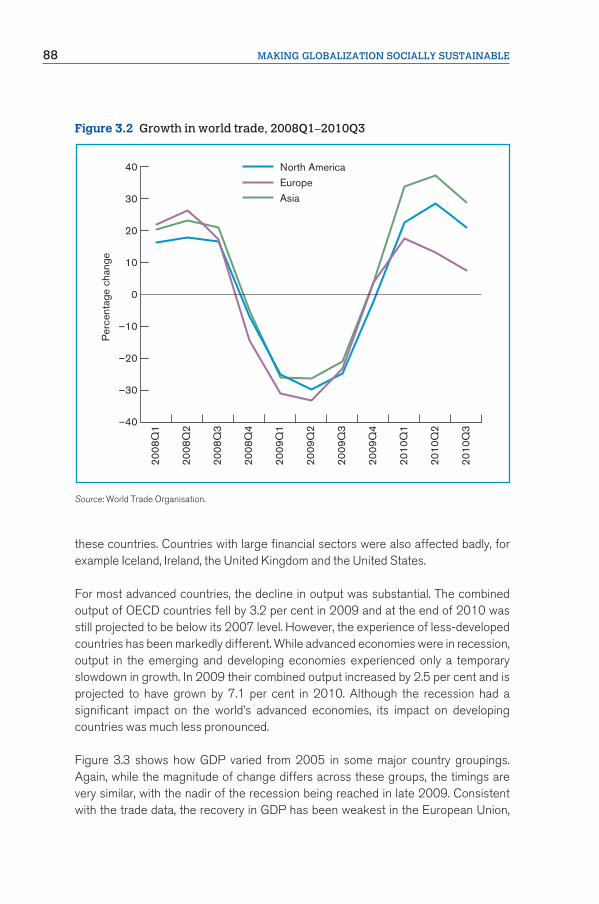
Some of the relevant recent events are captured in figures 3.1, 3.2 and 3.3.Figure 3.1 shows percentage changes in private short-term trade finance in OECD countries from 2005 to 2009. Beginning in 2008, there was a rapid retreat in the supply of private trade finance. However, these figures cannot determine the direction of causality – from trade credit to trade – or vice versa. Figure 3.2 shows the impact of the recession on trade volumes in major trading blocs. World trade declined rapidly through 2008 and early 2009 before recovering strongly from 2009Q3 onward. Figure 3.2 shows clearly that the trade cycles of the major groups of economies shared broadly the same turning points. Although the timing has been common, the extent of the recovery has varied substantially. In contrast to the Asian economies, European trade was still significantly below its pre-recession level inlate 2010.
While the slump in trade affected demand, output in countries such as Ireland, Spain, the United Kingdom and the United States was also affected adversely by instability in property markets. This had a negative effect on the construction industry in
Figure 3.1 Short-term trade finance in OECD countries, 2005–09 (quarter-on-quarter percentage change)
Source: OECD Factbook (2010).
12
10
8
6
4
2
0
–2
–4
–6
–8
–10
–12
Jun
2005
Sep
200
5
Dec
200
5
Mar
200
6
Jun
2006
Sep
200
6
Dec
200
6
Mar
200
7
Jun
2007
Sep
200
7
Dec
200
7
Mar
200
8
Jun
2008
Sep
200
8
Dec
200
8
Mar
200
9
Jun
2009
Per
cent
age
chan
ge
88 MAKING GLOBALIZATION SOCIALLY SUSTAINABLE
Figure 3.2 Growth in world trade, 2008Q1–2010Q3
Source: World Trade Organisation.
these countries. Countries with large financial sectors were also affected badly, for example Iceland, Ireland, the United Kingdom and the United States.
For most advanced countries, the decline in output was substantial. The combined output of OECD countries fell by 3.2 per cent in 2009 and at the end of 2010 was still projected to be below its 2007 level. However, the experience of less-developed countries has been markedly different. While advanced economies were in recession, output in the emerging and developing economies experienced only a temporary slowdown in growth. In 2009 their combined output increased by 2.5 per cent and is projected to have grown by 7.1 per cent in 2010. Although the recession had a significant impact on the world’s advanced economies, its impact on developing countries was much less pronounced.
Figure 3.3 shows how GDP varied from 2005 in some major country groupings. Again, while the magnitude of change differs across these groups, the timings are very similar, with the nadir of the recession being reached in late 2009. Consistent with the trade data, the recovery in GDP has been weakest in the European Union,
40
30
20
10
0
–10
–20
–30
–40
2008
Q1
2008
Q2
2008
Q3
2008
Q4
2009
Q1
2009
Q2
2009
Q3
2009
Q4
2010
Q1
2010
Q2
2010
Q3
Per
cent
age
chan
ge
North AmericaEuropeAsia

REACTIONS AND ATTITUDES TO GLOBALIZATION AND JOBS 89
CH
AP
TE
R 3
Figure 3.3 Gross domestic product by major economic areas, 2005–11
Note: Data for 2010 and 2011 are forecasts based on information available until the end of 2010.
Source: IMF World Economic Outlook Database (2011).
and strongest in the newly industrialized economies of Asia and Central and Eastern Europe. Declines in output were particularly marked in industries with high exposure to international trade – notably manufactured goods. Many of these countries also recovered quickly when trading conditions returned to normal.
The fall in output by country is detailed in table 3.1. Using OECD data, it shows how far output fell from 2008Q1 to the low point of the recession and how much it recovered by 2010Q3. The countries covered are OECD members and others that are monitored by the OECD. Countries are ordered by growth between 2008Q1 and 2010Q3. Those countries which show a zero in the first column experienced no drop in output and therefore no recession. With the exceptions of Poland and Australia, all of these were developing countries. We also separately show growth rates for China for 2008, 2009 and 2010. Its overall growth in this period exceeds 30 per cent. China experienced only a mild slowdown and then returned to rapid rates of growth. India fell some way behind at 15.6 per cent.
In contrast, output did fall in most OECD countries. Thus, at the other end ofthe spectrum, 2010 output levels in Iceland, Ireland, Hungary and Greece were
10
8
6
4
2
0
–2
–4
–62005 2006 2007 2008 2009 2010 2011
Ann
ual p
erce
ntag
e ch
ange
Central and eastern Europe
Major advanced economies (G7)
European Union
Newly industrialized Asian economies

90 MAKING GLOBALIZATION SOCIALLY SUSTAINABLE
substantially lower than at the beginning of 2008. Confirming the data in figure 3.3, relatively few European countries had recovered to 2008 levels of output by 2010Q3.
3.3 The labour market
The Great Recession was notable for the diversity of its impacts on labour markets in different parts of the globe. While there may have been a Great Synchronization in
Table 3.1 Change in output 2008Q1 to low point of recession, and from 2008Q1 to 2010Q3
Change in output (%) 2008Q1–low point 2008Q1–2010Q3
India 0.0 15.6Indonesia 0.0 13.7Brazil –2.0 8.1Poland 0.0 7.4Korea, Republic of –4.3 5.9Australia 0.0 4.7South Africa –1.1 1.8New Zealand –1.7 1.2Switzerland –2.8 0.8Slovak Republic –4.8 0.8Turkey –12.6 0.4Canada –3.2 0.3Sweden –6.6 0.0United States –4.0 –0.5Belgium –3.7 –0.7Mexico –8.5 –0.9Portugal –3.6 –1.2Czech Republic –4.1 –1.8France –3.9 –1.8Austria –4.8 –1.8Germany –6.6 –1.8Norway –2.6 –2.6Luxembourg –7.9 –2.6Netherlands –5.3 –2.8Denmark –6.7 –3.3Japan –10.1 –3.4United Kingdom –6.5 –3.9Spain –4.9 –4.5Russian Federation –9.9 –5.1Italy –6.8 –5.4Finland –9.7 –5.5Greece –6.8 –6.8Hungary –7.9 –7.2Ireland –11.9 –11.0Iceland –12.1 –11.1
Source: OECD Main Economic Indicators and CIA World Factbook.

REACTIONS AND ATTITUDES TO GLOBALIZATION AND JOBS 91
CH
AP
TE
R 3
the timing of the trade cycle, labour market responses were notable for their diversity in both timing and scale. The ILO (2011) estimates that the world unemployment in 2010 stood at 205 million, equivalent to a global unemployment rate of 6.2 per cent and 27.6 million higher than in 2007. OECD (2011) estimates suggest that between 2008Q1 and 2010Q3 unemployment in the European Union rose by 5.6 million and in the United States by 6.6 million. During this recession, the performance of the labour market in the developed world has been weaker than in developing countries. Although there has been some recovery in output in the developed world, any associated increase in employment has been limited. Thus far, the recovery has been “jobless”.
Table 3.2 sets out recent information on employment, unemployment and the labour force for OECD countries. The numbers largely relate to changes between 2008Q1 (which we take as the starting point of the recession) and 2010Q3. Most OECD countries outside Europe, with the exception of the United States, experienced some employment growth since 2008. In Europe, the picture is less optimistic. For example, in Ireland and Spain, countries both affected by a construction “bubble”, employment fell by 13.3 per cent and 9.1 per cent respectively. In the United States, a very large drop in employment was matched by an almost identical increase in unemployment. But in the United Kingdom, unemployment rose by more than twice the fall in employment, whereas in Japan the increase in unemployment was only around half of the decline in employment. Changes in employment were not necessarily good predictors of changes in unemployment.
Those who are unable to find a job may remain unemployed or leave the labour market temporarily or permanently. In previous recessions, workers have left the labour market in large numbers. The “discouraged worker” effect attenuates increases in unemployment. What is unusual about the current recession is that the workforcehas declined in only a relatively small number of countries.1 This contrasts with, for example, the experience of the 1980s when, in countries like the United Kingdom, there was a substantial rise in inactivity associated with increased unemployment.
In Australia, Canada, Scandinavia, the United Kingdom and the United States the size of the workforce increased over the course of the recession, albeit by relatively small amounts, which is more suggestive of an “added worker” effect. In countries where the recession has had less impact, such as Turkey and Poland, the growth in the workforce has been substantial. This pattern may be reversed if the “jobless” recovery continues, leading to a significant growth in long-term unemployment which may cause workers to drift away from the labour market.
The labour force in Ireland fell by 4.2 per cent over the period, the largest decline in any OECD country. One of the key drivers of this decline has been migration. In the

92 MAKING GLOBALIZATION SOCIALLY SUSTAINABLE
year to April 2009, net emigration from Ireland was 65,000. Most of the outflow comprised returning emigrants from Eastern Europe. The Economic and Social Research Institute, Dublin, has forecast that net emigration from Ireland between 2010 and 2012 will average 2 per cent of the population per annum (Barrett et al., 2010) with an increasing proportion being Irish nationals.
Worker mobility has been an important equilibrating mechanism for the US labour market, but there has been a significant reduction in worker mobility in the United
Table 3.2 Change in employment, unemployment and labour force 2008Q1–2010Q3
Employment Unemployment Labour force
2010Q3 Change % Change 2010Q3 Change % Change % Change
Australia 11,291 534 5.0 591 89 17.8 5.5Austria 4,148 132 3.3 191 16 9.0 3.5Belgium 4,488 39 0.9 424 87 25.8 2.6Canada 17,383 594 3.5 1,543 418 37.1 5.6Czech Republic 4,897 –46 –0.9 374 130 53.0 1.6Denmark 2,726 –83 –3.0 214 114 114.8 1.1Finland 2,479 15 0.6 195 19 11.0 1.3France 2,596 529 25.6 2.6Germany 38,915 576 1.5 2,797 –613 –18.0 –0.1Greece 4,403 –109 –2.4 622 215 53.0 2.2Hungary 3,798 –13 –0.3 466 133 39.9 2.9Iceland 170 –4 –2.2 12 8 178.6 2.1Ireland 1,852 –284 –13.3 294 191 183.8 –4.2Italy 22,789 –382 –1.6 1,864 103 5.8 –1.1Japan 62,860 –303 –0.5 3,360 727 27.6 –1.0Korea, Rep. of 24,120 1,069 4.6 873 72 9.0 4.8Mexico 44,365 1,375 3.2 2,466 695 39.3 4.6Netherlands 8,545 43 0.5 368 94 34.0 1.6New Zealand 2,182 25 1.2 145 49 50.5 3.3Norway 2,500 19 0.8 92 27 41.5 1.7Poland 16,199 684 4.4 1,627 266 19.5 5.6Portugal 4,940 –216 –4.2 609 182 42.7 –0.6Slovak Republic 2,335 –56 –2.4 384 104 37.1 1.8Spain 18,547 –1,856 –9.1 4,575 2,401 110.4 2.4Sweden 4,639 119 2.6 390 89 29.4 4.3Switzerland 4,618 113 2.5 210 48 29.4 3.4Turkey 23,195 3,331 16.8 2,971 294 11.0 16.1United Kingdom 29,244 –193 –0.7 2,545 943 58.9 2.4United States 139,923 –4,832 –3.3 14,679 6,612 82.0 1.2Euro area 141,558 –2,121 –1.5 15,148 3,438 29.4 0.8European Union 217,923 –1,790 –0.8 22,237 5,605 33.7 1.6G7 337,028 –4,360 –1.3 29,383 8,718 42.2 0.9
Source: OECD.
Notes: Numbers and changes are measured in thousands. Data for Mexico, the Netherlands, OECD Europe and OECD total relate to Quarter 2, 2010Q2.

REACTIONS AND ATTITUDES TO GLOBALIZATION AND JOBS 93
CH
AP
TE
R 3
States during the Great Recession. Frey (2009) shows that in 2007–08, migration rates within the United States reached their lowest post-war level. The fall was particularly sharp for long-distance moves. Ferreira et al. (2010) argue that negative home equity and high interest rates have a negative effect on residential mobility. Though worker mobility may help to equilibrate the labour market in some jurisdictions, past experience may not necessarily be a good guide to future migration patterns.
Employers in different countries have responded in a variety of ways to a fall in product demand. This has depended on the nature of employment contracts, human capital investment, the existing policy environment and any changes introduced specifically to combat the recession. Employees’ responses have also depended on the nature of their contracts, joint investment in human capital and on their valuation of the next best alternative to employment.
Elsby et al. (2010) argue that a rapid fall in employment in the United States during 2009 was associated with a surge in productivity, causing a breakdown of Okun’s Law. This outcome is consistent with firms using recessions as an opportunity to enhance efficiency (van Rens, 2004; and Koenders and Rogerson, 2005) but is clearly not consistent with the view that productivity is procyclical. Bauer and Shenk (2009) argue that in eight of the last nine downturns, US productivity fell during downturns due to labour-hoarding behaviour by firms. Reich (2010) suggests that a possible explanation of the very rapid decline in employment is that the willingness of US employers to hoard labour has fallen. During the downturn, employers were shedding workers more rapidly than reducing their output, leading to short-term productivity gains. At the same time, investment was falling, limiting the potential for further productivity growth.
Farber (2007) argues that tenure in private sector jobs in the United States hasbeen falling: fewer workers hold jobs for ten years or more; in 2006, one-fifth of jobs involved tenures of less than a year. If length of tenure is an indicator of firm-specific human capital investment, then one might anticipate a more rapid increase in lay-offs and discharges during downturns. The reductions in tenure may signal some fundamental changes in the skill content of work, perhaps relating to the role of information technology (Autor et al., 2003). Tenure reductions may also be a reflection of firms’ increasing efforts to reduce “slack” (Love and Nohria, 2005).
Most developed countries experienced a less dramatic decline in employment than the United States. One possible explanation is the greater use of the intensive (hours) rather than the extensive (jobs) dimension of labour market adjustment. Bell and Blanchflower (2011a) argue that in the United Kingdom, hour adjustments played an important role in moderating employment reductions. Between January

94 MAKING GLOBALIZATION SOCIALLY SUSTAINABLE
2008 and September 2010, employment in the United Kingdom fell by 1.4 per cent, but aggregate hours fell by 3.2 per cent (source: Office of National Statistics). Part of this change arises from changes in the average hours worked by full-timers. It also stems partly from an increase in the numbers working part time as opposed to full time. Part-time contracts tend to be less stable than full-time contracts. Working fewer hours may also affect eligibility for unemployment benefits.
In those countries that have experienced a substantial inflow to unemployment and low rates of outflow into employment, unemployment durations have increased substantially. The United States has experienced a particularly rapid rise in long-term unemployment. In December 2007, those who had been unemployed for 15 weeks or more comprised 18 per cent of unemployment in the United States. By December 2010, this share had risen to 44 per cent.
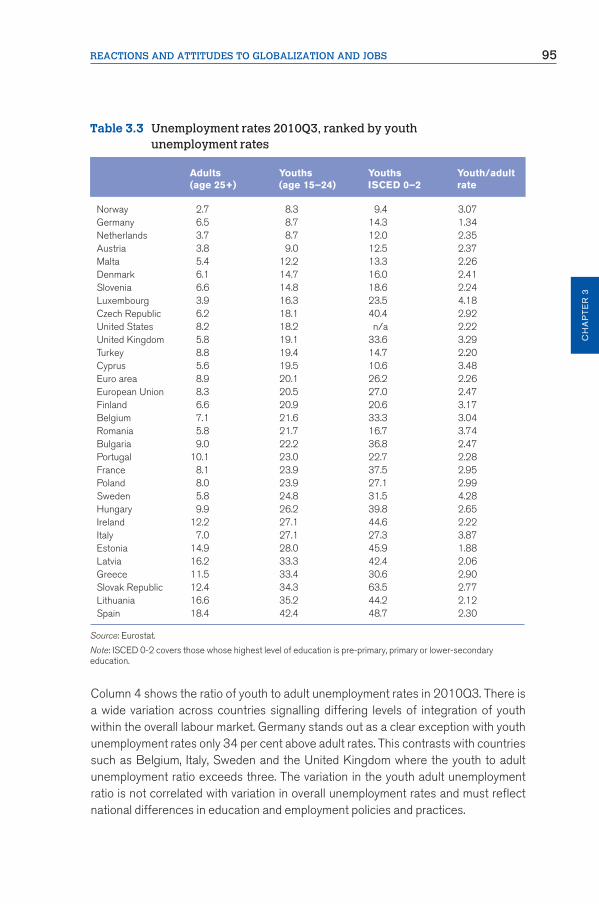
Have increasing rates of long-term unemployment resulted from decreasing rates of outflow from unemployment? Elsby et al. (2010) argue that recent unemployment inflow rates are typical of past recessions. Overall job separation rates changed little during the recession, but unemployment was more a result of lay-offs than from people quitting, and accounted for an increased proportion of these separations and therefore the initial rise in unemployment. However, Elsby et al. argue that a decline in the outflow rate is the main explanation for the rapid rise in long-term unemployment in the United States. Potential causes of the increasing dislocation of the long-term unemployed from the labour market include human capital depreciation and duration-contingent hiring practices on the part of employers. Another key feature of the Great Recession has been how its effects have been distributed across different groups within the population. In previous work (Bell and Blanchflower, 2010a) we have shown that the young, the poorly educated and ethnic minorities have borne a disproportionate share of the increase in unemployment during the Great Recession in developed countries. Table 3.3, which is drawn from harmonized unemployment rates estimated by Eurostat, illustrates the differencesin youth unemployment across a variety of European Union and other countries. European countries that experienced financial crises associated with property bubbles, such as the Baltic States, Ireland, Slovak Republic and Spain have particularly high youth unemployment rates.
Unemployment rates for those whose education did not go beyond lower secondary school (column 3 of table 3.3) tend to be significantly higher than the average and reach a maximum of 63.5 per cent in the Slovak Republic. In most countries there is greater excess supply of labour among the poorly educated although there are some exceptions. Greece is an example where the unemployment rates of recent graduates are above average for their age group.
REACTIONS AND ATTITUDES TO GLOBALIZATION AND JOBS 95
CH
AP
TE
R 3
Column 4 shows the ratio of youth to adult unemployment rates in 2010Q3. There is a wide variation across countries signalling differing levels of integration of youth within the overall labour market. Germany stands out as a clear exception with youth unemployment rates only 34 per cent above adult rates. This contrasts with countries such as Belgium, Italy, Sweden and the United Kingdom where the youth to adult unemployment ratio exceeds three. The variation in the youth adult unemployment ratio is not correlated with variation in overall unemployment rates and must reflect national differences in education and employment policies and practices.
Table 3.3 Unemployment rates 2010Q3, ranked by youth unemployment rates
Adults(age 25+)
Youths(age 15–24)
Youths ISCED 0–2
Youth/adultrate
Norway 2.7 8.3 9.4 3.07Germany 6.5 8.7 14.3 1.34Netherlands 3.7 8.7 12.0 2.35Austria 3.8 9.0 12.5 2.37Malta 5.4 12.2 13.3 2.26Denmark 6.1 14.7 16.0 2.41Slovenia 6.6 14.8 18.6 2.24Luxembourg 3.9 16.3 23.5 4.18Czech Republic 6.2 18.1 40.4 2.92United States 8.2 18.2 n/a 2.22United Kingdom 5.8 19.1 33.6 3.29Turkey 8.8 19.4 14.7 2.20Cyprus 5.6 19.5 10.6 3.48Euro area 8.9 20.1 26.2 2.26European Union 8.3 20.5 27.0 2.47Finland 6.6 20.9 20.6 3.17Belgium 7.1 21.6 33.3 3.04Romania 5.8 21.7 16.7 3.74Bulgaria 9.0 22.2 36.8 2.47Portugal 10.1 23.0 22.7 2.28France 8.1 23.9 37.5 2.95Poland 8.0 23.9 27.1 2.99Sweden 5.8 24.8 31.5 4.28Hungary 9.9 26.2 39.8 2.65Ireland 12.2 27.1 44.6 2.22Italy 7.0 27.1 27.3 3.87Estonia 14.9 28.0 45.9 1.88Latvia 16.2 33.3 42.4 2.06Greece 11.5 33.4 30.6 2.90Slovak Republic 12.4 34.3 63.5 2.77Lithuania 16.6 35.2 44.2 2.12Spain 18.4 42.4 48.7 2.30
Source: Eurostat.
Note: ISCED 0-2 covers those whose highest level of education is pre-primary, primary or lower-secondary education.

96 MAKING GLOBALIZATION SOCIALLY SUSTAINABLE
In Mediterranean countries, an important behavioural response to increased youth unemployment rates is for children to stay longer with their parents. This may lessen the impact of being unemployed (Card and Lemieux, 2000; Chiuri and Del Boca, 2008). Dolado (2010) argues that in Spain the family is the central pillar of the welfare system. Parents and children may have an implicit contract whereby parents provide extended support for their children in return for future care and support when the parents age. This behaviour may partly explain the muted political response to historically high levels of youth unemployment in countries such as Italy and Spain.
There is now widespread acceptance that youth unemployment is an acute policy issue in developed countries. We wish to draw attention to the two further issues that have been less extensively discussed. First, we have argued (Bell and Blanchflower, 2010b) that high levels of youth unemployment at present partly reflect relatively large current youth cohorts. This argument may have some validity for developed countries, where the most recent United Nations (UN) population projections for 2010 suggest that the cohort aged 15–24 is 18 per cent larger than those aged 5–14. Interestingly, in China, the older cohort is 26 per cent larger than thoseaged 5–14, which must in part reflect the Chinese “one child” policy. In other parts of the world, the younger cohorts predominate: among the least developed countries the 5–14 cohort is 20 per cent larger than those aged 15–24. In sub-Saharan Africa that figure increases to 23 per cent. In the world as a whole, the differences between the age groups broadly balance, so that there is no significant difference in the numbers aged 5–14 compared with those aged 15–24.
Despite the growth in the size of the youth cohort, figures from the United Nations Population Database shows that Europe still has the lowest share of its population aged under 25 and this share will probably fall further over the next decade. It is notable that the median age of the population in Egypt is 24 and 29.7 years in Tunisia compared with 44.3 years in Germany; 39.7 years in France; 39.8 in the United Kingdom and 36.8 in the United States.2 Asia and South America have relatively high proportions of young people but their share in the overall population is expected to decline by 2020. In contrast, Africa has more than 60 per cent of its population, aged below 25 and although this share will decline slightly, the absolute number of those aged less than 25 in Africa is projected to increase by 17 per cent between 2010 and 2020. Africa does not have the extensive education and welfare support that is available in the developed world. Unless effective policies are put in place to increase employment among the young, there is a danger of increased political instability as has recently been evidenced in Tunisia and Egypt.
Second, youth unemployment data only partly capture the difficulties that young people are facing in the labour market. Our previous work (Bell and Blanchflower, 2011a) has indicated that young people are more likely to be hours constrained.

REACTIONS AND ATTITUDES TO GLOBALIZATION AND JOBS 97
CH
AP
TE
R 3
We used evidence from the United Kingdom Labour Force Survey, which asks employees whether they would wish to work more, less or the same number of hours. There is a clear contrast in responses by age. Older workers would prefer to work fewer hours, whereas the young express a strong desire to work more hours. In this sense, many of the young people who are employed are contracted to provide fewer hours than they would wish: they are underemployed.
We now establish a further result, which illustrates another aspect of the difficulties that young people face in the recession. We focus on job matches and whether the young have been disproportionately recruited into lower-skilled jobs during the recession. This adds to recent literature on the harmful effects of entering the jobs market during a recession. Kahn (2010) shows that the labour market consequences of graduating from college during a recession have large, negative and persistent effects on wages. Lifetime earnings are substantially lower than they would have been if the graduate had entered the labour market in good times. However, we particularly focus on her finding that cohorts who graduate in worse national economies tend to end up in lower-level occupations.
Giuliano and Spilimbergo (2009) suggest that the period of early adulthood (between 18 and 25) seems to be the age range during which people are more sensitive to macroeconomic conditions. They find that being exposed to a recession before age 17 or after age 25 has no impact on beliefs about life chances. However, youngsters growing up during recessions tend to believe that success in life depends more on luck than on effort; they support more government redistribution, but have less confidence in public institutions. Recessions seem to affect youngsters’ beliefs adversely.
Specifically, we investigate whether job matches according to skill level change during a recession, particularly for the young. In particular, we model whether the young accept jobs that require lower skill levels during a recession. We use quarterly data from the United Kingdom Labour Force Survey (LFS) for the period from 2005Q1 to 2010Q2, a time period which encompasses the Great Recession. The LFS occupational classification (SOC, 2000) divides employment into four main skill groups – level IV (corporate managers and professionals), level III (associative professionals and skilled workers), level II (administrative and service occupations), level I (elementary trades and service occupations). We use this four-way classification of skill as the dependent variable in an ordered logit model, which includes individual characteristics as controls as well as time dummies, which capture whether the skill level of matches, conditional on individual characteristics, is changing through time. Skill levels are numbered from one (least skilled) to four (most skilled). A positive coefficient on a variable therefore implies that it is associated with higher levels of skill.

98 MAKING GLOBALIZATION SOCIALLY SUSTAINABLE
We divide the sample by age group, 16–24, 25–49 and 50+ and use gender, qualifications, region and ethnicity as controls. Quarterly time dummies are included to determine whether, conditional on their characteristics, individuals find a job match at a higher or lower skill level during a period of recession. Our results in table 3.4 show that the young were more prone than other age groups to accept lower-skilled jobs during the Great Recession. Education, ethnicity and gender are also important influences on the skill level associated with job matches. As might be expected, more education, being white and male are each associated with higher skilled occupations. However, our main result is that the trend in the time dummies since 2008 has been negative for all age groups, indicating that workers were accepting lower-skilled jobs in 2010 than in 2005, conditional on their characteristics. Figure 3.4 shows this result by plotting the full set of time dummies from 2005 to 2010. A downward trend occurs for all age groups, implying that workers of all ages are accepting lower-skilled jobs than they might have previously when the labour market was more robust, but the effect is strongest for those aged 16–24. If the state of the labour market
Table 3.4 Skills demand and the recession: Ordered logit results (OLS)
Ages 16–24 Ages 25–49 Ages 50+
Gender –0.463 (45.1) –0.833 (113.6) –0.849 (181.0)First degree –1.548 (30.7) –0.736 (37.99) –0.882 (82.36)HNC/HND equivalent –2.411 (44.9) –1.501 (79.23) –1.734 (151.7)NVQ Level 3 –2.967 (60.3) –2.395 (129.1) –2.408 (222.9)Trade apprenticeship –2.064 (36.8) –2.775 (139.9) –2.591 (189.6)O–level or equivalent –3.212 (65.2) –2.983 (161.5) –3.004 (280.8)Other qualifications –3.541 (68.4) –3.546 (186.0) –3.411 (287.8)No qualifications –3.867 (73.2) –3.860 (201.9) –3.786 (289.3)2008Q1 –0.020 (0.58) –0.052 (2.11) –0.021 (1.31)2008Q2 –0.021 (0.61) –0.034 (1.40) –0.023 (1.44)2008Q3 –0.048 (1.37) –0.024 (0.96) –0.013 (0.80)2008Q4 –0.057 (1.63) –0.036 (1.46) –0.017 (1.09)2009Q1 –0.002 (0.06) –0.051 (2.07) –0.023 (1.45)2009Q2 –0.054 (1.49) –0.061 (2.46) –0.034 (2.13)2009Q3 –0.084 (2.31) –0.067 (2.7) –0.044 (2.71)2009Q4 –0.097 (2.67) –0.087 (3.51) –0.057 (3.51)2010Q1 –0.113 (3.09) –0.085 (3.44) –0.064 (3.92)2010Q2 –0.127 (3.48) –0.081 (3.28) –0.072 (4.47) cut1 –5.020 –6.103 –6.126cut2 –2.684 –3.761 –3.794cut3 –0.780 –2.169 –2.146N 141,232 310,893 717,591 LR chi2 18,311 115,505 240,500Pseudo R2 0.054 0.141 0.129
Source: UK Labour Force Surveys 2005–2010.
Notes: HNC and HND are college-level qualifications approximately equivalent to associate degrees in the United States. Omitted categories – males, higher degree, whites, north-east of England and 2005Q1. Only the time dummies from 2008Q1 to 2010Q2 are shown. The values of the full sets of time dummies are shown in figure 3.4.

REACTIONS AND ATTITUDES TO GLOBALIZATION AND JOBS 99
CH
AP
TE
R 3
Figure 3.4 Time dummies by age group in skills regression, 2005–10
causes better qualified applicants to accept lower-skilled jobs, there are two important consequences. First, the difficulties of unqualified job applicants increase since they find themselves in direct competition with the better qualified. Second, following Kahn’s argument, if young people accept a lower-skilled job initially, there may be long-lasting negative effects on their labour market experience.
Combined with our previous work, this result leads us to the conclusion thatthe Great Recession has particularly affected the young through: (a) higher unemployment rates, (b) higher levels of underemployment and (c) increased willingness to accept lower-quality jobs. In recent work (Bell and Blanchflower, 2011b), we have discussed the issue of the “scarring” effects of youth unemployment. Scarring means that adverse labour market experiences when young lead to further negative market outcomes well into the future. The evidence for such scarring relies largely on cohort studies where youth unemployment is used to identify those at risk of later adverse labour market outcomes. Youth unemployment episodes are used as the marker to identify subsequent scarring. As far as we are
0.02
0
–0.02
–0.04
–0.06
–0.08
–0.10
–0.12
–0.14
2005
Q2
2005
Q3
2005
Q4
2006
Q1
2006
Q2
2006
Q3
2006
Q4
2007
Q1
2007
Q2
2007
Q3
2007
Q4
2008
Q1
2008
Q2
2008
Q3
2008
Q4
2009
Q1
2009
Q2
2009
Q3
2009
Q4
2010
Q1
2010
Q2
Age 16-24
Age 25-49
Age 50+

100 MAKING GLOBALIZATION SOCIALLY SUSTAINABLE
aware, no research has tested alternatives such as underemployment or suboptimal job matches when young to identify later scarring effects.
3.4 Happiness and attitudes to employment and globalization
In this section we examine how attitudes have changed during the financial crisis. It is rather early in the crisis to determine the impact of the recession. One way is to see how individuals’ attitudes have changed and how that varies across countries.3 To do so we make use of micro data at the level of the individual across the EU27 plus Croatia, Iceland, the Former Yugoslav Republic of Macedonia and Turkish Cyprus. These data are taken from two Eurobarometer Surveys conducted for the European Commission, No. 68.1 from September to October 2007 and No. 73.4 conducted in May 2010.
Comparable questions are available in both surveys on life satisfaction, employment and expectations for jobs over the following twelve months. In 2010 a special component was also included on the crisis itself and individuals reported on whether they thought the crisis was over and whether they favoured public intervention to create jobs. Finally, we examine evidence on individuals’ views on the impact of globalization, on a number of outcomes including growth, inequality, prices plus its impact on citizens compared to large corporations.
What we find is that happiness and well-being has held up reasonably well to this point, but has dipped sharply in several countries including Greece. We further find evidence that the unemployed are especially unhappy and that shows no sign of improving. Over time the unemployed are becoming less optimistic about the employment situation in their country. They are especially likely to report that they expect the crisis to worsen, and unsurprisingly want the government to create jobs.
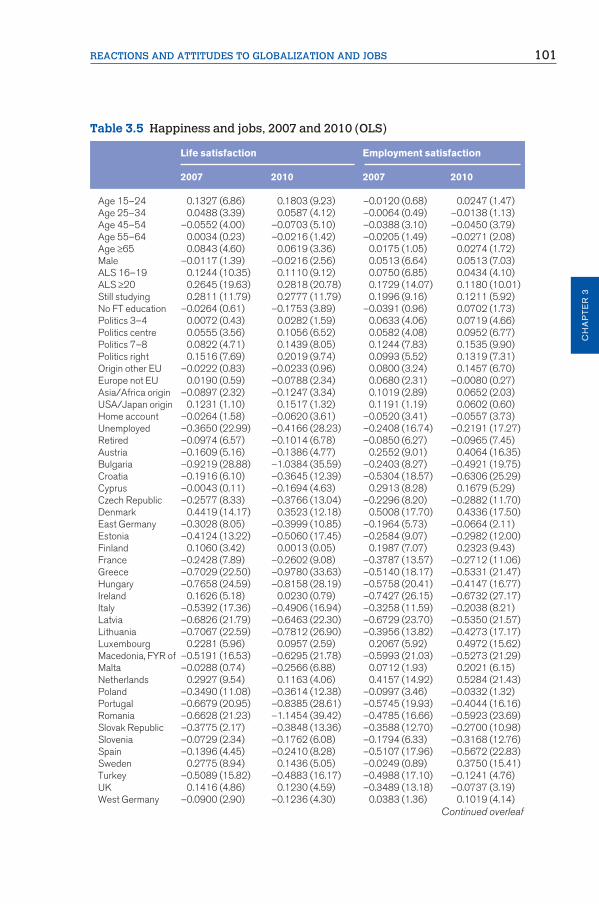
In table 3.5 we report the results of estimating a life satisfaction or happiness equation for both 2007 and 2010 (see Blanchflower and Oswald, 2004, 2011). The responses are ordered and are coded 1–4 as described in the notes to the table.The appropriate estimation procedure here is ordered logit but for ease of exposition we make use of Ordinary Least Squares (OLS). Fortunately results are broadly similar whichever procedure is used.
Happiness levels in Portugal, Spain and especially Greece have fallen sharply as well as in Latvia and Lithuania that have also seen big increases in unemployment. This is true both in the mean scores reported at the end of table 3.5 and in the regressions. The coefficient on the Irish dummy declined between 2007 and 2010 although the
REACTIONS AND ATTITUDES TO GLOBALIZATION AND JOBS 101
CH
AP
TE
R 3
Table 3.5 Happiness and jobs, 2007 and 2010 (OLS)
Life satisfaction Employment satisfaction
2007 2010 2007 2010
Age 15–24 0.1327 (6.86) 0.1803 (9.23) –0.0120 (0.68) 0.0247 (1.47)Age 25–34 0.0488 (3.39) 0.0587 (4.12) –0.0064 (0.49) –0.0138 (1.13)Age 45–54 –0.0552 (4.00) –0.0703 (5.10) –0.0388 (3.10) –0.0450 (3.79)Age 55–64 0.0034 (0.23) –0.0216 (1.42) –0.0205 (1.49) –0.0271 (2.08)Age ≥65 0.0843 (4.60) 0.0619 (3.36) 0.0175 (1.05) 0.0274 (1.72)Male –0.0117 (1.39) –0.0216 (2.56) 0.0513 (6.64) 0.0513 (7.03)ALS 16–19 0.1244 (10.35) 0.1110 (9.12) 0.0750 (6.85) 0.0434 (4.10)ALS ≥20 0.2645 (19.63) 0.2818 (20.78) 0.1729 (14.07) 0.1180 (10.01)Still studying 0.2811 (11.79) 0.2777 (11.79) 0.1996 (9.16) 0.1211 (5.92)No FT education –0.0264 (0.61) –0.1753 (3.89) –0.0391 (0.96) 0.0702 (1.73)Politics 3–4 0.0072 (0.43) 0.0282 (1.59) 0.0633 (4.06) 0.0719 (4.66)Politics centre 0.0555 (3.56) 0.1056 (6.52) 0.0582 (4.08) 0.0952 (6.77)Politics 7–8 0.0822 (4.71) 0.1439 (8.05) 0.1244 (7.83) 0.1535 (9.90)Politics right 0.1516 (7.69) 0.2019 (9.74) 0.0993 (5.52) 0.1319 (7.31)Origin other EU –0.0222 (0.83) –0.0233 (0.96) 0.0800 (3.24) 0.1457 (6.70)Europe not EU 0.0190 (0.59) –0.0788 (2.34) 0.0680 (2.31) –0.0080 (0.27)Asia/Africa origin –0.0897 (2.32) –0.1247 (3.34) 0.1019 (2.89) 0.0652 (2.03)USA/Japan origin 0.1231 (1.10) 0.1517 (1.32) 0.1191 (1.19) 0.0602 (0.60)Home account –0.0264 (1.58) –0.0620 (3.61) –0.0520 (3.41) –0.0557 (3.73)Unemployed –0.3650 (22.99) –0.4166 (28.23) –0.2408 (16.74) –0.2191 (17.27)Retired –0.0974 (6.57) –0.1014 (6.78) –0.0850 (6.27) –0.0965 (7.45)Austria –0.1609 (5.16) –0.1386 (4.77) 0.2552 (9.01) 0.4064 (16.35)Bulgaria –0.9219 (28.88) –1.0384 (35.59) –0.2403 (8.27) –0.4921 (19.75)Croatia –0.1916 (6.10) –0.3645 (12.39) –0.5304 (18.57) –0.6306 (25.29)Cyprus –0.0043 (0.11) –0.1694 (4.63) 0.2913 (8.28) 0.1679 (5.29)Czech Republic –0.2577 (8.33) –0.3766 (13.04) –0.2296 (8.20) –0.2882 (11.70)Denmark 0.4419 (14.17) 0.3523 (12.18) 0.5008 (17.70) 0.4336 (17.50)East Germany –0.3028 (8.05) –0.3999 (10.85) –0.1964 (5.73) –0.0664 (2.11)Estonia –0.4124 (13.22) –0.5060 (17.45) –0.2584 (9.07) –0.2982 (12.00)Finland 0.1060 (3.42) 0.0013 (0.05) 0.1987 (7.07) 0.2323 (9.43)France –0.2428 (7.89) –0.2602 (9.08) –0.3787 (13.57) –0.2712 (11.06)Greece –0.7029 (22.50) –0.9780 (33.63) –0.5140 (18.17) –0.5331 (21.47)Hungary –0.7658 (24.59) –0.8158 (28.19) –0.5758 (20.41) –0.4147 (16.77)Ireland 0.1626 (5.18) 0.0230 (0.79) –0.7427 (26.15) –0.6732 (27.17)Italy –0.5392 (17.36) –0.4906 (16.94) –0.3258 (11.59) –0.2038 (8.21)Latvia –0.6826 (21.79) –0.6463 (22.30) –0.6729 (23.70) –0.5350 (21.57)Lithuania –0.7067 (22.59) –0.7812 (26.90) –0.3956 (13.82) –0.4273 (17.17)Luxembourg 0.2281 (5.96) 0.0957 (2.59) 0.2067 (5.92) 0.4972 (15.62)Macedonia, FYR of –0.5191 (16.53) –0.6295 (21.78) –0.5993 (21.03) –0.5273 (21.29)Malta –0.0288 (0.74) –0.2566 (6.88) 0.0712 (1.93) 0.2021 (6.15)Netherlands 0.2927 (9.54) 0.1163 (4.06) 0.4157 (14.92) 0.5284 (21.43)Poland –0.3490 (11.08) –0.3614 (12.38) –0.0997 (3.46) –0.0332 (1.32)Portugal –0.6679 (20.95) –0.8385 (28.61) –0.5745 (19.93) –0.4044 (16.16)Romania –0.6628 (21.23) –1.1454 (39.42) –0.4785 (16.66) –0.5923 (23.69)Slovak Republic –0.3775 (2.17) –0.3848 (13.36) –0.3588 (12.70) –0.2700 (10.98)Slovenia –0.0729 (2.34) –0.1762 (6.08) –0.1794 (6.33) –0.3168 (12.76)Spain –0.1396 (4.45) –0.2410 (8.28) –0.5107 (17.96) –0.5672 (22.83)Sweden 0.2775 (8.94) 0.1436 (5.05) –0.0249 (0.89) 0.3750 (15.41)Turkey –0.5089 (15.82) –0.4883 (16.17) –0.4988 (17.10) –0.1241 (4.76)UK 0.1416 (4.86) 0.1230 (4.59) –0.3489 (13.18) –0.0737 (3.19)West Germany –0.0900 (2.90) –0.1236 (4.30) 0.0383 (1.36) 0.1019 (4.14)
Continued overleaf

102 MAKING GLOBALIZATION SOCIALLY SUSTAINABLE
mean score did not decline. One puzzle is the jump in the happiness levels in the United Kingdom, which was 2.91 in 2007 and 3.32 in 2010. It does seem, however, that this growth in happiness is unlikely to be sustained. The date of the 2010 survey was in May, exactly at the time of the General Election when a new coalition government was formed. Since that time business and consumer confidence has
Table 3.5 Continued
Life satisfaction Employment satisfaction
2007 2010 2007 2010
Constant 2.9592 3.0531 1.9694 1.8385N 29,517 30,580 28,939 29,659Adjusted R2 0.2671 0.2911 0.2624 0.2948
Source: Eurobarometers No. 68.1, September–October 2007 and No. 73.4, May 2010. (Regarding country denominations, see endnote 3.)
Notes: excluded categories, employed; Belgium; age left school (ALS) <16; age 35–44; politics – left; and origin “in our country”. Asia and Africa also includes Latin America. USA/Japan means North America and also includes Oceania. T-statistics in parentheses.
Question 1. On the whole, are you: not at all satisfied (=1), not very satisfied (=2), fairly satisfied (=3) or very satisfied (= 4) with the life you lead?
Question 2. How would you judge the current situation in each of the following? The employment situation in (our country): very bad (= 1), rather bad (= 2), rather good (= 3) and very good (= 4).
Life satisfaction scores 2010 2007 Change
Greece 2.24 2.68 –0.44Romania 2.08 2.39 –0.31Lithuania 2.44 2.63 –0.19Portugal 2.29 2.47 –0.18Spain 2.90 3.07 –0.17Turkey 2.70 2.87 –0.17Latvia 2.59 2.68 –0.09Malta 2.93 3.02 –0.09Italy 2.72 2.79 –0.07Slovenia 3.04 3.10 –0.06Turkish Cyprus 2.76 2.82 –0.06Belgium 3.13 3.18 –0.05Czech Republic 2.86 2.91 –0.05Macedonia, FYR of 2.49 2.54 –0.05Luxembourg 3.36 3.39 –0.03Estonia 2.77 2.80 –0.03Netherlands 3.41 3.44 –0.03Austria 3.07 3.07 0.00Croatia 2.81 2.81 0.00Hungary 2.38 2.38 0.00France 2.98 2.97 0.01Cyprus 3.06 3.05 0.01Denmark 3.66 3.65 0.01Bulgaria 2.17 2.15 0.02Poland 2.88 2.85 0.03Ireland 3.24 3.21 0.03East Germany 2.75 2.70 0.05Finland 3.30 3.25 0.05West Germany 3.10 3.05 0.05Sweden 3.44 3.38 0.06United Kingdom 3.32 3.22 0.10Slovak Republic 2.85 2.74 0.11
REACTIONS AND ATTITUDES TO GLOBALIZATION AND JOBS 103
CH
AP
TE
R 3
collapsed, as have house prices, with the implementation of an austerity budget cutting public spending and raising taxes.
The results in table 3.5 are standard in that happiness is U-shaped in age (Blanchflower and Oswald, 2008a), rises with the level of education and is higher among right-wingers than left-wingers. Unemployment lowers happiness. In cross-sectional analysis, the French, Greeks, Italians, Portuguese and particularly the East Europeans are unhappy while Scandinavians are the happiest. This may to some extent reflect cultural differences, but recent evidence linking measures of self-reported well-being to objective health measurement suggests that it is not cultural differences alone that explain international differences in reported well-being (Blanchflower and Oswald, 2008b). Comparing the first two columns a number of findings stand out.
1. The unemployed have lower levels of happiness compared to the employed in 2010 than they did in 2007.
2. Happiness levels of non-natives have fallen over time.3. There was a big drop in the happiness levels of the least educated.4. Based on the change in the coefficients, there is a noticeable decline in the
happiness levels in Greece (−0.28), Ireland (−0.14), Portugal (−0.17) and Spain (−0.10), which have been hard hit by recession and the sovereign debt crisis.
In columns 3 and 4 we model individuals’ views on the “employment situation”, which has clearly deteriorated over this period. Of particular note here is that residents of Austria, the Netherlands and West Germany had seen a relative improvement in their position. In both periods the Irish are especially gloomy about the job situation.
In Table 3.6 columns 1 and 2, we now look at individuals’ views about what they expect to happen to employment over the next twelve months in 2007 and 2010. It should be noted that young people are especially optimistic as are right-wingers and those with more education. By 2010 the unemployed are becoming significantly less optimistic than the employed. Expectations were much lower, measured by a change in the country rankings, in France, Greece, Italy, Portugal and Spain. It is notable how the Swedes have jumped up the rankings, where despite the big drop in output, employment has risen. Residents in the United Kingdom were also more optimistic in 2010 than in 2007 and jumped up the rankings.
Column 3 estimates the probability of reporting that the worst of the jobs crisis is yet to come. The estimation technique is probit. The results reported are estimated marginal effects. Men, the optimistic young, right-wingers and the most educatedare less likely to agree. The unemployed are more pessimistic. The Danes and the Swedes believe it is all over bar the shouting. The Greeks, the Irish and especially the Portuguese believe the crisis still has legs.

104 MAKING GLOBALIZATION SOCIALLY SUSTAINABLE
Table 3.6 Expectations for jobs and public role in creating jobs, 2007 and 2010 (OLS)
Expectations for employment Job crisis to Create jobs worsen 2007 2010 2010 2007
Age 15–24 0.1641 (8.82) 0.0929 (4.45) –0.0579 (4.01) 0.1261 (4.77) Age 25–34 0.0766 (5.55) 0.0647 (4.24) –0.0256 (2.43) 0.0505 (2.66) Age 45–54 –0.0332 (2.51) –0.0669 (4.55) 0.0198 (1.96) 0.0265 (1.45) Age 55–64 –0.0576 (3.95) –0.0686 (4.24) 0.0225 (2.01) 0.0367 (1.81) Age ≥65 –0.0192 (1.09) –0.0469 (2.37) –0.0056 (0.42) 0.0566 (2.26) Male –0.0151 (1.86) 0.0298 (3.30) –0.0242 (3.89) –0.0232 (2.06) ALS 16–19 0.0227 (1.95) 0.0076 (0.58) –0.0408 (4.43) –0.0155 (0.92) ALS ≥20 0.0059 (0.45) 0.0801 (5.47) –0.0968 (9.47) –0.0687 (3.74) Still studying 0.0854 (3.70) 0.1096 (4.32) –0.0872 (4.96) –0.0634 (1.99) No FT education 0.0645 (1.49) 0.0197 (0.39) 0.0150 (0.43) –0.0188 (0.27) Politics 3–4 0.0257 (1.57) 0.0651 (3.40) –0.0583 (4.36) –0.0711 (3.02) Politics centre 0.0356 (2.37) 0.0821 (4.71) –0.0877 (7.22) –0.0749 (3.50) Politics 7–8 0.0392 (2.35) 0.1451 (7.55) –0.1258 (9.38) –0.0826 (3.51) Politics right 0.0957 (5.03) 0.1542 (6.90) –0.1267 (8.16) –0.0264 (0.97) Origin other EU 0.0585 (2.25) 0.1240 (4.59) –0.0486 (2.67) 0.0477 (1.49) Europe not EU 0.0357 (1.15) 0.0299 (0.82) 0.0238 (0.97) 0.2660 (5.83) Asia/Africa origin 0.1717 (4.61) 0.0136 (0.34) –0.0412 (1.51) 0.1168 (2.36) USA/Japan origin –0.0478 (0.46) 0.1752 (1.44) –0.0981 (1.10) 0.1936 (1.22) Home account 0.0344 (2.12) –0.0358 (1.92) 0.0169 (1.31) –0.0157 (0.65) Unemployed 0.0242 (1.59) –0.0419 (2.67) 0.0844 (7.83) 0.0718 (3.59) Retired 0.0138 (0.97) –0.0086 (0.54) 0.0267 (2.42) –0.0261 (1.30) Austria 0.1263 (4.23) 0.1209 (3.94) –0.0540 (2.53) 0.1338 (3.58) Bulgaria 0.0577 (1.88) 0.0098 (0.31) –0.1789 (7.87) 0.1513 (3.48) Croatia –0.0287 (0.96) –0.2413 (7.84) 0.0356 (1.70) 0.2471 (6.51) Cyprus –0.1010 (2.71) –0.3817 (9.56) 0.1650 (6.38) 0.0757 (1.56) Czech Republic –0.1135 (3.86) –0.1386 (4.57) –0.0583 (2.81) 0.1199 (3.23) Denmark –0.0473 (1.60) 0.4141 (13.62) –0.1706 (8.11) 0.2575 (6.99) East Germany –0.0459 (1.27) –0.1988 (5.09) 0.1489 (5.59) –0.1595 (3.35) Estonia –0.0413 (1.38) 0.3689 (12.04) –0.1800 (8.57) –0.0289 (0.74) Finland –0.0111 (0.38) 0.1832 (6.06) –0.0477 (2.31) 0.2642 (7.13) France 0.1312 (4.47) –0.0975 (3.21) 0.1031 (5.08) –0.2077 (5.49) Greece –0.0786 (2.65) –0.5333 (17.48) 0.1811 (9.00) –0.2542 (6.80) Hungary –0.1152 (3.89) 0.1725 (5.66) –0.2113 (9.99) –0.0313 (0.84) Ireland –0.2512 (8.39) –0.1364 (4.46) 0.0501 (2.42) 0.3656 (9.30) Italy 0.1748 (5.88) –0.0830 (2.71) –0.0614 (2.86) –0.0564 (1.44) Latvia –0.0574 (1.91) 0.1248 (4.07) –0.0034 (0.16) –0.2309 (6.04) Lithuania –0.1737 (5.78) –0.1423 (4.61) 0.0522 (2.52) 0.2936 (7.65) Luxembourg –0.0058 (0.16) –0.2922 (7.46) 0.1659 (6.51) 0.1510 (3.17) Macedonia, FYR of 0.2362 (7.87) –0.1000 (3.28) –0.0949 (4.49) 0.5913 (15.24)Malta 0.1767 (4.41) 0.1975 (4.71) –0.1350 (4.80) –0.0508 (0.99) Netherlands –0.1834 (6.28) 0.1200 (3.96) –0.0299 (1.45) –0.2115 (5.72) Poland 0.1107 (3.66) 0.0476 (1.53) –0.0820 (3.78) 0.2080 (5.34) Portugal –0.1460 (4.77) –0.2940 (9.47) 0.1445 (6.93) 0.0337 (0.84) Romania 0.0707 (2.34) –0.4208 (13.61) 0.1760 (8.49) 0.3495 (8.59) Slovak Republic –0.1425 (4.80) –0.0488 (1.61) –0.1064 (5.09) 0.3948 (10.57)Slovenia 0.0653 (2.19) –0.1499 (4.90) 0.0345 (1.67) –0.1599 (4.30) Spain 0.1396 (4.64) 0.0194 (0.63) 0.0032 (0.15) 0.0045 (0.12) Sweden 0.1257 (4.25) 0.6434 (21.48) –0.2109 (10.24) 0.2917 (8.05) Turkey 0.1388 (4.48) –0.0771 (2.37) 0.0277 (1.25) –0.0484 (1.18) UK –0.0216 (0.78) 0.1069 (3.75) 0.0215 (1.12) 0.2064 (5.92)
REACTIONS AND ATTITUDES TO GLOBALIZATION AND JOBS 105
CH
AP
TE
R 3
In column 4 we model whether the individual believes that it is the job of the public sector to create jobs in the midst of a financial crisis. Unsurprisingly, the unemployed, the young, the least educated and left-wingers hold this view most strongly. Residents of the corporatist countries of Denmark, Finland and Sweden along with the Irish hold this view. Interestingly, residents of the United Kindom hold this view even though their government is about to embark on a strategy of firing large numbers of public sector workers.
The globalization of markets clearly played some part in the transmission of the recession. Has this experience turned the citizens in advanced economies against globalization? We provide some new evidence from Europe to provide at least a partial answer to this question. Using data from two Eurobarometer Surveys No. 69.2 for March–May 2008 and No. 73.4 for May 2010, we investigate how representative samples of citizens from European Union (EU) countries responded to four questions on globalization in 2010. The questions asked citizens for their views about whether globalization (a) increased growth, (b) increased social inequality, (c) reduced inflation and (d) only benefited large companies and not citizens. It should be noted that there are small differences in the labelling of the responses, but in both cases answers are coded from one to four. Details are at the bottom of the tables.
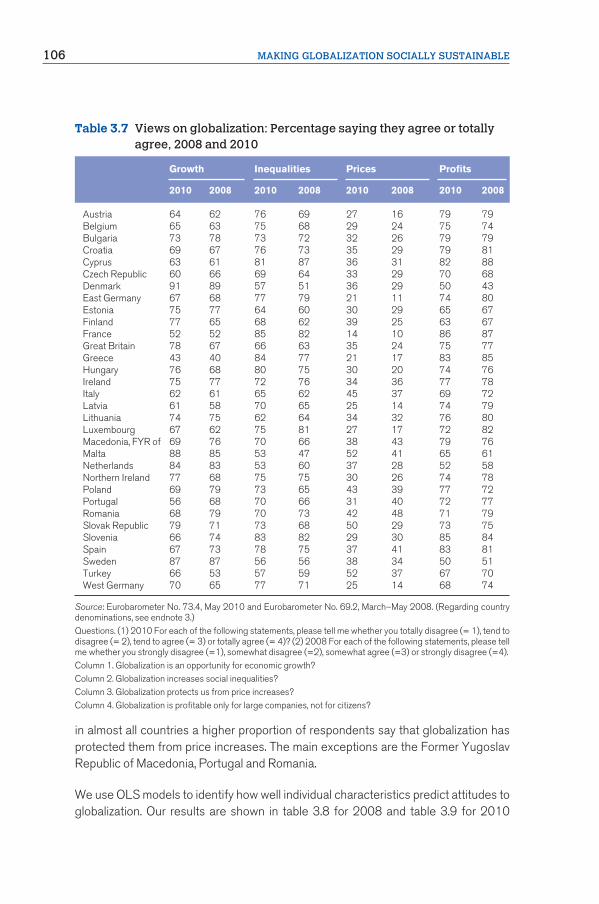
Table 3.7 reports the percentage of respondents who agree or totally agree in 2010 or who strongly agree or somewhat agree in 2008 for each of the four attitudes to globalization measures. In 2010 support for the proposition that globalization improves growth is highest in Denmark (91 per cent), the Netherlands (84 per cent) and Sweden (87 per cent) but is especially low in France (52 per cent), Greece(43 per cent) and Portugal (56 per cent). The vast majority of respondents believe globalization increases inequality and raises company profits, but do not believe it increases prices. The patterns are broadly similar in 2008. The one difference is that
West Germany 0.0190 (0.64) –0.0128 (0.42) 0.0583 (2.81) –0.2708 (7.32)
Constant 1.3660 1.7551 — 2.628N 28,335 28,872 28,360 25,418Adjusted/Pseudo R2 0.0491 0.1185 0.0569 0.0627
Source: Eurobarometers No. 68.1, September–October 2007 and No. 73.4, May 2010. (Regarding country denominations, see endnote 3.)
Notes: excluded categories: employed; Belgium; age left school (ALS) <16; age 35–44; politics – left; and origin “in our country”. Asia and Africa also includes Latin America. USA/Japan means North America and also includes Oceania. Column 3 estimated as a probit. T-statistics in parentheses.
Question 1. What are your expectations for the next twelve months: will the next twelve months be worse (=1), the same (= 2) or better (= 3), when it comes to . . . the employment situation in (our country)?
Question 2. Some analysts say that the impact of the economic crisis on the job market has already reached its peak and things will recover little by little. Others, on the contrary, say that the worst is still to come. Which of the two statements is closer to your opinion? “The impact of the crisis on jobs has already reached its peak” (= 0) or “the worst is still to come” (=1).
Question 3. In an international financial and economic crisis, it is necessary to increase public deficits to create jobs: totally disagree (=1); tend to disagree (= 2); tend to agree (= 3); totally agree (= 4).
106 MAKING GLOBALIZATION SOCIALLY SUSTAINABLE
in almost all countries a higher proportion of respondents say that globalization has protected them from price increases. The main exceptions are the Former Yugoslav Republic of Macedonia, Portugal and Romania.
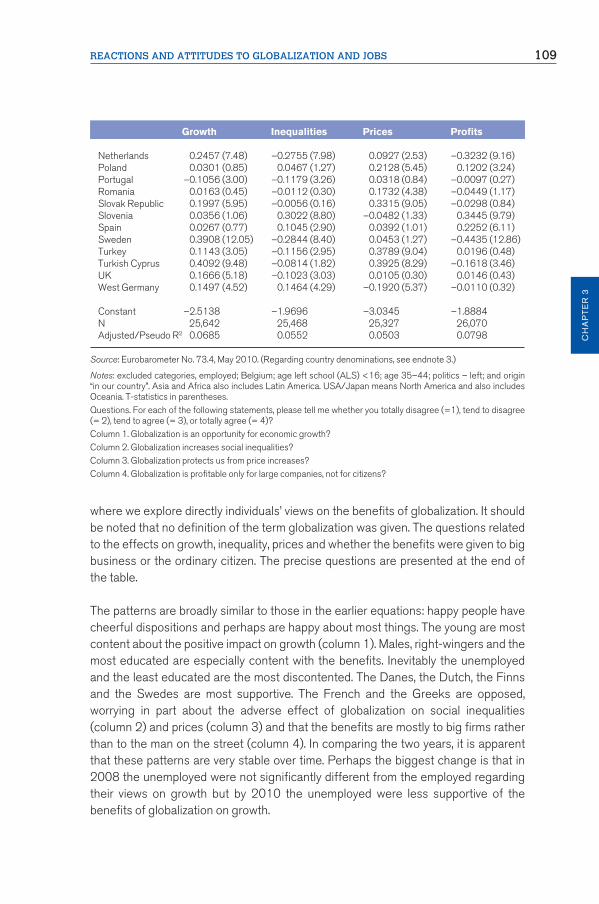
We use OLS models to identify how well individual characteristics predict attitudes to globalization. Our results are shown in table 3.8 for 2008 and table 3.9 for 2010
Table 3.7 Views on globalization: Percentage saying they agree or totally agree, 2008 and 2010
Growth Inequalities Prices Profits
2010 2008 2010 2008 2010 2008 2010 2008
Austria 64 62 76 69 27 16 79 79Belgium 65 63 75 68 29 24 75 74Bulgaria 73 78 73 72 32 26 79 79Croatia 69 67 76 73 35 29 79 81Cyprus 63 61 81 87 36 31 82 88Czech Republic 60 66 69 64 33 29 70 68Denmark 91 89 57 51 36 29 50 43East Germany 67 68 77 79 21 11 74 80Estonia 75 77 64 60 30 29 65 67Finland 77 65 68 62 39 25 63 67France 52 52 85 82 14 10 86 87Great Britain 78 67 66 63 35 24 75 77Greece 43 40 84 77 21 17 83 85Hungary 76 68 80 75 30 20 74 76Ireland 75 77 72 76 34 36 77 78Italy 62 61 65 62 45 37 69 72Latvia 61 58 70 65 25 14 74 79Lithuania 74 75 62 64 34 32 76 80Luxembourg 67 62 75 81 27 17 72 82Macedonia, FYR of 69 76 70 66 38 43 79 76Malta 88 85 53 47 52 41 65 61Netherlands 84 83 53 60 37 28 52 58Northern Ireland 77 68 75 75 30 26 74 78Poland 69 79 73 65 43 39 77 72Portugal 56 68 70 66 31 40 72 77Romania 68 79 70 73 42 48 71 79Slovak Republic 79 71 73 68 50 29 73 75Slovenia 66 74 83 82 29 30 85 84Spain 67 73 78 75 37 41 83 81Sweden 87 87 56 56 38 34 50 51Turkey 66 53 57 59 52 37 67 70West Germany 70 65 77 71 25 14 68 74
Source: Eurobarometer No. 73.4, May 2010 and Eurobarometer No. 69.2, March–May 2008. (Regarding country denominations, see endnote 3.)Questions. (1) 2010 For each of the following statements, please tell me whether you totally disagree (= 1), tend to disagree (= 2), tend to agree (= 3) or totally agree (= 4)? (2) 2008 For each of the following statements, please tell me whether you strongly disagree (=1), somewhat disagree (=2), somewhat agree (=3) or strongly disagree (=4).Column 1. Globalization is an opportunity for economic growth?Column 2. Globalization increases social inequalities?Column 3. Globalization protects us from price increases?Column 4. Globalization is profitable only for large companies, not for citizens?

REACTIONS AND ATTITUDES TO GLOBALIZATION AND JOBS 107
CH
AP
TE
R 3
Table 3.8 Views on globalization, 2008 (OLS)
Growth Inequalities Prices Profits
Age 15–24 0.0889 (3.21) –0.1358 (4.67) 0.0742 (2.52) –0.0720 (2.49)Age 25–34 0.0395 (2.03) –0.0425 (2.07) 0.0518 (2.52) –0.0346 (1.71)Age 45–54 –0.0209 (1.13) 0.0105 (0.55) –0.0099 (0.51) 0.0517 (2.69)Age 55–64 –0.0251 (1.22) 0.0089 (0.41) –0.0512 (2.36) 0.0821 (3.83)Age ≥65 0.0087 (0.34) –0.0154 (0.57) –0.0058 (0.22) 0.0664 (2.49)Male 0.0470 (4.09) –0.0045 (0.38) 0.0301 (2.48) –0.0223 (1.87)ALS 16–19 0.0432 (2.55) –0.0031 (0.18) 0.0335 (1.90) –0.0293 (1.68)ALS ≥20 0.1191 (6.46) 0.0058 (0.30) 0.0691 (3.57) –0.1323 (6.92)Still studying 0.1933 (5.75) 0.0515 (1.46) 0.1167 (3.26) –0.1728 (4.90)No FT education –0.0836 (0.65) 0.2797 (1.92) 0.0891 (0.62) –0.1468 (1.06)Politics (3–4) 0.0630 (2.95) –0.0338 (1.52) 0.0676 (3.00) –0.0838 (3.80)Politics centre 0.0914 (4.67) –0.0962 (4.73) 0.1033 (5.00) –0.1275 (6.31)Politics (7–8) 0.1265 (5.95) –0.1655 (7.47) 0.1606 (7.16) –0.2026 (9.20)Politics right 0.1051 (4.27) –0.1154 (4.49) 0.1305 (5.01) –0.1670 (6.54)Home account 0.0034 (0.14) –0.0412 (1.59) 0.0535 (2.07) 0.0023 (0.09)Unemployed –0.0013 (0.05) 0.0044 (0.17) –0.0182 (0.68) 0.0609 (2.30)Retired –0.0256 (1.25) 0.0032 (0.15) –0.0110 (0.51) 0.0605 (2.84)Austria 0.0218 (0.56) 0.1311 (3.23) –0.1516 (3.72) 0.1808 (4.46)Bulgaria 0.3028 (7.17) 0.0900 (2.01) 0.0991 (2.18) 0.1012 (2.30)Croatia 0.0822 (2.05) 0.1069 (2.53) 0.0808 (1.91) 0.1950 (4.64)Cyprus 0.0306 (0.60) 0.4999 (9.57) 0.1099 (2.08) 0.4108 (8.02)Czech Republic 0.0567 (1.46) –0.0576 (1.41) 0.1920 (4.67) –0.1080 (2.65)Denmark 0.4759 (12.78) –0.2656 (6.79) 0.0709 (1.80) –0.5443 (13.97)East Germany 0.1398 (3.04) 0.2919 (6.10) –0.3239 (6.79) 0.1947 (4.09)Estonia 0.2181 (5.46) –0.0950 (2.27) 0.1479 (3.51) –0.0662 (1.58)Finland 0.0405 (1.07) –0.0737 (1.86) 0.0789 (1.99) –0.0763 (1.93)France –0.1872 (4.93) 0.2922 (7.41) –0.3291 (8.35) 0.3188 (8.14)Greece –0.4050 (10.56) 0.2950 (7.37) –0.1722 (4.27) 0.3937 (9.81)Hungary 0.0407 (1.02) 0.1388 (3.34) –0.1605 (3.85) 0.0995 (2.41)Ireland 0.2085 (4.93) 0.1244 (2.78) 0.0917 (2.06) 0.1463 (3.34)Italy 0.0319 (0.75) –0.1005 (2.28) 0.3201 (7.21) 0.0235 (0.53)Latvia –0.0808 (1.94) –0.0604 (1.38) –0.1316 (3.01) 0.0707 (1.64)Lithuania 0.2130 (4.47) –0.0566 (1.12) 0.1670 (3.33) 0.0920 (1.84)Luxembourg –0.0797 (1.57) 0.3348 (6.41) –0.2535 (4.88) 0.1848 (3.57)Macedonia, FYR of 0.3843 (9.04) 0.1221 (2.73) 0.3119 (6.90) 0.1399 (3.13)Malta 0.5019 (8.62) –0.4013 (6.30) 0.4126 (6.46) –0.3635 (5.76)Netherlands 0.3705 (10.08) –0.2367 (6.11) 0.1642 (4.21) –0.2422 (6.30)Poland 0.2608 (6.07) –0.0429 (0.96) 0.3296 (7.26) –0.0223 (0.50)Portugal 0.0976 (2.26) –0.0463 (1.02) 0.4005 (8.83) 0.0351 (0.79)Romania 0.2470 (5.81) 0.1227 (2.73) 0.3681 (8.21) 0.1498 (3.41)Slovak Republic 0.1194 (3.11) –0.0181 (0.45) 0.2103 (5.18) –0.0172 (0.43)Slovenia 0.2054 (5.18) 0.3655 (8.85) 0.0918 (2.20) 0.2893 (6.99)Spain 0.1862 (4.32) 0.1024 (2.29) 0.3968 (8.76) 0.0590 (1.33)Sweden 0.4577 (12.42) –0.2423 (6.24) 0.1701 (4.34) –0.4258 (11.01)Turkey –0.1518 (3.33) –0.1627 (3.40) 0.1889 (3.89) –0.0102 (0.21)UK 0.0726 (1.93) –0.0400 (1.01) 0.0328 (0.83) 0.0569 (1.45)West Germany 0.1064 (2.86) 0.1779 (4.55) –0.2603 (6.68) 0.1132 (2.92)
Constant 2.4788 2.9086 1.8050 3.1034 N 20,013 19,701 19,811 20,353Adjusted/Pseudo R2 0.0782 0.0558 0.0666 0.0933
Continued overleaf

108 MAKING GLOBALIZATION SOCIALLY SUSTAINABLE
Table 3.8 Continued
Source: Eurobarometer No. 69.2, March–May 2008. (Regarding country denominations, see endnote 3.)
Notes: excluded categories, employed; Belgium; age left school (ALS) <16; age 35–44; politics – left; and origin “in our country”. T-statistics in parentheses.Question. For each of the following statements, please tell me whether you strongly disagree (=1), somewhat disagree (= 2), somewhat agree (= 3) or strongly disagree (= 4).Column 1. Globalization is an opportunity for economic growth?Column 2. Globalization increases social inequalities?Column 3. Globalization protects us from price increases?Column 4. Globalization is profitable only for large companies, not for citizens?
Table 3.9 Views on globalization, 2010 (OLS)
Growth Inequalities Prices Profits
Age 15–24 0.0758 (3.26) –0.0376 (1.56) 0.0979 (3.84) –0.0756 (3.07) Age 25–34 0.0260 (1.55) 0.0080 (0.46) 0.0380 (2.07) –0.0171 (0.96) Age 45–54 –0.0158 (0.98) 0.0375 (2.24) –0.0268 (1.51) 0.0504 (2.92) Age 55–64 –0.0064 (0.36) 0.0330 (1.78) –0.0150 (0.76) 0.0662 (3.48) Age ≥65 0.0248 (1.11) 0.0097 (0.42) 0.0491 (2.01) 0.0800 (3.38) Male 0.0417 (4.16) –0.0035 (0.34) 0.0451 (4.12) –0.0027 (0.26) ALS 16–19 0.0524 (3.47) –0.0219 (1.41) 0.0192 (1.17) –0.0482 (3.05) ALS ≥20 0.1473 (8.93) –0.0698 (4.11) 0.0337 (1.88) –0.1719 (9.91) Still studying 0.1630 (5.80) –0.1286 (4.40) 0.0972 (3.15) –0.1952 (6.54) No FT education 0.0106 (0.16) –0.0642 (0.92) 0.0635 (0.87) –0.0976 (1.33) Politics (3–4) 0.0948 (4.56) –0.1056 (4.92) 0.0836 (3.68) –0.1041 (4.73) Politics centre 0.0999 (5.25) –0.1502 (7.65) 0.1280 (6.16) –0.1268 (6.31) Politics (7–8) 0.2030 (9.71) –0.1981 (9.18) 0.2064 (9.02) –0.2256 (10.19)Politics right 0.1773 (7.24) –0.1818 (7.20) 0.2160 (8.10) –0.1918 (7.41) Origin other EU 0.0211 (0.75) –0.0138 (0.47) 0.0857 (2.76) 0.0071 (0.24) Europe not EU 0.0703 (1.75) 0.1291 (3.11) 0.0796 (1.79) 0.0404 (0.96) Asia/Africa origin 0.0236 (0.54) 0.0818 (1.80) 0.2190 (4.54) 0.1268 (2.75) USA/Japan origin 0.1764 (1.24) 0.0134 (0.09) 0.2783 (1.80) –0.3396 (2.31) Home account 0.0216 (1.01) –0.0659 (2.94) –0.0148 (0.63) –0.0201 (0.88) Unemployed –0.0570 (3.22) 0.0273 (1.49) –0.0353 (1.82) 0.0447 (2.40) Retired –0.0216 (1.20) 0.0216 (1.16) –0.0338 (1.72) 0.0165 (0.87) Austria 0.0197 (0.60) 0.1246 (3.67) –0.0731 (2.04) 0.1837 (5.26) Bulgaria 0.1165 (3.30) 0.0293 (0.81) –0.0006 (0.02) 0.1788 (4.85) Croatia 0.0710 (2.09) 0.1028 (2.93) –0.0065 (0.18) 0.2228 (6.19) Cyprus 0.0014 (0.03) 0.2503 (5.57) 0.0550 (1.18) 0.3114 (6.84) Czech Republic –0.0870 (2.60) –0.0358 (1.04) 0.0556 (1.53) –0.0414 (1.17) Denmark 0.4223 (12.83) –0.2361 (6.86) 0.0405 (1.12) –0.3693 (10.48)East Germany 0.1148 (2.75) 0.1244 (2.90) –0.2205 (4.89) 0.0715 (1.63) Estonia 0.1477 (4.33) –0.0996 (2.80) –0.0272 (0.73) –0.0701 (1.93) Finland 0.2036 (6.14) –0.0251 (0.74) 0.0709 (1.96) –0.1439 (4.09) France –0.2737 (8.13) 0.2819 (8.26) –0.4074 (11.25) 0.2907 (8.30) Greece –0.3430 (10.44) 0.3562 (10.51) –0.2363 (6.58) 0.3485 (10.01)Hungary 0.1475 (4.43) 0.1752 (5.07) –0.1758 (4.83) 0.0431 (1.22) Ireland 0.1988 (5.71) –0.0186 (0.51) 0.0052 (0.14) 0.0799 (2.15) Italy –0.0503 (1.46) –0.1606 (4.49) 0.2020 (5.37) –0.0936 (2.56) Latvia –0.0809 (2.33) –0.0199 (0.55) –0.1341 (3.53) 0.0524 (1.43) Lithuania 0.1095 (3.06) –0.2318 (6.19) 0.0493 (1.26) 0.0338 (0.90) Luxembourg –0.0184 (0.43) 0.1029 (2.32) –0.0955 (2.06) –0.0326 (0.72) Macedonia, FYR of 0.1537 (4.49) 0.0292 (0.83) 0.1020 (2.72) 0.2376 (6.58) Malta 0.4280 (8.73) –0.3305 (6.36) 0.3326 (6.03) –0.1605 (2.93)
REACTIONS AND ATTITUDES TO GLOBALIZATION AND JOBS 109
CH
AP
TE
R 3
where we explore directly individuals’ views on the benefits of globalization. It should be noted that no definition of the term globalization was given. The questions related to the effects on growth, inequality, prices and whether the benefits were given to big business or the ordinary citizen. The precise questions are presented at the end of the table.
The patterns are broadly similar to those in the earlier equations: happy people have cheerful dispositions and perhaps are happy about most things. The young are most content about the positive impact on growth (column 1). Males, right-wingers and the most educated are especially content with the benefits. Inevitably the unemployed and the least educated are the most discontented. The Danes, the Dutch, the Finns and the Swedes are most supportive. The French and the Greeks are opposed, worrying in part about the adverse effect of globalization on social inequalities (column 2) and prices (column 3) and that the benefits are mostly to big firms rather than to the man on the street (column 4). In comparing the two years, it is apparent that these patterns are very stable over time. Perhaps the biggest change is that in 2008 the unemployed were not significantly different from the employed regarding their views on growth but by 2010 the unemployed were less supportive of the benefits of globalization on growth.
Growth Inequalities Prices Profits
Netherlands 0.2457 (7.48) –0.2755 (7.98) 0.0927 (2.53) –0.3232 (9.16) Poland 0.0301 (0.85) 0.0467 (1.27) 0.2128 (5.45) 0.1202 (3.24) Portugal –0.1056 (3.00) –0.1179 (3.26) 0.0318 (0.84) –0.0097 (0.27) Romania 0.0163 (0.45) –0.0112 (0.30) 0.1732 (4.38) –0.0449 (1.17) Slovak Republic 0.1997 (5.95) –0.0056 (0.16) 0.3315 (9.05) –0.0298 (0.84) Slovenia 0.0356 (1.06) 0.3022 (8.80) –0.0482 (1.33) 0.3445 (9.79) Spain 0.0267 (0.77) 0.1045 (2.90) 0.0392 (1.01) 0.2252 (6.11) Sweden 0.3908 (12.05) –0.2844 (8.40) 0.0453 (1.27) –0.4435 (12.86)Turkey 0.1143 (3.05) –0.1156 (2.95) 0.3789 (9.04) 0.0196 (0.48) Turkish Cyprus 0.4092 (9.48) –0.0814 (1.82) 0.3925 (8.29) –0.1618 (3.46) UK 0.1666 (5.18) –0.1023 (3.03) 0.0105 (0.30) 0.0146 (0.43) West Germany 0.1497 (4.52) 0.1464 (4.29) –0.1920 (5.37) –0.0110 (0.32)
Constant –2.5138 –1.9696 –3.0345 –1.8884 N 25,642 25,468 25,327 26,070Adjusted/Pseudo R2 0.0685 0.0552 0.0503 0.0798
Source: Eurobarometer No. 73.4, May 2010. (Regarding country denominations, see endnote 3.)
Notes: excluded categories, employed; Belgium; age left school (ALS) <16; age 35–44; politics – left; and origin “in our country”. Asia and Africa also includes Latin America. USA/Japan means North America and also includes Oceania. T-statistics in parentheses.Questions. For each of the following statements, please tell me whether you totally disagree (=1), tend to disagree (= 2), tend to agree (= 3), or totally agree (= 4)?Column 1. Globalization is an opportunity for economic growth?Column 2. Globalization increases social inequalities?Column 3. Globalization protects us from price increases?Column 4. Globalization is profitable only for large companies, not for citizens?

110 MAKING GLOBALIZATION SOCIALLY SUSTAINABLE
The Germans, who have long been hawkish on inflation, are especially opposed to the idea that globalization protects from price increases. The unemployed are much less likely than the employed to agree that globalization helps growth. The young, the educated, men and right-wingers are especially likely to report that globalization helps growth.
3.5 Policy responses
The first policy response to the financial crisis was to adjust monetary policy. Interest rates were reduced to historical lows and some countries tried to offset the reduction in credit caused by the difficulties in the banking sector by monetary expansion (quantitative easing).
Changes in market sentiment around issues such as the probability of sovereign debt default and growth prospects led to substantial currency realignments. The change in nominal exchange rates from 2008Q1 to 2010Q3 against the SDR is shown in figure 3.5. Major changes included the appreciation of the yen. Despite having the highest national debt to gross domestic product (GDP) ratio in theG20, Japan has a very high domestic savings rate. The result of the high degree of market confidence in the yen has led to a considerable loss in competitivenessand difficulties for the Japanese labour market. The United Kingdom, in contrast, experienced a sharp devaluation, substantially reducing its relative labour costs.
There was widespread unease that countries were attempting to manipulate their currencies to boost external demand. Member countries were encouraged to avoid competitive devaluations at the G20 summit meeting in October 2010, but it is not clear whether any agreement might hold in the medium to long term unless the major imbalances in the world economy are fixed.
The second response to the crisis came as a result of the operation of automatic stabilizers. As private demand fell, government spending on a variety of social insurance schemes increased. In the immediate aftermath of the crash, the most important of these was the impact on unemployment benefits. Recent OECD research has, however, claimed that unemployment benefit expenditure is acyclic, because the increased number of claims during a recession has been offset by a reduction in the value of benefits to unemployed persons. Thus, at the same time as claims have been rising, governments have been reducing the average value of claims and in consequence the net effect on spending has been small. Thus, automatic stabilizers are likely to differ in their effectiveness. In those countries with generous social protection systems, automatic stabilizers are likely to have a stronger effect in supporting demand, so lessening the need for discretionary measures.

REACTIONS AND ATTITUDES TO GLOBALIZATION AND JOBS 111
CH
AP
TE
R 3
Figure 3.5 Change in nominal exchange rate against SDR, 2008Q1–2010Q3
Source: IMF World Economic Financial Statistics.
Such countries are typically found in Northern Europe. For example, the Norwegian unemployment benefit system provides prime age unemployed workers with 72 per cent of their previous income over a period of at least five years. This contrasts with the United States, which provides only 28 per cent for one year.
The third response was the introduction of discretionary measures to boost aggregate demand. The OECD (2011) notes that these measures made a smaller contribution to maintaining output and employment than automatic stabilizers did. The scale of the intervention varied widely both in their composition in respect of spending measures, ranging from the Republic of Korea with a cumulative package worth 6 per cent of GDP over three years, to France, Portugal and Switzerland with less than 0.5 per cent of GDP. New Zealand and the United Kingdom are notablefor attempting the most rapid turnaround from fiscal expansion to contraction. The impact of these measures on the labour market depends on short-run employment multipliers, which vary from country to country and on the composition of the stimulus, with increased spending likely to have a more positive effect on employment than tax reductions (OECD, 2011).
30
25
20
15
10
5
0
–5
–10
–15
–20
–25Brazil China Euro
areaIndia Japan United
KingdomUnitedStates
RussianFederation

112 MAKING GLOBALIZATION SOCIALLY SUSTAINABLE
We now turn to labour market responses, focusing largely on the advanced countries where the effects of the recession have been most acute. Labour market policy responses have comprised both passive and active measures. The former largely comprise income support schemes, while the latter comprise a wide range of measures schemes intended to keep or reintegrate individuals within the labour market. In recent years OECD strategy has emphasized the benefits of Active Labour Market Policies (ALMPs) relative to passive measures. Spending on labour market policies is relatively low in countries such as Canada, Japan, the Republic of Korea, the United Kingdom and the United States which largely rely on market solutions. On the other hand Ireland, the Netherlands and the Scandinavian countries spend much more both on active and passive labour market policies. Neither group of labour markets has performed uniformly better than the other over the last three years, and in both groups spending per unemployed person actually declined during the recession (OECD, 2011).
Many OECD countries have taken measures to cushion the effect of job loss by decreasing the generosity of unemployment benefits and/or social assistance. A number of countries have also extended support for those seeking jobs. Some have increased the conditionality of income support by requiring the unemployed to increase their job search activity.
Schemes to support short-time working and so avoid lay-offs have been introduced or reinstated in a number of countries. Finally, measures to reduce non-wage labour costs and so encourage employers to substitute labour for capital. However, the additional discretionary spend on these ALMPs in response to the recession has been very small. In the United Kingdom, it measured 0.1 per cent of GDP and inthe United States 0.01 per cent of GDP. The highest spenders were Portugaland Poland, who committed more than 0.3 per cent of GDP to these programmes. The OECD (2011) used cross-country variation in short-time working to identifythe effects of these policies. It finds that these schemes helped preserve permanent jobs during the downturn. They did not, however, help maintain temporary employment and their effect on the responsiveness of wages to the cycle is unclear.
Reductions in social security contributions were also used as a measure to stimulate employment. The OECD evidence suggests that these may be useful in stimulating short-run demand but in the long run are very expensive as mechanisms for increasing employment, with the long-run elasticity of employment with respect to labour costs being around 0.2 for OECD countries.
Clearly there has been a strong political pressure in many countries to “do something” about the sharp rise in unemployment. Due to their expansion in recent decades, ALMPs now form part of the standard policy toolkit. But the evidence for their

REACTIONS AND ATTITUDES TO GLOBALIZATION AND JOBS 113
CH
AP
TE
R 3
efficacy is somewhat mixed. Card et al. (2010) conduct a meta-analysis of 199 different ALMPs. They find that the proportion of evaluation studies of these programmes that yield positive results rises through time. Thus while only 39.1 per cent yield significantly positive outcomes in the short term, 45.4 per cent yield positive medium-term impacts and 52.9 per cent significantly positive long-term effects. Clearly there are large numbers of programmes that are not successful in improving labour market outcomes. The speed at which the labour market dipped gave governments little time to evaluate new policy interventions. Therefore it is no surprise that ALMPs formed a large part of the discretionary response to rising unemployment.
However, some countries have placed deficit reduction as their policy imperative. Some, like Greece and Ireland, have had little option due to sovereign debt crises. The United Kingdom government argues that it will have a sovereign debt crisis unless it adopts draconian fiscal cutbacks. As a result, the United Kingdom has abandoned some ALMPs that were introduced by the previous government to assist the young such as the educational maintenance allowance (EMA), which was intended to encourage children from poorer backgrounds to stay at school to age 18. It has also cut the Future Jobs Fund which supported 150,000 jobs for thoseaged under 25. University places have been cut back, despite the fact thatuniversity applications are up by around one-third between 2008 and 2011, and tuition fees have increased substantially. The early signs are not good. Between May 2010 when the coalition was formed and October 2010 which is the most recent data available, total employment in the United Kingdom fell by 66,000. Over the same period employment of youngsters under the age of 25 fell by 88,000. Youth unemployment has also jumped sharply. The outcome of the United Kingdom’s experiment in significantly reducing ALMPs will be viewed with interest in other countries.
3.6 Conclusions
The timing of the shocks to trade and output caused by the financial crisis was closely aligned across countries, leading to the Great Synchronization. However, in terms of size and persistence of the recessionary impact, it is the developed world, and particularly European countries, that have been most adversely affected. Even within Europe there is no consistent pattern. Some countries, especially those hit hard by the decline in world trade, such as Germany and Sweden, have bounced back quickly. In other European countries, output is still significantly lower than its pre-recession level. There is a widespread concern in Europe and in the United States that the recovery will be too weak to generate many jobs and therefore high levels of unemployment will persist, as they did in the 1980s.

114 MAKING GLOBALIZATION SOCIALLY SUSTAINABLE
The scale of impacts on the labour market has differed widely. For example, the United Kingdom had twice as big a drop in output as the United States, but a much smaller increase in unemployment. As yet, there is not much evidence of a “discouraged worker effect”, though this may change as unemployment durations increase. Governments have responded to the crisis with monetary and fiscal policies, some of which may have helped maintain employment. Automatic stabilizers have also had an important role in maintaining demand and supporting the income of the unemployed. They have also introduced, or expanded, a wide range of ALMPs. The effectiveness of these measures undoubtedly varies widely, but the downturn in the labour market happened so rapidly that there was little time to conduct extensive evaluations. Rather, governments had to rely on evidence from pre-recession labour markets. However, the resources devoted to these measures has not increased as rapidly as has the level of unemployment, implying spend per unemployed person has fallen.
Some countries have decided to reduce spending on ALMPs, even though they are confronted by a large increase in unemployment. These encompass countries that have real sovereign debt difficulties, including Greece, Ireland, Portugal and Spain. Some countries are concerned that they may experience similar problems and have introduced fiscal austerity measures to reassure the capital markets. Labour market measures tend not to have a high political priority in times of fiscal stringency and thus are unlikely to be immune from budget cuts. For example, in the United Kingdom, spending on ALMPs has been reduced but government spending on health continues to increase.
We have added to the evidence on the impacts of the recession in a number of ways. Following our previous work showing how much those aged 16–24 have suffered in terms of greater unemployment and underemployment during the Great Recession, we have found that the young have been more likely to accept work at lower skill levels than they might had not jobs been in short supply. This may contribute to the scarring effects of joining the labour market while the economy is in recession.
We have found that the unemployed, the young and left-wingers wish governments would do more to create jobs. Those living in Mediterranean countries have become increasingly pessimistic about job prospects. The Greeks, Irish and Italians think the worst of the crisis is yet to come.
We have also discovered that in countries where output fell sharply and there was a significant deterioration in the labour market, happiness has declined and opposition to globalization increased, although Ireland is an exception. The unemployed have becoming increasingly unhappy, perhaps reflecting their increasing awareness of the difficulties of finding a job. A major concern going forward is that if the recovery is

REACTIONS AND ATTITUDES TO GLOBALIZATION AND JOBS 115
CH
AP
TE
R 3
jobless there will be growing demands for protectionism, especially in countries where inequalities are widening.
Endnotes
1. Verick (2010) documents that the number of discouraged workers has risen significantly in South Africa from 1.08 million in 2008Q2 to 1.63 million in 2009Q3.
2. Source: CIA World Factbook https://www.cia.gov/library/publications/the-world-factbook/geos/uk.html.
3. References to East/West Germany, Turkish Cyprus etc. reflect the terms used by the EU Eurobarometer, which was launched in 1973. The use of such terms does not constitute or imply an expression of opinion by the WTO Secretariat or the ILO concerning the status of any country or territory, or the delimitation of its frontiers, or sovereignty.
References
Almunia, M.; Bénétrix, A.S.; Eichengreen, B.J.; O’Rourke, K.H.; Rua, G.; NBER. 2009. From Great Depression to great credit crisis: Similarities, differences and lessons (Cambridge, MA, National Bureau of Economic Research).
Araújo, S.; Martins, J.O. 2009. “The Great Synchronisation: what do high-frequency statistics tell us about the trade collapse?”, in VoxEU.org, 8 July.
Autor, D.H.; Levy, F.; Murnane, R.J. 2003. “The skill content of recent technological change: an empirical exploration”, in Quarterly Journal of Economics, Vol. 118, No. 4, pp. 1279–1333.
Baldwin, R. 2009. “The great trade collapse: What caused it and what does it mean?”, inVoxEU.org, November [accessed at: http://www.voxeu.org/index.php?q=node/4304].
Barrett, A.; Kearney, I.; Conefrey, T.; O’Sullivan, C. 2010. Economic and Social Research Institute Quarterly Economic Commentary, Winter 2010 (Dublin, Economic and Social Research Institute).
Bauer, P.; Shenk, M. 2009. “Productivity in the recession and going forward”, in Economic Trends (Cleveland, OH, Federal Reserve Bank of Cleveland).
Bell, D.N.F.; Blanchflower, D.G. 2010a. “Recession and unemployment in the OECD”, in CESifo Forum, Issue 1, Mar., pp. 14–21.
—; —. 2010b. “UK unemployment in the Great Recession”, in National Institute Economic Review, Vol. 214, No. 1, Oct., pp. R3–R25.
—; —. 2011a. “Underemployment in the Great Recession”, in National Institute Economic Review, Vol. 215, Jan., pp. R1–R11.

116 MAKING GLOBALIZATION SOCIALLY SUSTAINABLE
—; —. 2011b. “Youth unemployment in Europe and the United States”, in Nordic Economic Policy Review (forthcoming)
Blanchflower, D.G.; Oswald, A.J. 2004. “Well-being over time in Britain and the USA”, in Journal of Public Economics, Vol. 88, Issues 7–8, July, pp. 1359–1386.
—; —. 2008a. “Is well-being U-shaped over the life cycle?”, in Social Science and Medicine,Vol. 66, No. 8, Apr., pp. 1733–1749.
—; —. 2008b. “Hypertension and happiness across nations”, in Journal of Health Economics, Vol. 27, No. 2, pp. 218–223.
—; —. 2011. “International happiness – a new view on the measure of performance”, in Academy of Management Perspectives (forthcoming).
Brown, G. (2010), Overcoming the first crisis of globalisation (New York, Free Press).
Card, D.; Lemieux, T. 2000. “Adapting to circumstances – The evolution of work, school and living arrangements among North American youth”, in D.G. Blanchflower and R.B. Freeman (eds): Youth employment and joblessness in advanced countries (Chicago, University of Chicago Press).
—; Kluve, J.; Weber, A. 2010. “Active labour market policy evaluations: A meta-analysis”, in Economic Journal, Vol. 120, No. 548, Nov., pp. F452–F477.
Chiuri, M.C.; Del Boca, D. (2008), “Household membership decisions of adult children”, IZA Discussion Paper No. 3546, June (Bonn, Germany, Institute for the Study of Labour).
Dolado, J. 2010. “The labour market in Spain”, in VoxEU.org, 24 September [accessed at: http://www.voxeu.org/index.php?q=node/5550].
Eichengreen, B.; O’Rourke, K. 2009. “A tale of two depressions”, in VoxEU.org, 4 June 2009.
Elsby, M.W.; Hobijn, B.; Sahin, A. 2010. “The labor market in the Great Recession”, Working Paper Series No. 2010-07 (San Francisco, Federal Reserve Bank of San Francisco).
Farber, H.S. 2007. “Labor market adjustment to globalization: Long-term employment in the United States and Japan”, Working Paper No. 519 (Princeton, NJ, Princeton University Industrial Relations Section).
Ferreira, F.; Gyourko, J.; Tracy, J. 2010. “Housing busts and household mobility”, in Journal of Urban Economics, Elsevier, Vol. 68, No. 1, July, pp. 34–45.
Frey, W.H. 2009. “The great American migration slowdown: Regional and metropolitan dimensions”, Metropolitan Policy Program, The Brookings Institution, December.
Gamberoni, E.; Von Uexkull, E.; Weber, S. 2010. “The roles of openness and labor market institutions for employment dynamics during economic crises”, in Economic Premise, The World Bank, Sep., No. 29.
Giuliano, P.; Spilimbergo, A. 2009. “Growing up in a recession: Beliefs and the macroeconomy”, NBER Working Paper No. 15321, Sep. (Cambridge, MA, National Bureau of Economic Research).

REACTIONS AND ATTITUDES TO GLOBALIZATION AND JOBS 117
CH
AP
TE
R 3
International Labour Organization. 2011. Global Employment Trends 2011: The challenge of a jobs recovery (Geneva).
Kahn, L.B. 2010. “The long-term labour market consequences of graduating from college in a bad economy”, in Labour Economics, Vol. 17, No. 2, Apr., pp. 303–316.
Koenders, K.; Rogerson, R. 2005. “Organizational dynamics over the business cycle: A view on jobless recoveries”, in Federal Reserve Bank of St. Louis Review, Vol. 87, pp. 555–579.
Love, E.; Nohria, N. 2005. “Reducing slack: The performance consequences of downsizingby large industrial firms, 1977–93”, in Strategic Management Journal, Vol. 26, No. 12,pp. 1087–1108.
Mora, J.; Powers, W.M. 2009. “Decline and gradual recovery of global trade financing: USand global perspectives”, in VoxEU.org, June [accessed at: http://www.voxeu.org/index.php? q=node/4298].
Office of National Statistics. 2011. Economic and labour market review [accessed at http://www.statistics.gov.uk/elmr/downloads/elmr2.pdf].
Organisation for Economic Co-operation and Development (OECD) (2011), Main Economic Indicators (Paris) [accessed at http://www.oecd.org/document/54/0,3746,en_2649_33 715_15569334_1_1_1_1,00.html].
Reich, M. 2010. “High unemployment after the Great Recession: Why? What can we do?”, Center on Wage and Employment Dynamics (Berkeley, CA), Policy Brief, June.
van Rens, T. 2004. “Organizational capital and employment fluctuations”, Economics Working Papers No. 944, Universitat Pompeu Fabra (Barcelona, Spain).
Verick, S. 2010. “Unravelling the impact of the global financial crisis on the South African labour market”, ILO Employment Working Paper No. 48 (Geneva).
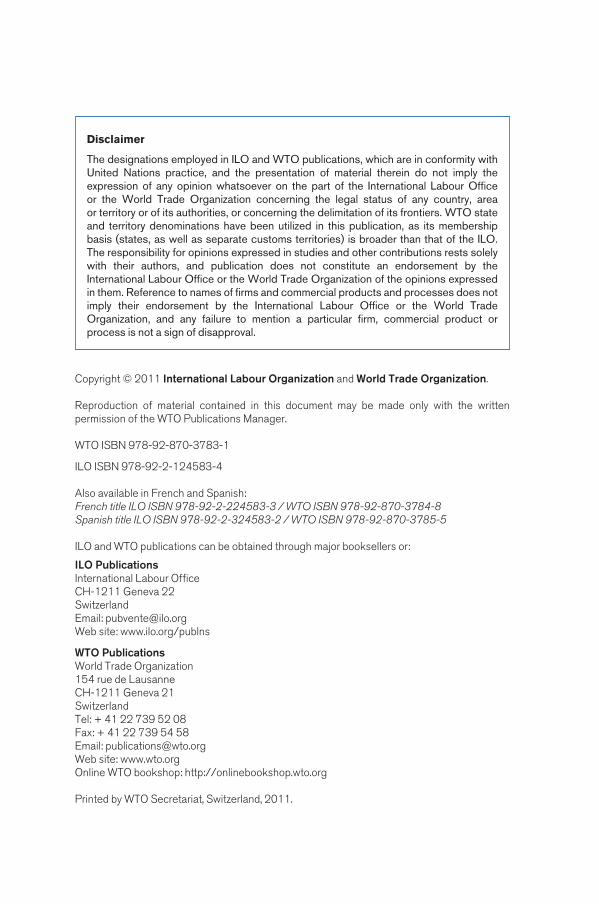
Disclaimer
The designations employed in ILO and WTO publications, which are in conformity with United Nations practice, and the presentation of material therein do not imply the expression of any opinion whatsoever on the part of the International Labour Officeor the World Trade Organization concerning the legal status of any country, areaor territory or of its authorities, or concerning the delimitation of its frontiers. WTO state and territory denominations have been utilized in this publication, as its membership basis (states, as well as separate customs territories) is broader than that of the ILO. The responsibility for opinions expressed in studies and other contributions rests solely with their authors, and publication does not constitute an endorsement by the International Labour Office or the World Trade Organization of the opinions expressed in them. Reference to names of firms and commercial products and processes does not imply their endorsement by the International Labour Office or the World Trade Organization, and any failure to mention a particular firm, commercial product or process is not a sign of disapproval.
Copyright © 2011 International Labour Organization and World Trade Organization.
Reproduction of material contained in this document may be made only with the written permission of the WTO Publications Manager.
WTO ISBN 978-92-870-3783-1
ILO ISBN 978-92-2-124583-4
Also available in French and Spanish:French title ILO ISBN 978-92-2-224583-3 / WTO ISBN 978-92-870-3784-8 Spanish title ILO ISBN 978-92-2-324583-2 / WTO ISBN 978-92-870-3785-5
ILO and WTO publications can be obtained through major booksellers or:
ILO PublicationsInternational Labour OfficeCH-1211 Geneva 22SwitzerlandEmail: [email protected] site: www.ilo.org/publns
WTO PublicationsWorld Trade Organization154 rue de LausanneCH-1211 Geneva 21SwitzerlandTel: + 41 22 739 52 08Fax: + 41 22 739 54 58Email: [email protected] site: www.wto.orgOnline WTO bookshop: http://onlinebookshop.wto.org
Printed by WTO Secretariat, Switzerland, 2011.