the costs, recovery, and impacts of the current municipal solid
TRANSCRIPT

Analysis of Consolidated Collection Systems for the Chittenden Solid Waste District
FINAL REPORT January 20, 2012
DSM Environmental Services, Inc. with GBB

Analysis of Consolidated Collection Systems for the Chittenden Solid Waste District Final Report – January 20, 2012
Table of Contents
Executive Summary (Prepared by the Chittenden Solid Waste District) ....................................................... 1 Background ................................................................................................................................................... 2 Definitions ..................................................................................................................................................... 3 Disclaimer...................................................................................................................................................... 4 Consolidation Options for Analysis ............................................................................................................... 5 Description of Current Collection System ..................................................................................................... 9 Assumptions for Current Collection System (Base Case) ............................................................................ 12 Total Costs of Base Case ............................................................................................................................. 17 Consolidated Collection Alternatives .......................................................................................................... 21 Comparison of Options and Costs............................................................................................................... 35 Further Discussion of Key Variables ............................................................................................................ 38 Environmental Costs and Benefits .............................................................................................................. 44 Partial Bibliography ..................................................................................................................................... 48
Appendix A: Examples of Recent Communities that have Consolidated Collection or Franchised,
or that are currently Reviewing Consolidated Collection Options

1 Analysis of Consolidated Collection Systems for the Chittenden Solid Waste District Final Report – January 20, 2012
Executive Summary Prepared by the Chittenden Solid Waste District
The costs, recovery, and impacts of the current municipal solid waste and recycling collection system in Chittenden County were compared to three options for the consolidation of collection routes:
Option 1: Contracts for weekly collection of all residential waste and recyclables,
Option 2: Contracts for weekly collection of all residential and commercial waste and recyclables, and,
Option 3: Contracts for bi-weekly collection of all residential waste and recyclables (same as Option 1 except for every other week vs. weekly collection).
The results of the analysis are summarized below.
Current Option 1 Option 2 Option 3
$18,525,000 $13,918,180 $13,918,180 $12,350,080
$4,606,820 $4,606,820 $6,174,920
25% 25% 33%
$7,952,000 $7,952,000 $6,325,500 $7,952,000
$0 $1,626,500 $0
0% 20% 0%
$26,477,000 $21,870,180 $20,243,680 $20,302,080
$4,606,820 $6,233,320 $6,174,920
17% 24% 23%
$4,356,820 $5,883,320 $5,924,920
16% 22% 22%
Current Option 1 Option 2 Option 3
Annual Recycling Tonnage 27,300 3,400 5,700 3,400
Percentage Increased 12% 21% 12%
Residential Only 24% NA 24%
Recycling Rate 23% 3% 5% 3%
Residential Only 22% 5% NA 5%
Estimated Recycling Impacts for Consolidated Collection Options
Savings
Percentage Saved
Total Savings Inc. Admin. Costs
Percentage Saved
COMMERCIAL
Annual Costs
Savings
Percentage Saved
TOTAL
Annual Costs
Estimated Costs & Savings Under Consolidated Collection Options
RESIDENTIAL
Annual Costs
Savings
Percentage Saved
On average, businesses would see an estimated 20% decrease in their costs, and households, 24%-32% depending on whether weekly or biweekly service is specified. The calculation of estimated environmental impacts shows that, while route consolidation will result in reduced air emissions and GHG emissions, increasing the quantities of recyclables collected will result in greater environmental benefits.
2 Analysis of Consolidated Collection Systems for the Chittenden Solid Waste District Final Report – January 20, 2012
Background
DSM Environmental Services, Inc. (DSM) and our sub-contractor, Gershman, Brickner & Bratton (GBB), were contracted by the Chittenden Solid Waste District (CSWD) to evaluate the potential economic and environmental impacts associated with the consolidation of municipal solid waste and recycling collection systems in the District. The objective of this review is to investigate the potential economies of consolidation of routes in the District, with the goals of reducing costs to CSWD members, reducing the environmental and infrastructure impacts of truck traffic, and increasing the diversion of materials from disposal without undue cost. A Franchise Study Committee, with board members of the CSWD, licensed haulers and CSWD staff was formed to provide guidance and feedback to DSM and GBB (Project Team) for this work. After research and review of the current solid waste and recycling collection systems in the District, the Project Team prepared a “menu” of potential systems that could be analyzed and presented them to the Franchise Study Committee at their July 7, 2010 meeting. Subsequent to that meeting the Project Team attended a meeting on August 25, 2010 of CSWD members of the Franchise Study Committee to review legal issues associated with franchising and flow control presented by the CSWD attorney. The CSWD members and the Project Team evaluated both franchising and collection route consolidation, and with guidance from the CSWD attorney, settled on contracting as the preferred method to proceed in Vermont under current statute. A list of options for collection route consolidation was proposed by the Project Team to reflect both the “sense” of the July 7, 2010 Franchise Study Committee meeting and the legal constraints outlined by CSWD’s attorney. These options were subsequently approved by the District Board for analysis and are outlined in this report. To perform the analysis, it was necessary to first model the baseline collection system to compare the options against, and to agree on numerous assumptions regarding collection in the District. The Franchise Study Committee and Project Team worked hard to share data so that assumptions were reflective of collection activity in the District. This report presents the baseline collection system in the District, the assumptions made to define the current system, and the system options analyzed. A comparison is then made of the current system costs, recovery and impacts against the different options to consolidate routes. The analysis addressed municipal solid waste, exclusive of Construction and Demolition (C&D) waste and bulky wastes handled in roll-off containers. It is assumed that most bulky waste and small quantities of C&D waste could be collected under the consolidated route system using conventional packer trucks. However large quantities of bulky wastes and C&D wastes would either be delivered directly to a transfer station or landfill or collected in roll-off containers. Roll-off waste collection is assumed to continue to operate separate from any consolidated collection activity because no, or minimal efficiencies would be gained by incorporating this activity. Finally, Pay As You Throw (PAYT) options that could work with each system, including the current (baseline) system, were identified, and the impact of implementing PAYT pricing for solid waste collection estimated as part of each system.

3 Analysis of Consolidated Collection Systems for the Chittenden Solid Waste District Final Report – January 20, 2012
Definitions
It is important, before outlining the potential systems for analysis, to start with a consistent set of definitions on which all the parties to this discussion can agree. Key terms include the following: Exclusive Franchise: “The right given by government to a private firm to be the sole provider of a good or service.” In this case, it could be the right given by the CSWD to a single company to collect solid waste in a defined geographic area.
Non-Exclusive Franchise: For purposes of this discussion, this would essentially be a “license” or a “permit” granted by the CSWD to any company meeting specific minimum requirements to collect solid waste or recyclables in a defined geographic area. This is in essence the current solid waste and recycling collection system in place in the CSWD.
Contract: A contract is assumed to be between the CSWD and a private hauler to perform a specific service, or between a member municipality and a private hauler to perform a specific service. Typically, the contract would be the result of a public process involving a Request for Proposals/Bids to perform a specified scope of work for a specified period of time.
Payment for Services: Typically a franchise holder enters into a contract with the household or business to perform the specified service, and charges the household or business for the service provided. The charge might be based on rates established as part of the franchise agreement with the CSWD, or the charge might be independently determined by the franchise holder.
In the case of a contract between the CSWD (or a municipality) and a private hauler, typically, the contract hauler bills the CSWD/municipality, and the CSWD/municipality pays the contractor for the service provided. The money to pay the contractor can be raised by: billing the households/businesses directly; through property or related taxes; through PAYT bag or container fees; or, through a combination of these methods.
The contract could also be structured so that the contractor providing the service collects the fee directly from the household or business.
Flow Control: A legal authority used by state and local governments pursuant to statute to designate where solid waste or recyclables must be taken for processing or disposal. If the District contracts for collection of waste and/or recyclables, then the District can contractually direct where the material must be delivered, and flow control is not an issue. Franchise agreements can sometimes be used to direct a private hauler to deliver waste or recyclables to a District designated facility.

4 Analysis of Consolidated Collection Systems for the Chittenden Solid Waste District Final Report – January 20, 2012
Disclaimer
A number of critical estimates needed to be made to complete this relatively complex analysis, and model the solid waste management system used in Chittenden County. These include estimates of the number of households and businesses that use different types of collection services for solid waste and recycling; prices paid for those services; and, the average amount of material set out for recycling and for disposal under each type of service. Because these are estimates, based on a number of educated or informed assumptions, all numbers presented in the tables included in this report have been rounded to the highest level possible to reflect the fact that they are estimated and not actual numbers. As a result, in many cases throughout the report the numbers shown in some tables will not calculate (e.g. add, multiply or divide) because of rounding and the fact that the underlying numbers linked throughout the cost model are not rounded. These rounding errors are minor and do not impact the underlying findings or conclusions of the analysis, but they do result in some totals that will not match between tables.
5 Analysis of Consolidated Collection Systems for the Chittenden Solid Waste District Final Report – January 20, 2012
Consolidation Options for Analysis
The Project Team worked with the CSWD Franchise Study Committee, with input from the CSWD attorney and CSWD staff to outline potentially feasible options for consolidation of collection routes in the District. Consolidation of both residential and commercial refuse and recycling were considered. Some of the reasons other regions have expanded their control to include commercial collection routes (as well as residential) include:
To save businesses in the region money on refuse collection costs and provide uniform pricing;
To offer uniform recycling services to all businesses with the cost embedded in the refuse cost;
To have more control over public health, safety, and welfare issues;
To reduce wear and tear on city/town and state streets and roads;
To reduce air emissions; and,
To reduce traffic congestion through fewer trucks on the roads. At their September 22, 2010 Board Meeting, the CSWD Board prioritized the reasons that they were interested in consolidated collection. These were prioritized as:
1) To reduce costs to residents and businesses;
2) To reduce the environmental and infrastructure impacts of truck traffic;
3) To increase the level of recycling by using organized collection as an effective mechanism to implement District-wide Pay-As-You-Throw (PAYT); and,
4) To increase diversion by using organized collection as an effective mechanism to add collection of organics.
Ultimately, three options for consolidation of collection routes in Chittenden County were agreed to and approved by the CSWD Board for analysis. These were:
Option 1: District collection contracts for weekly collection of all residential waste and recyclables;
Option 2: District collection contracts for weekly collection of all residential and commercial waste and recyclables; and,
Option 3: District collection contracts for bi-weekly collection of all residential waste and recyclables (same as Option 1 except for every other week vs. weekly collection).

6 Analysis of Consolidated Collection Systems for the Chittenden Solid Waste District Final Report – January 20, 2012
For purposes of the analysis, all residential waste and recyclables are assumed to be included in Options 1) and 3) as residential waste. This includes multi-family, condominium and mobile home park residential waste that is currently collected as commercial waste. This also includes all drop-off residential waste. It should be noted here that a significant amount of “residential” waste is currently collected as “commercial” waste because private haulers view containerized waste (waste that they collect in roll-offs and dumpsters) as “commercial.” Most large apartment units, and some condominiums and mobile home parks, use large dumpsters or containers for households to share. In addition, haulers may classify some residential waste that is not containerized as “commercial” because they have one contract to service multiple residences (e.g. at a condominium complex or mobile home park) even though they collect from individual set-outs at this single account. In both cases residential waste (and recyclables) may be classified as commercial by the hauler and may be part of their “commercial” collection routes and not accounted for separately as residential waste Commercial waste can be further divided into waste collected in open and closed roll-off containers, and waste collected in front and rear loading trucks. Because roll-off containers are individually collected by a single truck, it is unlikely that there would be significant economic or environmental savings associated with consolidating roll-off routes. For this reason, Option 2 excludes roll-off waste (which would remain an open market as it currently is), concentrating on rear, front, and side loading collection of commercial waste and recyclables in addition to residential waste and recyclables. However, the CSWD might want to regulate collection of roll-off waste from large supermarkets, certain educational facilities and institutions, and other large generators of food waste in the future if the intent is to divert significant amounts of organic wastes. (It would appear that the CSWD could exercise its right to designate that this waste goes to the District-owned organics facility.) Options 1 and 2 are described in more detail below. Note that Option 3 is identical to option 1 except that collection is bi-weekly for both refuse and recycling as opposed to weekly.
Option 1: District-Wide Collection Contracts for Weekly Collection of all
Residential Waste and Recyclables Under this option, it is assumed that the District will issue a District-wide Request for Proposals for the collection of all residential waste and recyclables (including households currently collected as “commercial waste” – see above discussion). The District would be divided into areas large enough to offer economies of scale (in most cases), and the District would enter into contracts with the hauler proposing the best price (also considering qualifications, proposers’ acceptance of contract terms, and other relevant criteria) for the collection of residential waste and recyclables in each area based on a level of service specified in the RFP and designed to maximize recycling - and potentially organics diversion. The proposed areas or “collection zones” and the estimated households served in each are shown in Table 1.

7 Analysis of Consolidated Collection Systems for the Chittenden Solid Waste District Final Report – January 20, 2012
Table 1 Proposed Collection Zones
Total Households
Geographic Area (2010, rounded)
Burlington 16,100
Winooski, Colchester, Milton 13,400
So. Burlington, Shelburne, Charlotte 12,300
Williston, St. George, Hinesburg 5,500
Essex, Essex Junction, Westford 8,700
Underhill, Jericho 3,000
Richmond, Bolton, Huntington 2,800
Total: 61,800
To assure that some level of competition remains, the District would specify in the RFP that the District reserves the right to award multiple contracts, with a limit on the percent of households awarded to one hauler. The percentage awarded to a single contractor or a small hauler set aside would be determined by the CSWD Board of Commissioners. The District might also specify (if legally permissible) that there be a “small hauler set-aside” of a certain percent of District households. Additional research is necessary to ascertain whether this is legally possible and/or is being done elsewhere in the United States.
Option 2: District-Wide, Collection Contracts for Weekly Collection of Residential and Commercial Waste and Recyclables This option is structured the same as Option 1, except that a single hauler is awarded a collection contract for both residential and commercial waste and recyclables within each designated collection zone. As in Option 1, it is assumed that the District would specify as part of the contract where both the waste and the recyclables would be delivered under the contracts. For this reason, DSM assumed, for both Option 1 and 2, fixed tipping fees for waste and for recyclables (described in the model assumption section below). This is a critical assumption for purposes of the analysis because it eliminates the variable of transfer and disposal costs associated with a hauler having either a particularly good disposal price, or a vertically integrated hauler capable of embedding disposal discounts in their bid collection price. It may be a critical component of any actual contractual bidding process for the same reason, although that is beyond the scope of this analysis. It is also assumed that the selected hauler would be able to comingle residential and commercial waste in the same truck as well as comingle residential and commercial recyclables under Option 2 to maximize the efficiency of collection.

8 Analysis of Consolidated Collection Systems for the Chittenden Solid Waste District Final Report – January 20, 2012
Note that while households and the amount of residential waste and recyclables generated in each zone are relatively easy to estimate based on the data created to date, the amount of commercial waste and recyclables generated in each zone is harder to estimate. Based on the existing data available on total commercial waste and recycling, and demographic data for each municipality, the amount of commercial waste and recyclables generated in each zone was estimated by DSM for use in the analysis. This is at best a rough estimate given the lack of sufficient data on the business mix within each collection territory used in this analysis to refine potential quantities.
Option 3: District-Wide Collection Contracts for Bi-Weekly Collection of all Residential Waste and Recyclables This is the same as Option 1, but with every other week collection of both residential waste and recyclables. It is assumed that residential waste and recyclables would be collected on the same day of the week, but that the contractor could propose collecting refuse one week and recycling the next week (on the same day of the week) or to collect both refuse and recycling the same day every two weeks. Depending on the density of the collection area, the contractor may prefer one method or another.

9 Analysis of Consolidated Collection Systems for the Chittenden Solid Waste District Final Report – January 20, 2012
Description of Current Collection System
Introduction A reasonably accurate description and summary of costs for the current collection system is critical to the Project Team’s analysis because it forms the baseline for comparison against the potential cost and environmental savings/benefits associated with each of the options. Unfortunately, because the current system involves contracts between competing haulers and households and businesses, information is proprietary. While many of the existing haulers have provided data to the Project Team for this study, there is clearly a limit to the level of detail they are willing to provide, requiring the Project Team to make a number of assumptions about the existing system. While the Project Team believes that these assumptions are reasonably accurate, the resulting costs must be viewed as the best estimate within a range of actual costs. In general the prices charged by private haulers for curbside refuse (and recycling) collection are comprised of four cost components:
1) The cost to collect refuse (and/or recycling); 2) The cost to dispose of refuse (and/or process recyclables); 3) The cost to provide customer service, billing and management of the collection service provided
(including provisions for non-payment); and, 4) Profits.
Since collection activity typically represents the largest portion of these costs, particularly in regions like Chittenden County (and most of the rest of Vermont) where collection routes have not been organized, the opportunity to consolidate collection routes to reduce costs is a logical alternative for reducing the cost of solid waste management.
Description Residents and businesses in the District are served by 19 private haulers. Fourteen of these provide subscription residential refuse and recycling collection, and six (of the fourteen) also provide regular collection of commercial refuse and recycling. The other five haulers only provide short term roll-off/container rental for C&D, cleanouts and bulky waste collection. Haulers are licensed to operate by the District, and renew licenses annually. Under the license agreement, haulers must provide collection of mandated recyclables to all customers at least once monthly, directly or through a subcontract with another hauler unless the municipality collects recyclables. The current system operates as a non-exclusive franchise for both residential and commercial waste. Multiple haulers licensed by the District compete for both residential and commercial customers in most municipalities. There are three exceptions to this:

10 Analysis of Consolidated Collection Systems for the Chittenden Solid Waste District Final Report – January 20, 2012
Westford, where the municipality contracts with a single hauler to provide town-wide residential weekly refuse and twice per month recyclables collection service and pays a monthly fee to that hauler for town-wide service;
Underhill, where the municipality has an agreement with a single hauler to provide town-wide weekly refuse and recyclables collection service at an agreed upon price ($5 per bag of refuse or the customer can be invoiced for service), and the hauler is compensated from both sticker sales and direct customer invoicing; and,
Burlington, where municipal crews collect residential recyclables from all households on a weekly basis (and private haulers collecting refuse in the City must register and pay $3.10 per month per household served to cover the cost of City recycling).
Residential Collection System Based on surveys with licensed haulers, review of weigh records and licensing data by truck type, and meetings with all of the larger haulers, residential collection service in the District can be described as follows, and is further quantified in Table 4:
Fourteen of the 19 private haulers regularly collect residential waste and, in most cases, recycling;
Roughly 57 percent of households subscribe directly with a hauler for trash and recycling collection, and set out their trash and recyclables in cans, carts or bags at their curb, or under certain circumstances, at their backdoor. Haulers bill households directly for service at a rate agreed upon by the hauler and household;
Roughly 6 percent of households set out refuse and recyclables in cans, carts or bags at their curb (or under certain circumstances at the backdoor), but the service is paid for under a single account organized by a homeowner association, property manager or other entity representing a group of households for the service. These arrangements enjoy lower prices because the hauler can service multiple households next door to one another and issue a single invoice for service;
Roughly 20 percent of households have containerized service where their refuse and in some cases, recycling, is consolidated in shared 2 – 12 yard containers and collected on a regular schedule, mostly weekly but in some cases twice per week (Note that in some cases individual households opt for containerized service);
Roughly 13 percent of households use the CSWD drop-offs for their trash and recycling, paying on a per bag basis;
Roughly 2 percent (Westford and a portion of Underhill) have organized refuse and recycling collection through a municipal agreement or contract with a single hauler;
Burlington has organized weekly recycling collection using City employees; and,

11 Analysis of Consolidated Collection Systems for the Chittenden Solid Waste District Final Report – January 20, 2012
The balance of households either bring their refuse to work, direct haul it to the transfer station or do something else with their refuse (such as use another household’s collection service, take it out of the District or burn or bury their refuse).
For recycling, based on surveys carried out by the CSWD, 95 percent of the material recycled at the drop-offs and roughly 50 percent of CSWD material delivered to the three MRFs located in the District (e.g. CSWD MRF, Gauthier’s MRF and the Casella Lakeside MRF, which closed in August 2009) is assumed to be residential. The balance comes from businesses. Based on surveys carried out by the CSWD at both transfer stations, roughly 55 percent of the MSW disposed in the District is assumed to be residential,1 and the balance of refuse disposed from the commercial sector. In addition, three of the haulers operating in the District collected 92 percent of the MSW collected in 2009 by commercial haulers. Under the current recycling system, some households are assumed to be using recycling carts. While the number is growing, it is assumed that currently about 45 percent of the subscription curbside households are using carts. Commercial Collection System There are roughly 6,000 establishments in the CSWD employing 92,300 employees during 2009. These establishments were estimated to dispose of 41,000 (rounded) tons of MSW in CY 2009, and to recycle 12,900 tons (rounded) of paper and containers through recycling facilities located in the District. This excludes recycling through backhauls and brokers who purchase material directly from businesses which is assumed to continue in the CSWD under any consolidated collection system. While there are 19 haulers that serve the District, only 6 have regular commercial accounts and 3 haulers collect more than 95 percent of commercial refuse (and recyclables). Waste disposal rates by employee vary dramatically across industries. Haulers reported having roughly 7,400 commercial customers but include in this estimate residential waste that is containerized, or that is collected as part of a joint account encompassing groups of residents such as mobile home parks and condominium complexes, as described above. Commercial waste collection assumptions were made for this analysis based on the estimated tons and volume of material collected from commercial establishments, and the assumed prices charged per cubic yard, as discussed below. These assumptions are subject to more uncertainty than the assumptions about residential refuse and recyclables collection because the haulers keep more proprietary data on their commercial accounts, and because there is greater variation in this sector of generators.
1 CSWD surveys found that 53% of refuse delivered by haulers to transfer stations was residential and that 95% of
waste brought to the CSWD drop-offs was residential, which combines for an estimated 55% of MSW in 2009.

12 Analysis of Consolidated Collection Systems for the Chittenden Solid Waste District Final Report – January 20, 2012
Assumptions for Current Collection System (Base Case)
The following assumptions were used to estimate costs, materials recovery and environmental impacts associated with the current system (Base Case) and carried through to complete the analysis of the three consolidation options.
Population and Households by Municipality DSM used 2010 US Census Data available from the Vermont Data Center for population and total households by municipality, as follows in Table 2. The number of households by municipality exclude both the population living in group quarters and unoccupied dwelling units.
Table 2 Population by Municipality and Density Classification
Source: Vermont State Data Center (2010 Census)
Town Population 1 Density 2 Households
Burlington 42,417 Urban/Suburban 16,119
Essex Town and Village 19,587 Suburban 7,887
South Burlington 17,904 Suburban 7,987
Colchester 17,067 Suburban 6,314
Milton 10,352 Suburban/Rural 3,889
Williston 8,698 Suburban 3,514
Shelburne 7,144 Suburban 2,880
Winooski 7,267 Urban/Suburban 3,197
Jericho 5,009 Suburban/Rural 1,881
Hinesburg 4,396 Suburban/Rural 1,737
Richmond 4,081 Suburban/Rural 1,586
Charlotte 3,754 Suburban/Rural 1,419
Underhill 3,016 Rural 1,133
Westford 2,029 Rural 757
Huntington 1,938 Rural 753
Bolton 1,182 Rural 487
St. George 674 Rural 275
Total: 156,515 61,815 1) Population includes population living in group quarters, which is excluded from household totals. 2) Population density used to estimate route size.

13 Analysis of Consolidated Collection Systems for the Chittenden Solid Waste District Final Report – January 20, 2012
Quantity of Material Collected from Residential and Commercial Generators As illustrated in Table 3 below, 92,800 tons of MSW (rounded) were disposed from District generators in CY 2009. Of that, 4,800 tons of MSW (rounded) came from the CSWD drop-offs and the balance was collected by licensed haulers, delivered by cash customers using transfer stations located in the District or hauled directly to landfills. The District surveyed haulers in the spring of 2010 to estimate the percent disposed from residential versus commercial generators. The District also surveyed haulers using the CSWD MRF in 2007. The Project Team relied on the District surveys to develop estimates of residential MSW and recyclables and of commercial MSW and recyclables presented in Table 3.
Table 3 Residential and Commercial Refuse and Recycling Quantities (Annual Tons)
Total MSW
Disposed 1
Drop-off MSW
Disposed 2
Total
Recycling 3Drop-off
Recycling 4
(tons) (tons) (tons) (tons)
Residential 51,500 4,600 14,400 3,000
Commercial 41,300 200 12,900 200
Total: 92,800 4,800 27,300 3,200
Annual Tons of Material
Managed
1) Total MSW Disposed represent all CY 2009 totals for the CSWD, rounded, and are allocated as residential vs.
commercial based on CSWD survey data. Residential MSW includes all waste from the residential sector even in instances where private haulers classify collection activity as commercial accounts.
2) Drop-off MSW Disposed from CSWD Drop-offs during CY 2009, rounded, and are a subset of Total MSW Disposed.
3) Total reported 2009 recycling of Mandatory Recyclables at CSWD MRF, Gauthier's and Casella’s Lakeside Facilities. Excludes recycling through paper brokers and backhauling. Rounded to emphasize that residential vs. commercial recycling is estimated. Residential recycling includes all recycling from the residential sector even in instances where private haulers classify activity as commercial accounts.
4) Drop-off recycling collected at CSWD Drop-offs during CY 2009, rounded, and are a subset of Total Recycling.
Frequency of Curbside Collection Data do not exist on the percent of households receiving weekly versus bi-weekly collection. After consulting haulers for input, DSM has assumed for subscription curbside service that 80% of households receive weekly refuse collection and 20% receive bi-weekly refuse collection, and that 55% of households receive weekly recycling collection and 45% receive bi-weekly collection.

14 Analysis of Consolidated Collection Systems for the Chittenden Solid Waste District Final Report – January 20, 2012
Types of Collection Service and Estimates of Households Served Table 4 lists the current types of refuse (and recycling) collection available in the CSWD and estimates of the number of households served under each type. These estimates are critical to the estimates of the total cost of the current system.
Table 4 Households Served by Type of Collection Service
Collection Service Households
1 Description
Drop-offs 8,100 Drop-off use for refuse and recycling is estimated at 13% of total households (Source: CSWD).
Subscription - single unit account 35,100
Subscription curbside customers are estimated based on hauler surveys adjusted by US Census, City of Burlington hauler data and MSW tonnage data by truck type and hauler.
Subscription - multi-unit account 3,800
Cart and curb customers in condominium and mobile home parks on a single, multi-unit account (not individual subscription) are based on Census housing type data (e.g. 60% of "1 unit attached", 40% of "mobile homes").
Containerized Collection 12,400
Containerized curbside households are estimated based on Census housing type data (e.g. All 5-unit or more, 20% of 1 unit attached and 25% of mobile homes).
Self Haul to Transfer Stations 200
Self- haul to transfer stations is estimated based on tonnage from cash customers at Transfer Station.
Other 1,000 Some households (1.5 percent) are assumed to use roll-offs, bring refuse to work, or find other methods for disposal.
Organized Collection 1,200 Westford and Underhill households which have organized collection.
2
Total: 61,800
1) Numbers are rounded to reflect estimates. 2) Not all Underhill households have organized collection.
Curbside Collection Route Size
Another important factor in the cost of providing collection service is the route size, which is influenced by a number of factors, including housing density, street configuration and geographic factors, stop density if multiple haulers are serving the same neighborhoods, number and type of customers, truck type and capacity, number of workers on the truck, and distance to disposal or transfer location. Table 5 presents the baseline route size estimates by density classification (Table 2) used as the baseline scenario in the collection model. These route sizes are based on DSM’s best professional judgment given all of the variables described above. Haulers participating in the Franchise Study Committee were asked to review these in advance because of the critical nature of this assumption.

15 Analysis of Consolidated Collection Systems for the Chittenden Solid Waste District Final Report – January 20, 2012
Table 5
Average Residential Subscription Route Size by Population Density
Density
Average Customers
Per Route
Urban/Suburban 400
Suburban 325
Suburban/Rural 275
Rural 200
Cost Assumptions
Cost/price assumptions were made based on surveys conducted by the CSWD with licensed haulers. Average prices charged for subscription and containerized services were reported and are shown below in Table 6. In addition, DSM surveyed residential accounts that are typically classified as commercial to determine the prices paid for use in the model. Also shown are the costs or prices paid in Westford, Underhill, Burlington and at the drop-off that were used to complete the estimate of the current cost of the baseline residential and commercial collection system.
Table 6 Residential Collection Costs/Prices Assumptions 1
Collection Method Unit Cost/Unit
($) Lbs/Unit 2
Drop-off Customers Bag $3.25 22
Self-Haul to Transfer Station Ton $230
Subscription Curbside
Weekly HH/Month 3 $34
Bi-weekly HH/Month $25
Commercial Accounts
Per set-out HH/Month $11
Containerized 4 Cubic Yard $85 150
Contracted / Organized
Westford Month 5 $16,100
Underhill Bag $5 25
Recycling Only
City of Burlington HH/Month $3.10
1) Including disposal cost. 2) Lbs/unit assumptions were made where necessary to estimate total costs. 3) “HH/Month” is the average household price paid per month for the service. 4) Containerized costs were based on surveys and reflect average per yard prices for weekly and
twice weekly collection of 4 yard containers. 5) This contract cost the Town of Westford roughly $16,100 per month in 2010.

16 Analysis of Consolidated Collection Systems for the Chittenden Solid Waste District Final Report – January 20, 2012
Commercial Collection Costs Total commercial collection costs are difficult to estimate as there are substantial variations in commercial prices charged by individual haulers depending on location, type of containers leased, type and weight of waste requiring collection, proximity to other generators, collection frequency, length of contracted service, collection fleet available, and the negotiating skills of each company. However, in a 2005 Pricing Study carried out by DSM (See “The Price of Solid Waste Management Services in Vermont”, July 2005), the range of prices reported throughout the state for containerized service was relatively small, indicating that most businesses throughout the state can receive similar service for similar prices. Estimating total commercial collection costs in the CSWD required DSM to apply an average per yard monthly cost to the quantities of refuse collected from the commercial sector. DSM used the results of a confidential CSWD survey conducted in 2010, which yielded an average price of $77 per cubic yard per month. The average was adjusted up for restaurants, where dense waste would command higher collection/disposal costs. It was further assumed that commercial waste has an average density of 150 pounds per cubic yard for all sectors but restaurants, and that the typical collection frequency is between 4 and 6 times per month. In reality, commercial collection is often more frequent than weekly, and many containers are not full when collected, so using lower density coefficients (lbs per cubic yard) and higher collection frequencies would produce a similar outcome. Disposal and Processing Costs Recyclables processing costs at the CSWD MRF are the same for both the residential and commercial sector. Refuse disposal costs also do not differ for residential vs. commercial waste, but haulers do pay different prices for refuse disposal depending on arrangements they have made, or in the case of one hauler, access to a transfer and disposal facility owned by the same company. All haulers must pay the same per ton surcharge for waste generated in the District. On average, as result of these different arrangements for disposal, DSM has assumed a tip fee for refuse of $87 per ton. An average tip fee for processing recyclables at the CSWD MRF was assumed to be $0 per ton and therefore no processing cost is shown in the cost tables.

17 Analysis of Consolidated Collection Systems for the Chittenden Solid Waste District Final Report – January 20, 2012
Total Costs of Base Case
Applying the assumptions described above, the costs of the current residential collection system are shown below in Table 7. Also shown are the costs per ton collected and the cost per household served for each type of service. Note that in all cases except for containerized waste, the cost of recycling is built into the prices for refuse collection. Even in Burlington where the City provides recycling collection, the cost of $3.10 per unit per month is charged to licensed refuse haulers who are asked to pass that on to their refuse customers and remit monthly fees to the City.
Table 7 Residential Refuse and Recycling Costs
Estimated Tons
Collected
Unit Price
Charged Total Cost Cost/Ton
Average
Cost/HH/Year
Collection Method (tons) ($) ($) ($) ($)
Refuse and Recycling (Except
Recycling costs below) (Refuse tons)
Drop-off Customers 1 8,100 4,600 $3.25 per bag $1,359,100 $295 $168
Transfer Station Customers 200 200 $230 per ton $46,000 $230 $230
Self Haul Costs 2 8,300 4,800 $0.51 per mile $844,560 $176 $102
Subscription Curbside
Weekly 28,100 29,100 $34 per HH/month $11,464,800 $394 $408
Bi-weekly 7,000 6,600 $25 per HH/month $2,100,000 $318 $300
Commercial Accounts 3
Individual set-outs 3,800 2,600 $12 per HH/month $547,200 $210 $144
Containerized 12,400 6,200 $85 per HH/month $1,626,900 $262 $131
Roll-off Customers, Other 4, 5 1,000 1,000 NA $0 NA NA
Contracted / Organized
Westford 750 800 $16,100 per month $193,200 $242 $258
Underhill 450 400 $5.00 per bag $175,700 $439 $390
Subtotal: 5 60,800 50,500 $18,357,460 $364 $307
Recycling Only (Recycling tons)
Containerized Recycling 12,400 1,500 $28.75 per yard/month $167,200 $111 $13
All Other Recycling 6 48,400 12,900 $0
Subtotal, Recycling Only: 60,800 14,400 $167,200
(Total tons)
Total Residential Costs: 7 60,800 64,900 $18,524,700 $285 $305
Unit TypeHouseholds
Included above
1) Total costs based on an estimated 22 pounds per bag. 2) Costs to households to drive to Drop-offs. Refer to Table 9 for a breakdown of costs and discussion. 3) Includes all residential service classified as commercial service by haulers. 4) All other households that use roll-offs, bring refuse to work, or dispose without paying. 5) Estimated roll-off households and tons are shown in table, but the households, tons and the costs are excluded
from totals as this activity is expected to continue under alternative systems. 6) Refuse costs above include the cost of recycling collection for all but containerized households. 7) Costs are rounded to reflect estimates made. Average costs per household (per year) reflect the costs to serve
60,800 households since 1000 households are assumed to use other services at a cost not included in the baseline system (except for some of the waste that may be included in commercial front load service).

18 Analysis of Consolidated Collection Systems for the Chittenden Solid Waste District Final Report – January 20, 2012
Table 8 Commercial Refuse and Recycling Costs
Number of
Establish- Tons
Unit Price
Charged Total Cost Cost /TonCollection Method ments 1
(tons) ($) Unit Type ($) ($)
Refuse
Drop-off Customers 2 133 200 $3.25 per bag 18,182 $59,100 $296
Self Haul Costs 3 200 $0.51 per mile 41,496 $21,200 $106
Can and Toter Curb Collection 4 2,700 4,100 $394 per ton NA $1,615,300 $394
Containerized includes: 5 3,000 26,200 $99 per yard/month 299,429 $4,917,600 $188
Restaurants 6,550 $200 per yard/month 32,750 $818,750 $125
Offices, Retail 6,550 $77 per yard/month 104,800 $1,876,651 $287
Manufacturing 6,550 $77 per yard/month 74,857 $960,667 $147
All Other 6,550 $77 per yard/month 87,333 $1,120,778 $171
Roll-off Customers 6 160 10,800 (6)
Subtotal: 5,993 30,500 $6,613,200 $217Recycling
Drop-off 200 Included above
Toter Recycling 7 3,175 $10 per yard 52,917 $542,800 $171
Containerized Recycling 9,525 $22 per yard/month 158,750 $796,100 $84
Subtotal, Recycling Only: 12,900 211,667 $1,338,900 $104
Total Commercial Costs: 43,400 $7,952,100 $183
Number of
Units 2
1) Total establishment counts from VT Dept of Labor. Rough estimates are then made by customer type. 2) Units for drop-off customers are bags at an average of 22 lbs per bag. All others are loose cubic yards
calculated using an average refuse density of 175 lbs/yard. 3) Costs for small businesses to drive to Drop-offs. Refer to Table 9 for a breakdown of costs and discussion. 4) Can and toter curb refuse collection prices assumed to be the same calculated per ton price as weekly
residential subscription. Tons collected assumed to be 10% of commercial total. 5) Containerized tons collected are the balance of total commercial tons minus roll-off, drop-off and can/toter
curb tonnage estimates. Prices assumed were $77 per yard for all sectors but restaurants. Per yard price assumes 6 collections per month, and when divided by 6 and multiplied by the estimated yards total the estimated costs of service. Total price shown for containerized service is averaged from all four sectors shown below with densities ranging from 125 lbs/yd3 (for offices) to 400 lbs/yd3 (for restaurants) resulting in different costs per yard collected. For Manufacturing, 175 lbs/yd3 was used and for All Other, 150 lbs/yd3.
6) Estimated roll-off tons are shown in table but cost and tons are excluded from total as this activity is expected to continue under alternative systems.
7) Tons of recycling collected using toters assumed to be 25 percent. Price per 64 gallons assumed to be $3.25 per unit from 2005 Pricing Study.
Self Transport Costs Included in Tables 7 and 8 are the costs of self-transport inherent in the current system. These are the hidden costs to households and small businesses to deliver their refuse and recycling to drop-off centers or transfer stations. These costs have been estimated based on the number of customers assumed to use drop-off and transfer stations. While these costs are outside of the prices paid for current collection (and disposal) service, they do represent costs incurred with the current system and should be accounted for when considering system changes.

19 Analysis of Consolidated Collection Systems for the Chittenden Solid Waste District Final Report – January 20, 2012
Table 9 shows the estimated costs to households and small businesses that deliver refuse and recyclables to drop-off centers and transfer stations. The IRS rate of 51 cents per mile is used, and total miles are estimated by separating out only miles that would be associated with a special trip to deliver refuse or recycling. This is an area where DSM has surveyed users over the past 20 years, and provides a reasonable, order of magnitude estimate for the cost in the CSWD.
Table 9 Self-Haul Cost Estimates
Refuse
Tons
Collected
Annual
Miles Per
Customer 2, 3
Cost Per
Mile 4
Annual
Cost Per
Customer Total Cost
Cost Per
Ton
Collection Method (tons) (miles) ($) ($) ($) ($)
Residential Drop-off Customers 8,100 4,600 200 $0.51 $102 $826,200 $180
Residential Self Haul to Transfer
Station 200 200 180 $0.51 $92 $18,360 $92
Commercial Drop-off Customers 133 200 312 $0.51 $159 $21,163 $106
Total Self Haul Cost Estimates: 5,000 $865,723 $173
Households/
Customers 1
1) Customer is a household or a small business using a drop-off, or a household using a transfer station. The
number of residential self haul and commercial drop-off customers are unknown and estimated based on total tons collected at the drop-offs.
2) Annual miles are miles driven for the sole purpose of dropping off refuse and/or recycling. 3) Estimates of annual miles are based on prior DSM survey work of users of drop-off refuse and recycling centers,
and survey data from two CSWD drop-offs. 4) The 2011 IRS reimbursement rate per mile traveled.
Total System Costs Adding together the residential and commercial refuse and recycling collection and disposal cost estimates (Tables 7 and 8) provides an estimate of the current total system cost (price paid) for residential and commercial municipal solid waste management in the CSWD, as summarized in Table 10. As illustrated by Table 10, total system costs (exclusive of roll-off waste) are estimated to have been approximately $26.5 million in 2010.
Table 10 Summary of Total Baseline System Costs
Refuse 1 Recycling
Total Tons
Collected in Total Cost
Cost Per
Ton
Refuse and Recycling (tons) (tons) (tons) ($) ($)
Residential 50,500 14,400 64,900 $18,524,700 $285
Commercial 30,500 12,900 43,400 $7,952,100 $183
Total: 81,000 27,300 108,300 $26,476,800 $244
1) Exclusive of all roll-off waste and ‘other’ residential solid waste collected in the CSWD and totaling 11,800 tons, which would be expected to continue to be managed in the current manner under any consolidated collection system.

20 Analysis of Consolidated Collection Systems for the Chittenden Solid Waste District Final Report – January 20, 2012
Residential collection, processing and disposal are estimated to represent 70 percent of total system costs, or $18.5 million (rounded, including self haul costs), even though residential waste generation (refuse and recycling) represent only 60 percent of municipal solid waste (excluding roll-off waste). In contrast, commercial collection, processing and disposal is estimated to represent 30 percent of total system costs, or $8 million (rounded), even though commercial refuse and recycling represents an estimated 40 percent of municipal solid waste (excluding roll-off waste which is not included in this analysis). Table 11 and 12 summarize this comparison of tons and costs. The conclusion from an examination from Tables 10, 11 and 12 is that consolidation of residential waste is the logical first step in any type of cost saving effort.
Table 11 Comparison of Residential and Commercial Waste Volume (Weight) and Costs
Percent of
Generation 1
Percent of
Cost 1
Refuse and Recycling (%) (%)
Residential 60% 70%
Commercial 40% 30% 1) Excludes all roll-off and 'other' residential solid waste collected in CSWD (totaling an estimated 11,800 tons)
which are expected to continue to be managed in the current manner.
Table 12 Comparison of Residential and Commercial Waste Cost Per Ton Managed
Collection
Cost Per Ton 1
Collection as
Percentage of
Total Cost Per Ton
Average Processing
and Disposal Cost
Per Ton 2
Processing and Disposal
as Percentage of Total
Cost Per Ton
Total Cost
Per Ton
Refuse and Recycling ($) (%) ($) (%) ($)
Residential $218 76% $68 24% $285
Commercial $122 67% $61 33% $183 1) Represents the average per ton collection cost for refuse and recycling combined and is calculated by dividing
total estimated costs to collect refuse and recycling by the total tons of refuse and recycling collected.
2) Represents the average per ton cost to either process or dispose of refuse and recycling and is calculated by dividing the total (annual) estimated disposal and processing costs by the total tons of refuse and recycling managed. Note that average disposal costs in the District are assumed to be $87 per ton, and average processing fees are assumed to be $0 per ton.

21 Analysis of Consolidated Collection Systems for the Chittenden Solid Waste District Final Report – January 20, 2012
Consolidated Collection Alternatives
Introduction Alternative collection models were designed based on discussions with the CSWD staff and the Franchise Study Committee to analyze the potential impact of consolidating collection. All of the alternatives analyzed incorporate the following assumptions:
Roughly 15 percent of households are assumed to continue to use the drop-off collection system exclusively and these costs are included in the consolidated collection system for refuse and recycling;
Geographic collection zones or districts are defined and assumed to be served by one hauler on a regular collection schedule;
Collection route sizes (e.g. number of households served) are assumed to increase for all collection routes (except for Burlington recycling) because of the increased collection density achieved in each collection zone;
Recycling quantities are assumed to increase in all cases because of the consistency of recycling collection service, the ability to have more uniform education programs with a single hauler in each collection zone, the embedded recycling charges (recycling costs are embedded in one fee for refuse collection), and the use of large volume carts on most curbside routes;
Two collection vehicles (one for refuse and one for recycling) would be used in most cases (although some dual collection vehicles would be used) because truck capacity would be a greater factor in collection efficiency on the denser routes;
All haulers are assumed to face the same transfer or landfill disposal fee, eliminating the unknown variable of separate negotiated tipping fees and/or internal tipping fee accounting; and,
The recycling processing fee is assumed to be $0.00.
Collection Zones The District was broken into seven zones, or collection districts, for the purposes of this analysis. These zones are assumed to have both residential and commercial customers, and curbside and containerized collection. In rural towns, it is assumed that any containerized collection would be handled by a rear load truck.
22 Analysis of Consolidated Collection Systems for the Chittenden Solid Waste District Final Report – January 20, 2012
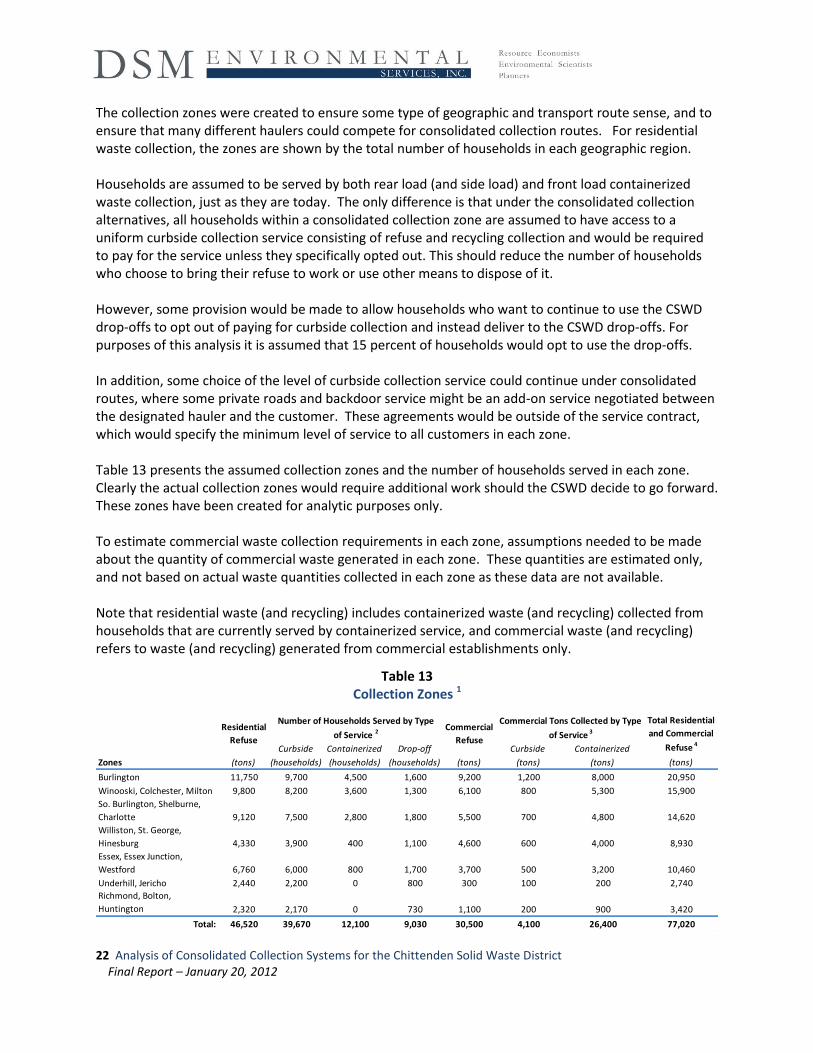
The collection zones were created to ensure some type of geographic and transport route sense, and to ensure that many different haulers could compete for consolidated collection routes. For residential waste collection, the zones are shown by the total number of households in each geographic region. Households are assumed to be served by both rear load (and side load) and front load containerized waste collection, just as they are today. The only difference is that under the consolidated collection alternatives, all households within a consolidated collection zone are assumed to have access to a uniform curbside collection service consisting of refuse and recycling collection and would be required to pay for the service unless they specifically opted out. This should reduce the number of households who choose to bring their refuse to work or use other means to dispose of it. However, some provision would be made to allow households who want to continue to use the CSWD drop-offs to opt out of paying for curbside collection and instead deliver to the CSWD drop-offs. For purposes of this analysis it is assumed that 15 percent of households would opt to use the drop-offs. In addition, some choice of the level of curbside collection service could continue under consolidated routes, where some private roads and backdoor service might be an add-on service negotiated between the designated hauler and the customer. These agreements would be outside of the service contract, which would specify the minimum level of service to all customers in each zone. Table 13 presents the assumed collection zones and the number of households served in each zone. Clearly the actual collection zones would require additional work should the CSWD decide to go forward. These zones have been created for analytic purposes only. To estimate commercial waste collection requirements in each zone, assumptions needed to be made about the quantity of commercial waste generated in each zone. These quantities are estimated only, and not based on actual waste quantities collected in each zone as these data are not available. Note that residential waste (and recycling) includes containerized waste (and recycling) collected from households that are currently served by containerized service, and commercial waste (and recycling) refers to waste (and recycling) generated from commercial establishments only.
Table 13 Collection Zones 1
Curbside Containerized Drop-off Curbside Containerized
Zones (tons) (households) (households) (households) (tons) (tons) (tons) (tons)
Burlington 11,750 9,700 4,500 1,600 9,200 1,200 8,000 20,950
Winooski, Colchester, Milton 9,800 8,200 3,600 1,300 6,100 800 5,300 15,900
So. Burlington, Shelburne,
Charlotte 9,120 7,500 2,800 1,800 5,500 700 4,800 14,620
Williston, St. George,
Hinesburg 4,330 3,900 400 1,100 4,600 600 4,000 8,930
Essex, Essex Junction,
Westford 6,760 6,000 800 1,700 3,700 500 3,200 10,460
Underhill, Jericho 2,440 2,200 0 800 300 100 200 2,740
Richmond, Bolton,
Huntington 2,320 2,170 0 730 1,100 200 900 3,420
Total: 46,520 39,670 12,100 9,030 30,500 4,100 26,400 77,020
Number of Households Served by Type
of Service 2
Commercial Tons Collected by Type
of Service 3Commercial
Refuse
Residential
Refuse
Total Residential
and Commercial
Refuse 4

23 Analysis of Consolidated Collection Systems for the Chittenden Solid Waste District Final Report – January 20, 2012
Table 13 Notes:
1) Numbers for residential refuse tons do not equal previous tables due to a reduction in refuse set out which is now picked up as recycling in all the alternatives analyzed, and a very small amount of waste reduction assumed to occur from unit based pricing. Numbers also may not equal other tables due to rounding.
2) Curb households are assumed to have curbside (bag or cart) service, and containerized households are assumed to use 2 – 12 yard containers for service. Curb and containerized households and tons managed per zone are estimated based on total number of occupied dwelling units in each zone and housing stock, and on baseline quantities estimated.
3) Roughly 10 percent of commercial tons are assumed to be collected by the same method as residential curbside refuse, with the balance of waste collected containerized.
4) Excludes all roll-off and 'other' residential solid waste collected in CSWD (totaling 11,800 tons) which are expected to continue to be managed in the current manner. Includes commercial refuse tons as analyzed under Options 1 and 3. Option 2 has an increase in commercial recycling, and a decrease in commercial refuse.
Refuse and Recycling Quantities Collected Consolidation of collection routes will not, in and of itself, change recycling quantities. However, built into the model are changes designed to increase recycling as one of the outcomes of consolidation. These changes include:
Residential service includes provision of rolling carts to all households, and some type of PAYT pricing designed to incentivize households to recycle.
Commercial service has recycling costs embedded in refuse costs, with the provision of single stream recycling collection to all businesses generating significant quantities of recyclables.
The actual increase in quantities of recycling set out in each zone will vary based on current quantities recycled, and the amount of recyclables available (generated) in each zone. Because of the complexity of the current subscription collection system, recycling quantities are not available by geographic region except for Burlington and Westford’s curbside program data. For example, in the case of Burlington, curbside collection service is reported to be provided to all households (estimated by the City at 15,400) and 3,074 tons were reported collected for recycling during FY 2009, for an average of 400 pounds (rounded) per household served. However some Burlington residents may use CSWD’s drop-offs for recycling, adding to this average, and because of the demographics of Burlington (e.g. smaller households, lower household income, and lower owner occupancy), the available pounds of recyclables per household generated may be less than Williston or Charlotte. Household income, housing tenure and persons per household (e.g. household size) are all factors in the amount of recyclable material generated per household. DSM’s work in Boston and Cambridge, MA confirmed that lower income and multi-family households generated significantly less recyclable materials than single family, higher income households. Recycling data from numerous other studies also confirm this finding. Because of these complexities, detailed analysis of the potential for increased recycling in each municipality, and each zone, was not performed. However, based on benchmarking

24 Analysis of Consolidated Collection Systems for the Chittenden Solid Waste District Final Report – January 20, 2012
data from other regions with similar collection systems and with PAYT programs2, current residential recycling is assumed to rise from an estimated District-wide average of 466 pounds per household to a District-wide average of 620 pounds per household on curbside routes and 300 pounds per household on containerized routes. Drop-off tonnage is expected to increase slightly on a per household served basis because of the PAYT system in place throughout the District. The result is an estimated District-wide average of roughly 576 pounds per household, a 23.6 percent increase in recycling. In addition, commercial recycling is assumed to increase by 15 percent under consolidated routes because of embedded recycling costs and because all businesses are expected to receive uniform recycling collection service (e.g. weekly single stream toter or containerized collection). Finally, residential recycling quantities collected are expected to be the same under weekly and bi-weekly recycling collection for two reasons. First, carts sufficient to store two weeks of recyclables for the average household are assumed to be used for recycling. And second, because refuse collection will be offered every other week on the same schedule as recycling collection, there will be less incentive to set out recyclables in refuse which can be the case when refuse collection is weekly, and recycling collection is less frequent.
Option 1: District-wide Collection Contracts for Weekly Collection of all Residential Waste and Recyclables The first option analyzed was weekly collection of refuse and recyclables for all households with consolidated collection zones, as shown in Table 13. This option assumes that commercial waste would continue to be collected from haulers on a subscription basis. The cost of collection for each collection zone has been estimated based on route sizes (the number of households served per route), the number of routes and trucks necessary to service the zone and the estimated cost to operate each truck. For refuse, average annual operating costs (including capital, labor and admin, fuel, maintenance and profit) are estimated to be $220,000 per truck and for recycling, $200,000 per truck.3 In addition, it is assumed that there are 20 percent backup trucks available, and these trucks are included in the total trucks column and added in as contingency costs. While the number of backup trucks varies in the industry, DSM’s research found that some small fleets will have as many as 25 percent (or more) where some larger fleets will have as few as one for every 12 trucks operating. Our model assumes an average of 20 percent backup to be conservative. For containerized residential waste, cost estimates are based on DSM’s review of the literature and the reported savings from containerized route consolidation from 15% to 25% below the current prices. To be conservative, DSM used the lower end of the range and assumed that 15% savings were achieved in all zones for both containerized refuse and recycling collection.
2 For example, see recycling tonnage data from PAYT curbside and drop-off programs in Massachusetts and Model
City Profiles from the Climate Group initiative, Recycling Together. 3 Based on research from industry leaders and on DSM’s best professional estimate.
25 Analysis of Consolidated Collection Systems for the Chittenden Solid Waste District Final Report – January 20, 2012
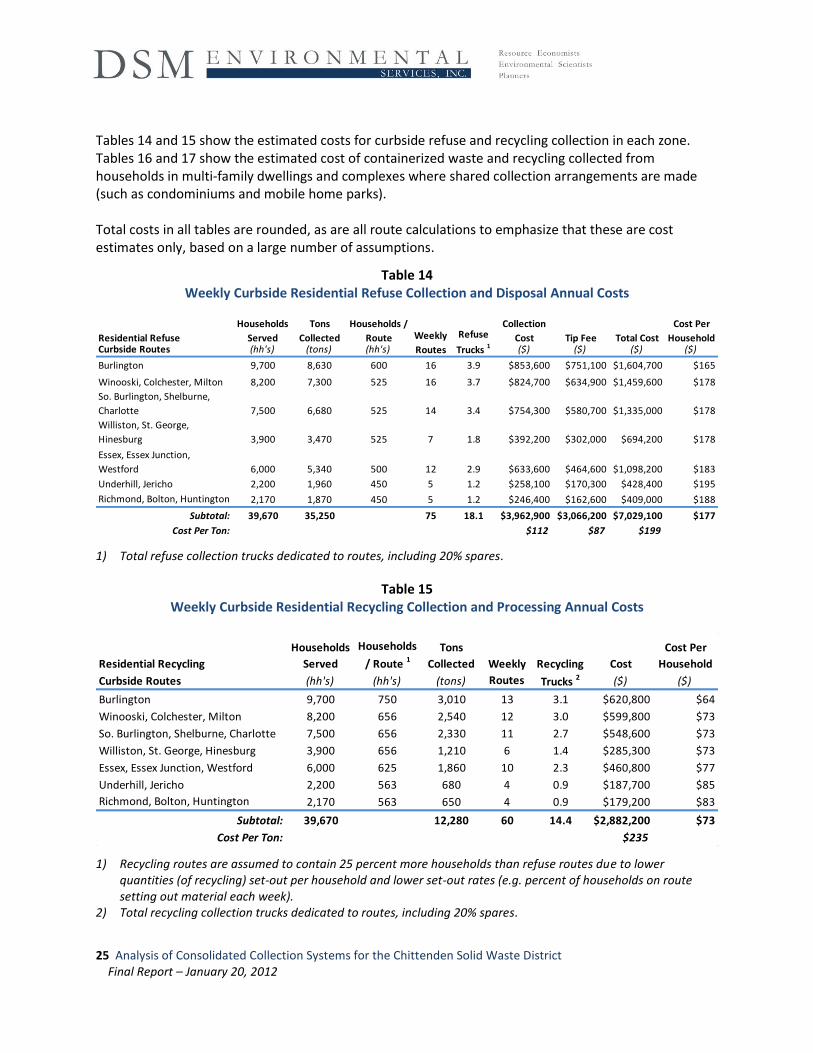
Tables 14 and 15 show the estimated costs for curbside refuse and recycling collection in each zone. Tables 16 and 17 show the estimated cost of containerized waste and recycling collected from households in multi-family dwellings and complexes where shared collection arrangements are made (such as condominiums and mobile home parks). Total costs in all tables are rounded, as are all route calculations to emphasize that these are cost estimates only, based on a large number of assumptions.
Table 14 Weekly Curbside Residential Refuse Collection and Disposal Annual Costs
Residential Refuse
Households
Served
Tons
Collected
Households /
Route
Collection
Cost Tip Fee Total Cost
Cost Per
HouseholdCurbside Routes (hh's) (tons) (hh's) ($) ($) ($) ($)
Burlington 9,700 8,630 600 16 3.9 $853,600 $751,100 $1,604,700 $165
Winooski, Colchester, Milton 8,200 7,300 525 16 3.7 $824,700 $634,900 $1,459,600 $178
So. Burlington, Shelburne,
Charlotte 7,500 6,680 525 14 3.4 $754,300 $580,700 $1,335,000 $178
Williston, St. George,
Hinesburg 3,900 3,470 525 7 1.8 $392,200 $302,000 $694,200 $178
Essex, Essex Junction,
Westford 6,000 5,340 500 12 2.9 $633,600 $464,600 $1,098,200 $183
Underhill, Jericho 2,200 1,960 450 5 1.2 $258,100 $170,300 $428,400 $195
Richmond, Bolton, Huntington 2,170 1,870 450 5 1.2 $246,400 $162,600 $409,000 $188
Subtotal: 39,670 35,250 75 18.1 $3,962,900 $3,066,200 $7,029,100 $177
Cost Per Ton: $112 $87 $199
Refuse
Trucks 1Weekly
Routes
1) Total refuse collection trucks dedicated to routes, including 20% spares.
Table 15 Weekly Curbside Residential Recycling Collection and Processing Annual Costs
Residential Recycling
Households
Served
Households
/ Route 1
Tons
Collected Weekly Cost
Cost Per
Household
Curbside Routes (hh's) (hh's) (tons) Routes ($) ($)
Burlington 9,700 750 3,010 13 3.1 $620,800 $64
Winooski, Colchester, Milton 8,200 656 2,540 12 3.0 $599,800 $73
So. Burlington, Shelburne, Charlotte 7,500 656 2,330 11 2.7 $548,600 $73
Williston, St. George, Hinesburg 3,900 656 1,210 6 1.4 $285,300 $73
Essex, Essex Junction, Westford 6,000 625 1,860 10 2.3 $460,800 $77
Underhill, Jericho 2,200 563 680 4 0.9 $187,700 $85
Richmond, Bolton, Huntington 2,170 563 650 4 0.9 $179,200 $83
Subtotal: 39,670 12,280 60 14.4 $2,882,200 $73
Cost Per Ton: $235
Recycling
Trucks 2
1) Recycling routes are assumed to contain 25 percent more households than refuse routes due to lower quantities (of recycling) set-out per household and lower set-out rates (e.g. percent of households on route setting out material each week).
2) Total recycling collection trucks dedicated to routes, including 20% spares.

26 Analysis of Consolidated Collection Systems for the Chittenden Solid Waste District Final Report – January 20, 2012
Table 16
Weekly Containerized Residential Refuse Collection and Disposal Annual Costs
Residential Refuse
Households
Served
Tons
Collected Yards Cost/Yard 1 Total Cost 2
Cost Per
Household
Containerized Routes 3(hh's) (tons) (yd3) ($) ($) ($)
Burlington 4,500 2,140 28,533 $72 $477,300 $106
Winooski, Colchester, Milton 3,600 1,710 22,800 $72 $381,400 $106
So. Burlington, Shelburne, Charlotte 2,800 1,330 17,733 $72 $296,600 $106
Williston, St. George, Hinesburg 400 190 2,533 $72 $42,400 $106
Essex, Essex Junction and Westford 800 380 5,067 $72 $84,800 $106
Subtotal: 12,100 5,750 76,667 $1,282,500 $106
Cost Per Ton: $223 1) Average monthly cost per yard of container size used for weekly collection and disposal of refuse. 2) Total costs = cubic yards collected multiplied by cost per yard, and then divided by 4.3 (collections per month). 3) Underhill, Jericho, Richmond, Bolton and Huntington are excluded as they are assumed not to have residential
containerized service. Note that Bolton does have containerized service at condominiums and trailer parks and this service may continue under front load service provided in Richmond or Bolton and treated as commercial waste.
Table 17 Weekly Containerized Residential Recycling Collection and Processing Annual Costs
Residential Recycling
Households
Served
Tons
Collected Yards Cost/Yard 1 Total Cost 2
Cost Per
Household
Containerized Routes 3(hh's) (tons) (yd3) ($) ($) ($)
Burlington 4,500 680 11,333 $24 $64,400 $14
Winooski, Colchester, Milton 3,600 540 9,000 $24 $51,100 $14
So. Burlington, Shelburne, Charlotte 2,800 420 7,000 $24 $39,800 $14
Williston, St. George, Hinesburg 400 60 1,000 $24 $5,700 $14
Essex, Essex Junction and Westford 800 120 2,000 $24 $11,400 $14
Subtotal: 12,100 1,820 30,333 $172,400 $14
Cost Per Ton: $95
1) Average monthly cost per yard of container size used for weekly collection and processing of recycling. 2) Total costs = cubic yards collected multiplied by cost per yard, and then divided by 4.3 (collections per month). 3) Underhill, Jericho, Richmond, Bolton and Huntington are excluded as they are assumed not to have residential
containerized service. Note that residents in these communities could be serviced as part of a commercial front load route.
Comparing Tables 14 – 17, recycling costs on a per ton basis are higher than refuse costs because of the lower truck payloads per route, and the lower quantities of material set out per household served. However annual per household costs for recycling are lower than refuse because total recycling costs (i.e. collection plus processing) are lower than total refuse costs (i.e. collection plus disposal) on a per household basis in large part due to the differential between refuse disposal and recyclables processing costs.

27 Analysis of Consolidated Collection Systems for the Chittenden Solid Waste District Final Report – January 20, 2012
Finally containerized collection costs are not lower because they are assumed to be a separate residential route serviced following specific guidelines as part of the consolidated collection system and any contract that may govern that system. The final cost of residential service is that to the households that choose to continue to use the drop-off centers (estimated to be 15 percent of total households). These costs are assumed to be the same on a per pound basis, based on the current per bag cost of $3.25. Table 18 shows these costs.
Table 18 Estimated Cost for Drop-off Households
Households
Refuse Tons
Delivered
Recycling Tons
DeliveredCost Per
Ton 1Cost Per
HH 2 Total Cost
Drop-off Collection Costs (hh's) (tons) (tons) ($) ($) ($)
Drop-off Centers 9,030 5,520 3,700 $295 $181 $1,630,920
Self Haul Costs 9,030 $102 $921,060
Subtotal: $283 $2,551,980 1) Based on an average weight of 22 pounds per bag of refuse at a cost of $3.25 per bag (or 14.8 cents per pound
of refuse disposed). The cost of recycling is included in this per bag refuse cost but the tons are not included in this cost per ton calculation. Cost per ton including 3700 tons of recycling would be estimated at $277 per ton.
2) Annual self haul cost estimates per household as shown in Table 9.
Total residential system costs under Option 1 are summarized in Table 19 below. Costs are lower in certain zones because of the route density and the amount of containerized waste assumed to be collected from households in certain zones. Also note that there is a decrease in refuse tons and an increase in recycling tons consistent with the assumptions made about an increase in recycling under the new consolidated route system. The total number of residential tons handled is the same as the baseline. An increase in both refuse and recycling tons is assumed for the drop-offs to represent the 15 percent of households assumed to use the drop-offs for both refuse and recycling. Recycling tons are expected to increase ten percent on a per household basis because of the changes in the entire system to increase recycling convenience and implement PAYT District-wide.

28 Analysis of Consolidated Collection Systems for the Chittenden Solid Waste District Final Report – January 20, 2012
Table 19
Total Estimated Residential System Costs Under Option 1
Refuse Tons
Recycling
Tons Refuse Costs
Recycling
Costs Total Cost
Total Cost /
Ton
Zone (tons) (tons) ($) ($) ($) ($)
Burlington 10,770 3,690 $2,082,000 $685,200 $2,767,200 $191
Winooski, Colchester, Milton 9,010 3,080 $1,841,000 $650,900 $2,491,900 $206
So. Burlington, Shelburne, Charlotte 8,010 2,750 $1,631,600 $588,400 $2,220,000 $206
Williston, St. George, Hinesburg 3,660 1,270 $736,600 $291,000 $1,027,600 $208
Essex, Essex Junction, Westford 5,720 1,980 $1,183,000 $472,200 $1,655,200 $215
Underhill, Jericho 1,960 680 $428,400 $187,700 $616,100 $233
Richmond, Bolton, Huntington 1,870 650 $409,000 $179,200 $588,200 $233
Subtotal: 41,000 14,100 $8,311,600 $3,054,600 $11,366,200 $206
Drop-offs 1 5,520 3,700 $2,551,980 $277
Total: 46,520 17,800 $13,918,180 $216
1) Recycling tons estimated based on current residential recycling tonnage at the drop-offs and an increase of 10 percent. Total costs from Table 18, including self-haul costs.
These costs can be compared against baseline residential system costs shown in Table 10 of $18.5 million (rounded) or a potential savings of $4.6 million (rounded). This represents a projected savings associated with residential route consolidation of roughly 25 percent which is consistent with literature reports on the impact of consolidating routes.4 For example, the seminal study on collection consolidation was The Organization and Efficiency of Solid Waste Collection conducted by Columbia University in 1975. This study surveyed solid waste management practices and costs in 2,060 communities ranging from 2,500 to 750,000 in population. One key conclusion was that “As a group, cities with contract collection had collection prices 43 percent lower than the group of cities with licensed, unregulated, or non-mandatory franchise collection.” While it can be argued that a lot has changed since 1975, including the consolidation of the refuse collection industry, recent examples of changing from unregulated or non-mandatory franchise collection still show an average reduction in residential collection costs ranging from 20 to 25 percent, which is entirely consistent with the cost comparison presented in Tables 10 and 19, above. Some examples include Wichita, Kansas, a comparison of Minneapolis and St. Paul (Minnesota), and Fountain Hill, Arizona. Note that these savings are mainly accrued through the curbside route consolidation, since the savings potential of containerized collection is lower.
4 Total residential system costs presented in Table 19 and the associated system cost savings do not include
commercial system costs which undergo no change under the analysis for Option, 1 but are included in Option 2. Table 19 also does not include increased District administrative costs as presented in Total System Cost Comparisons shown in Tables 28 and 29.

29 Analysis of Consolidated Collection Systems for the Chittenden Solid Waste District Final Report – January 20, 2012
It should be noted that these cost savings do not include the additional costs to the CSWD to manage bidding, contracts, enforcement and complaints which may add costs of $250,000 to $350,000 to the system and reduce total savings by this amount.
Option 2: District-Wide, Collection Contracts for Weekly Collection of Residential and Commercial Waste and Recyclables The second option for route consolidation is to include commercial collection as part of the contract in the collection zones. The costs of weekly collection of all commercial waste and recycling were estimated based on the following assumptions:
Roughly 10 percent of the commercial refuse (and recyclables) generated by small establishments is set out at the curb and collected by the same method as curbside residential waste, as it is currently. The same equipment and labor would be used to collect from these establishments.
The balance (90 percent of commercial refuse) would be collected as containerized waste, mostly in front load trucks but also in rear loaders and other trucks that can service containers from 2 – 12 yards.
While savings associated with consolidating commercial collection routes is not well documented, DSM’s review of the literature found reports of cost savings ranging from 10 – 40% for most businesses. However, some businesses experienced cost increases of 12 – 15 percent. This range would be specific to the negotiating ability of different businesses and the number of haulers from which businesses have the ability to choose, and negotiate. In the case of the CSWD, because a small number of haulers compete to service the larger businesses, potential savings may be limited. For this analysis, we have assumed the lower end of range at 15 percent savings for refuse collection in both curb and containerized arrangements.
Increases in recycling are expected to be between 15 and 20 percent, so 17.5 percent was used in the model. Because recycling costs are expected to be embedded into the cost of the service and all businesses are expected to receive uniform recycling collection service (e.g. weekly single stream cart, or containerized collection), more businesses are expected to participate in recycling and separate more materials.
Tables 20 and 21 below present the estimated cost of commercial collection of refuse and recyclables respectively in each collection zone under the consolidated routes.

30 Analysis of Consolidated Collection Systems for the Chittenden Solid Waste District Final Report – January 20, 2012
Table 20
Weekly Commercial Refuse Collection and Disposal Costs
Commercial
Refuse
Curbside
Cost / Ton
Total
Curbside Cost
Containerized
Yards
Cost /
Yard 2Containerized
Cost Total Cost
Commercial Refuse Zones (tons)
Curbisde
(tons)
Containerized
(tons) ($) ($) (yd3) ($) ($) ($)
Burlington 8,500 1,000 7,500 $335 $334,900 85,714 $84 $1,196,600 $1,531,500
Winooski, Colchester, Milton 5,600 700 4,900 $335 $234,400 56,000 $84 $781,800 $1,016,200
So. Burlington, Shelburne, Charlotte 5,100 600 4,500 $335 $200,900 51,429 $84 $717,900 $918,800
Williston, St. George, Hinesburg 4,300 500 3,800 $335 $167,400 43,429 $84 $606,300 $773,700
Essex, Essex Junction and Westford 3,400 400 3,000 $335 $134,000 34,286 $84 $478,600 $612,600
Underhill and Jericho 300 100 200 $335 $33,500 2,286 $84 $31,900 $65,400
Richmond, Bolton, Huntington 1,000 200 800 $335 $67,000 9,143 $84 $127,600 $194,600
Subtotal: 28,200 3,500 24,700 $1,172,100 282,286 $3,940,700 $5,112,800
Cost Per Ton: $335 $160 $181
Commercial Tons by
Service Type 1
1) Ten percent of commercial waste (by weight) is assumed to be collected at the curb, with the balance using
large containers (2 – 12 yard) serviced by front load or other specialized collection trucks. 2) Average monthly cost per yard of container size used for collection and disposal of refuse. Containerized cost is
calculated by multiplying containerized yards by cost per yard and dividing by 6 (average collections per month to account for specialized needs of certain businesses).
Table 21 Weekly Commercial Recycling Collection and Processing Costs
Commercial
Recycling
Curbside
Cost / Ton
Total
Curbside
Containerized
Yards Cost/Yard 2
Containerized
Cost Total Cost
Commercial Recycling Zones (tons)
Curbisde
(tons)
Containerized
(tons) ($) ($) (yd3) ($) ($) ($)
Burlington 4,600 500 4,100 $145 $72,700 69,000 $18 $294,100 $366,800
Winooski, Colchester, Milton 3,000 300 2,700 $145 $43,600 45,000 $18 $191,800 $235,400
So. Burlington, Shelburne, Charlotte 2,700 300 2,400 $145 $43,600 40,500 $18 $172,600 $216,200
Williston, St. George, Hinesburg 2,300 300 2,000 $145 $43,600 34,500 $18 $147,100 $190,700
Essex, Essex Junction, Westford 1,900 200 1,700 $145 $29,100 28,500 $18 $121,500 $150,600
Underhill, Jericho 160 20 140 $145 $2,900 2,400 $18 $10,200 $13,100
Richmond, Bolton, Huntington 510 50 459 $145 $7,300 7,650 $18 $32,600 $39,900
Subtotal: 15,200 1,700 13,500 $242,800 227,600 $969,900 $1,212,700
Cost Per Ton: $143 $72 $80
Commercial Tons by
Service Type 1
1) Ten percent of commercial recyclables (by weight) is assumed to be collected at the curb, with the balance
using large containers (2 – 12 yard) serviced by front load or other specialized collection trucks. 2) Average monthly cost per yard of container size used for weekly collection and disposal of recycling.
Containerized cost is calculated by multiplying containerized yards by cost per yard and dividing by 4.3 (collections per month).
Total commercial costs in Tables 20 and 21 show a savings of nearly 20 percent for commercial collection because more material is assumed to be collected as recycling (over the baseline) and commercial recycling is cheaper to manage on a per ton basis than refuse (average recycling cost of $80 per ton compared to $181 for refuse). This per ton difference is primarily the difference between tip and processing fees/revenues (at least $87 savings and more if the material is all paper) as containerized collection costs are similar for recycling and refuse because the same amount of recycling can be

31 Analysis of Consolidated Collection Systems for the Chittenden Solid Waste District Final Report – January 20, 2012
collected per stop when using the same large containers. Note that if this increase in recycling does not occur, savings would be limited to the 15 percent reduction in prices assumed from arranging collection zones. Total system costs for Option 2 are shown below in Table 22 and include estimated costs for weekly residential curbside and containerized collection as laid out under Option 1, as well as drop-off costs as outlined in Table 18.
Table 22 Total Estimated Residential and Commercial System Costs Under Option 2
Refuse Recycling Refuse Recycling Total Costs
Zones ($) ($) ($) ($) ($)
Burlington $2,082,000 $685,200 $1,531,500 $366,800 $4,665,500
Winooski, Colchester, Milton $1,841,000 $650,900 $1,016,200 $235,400 $3,743,500
So. Burlington, Shelburne, Charlotte $1,631,600 $588,400 $918,800 $216,200 $3,355,000
Williston, St. George, Hinesburg $736,600 $291,000 $773,700 $190,700 $1,992,000
Essex, Essex Junction, Westford $1,183,000 $472,200 $612,600 $150,600 $2,418,400
Underhill, Jericho $428,400 $187,700 $65,400 $13,100 $694,600
Richmond, Bolton, Huntington $409,000 $179,200 $194,600 $39,900 $822,700
Subtotal: $8,311,600 $3,054,600 $5,112,800 $1,212,700 $17,691,700
Tons: 41,000 14,100 28,200 15,200 98,500
Cost Per Ton: $203 $217 $181 $80 $180
Drop-off Costs (From Table 18): $2,551,980
Drop-off Tons: 5,520 3,700 9,220
Cost Per Ton: $277
Total Costs: $20,243,680
Tons: 46,520 17,800 28,200 15,200 107,720
Cost Per Ton: $188
CommercialResidential
As illustrated by Table 22, it is estimated that consolidation of residential and commercial collection would reduce total system costs by roughly 24 percent. However, the bulk of the savings comes from consolidation of the residential routes, not the commercial collection routes for two reasons. First, residential collection, processing and disposal represent roughly 70 percent of total current system costs. Second, the expected savings are greater for residential collection consolidation (at 25 percent) compared to commercial collection at an estimated 20 percent.

32 Analysis of Consolidated Collection Systems for the Chittenden Solid Waste District Final Report – January 20, 2012
Option 3: District-Wide, Collection Contracts for Bi-Weekly Collection of all Residential Waste and Recyclables The third option analyzed was bi-weekly (every other week) collection of both refuse and recyclables from all residents in the CSWD. This option is similar to Westford’s recycling collection although recyclables collection is assumed to occur every other week instead of twice per month. Surveys performed with Westford residents about their satisfaction with the program were positive, but with four of the ten residents surveyed stating that waiting three weeks for recycling, which occurs in some months, was too long. (Westford does have weekly collection of refuse currently.) This option assumes that recyclables and refuse would be collected on the same day, but that depending on the collection zone, the contractor would have the option of collecting refuse one week and recyclables the next, but on the same day. Because carts are expected to be used for recyclables storage in most cases, or recyclables are expected to be containerized with properly sized containers, recycling quantities for collection are not expected to decrease from Option 1. The key to analysis of this Option is the assumption about truck capacity – because of the greater quantity of refuse and recyclables set out with bi-weekly collection. Analysis of two months of refuse weigh data in FY 2009 (April and October) indicated that loaded weight of material in rear load and front load trucks currently average 6.1 tons and 7.2 tons, respectively. These types of trucks handled an estimated 57% of MSW disposed. The difference between weekly and bi-weekly collection route sizes is that both truck capacity and on-route collection time enter into the equation with bi-weekly collection, while on-route collection time may be a greater factor (over truck capacity) in weekly routing. Therefore, with bi-weekly collection, we have assumed that truck payloads become the limiting factor along with collection time. In the denser areas, some trucks will have to tip during the collection day. For these reasons, we have shortened the routes to 65% of the weekly route assumptions.
Table 23 Bi-Weekly Curbside Residential Refuse Collection and Disposal Costs
Residential Refuse
Tons
Collected
Households /
Route
Collection
Cost Tip Fee Total Cost
Cost Per
Household
Curbside Routes (tons) (hh's) ($) ($) ($) ($)
Burlington 9,700 8,630 390 12 3.0 $656,600 $750,800 $1,407,400 $145
Winooski, Colchester, Milton 8,200 7,300 341 12 2.9 $634,400 $635,100 $1,269,500 $155
So. Burlington, Shelburne, Charlotte 7,500 6,680 341 11 2.6 $580,200 $581,200 $1,161,400 $155
Williston, St. George, Hinesburg 3,900 3,470 341 6 1.4 $301,700 $301,900 $603,600 $155
Essex, Essex Junction and Westford 6,000 5,340 325 9 2.2 $487,400 $464,600 $952,000 $159
Underhill and Jericho 2,200 1,960 293 4 0.9 $198,600 $170,500 $369,100 $168
Richmond, Bolton, Huntington 2,170 1,870 293 4 0.9 $195,900 $162,700 $358,600 $165
Subtotal: 39,670 35,250 58 13.9 $3,054,800 $3,066,800 $6,121,600 $154
Cost Per Ton: $87 $87 $174
Households
Served
(hh's)
Weekly
Routes
Refuse
Trucks 1
1) Total refuse trucks dedicated to routes, including 20% spares.

33 Analysis of Consolidated Collection Systems for the Chittenden Solid Waste District Final Report – January 20, 2012
Table 24 Bi-Weekly Curbside Residential Recycling Collection and Processing Costs
Residential Recycling
HH's /
Route
Tons
Collected Total Cost
Cost Per
Household
Cost Per
Ton
Curbside Routes (hh's) (tons) ($) ($) ($)
Burlington 488 3,010 9.9 2.4 $477,500 $49 $159
Winooski, Colchester, Milton 427 2,540 9.6 2.3 $461,400 $56 $182
So. Burlington, Shelburne, Charlotte 427 2,330 8.8 2.1 $422,000 $56 $181
Williston, St. George, Hinesburg 427 1,210 4.6 1.1 $219,400 $56 $181
Essex, Essex Junction and Westford 406 1,860 7.4 1.8 $354,500 $59 $191
Underhill and Jericho 366 680 3.0 0.7 $144,400 $66 $212
Richmond, Bolton, Huntington 366 650 3.0 0.7 $142,400 $66 $219
Subtotal: 12,280 46.3 11.1 $2,221,600 $56 $181
Weekly
Routes
Recycling
Trucks 1
1) Total recycling trucks dedicated to routes, including 20% spares.
For containerized residential refuse, bi-weekly collection savings are harder to estimate. This is because the same amount of refuse would need to be collected as in weekly collection, but a larger container would be necessary at each location to accommodate two weeks of refuse. Essentially truck capacity is the limiting factor in containerized collection, and in some settings, use of the larger refuse containers (e.g. 8-12 yards vs. 4-6 yards) and waiting two weeks for refuse collection may present challenges to consolidated collection. For these reasons, while the monthly per yard serviced cost is half of what weekly collection would cost, the cost per yard actually collected in Table 25 is the same as in weekly collection.
Table 25 Bi-Weekly Containerized Residential Refuse Collection and Disposal Costs
Residential Refuse
Households
Served
Tons
Collected Yards
Cost /
Yard 1Total
Cost 2Cost Per
Household
Cost Per
Ton
Containerized Routes (3) (hh's) (tons) (yd3) ($) ($) ($) ($)
Burlington 4,500 2,140 28,533 $36 $477,300 $106 $223
Winooski, Colchester, Milton 3,600 1,710 22,800 $36 $381,400 $106 $223
So. Burlington, Shelburne, Charlotte 2,800 1,330 17,733 $36 $296,600 $106 $223
Williston, St. George, Hinesburg 400 190 2,533 $36 $42,400 $106 $223
Essex, Essex Junction and Westford 800 380 5,067 $36 $84,800 $106 $223
Subtotal: 12,100 5,750 76,667 $1,282,500 $106 $223 1) Average monthly cost per yard of container size used for bi-weekly collection and disposal of refuse. 2) Total costs = cubic yards collected multiplied by cost per yard, and then divided by 2.15 (collections per month).
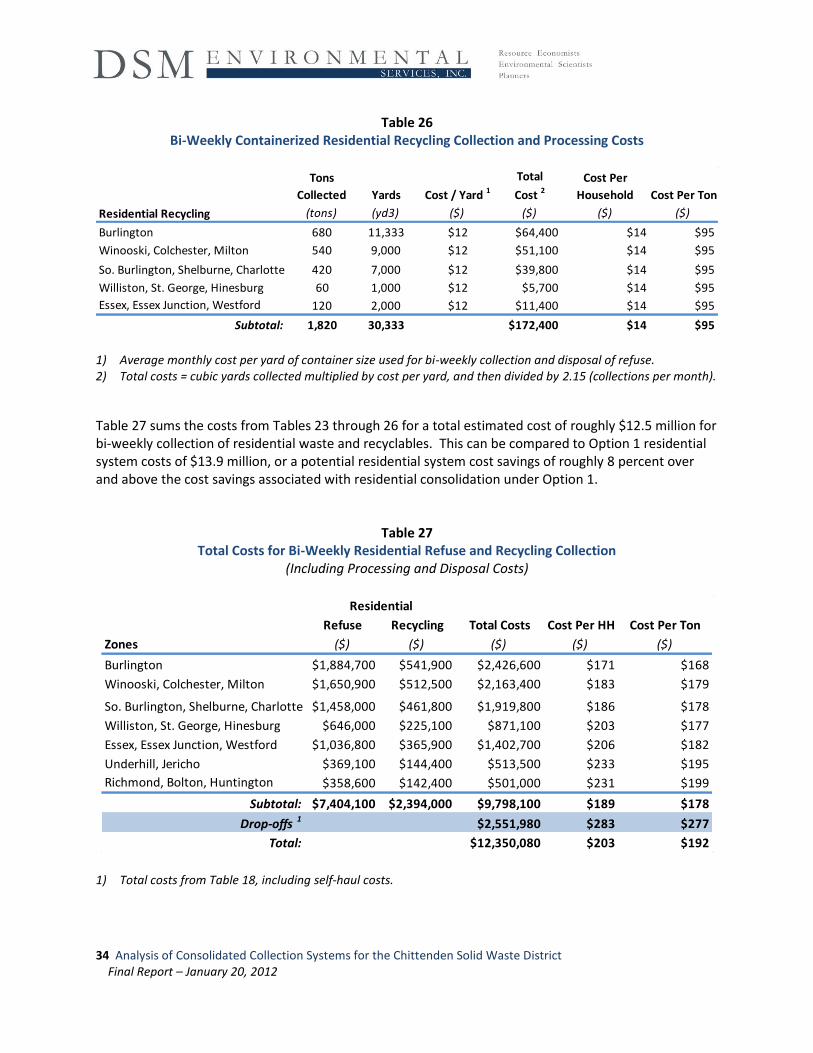
34 Analysis of Consolidated Collection Systems for the Chittenden Solid Waste District Final Report – January 20, 2012
Table 26
Bi-Weekly Containerized Residential Recycling Collection and Processing Costs
Tons
Collected Yards Cost / Yard 1
Total
Cost 2Cost Per
Household Cost Per Ton
(tons) (yd3) ($) ($) ($) ($)
Burlington 680 11,333 $12 $64,400 $14 $95
Winooski, Colchester, Milton 540 9,000 $12 $51,100 $14 $95
So. Burlington, Shelburne, Charlotte 420 7,000 $12 $39,800 $14 $95
Williston, St. George, Hinesburg 60 1,000 $12 $5,700 $14 $95
Essex, Essex Junction, Westford 120 2,000 $12 $11,400 $14 $95
Subtotal: 1,820 30,333 $172,400 $14 $95
Residential Recycling
1) Average monthly cost per yard of container size used for bi-weekly collection and disposal of refuse. 2) Total costs = cubic yards collected multiplied by cost per yard, and then divided by 2.15 (collections per month).
Table 27 sums the costs from Tables 23 through 26 for a total estimated cost of roughly $12.5 million for bi-weekly collection of residential waste and recyclables. This can be compared to Option 1 residential system costs of $13.9 million, or a potential residential system cost savings of roughly 8 percent over and above the cost savings associated with residential consolidation under Option 1.
Table 27 Total Costs for Bi-Weekly Residential Refuse and Recycling Collection
(Including Processing and Disposal Costs)
Refuse Recycling Total Costs Cost Per HH Cost Per Ton
Zones ($) ($) ($) ($) ($)
Burlington $1,884,700 $541,900 $2,426,600 $171 $168
Winooski, Colchester, Milton $1,650,900 $512,500 $2,163,400 $183 $179
So. Burlington, Shelburne, Charlotte $1,458,000 $461,800 $1,919,800 $186 $178
Williston, St. George, Hinesburg $646,000 $225,100 $871,100 $203 $177
Essex, Essex Junction, Westford $1,036,800 $365,900 $1,402,700 $206 $182
Underhill, Jericho $369,100 $144,400 $513,500 $233 $195
Richmond, Bolton, Huntington $358,600 $142,400 $501,000 $231 $199
Subtotal: $7,404,100 $2,394,000 $9,798,100 $189 $178
Drop-offs 1 $2,551,980 $283 $277
Total: $12,350,080 $203 $192
Residential
1) Total costs from Table 18, including self-haul costs.

35 Analysis of Consolidated Collection Systems for the Chittenden Solid Waste District Final Report – January 20, 2012
Comparison of Options and Costs
The estimated system costs that were analyzed for each Option are compared below in Table 28 on a total cost basis (including self haul costs). Baseline costs are not available for residential recycling separate from commercial recycling because, in most cases the recycling costs/prices have been embedded into the refuse costs/prices and not broken out separately. As illustrated by Table 28 and shown in Table 29, consolidation of residential routes is projected to reduce total system costs by roughly 17 percent. Consolidation of both residential and commercial collection (Option 2) increases total system cost savings to roughly 24 percent (rounded). Finally, consolidating residential collection and moving to bi-weekly collection of both residential refuse and recyclables, but leaving the existing commercial collection system intact, results in total system cost savings of roughly 23 percent (rounded). Savings for the residential system alone, as shown in Table 29, range between 25 and 33 percent depending on whether weekly (Option 1) or bi-weekly (Option 3) collection service is provided. Table 30 shows the residential, commercial and total system costs on a per ton basis. Finally, Table 31 shows residential cost estimates for each option on an annual and monthly per household basis, and the average annual savings for each option compared against the baseline.
Table 28 Comparison of System Costs for Residential and Commercial Refuse and Recycling
Baseline Option 1 Option 2 Option 3
Total Costs 1 Total Costs Total Costs Total Costs
Estimated Costs ($) ($) ($) ($)
Residential
Refuse See below 2 $8,311,600 $8,311,600 $7,404,100
Recycling See below 2 $3,054,600 $3,054,600 $2,394,000
Drop-off $2,551,980 $2,551,980 $2,551,980
Subtotal: $18,525,000 $13,918,180 $13,918,180 $12,350,080
Commercial
Refuse $6,613,200 $6,613,200 $5,112,800 $6,613,200
Recycling $1,338,900 $1,338,900 $1,212,700 $1,338,900
Subtotal: $7,952,000 $7,952,000 $6,325,500 $7,952,000
Total System
Refuse $14,924,800 $13,424,400 $14,017,300
Recycling $4,393,500 $4,267,300 $3,732,900
Drop-off $2,551,980 $2,551,980 $2,551,980
Total System Costs: $26,477,000 $21,870,180 $20,243,680 $20,302,080
Administration: 3 $250,000 $350,000 $250,000
Total Estimated Costs: $26,477,000 $22,120,180 $20,593,680 $20,552,080

36 Analysis of Consolidated Collection Systems for the Chittenden Solid Waste District Final Report – January 20, 2012
Table 28 Notes:
1) Baseline costs include the costs associated with billing and collection. Option 1 – 3 costs assume billing by the hauler but not collection of delinquent accounts. See further discussion of this under Billing and Collection on page 41.
2) Recycling costs embedded in refuse costs for most of residential recycling service. 3) Administration costs would include procurement and contract management, enforcement and
addressing complaints and collection of delinquent accounts, but do not include direct billing to households and businesses.
4) Numbers may not calculate exactly due to rounding.
Table 29 Comparison of Savings from Consolidated Collection Options
Baseline Option 1 Option 2 Option 3
Total Costs Total Costs Total Costs Total Costs
Savings From Consolidated Collection ($) ($) ($) ($)
Residential System Only ($) $0 -$4,606,820 -$4,606,820 -$6,174,920
Percentage (%) saved: -25% -25% -33%
Commercial System Only ($) $0 $0 -$1,626,500 $0
Percentage (%) saved: -20%
Total Savings ($) $0 -$4,606,820 -$6,233,320 -$6,174,920
Percentage (%) of System Costs saved: -17% -24% -23%
Total Savings including Aministation Costs: $0 -$4,356,820 -$5,883,320 -$5,924,920
Percentage (%) of System Costs saved: -16% -22% -22%
Table 30 Comparison of Per Ton System Costs for Residential and Commercial Refuse and Recycling 1, 2
(Total Cost Per Ton of Refuse and Recycling)
Baseline Option 1 Option 2 Option 3
Total Costs
Per Ton
Total Costs
Per Ton
Total Costs
Per Ton
Total Costs
Per Ton
($) ($) ($) ($)
Residential $285 $214 $214 $190
Commercial $183 $183 $146 $183
Total System: $244 $202 $187 $187
Potential Savings (Per Ton):
Residential -$71 -$71 -$95
Commercial $0 -$37 $0
Total System: 1
-$43 -$58 -$57
Percentage (%) saved: -17% -24% -23%
1) Does not include administration costs which are estimated to reduce savings by roughly $3.00 per ton managed.
2) Numbers may not calculate exactly due to rounding.

37 Analysis of Consolidated Collection Systems for the Chittenden Solid Waste District Final Report – January 20, 2012
Table 31
Comparison of Estimated Per Household Costs (and Savings) For Residential Refuse and Recycling 1, 2
Baseline Option 1 Option 2 Option 3
Total Costs Total Costs Total Costs Total Costs
($) ($) ($) ($)
Annual $305 $229 $229 $203
Per Month $25 $19 $19 $17
Potential Annual Savings: -$76 -$76 -$102
Percent Savings (%): -25% -25% -33%
Residential Costs Per Household
1) Does not include administration costs which are estimated to reduce annual savings by roughly $4.00 per household.
2) Numbers may not calculate exactly due to rounding.

38 Analysis of Consolidated Collection Systems for the Chittenden Solid Waste District Final Report – January 20, 2012
Further Discussion of Key Variables
The cost model developed for this analysis is constructed on a large number of assumptions and variables, which, taken together, impact the final conclusions and comparisons of the options. It is often difficult to isolate the impacts of each of the variables without making the resulting analysis so complex that it cannot be readily understood, assuming that there are even sufficient data to accurately isolate each variable. There are four key variables that significantly impact the cost analysis presented in this report. These are:
The role of PAYT pricing;
The impact of supplying carts to all households for recycling;
Billing and collection; and,
The potential role of the District drop-offs under each of the three options. Each of these key variables is discussed in more detail below, followed by an analysis of the potential environmental benefits of consolidation of residential and/or commercial collection.
PAYT Pricing Versus Carts The CSWD already has an excellent recycling program, anchored by a single stream MRF, acceptance of a wide range of materials in the recycling program, access to both curbside and drop-off recycling programs, and years of a quality public education effort. It is DSM’s understanding that this analysis of collection consolidation is based in part on a desire to further increase diversion – both of existing materials, and organics - and to evaluate the role that collection consolidation can play in offsetting any increase in the cost of diversion through greater collection efficiency. There are really only two additional ways that the CSWD can readily use to increase residential materials recycling: through economic incentives, over and above those already in place; and, through the widespread use of rolling carts for the household storage of recyclables. For the purposes of the analysis, it is assumed that 45 percent of subscription households already have rolling carts and the cost for carts supplied to the balance of households would be partially covered by CSWD grants over time. Two researchers have done the bulk of the macro-economic work using regression analysis to attempt to isolate the role of different variables in increasing recycling – Lisa Skumatz (SERA) and Jeffrey Morris (Sound Resource Management). Skumatz’ research for the USEPA is based primarily on collection of data by telephone of programs throughout the country, followed by the use of regression analysis to attempt to isolate the factors impacting on the reported recycling rates.5 Morris’ data is primarily based on West Coast programs, but is based on first party access to the data.6
5 Skumatz, Lisa, Nationwide Diversion Rate Study, Quantitative Effects of Program Choices on Recycling and Green
Waste Diversion, Beyond Case Studies, October, 1996

39 Analysis of Consolidated Collection Systems for the Chittenden Solid Waste District Final Report – January 20, 2012
The primary conclusion of the Skumatz research is that PAYT (or variable rate) pricing is responsible for a 5-6 percentage point increase in waste diversion when isolated from other factors such as demographic and income impacts, use of larger containers or carts, and the mix of materials accepted in the program. For this analysis, DSM has assumed that per household recycling quantities will increase from an average of 466 pounds per household per year (District–wide) to 576 pounds per household per year (a 23.6 percent increase over current recycling). This would result in an additional 3,400 tons recycled (rounded) per year from households, and an increase in the residential recycling (diversion) rate of 5.4 percentage points. This calculation is made from the following tonnage figures used in the model as shown in Table 32.
Table 32 Change in Residential Recycling and Recycling Rate Assumed in Consolidated Route Options
Baseline
Consolidated Routes
and PAYT Change
Residential (tons) (tons) (tons)
Refuse 51,500 47,520 -3,980
Recycling 14,400 17,800 3,400
Total: 65,900 65,320 -580
Recycling Rate (%): 21.9% 27.3% 5.4% The Morris data from King County would indicate that PAYT pricing and large rolling carts for recycling are almost equal in terms of the total impact on recycling rates, depending on how aggressive the PAYT pricing plan is. This analysis assumes a moderate PAYT pricing scheme, with only a portion of the total cost of waste and recycling collection and processing/disposal raised through PAYT pricing. This is because it is fiscally risky for the CSWD (or a contracted hauler) to rely on PAYT pricing to provide enough revenue for the entire system early on in a new consolidated collection program. Instead, an assessment, or a baseline service fee, should be used to cover some baseline level of service. As such, it is probably reasonable to assume that PAYT pricing and the introduction of rolling carts for recycling are each contributing roughly equally to the increase of 5.4 percentage points in the residential recycling rate. It should be noted here that the District could institute both rolling carts and PAYT pricing under the existing subscription collection system if it so chose. Whether routes are consolidated or not, the use of
6 Morris, Jeffrey, Single-Family Residential Solid Waste Collection Practices in King County, Collection Program
Characteristics and Best Practices for Waste Minimization and Diversion Maximization, Prepared for the King County Department of Natural Resources and Parks, Solid Waste Division, December 2003.

40 Analysis of Consolidated Collection Systems for the Chittenden Solid Waste District Final Report – January 20, 2012
multiple haulers – as envisioned under this analysis – essentially would require that the District take responsibility for implementing a consistent variable rate pricing scheme across the entire District in either case. True variable rate pricing likely to drive increased recycling cannot rely on a single price for a 64-gallon refuse cart for example, because the majority of households will not need a second cart whether or not they recycle. Instead, if carts are to be used, it would be necessary to require that all haulers provide, and charge, at a minimum, linear escalating rates, for a range of cart sizes beginning at a minimum with a 32-gallon cart. The District could require this type of pricing scheme under the existing hauler license, and could specify this type of a pricing scheme under a bid collection contract by collection zone. There are many “variations on the theme” associated with pricing for carts that can impact on the performance of the system, but that also impact on cost recovery. First, as in Seattle, cart sizes for refuse could go as low as 12 or 20 gallons (instead of 32 gallons), allowing for some households to significantly reduce their set out of refuse, while maximizing recycling and organics diversion. Further, the price differential between a smaller cart and a larger cart can be artificially established to more heavily favor small cart sizes. That is, the monthly charge for a 20-gallon cart could be less than one-half of a 32-gallon cart, even though the 20-gallon cart is not one-half the size of a 32-gallon cart. The problem with this type of aggressive pricing scheme is that it is designed solely to encourage use of small carts, irrespective of the fact that it costs almost the same to collect a 20-gallon cart as it does to collect a 32- (or 64-) gallon cart. Most of the collection cost is “fixed” once the truck is sent out on the route, and therefore the actual system cost savings associated with collecting a 20-gallon cart when compared to a 64-gallon cart is only the avoided disposal cost (or a fraction of the collection cost). Some municipalities design aggressive pricing schemes to force maximum diversion, whereas others recognize the fixed costs of servicing each household and price based on actual costs, even though the incentive to sign up for smaller carts is less when true costs are used. This is entirely a political decision. If 32-gallon PAYT bags are to be used instead of refuse carts, then it would probably fall on the District to implement a District-wide bag program so that all stores where bags could be purchased could stock the same bags. DSM is aware of instances where stores do have to stock multiple bags because of competing PAYT programs in municipalities where a single store might serve residents from multiple municipalities. This is the case for example in the Brockton, Massachusetts area where other municipalities around Brockton also have PAYT, and their bags are different than Brockton’s bags. However, it is DSM’s opinion that it would be infeasible for every hauler doing business in the District to create their own bag, unless the hauler also was responsible for distributing the bags to all of their customers, which would significantly increase administrative costs to the haulers and to the households.
Finally, implementation of variable rate pricing, while allowing households to set out refuse in any type of refuse container and/or plastic bag, is probably not possible because there would be no feasible, and enforceable, way for the individual haulers to charge for the material collected. All variable rate pricing schemes require some type of consistent waste container size – be it standard sized bags or carts. In any case, once the District moved to sell the bags to the stores, then the issue of bill collection and payment becomes a District issue as well, as discussed below.

41 Analysis of Consolidated Collection Systems for the Chittenden Solid Waste District Final Report – January 20, 2012
Billing and Collection As discussed above, PAYT drives diversion of refuse from disposal. However, the greater the economic incentive created through PAYT, the greater the risk posed to a steady stream of revenue to cover the cost of the refuse and recycling system. For example, use of bags creates a greater incentive than a fixed volume cart size, even if the cart size can be as small as 32 gallons. That is because the prepaid 32 gallon cart offers the household the ability to set out refuse on a fixed schedule, as opposed to the bag cost which is incurred with each bag used. More importantly, the difference in costs between cart sizes is usually (see discussion above) not great enough for most households to choose the smallest size cart, and therefore most households opt up for a larger cart (e.g. 64 gallon for weekly service) which is more than sufficient for most households and does not create the same incentive to divert material to recycling. In either case, some entity (the designated hauler or the District) must either sell bags at a fixed price or bill the household for the service level at a rate that is sufficient to cover the entire cost of the collection program. Determining what service levels will be chosen by most households and pricing service to cover costs becomes a critical part of raising revenues for the new system. One of the key issues facing the District if it should move to consolidate residential collection routes is who will be responsible for billing the household for the service, and for collecting delinquent accounts. According to the 1975 Columbia University Study, billing costs (at that time) increased contract collection costs by roughly 24 percent when compared to municipalities where the municipality takes responsibility for billing and payment of the contractor.7 A significant amount of that increase was likely to have been associated with write-offs for delinquent accounts which can be cured when a government entity bills and can attach a lien on property for non-payment. The cost model used in this report assumes that the contract haulers would be responsible for billing but that the District would be responsible for collection of delinquent accounts. If the District were to take on billing as well as collection, then there will be increased District administrative costs which DSM assumes could range from $250,000 to $500,000 depending on how the billing was undertaken. These increased District administrative costs would be offset by savings in contract collections costs because the contract haulers would no longer be administering the billing. If the District were to decide that the most realistic way to implement PAYT pricing for residential refuse is to charge by the bag, then it would necessarily become a District responsibility to organize the sale of bags (through local stores), and then to pay the private haulers based on some formula, for the cost of collection carried by the bag fee. Finally, whether or not the private hauler under contract is responsible for billing and collection, the creation of collection zones with bid prices for each zone creates an inherent problem in that different rates will apply in different zones, depending on the bid prices. The District must then decide if the District wants to equalize rates – and therefore by default become the billing and collection agent for the private haulers, or whether it is acceptable to have households (Options 1 and 3) and businesses (Option 2) pay different rates depending on their location. It is recognized that it costs more to collect waste and recyclables in more rural areas than in more urban areas. These cost differences are now
7 The Organization and Efficiency of Solid Waste Collection, Table 9-2, p. 149.

42 Analysis of Consolidated Collection Systems for the Chittenden Solid Waste District Final Report – January 20, 2012
partly hidden by the potential number of subscription options available to most households, and the lack of transparency with respect to competing rates. Under competitive collection procurement, the rates will be fully transparent.
Cross-Subsidization of Commercial and Residential Collection Pricing One area that should be acknowledged if the District were to choose to consolidate both residential and commercial routes to a single hauler is the potential for cross-subsidization of the residential cost through higher commercial collection pricing. According to a blog post from Midas Management Consultants: “Commercial rates in cities that have a single hauler with a city-wide exclusive contract typically suffer from a phenomenon known as ‘subsidization’…From the haulers profit seeking perspective, it usually views the city (collection zone) as a whole. The hauler is typically indifferent as to how much of its profit comes from the residential or commercial sector, as long as the whole contract is profitable. As the contract is re-negotiated over time, there is a tendency for the commercial rates to be increased more than the residential rates. This tendency is caused by two factors. First, residential rates usually consist of one or two simple monthly charges…These high profile rates are easily understood and often compared to similar rates in nearby jurisdictions. However commercial rates are more abstract, and are based on a more complicated matrix of the size and number of bins, and number of weekly pickups. Consequentially, residential rates are subject to more scrutiny when adjusted or renegotiated (or bid). The second factor is the political nature of local government. There are simply more voters in the residential sector…as a result, commercial rates tend to increase more over time than residential rates. Those commercial rates tend to be higher than the rates charged in non-exclusive systems, which are kept in check by market pressure.”8
The Role of District Drop-Offs This analysis assumes that consolidation of routes means that all households and businesses have access to, and are billed for service by the selected private contractor for that collection zone with the exception of 15 percent of households that are assumed to opt out to use the District drop-offs. Based on discussions with District staff, this analysis assumes that households and businesses can opt out of the consolidated curbside/containerized system if they choose to use the drop-offs for refuse and recycling, although the details of how the opt-out system would work are not defined. It is the case that recycling rates tend to be marginally higher if households have access to both curbside and drop-off collection of recycling. And, the drop-offs may continue to play an important role in the management of bulky and special wastes, depending on the nature of the collection contract (e.g., the extent of waste materials that are acceptable, and whether there are limits to quantities set out for collection – which are typically specified in any type of a bid contract). However, as discussed above, the ability for households to choose drop-offs as their sole means to manage refuse and recyclables as opposed to using curbside (and containerized) service under
8 See: Midasmanagementconsulting.com/page/3/, More on Franchised Waste Markets, posted December 6, 2009.

43 Analysis of Consolidated Collection Systems for the Chittenden Solid Waste District Final Report – January 20, 2012
consolidated collection could present challenges to the economics of consolidated collection. The collection zones designated under route consolidation rely on a fixed number of households to service in order to reach the economies of scale that would lower costs for all households. Allowing households to enter into and out of this system presents another level of revenue uncertainty (similar to the risk of delinquent accounts) and could reduce the savings estimated in the collection model. However a procurement process could specify that up to 15 percent of households in each collection zone may opt out of the consolidated service, and compensate haulers under contract for any reduction in households above that percentage.

44 Analysis of Consolidated Collection Systems for the Chittenden Solid Waste District Final Report – January 20, 2012
Environmental Costs and Benefits
One clear benefit of collection consolidation is a reduction in the number of garbage and recycling collection vehicles that are on the road, and the related air emissions, noise, and traffic impacts from operating those vehicles. While the fuel efficiency and fuel use of the refuse and recycling truck fleet operating in the CSWD was not analyzed for this study, in North America at least 90 percent of the fleet is diesel-fueled. Diesel trucks are a major source of air pollution, including fine particulate matter, and nitrogen oxide emissions. Recent EPA guidelines have targeted heavy duty vehicles including garbage trucks to cut emissions by 10% by 2018. Some haulers in the CSWD are reported to be substituting heavy duty diesel trucks with light duty trucks and/or running or testing hybrid diesel electric and other alternative fuel vehicles. However, truck traffic and emissions would be reduced further under any type of collection consolidation plan. To illustrate, and at least partially quantify the air emission and GHG emission impacts associated with route consolidation, DSM has compared consolidated residential curbside collection against the current system. The expected change in the number of trucks associated with containerized residential and commercial collection was not quantified as part of the cost analysis; therefore, the potential impact of consolidation of those routes is not included in the analysis of reduced truck emissions. However, the value of recycling all additional residential and commercial materials assumed under the cost model has been quantified using the WARM Model. The air emission impacts associated with diesel trucks has been quantified, in part, by using the coefficients derived from the WASTED Model. However, the GHG emission savings associated with the embedded energy inherent in the recyclables has been quantified using the new version of the WARM Model, which is more transparent about how the embedded energy is calculated.
Truck Emissions Reductions Truck counts for the current collection system, and the three options analyzed, were made based on households served and estimated route sizes. Under the current system, a variety of trucks service the CSWD, and averages for all types of service (commercial and residential) are not possible. However, based on average route sizes, estimated total customers (e.g. households) served, and curbside service levels (e.g. bi-weekly and weekly), a truck count was calculated for the current curbside refuse and recycling system to compare against the truck counts estimated under each consolidated system option. The truck count assumes each truck is in operation five days per week, at least nine hours per day. These same calculations could not be done for containerized refuse and recycling because factors such as distance between customers, time to service each customer and volume (and density) per stop could not be averaged. The range that enters into these variables would make it impossible to make reasonable estimates for emissions reductions. Instead, curbside routes are provided as an example. Using data from the WASTED Model, Table 33 presents the emissions reductions from taking trucks off the road to service curbside residential customers under Options 1 and 3. Option 2 is not shown because residential service provided is the same as Option 1. Table 34 shows the reduction of residential collection trucks under Option 1 and 3 from the current baseline system and assumes that

45 Analysis of Consolidated Collection Systems for the Chittenden Solid Waste District Final Report – January 20, 2012
split trucks that are used in the current system continue in use under consolidated routes where collection routing may benefit.
Table 33 Emissions (and Energy) Savings from Reduction in Residential Refuse and Recycling Trucks
Under Consolidated Curbside Routes, By Types of Emissions
Option 1 Option 3
Reduction in Trucks -7 -13
Gallons / Year / Truck 8,600
Grams/liter
(diesel) Kg/gallon
Sub-Total,
Kilograms
Sub-Total,
Tons
Sub-Total,
Kilograms
Sub-
Total,
Tons
Sub-Total,
Kilograms
Sub-Total,
Tons
CH4 0.036 0.000 1.2 0.001 (8) (0.01) (16) (0.02)
NOx 18.868 0.071 613.4 0.67 (4,373) (4.81) (8,245) (9.07)
VOCs 2.35 0.009 76.4 0.08 (545) (0.60) (1,027) (1.13)
SOx 3.311 0.013 107.6 0.12 (767) (0.84) (1,447) (1.59)
PM 0.463 0.002 15.1 0.02 (107) (0.12) (202) (0.22)
Energy (GJ) 0.1346 1,157.6 1,097 (8,253) (7,824) (15,560) (14,750)
Savings Under
Option 1
Savings Under Option
3Per Truck on The Road
The air emissions reductions presented above are a direct result of reduced fuel use. Reduced fuel use also results in reductions in greenhouse gas (GHG) related emissions. Table 34 presents estimated reductions in fuel use under the consolidated residential curbside routes, as well as estimated reductions in CO2 emissions (in tons) from the reduced fuel use. Also shown is the estimated fuel use and CO2 emissions associated with households driving to the drop-offs for refuse and recycling under the baseline and the alternative systems.
Table 34 Fuel Savings and CO2 Reductions under Consolidated Residential Curbside Routes
Curbside
Trucks 1
Fuel Use /
Truck
Truck Fuel
Use
Diesel
Emissions 2
Self Haul
Fuel Use
Gasoline
Emissions
Total
Emissions
Percentage
Savings
Curbside Residential (gals/yr) (gals) (tons CO2) (gals) (tons CO2) (tons CO2) (%)
Baseline 34 8,600 296,544 3,292 76,538 742 4,034
Option 1 27 8,600 235,228 2,611 82,832 803 3,415
Option 3 21 8,600 180,945 2,008 82,832 803 2,812
Potential Savings:
Option 1 -7 -61,315 -681 6,294 61 -620 -15%
Option 3 -13 -115,599 -1,283 6,294 61 -1,222 -36% 1) Curbside residential truck estimates for roughly 40,000 curbside households, which represents households
served by subscription service, multi-unit curbside accounts, and Westford and Underhill’s consolidated routes. 2) Diesel emissions at 22.2 lbs of CO2 per gallon and gasoline at 19.4 lbs/gallon.
46 Analysis of Consolidated Collection Systems for the Chittenden Solid Waste District Final Report – January 20, 2012
Table 34 shows total net annual emissions reductions of 620 tons (rounded) of C02 under Option 1 and 1200 tons (rounded) of CO2 under Option 3. These reductions are equivalent to taking roughly 124 and 245 cars off the road, respectively. Note that because of the increase in the number of households using the drop-offs (from an estimated 8100 to 9030), there is assumed to be an increase in gasoline emissions from those self haul households which reduce the environmental benefits of consolidated collection. Table 33 and Table 34 do not include any environmental benefits from consolidation of containerized refuse and recyclables collection although some are also expected to accrue.
Energy Savings Benefits from Recycling As illustrated above, consolidating residential truck routes results in reduced fuel use, and concomitant reduction in air emissions. However, much greater emissions reductions and energy savings are associated with increased recycling assumed under the cost models, related to replacing virgin materials with recovered materials. Because the energy requirements are material specific (per ton energy savings for replacing sand, soda ash and limestone with cullet are different from those when OCC replaces pulp), some recovered materials save more energy during manufacturing than others. However, all materials recovered in the CSWD, and processed through the CSWD MRF and then marketed, produce some energy savings. The embedded energy in materials recovered for recycling is included in coefficients used in the US EPA WARM model. The model was recently revised using new coefficients that allow additional custom inputs specific to disposal methods used (e.g. landfilling with energy recovery) and replacement fuels in the region (e.g. New England’s energy supply). The WARM Model was used to illustrate the energy savings benefits of recycling activity in the CSWD, and to show the added benefits through the assumed increase in recycling associated with the route consolidation. Because the CSWD is already recycling at a relatively high level, the difference in additional recycling is not as great as it would be for a region that had lower performance in recycling programs. Table 35 displays the results of running the WARM Model for the CSWD’s current system, and then for the three options. Results are shown for residential and commercial recycling combined. Table 35 results are calculated using mixed recyclables materials composition, and not specific to the residential and commercial composition in the CSWD. In addition, materials recycled and marketed directly by businesses located in the CSWD are not included in Table 35.

47 Analysis of Consolidated Collection Systems for the Chittenden Solid Waste District Final Report – January 20, 2012
Table 35
Energy Savings from Recycling Under the Current System and Under Route Consolidation
Gasoline Cars Off Road Energy
Alternatives Tons Total Net (gals) (cars) (million BTUs)
Baseline 27,300 -81,939 0 0 0 0
Option 1 30,700 -89,635 7,696 873,530 1,410 98,272
Option 2 33,000 -94,841 12,902 1,464,447 2,363 164,750
Option 3 30,700 -89,635 7,696 873,530 1,410 98,272
Net Savings Expressed in:
MTCO2 Savings
A comparison of the truck emissions and fuel savings and the fuel equivalent savings associated with the savings in embedded energy associated with increased recycling clearly shows that the embedded energy collected in the recyclables exceeds the energy associated with the collection truck, as shown below in Table 36. In addition, the annual tons of carbon dioxide emissions from operating the diesel truck can be compared against those saved from replacing virgin materials with recycled materials.
Table 36 Annual Fuel Use (and Energy Use) from Recycling Truck Operation Compared to
Embedded Energy Savings from Recyclables Collected
Energy Use MTCO2 Savings Gasoline Energy
(gals) (million BTUs) (MTCO 2 ) (tons) (MTCO 2 ) (gals) (million BTUs)
Recycling Truck 8600 1,114 87 935 -2116 240,221 27,025
Recycling Savings 1 Expressed in:Recyclables
Collected
Carbon
Emissions
Diesel
Use
(1) WARM Model values from using mixed recyclables as an input.
In conclusion, while route consolidation will result in reduced air emissions and GHG emissions, an emphasis on increasing the quantities of recyclables collected, through route consolidation or by other means, will result in greater environmental benefits.

48 Analysis of Consolidated Collection Systems for the Chittenden Solid Waste District Final Report – January 20, 2012
Partial Bibliography
Linda Gaines, Anant Vyas, John L. Anderson. Estimation of Fuel Use by Idling Commercial Trucks (Paper No. 06-2567). Center for Transportation Research, Argonne National Laboratory, Argonne, Illinois 60439. January, 2006. Lori Lovely. Ramping Up the Refuse Truck. MSW Management. November/December 2010. James S. Cannon for Inform. Greening Garbage Trucks: Trends in Alternative Fuel Use, 2002 – 2005. ISBN #0-918780-84-5. 2006. US EPA WARM Model, US EPA. August 2010. Survey of Florida Solid Waste Franchises, Escambia County Department of Solid Waste Management Cantonment, Florida. SCS ENGINEERS, September 10, 2008. Benchmarking Residential Recycling. MSW Management. July/August 2010.
Appendix A - Analysis of Consolidated Collection Systems for the Chittenden Solid Waste District
Appendix A Examples of Recent Communities that have Consolidated Collection or Franchised, or that are currently Reviewing Consolidated Collection Options

Appendix A - Analysis of Consolidated Collection Systems for the Chittenden Solid Waste District
APPENDIX A
Examples of Recent Communities that have Consolidated Collection or Franchised, or that are currently Reviewing Consolidated Collection Options
Middletown, RI Contracted Collection and PAYT Program Until 2007, the Town of Middletown, Rhode Island (located next to historic Newport) operated a transfer station for residents to drop-off refuse and recycling. While most residents subscribed to private haulers for curbside refuse collection, about 20 percent regularly used the Town transfer station and some residents used it solely for recycling or bulky waste drop-off. Even so, many subscription refuse collection customers paid high rates for curbside collection, had no limit on what they could set out each week, and did not recycle, resulting in a low recycling rate. Middletown was also interested in minimizing truck traffic as heavy traffic was problematic on the two main roads that bisect the island, particularly during the warmer months when tourists and second home owners visited Aquidneck Island. When the transfer station needed to close (it was located on leased property owned by the US Navy and the lease expired), the Town released an RFP for curbside refuse and recycling collection for all residents. Waste Management, the successful proposer, began providing collection service in 2008, charging $206 per household per year in the first year and $220 per household per year in the second year. This compared to an estimated average subscription price of $360 per household per year. Middletown pays Waste Management for the provision of the collection service, and residents initially paid for service through purchase of PAYT bags at area merchants. While all residents were given refuse and recycling carts, they were required to also buy special town PAYT bags and place only bagged refuse in the refuse carts. Bulky items could be set out next to the carts but using special stickers purchased at the Town offices. Against the advice of DSM (the Town consultant during implementation) the Town decided that residents could opt out of the service and either contract with another hauler, or use a private transfer station in Newport (owned by Waste Management), although the transfer station owner did not really want to add vehicle traffic at this site. The original contract required that the Town pay the hauler a monthly fee for serving a certain assumed number of households in Middletown. About two years after program implementation, where all households received a cart and the option to participate, the Town instituted an annual household fee of $50 (now $150) and required residents to opt into the program. This was because some households were using recycling collection but not the PAYT program, instead subscribing for separate refuse collection or using the private transfer station and because a steady revenue stream was necessary to pay for the program. The Town Recycling Coordinator estimates that roughly 70 to 75 percent of households are now signed up for the service. Upon paying the annual fee, households receive special stickers to place on their carts to show that they paid for service for the year. The annual program fee covers curbside trash, recycling, seasonal yard waste and Christmas tree collection, two annual Bulk Waste Amnesty Days, and notification of local Eco-Depots as well as other events.

Appendix A - Analysis of Consolidated Collection Systems for the Chittenden Solid Waste District
The Town also receives revenues from sale of PAYT bags at stores throughout Town, and from sale of stickers for bulky items. Bag rates are $2 for 33 gallon bags and $1.75 for 15 gallon bags. For more information: http://www.muni.ri.net/middletown/refuse/2011.pdf Easton, MA Preferred Hauler for Curbside Refuse and Single Stream Recycling Collection The Town of Easton had seven haulers providing subscription refuse collection service in Town with BFI holding the largest market share. Curbside recycling was offered by some, but not all haulers, and required material separation and set out in two or more different containers. The Town sought to organize collection to consolidate routes (and limit the number of trucks going down each road), lower costs to households and provide uniform and expanded recycling collection service. Through a competitive proposal process, Waste Management was selected to be the Town’s preferred collection provider for curbside refuse and recycling for 1-3 family households (estimated at 5,832) at a standard rate for five years of service. Service began in July 2007. The proposed rate of $260 per year was estimated to be $180 lower than most subscription rates, and included weekly refuse, bi-weekly single stream recycling collection, monthly collection of bulky items ( including TV’s and computer monitors) and a special mercury collection service. Residents opt into the program, and are billed quarterly by the Town Water Department along with their water bills. So far, about 55 percent of households have signed up for the service. This is lower than initially expected because of some confusion at the program start, and because one hauler dropped their price significantly to try to keep customers. Residents are said to generally like the Town program and the zero sorting (e.g. single stream collection) of recyclables and Waste Management has stuck with the contracted rate even though the number of households is lower than anticipated. Households can opt into the service by calling the water department and the number of Town subscribers is growing. Sedgewick County, Kansas Implementation of Consolidated Collection or Franchising Sedgwick County recognized that residents pay less and receive more service if solid waste collection is organized or franchised. In addition, air quality was a concern in the County. As part of the County’s solid waste plan update, the County expected all cities to have a solid waste collection contract or franchise in place by January 1, 2011 which includes curbside recycling and volume-based trash rates. The County asked all towns and cities to evaluate their trash and recycling services prior to that date and in the process, several cities made changes to their approach to consolidate collection routes and expand recycling services.

Appendix A - Analysis of Consolidated Collection Systems for the Chittenden Solid Waste District
In Valley Center, roughly 99 percent of residents subscribed with a private hauler for refuse collection service. A Solid Waste Management Strategy Committee was formed in 2009 to research and advise the City Council on the best option for improving solid waste and recycling collection service in the City. The Committee recommendation was that “a city-wide, single-hauler, single-stream system could result in significant savings for the residents who now individually contract with private haulers, increase convenience, extend the life of city streets and provide a strong boost in recycling rates.” The Town initiated a RFP process in May 2010 and later signed a 5 year contract with Waste Management for the new collection service. While independent haulers charged monthly subscription fees ranging from $15 to $25 per month per household, the new contract for the 3900 residential customers reduced the costs to $12.95 per month per customer on January 1, 2011. Under the agreement, each household received two 95 gallon carts – one for single stream recycling and one for refuse. Residents were asked to return their existing carts. Curbside collection is weekly for refuse and every other week for recycling. One bulk item can be set out for collection every week under the contract. The City of Valley Center handles billing and remits payment 30 days after the billing due date. The City deducts a fee (originally set at $1.05 per month per residence/small business collected) from the Contractor’s fee. Fees are collected in advance, and remittance made for fees collected only. Delinquent accounts continue to be billed and collection service continues until the City notifies the Contractor when a residential unit is on hold to have the container picked up. Holds will only be used for units vacant for extend periods. In nearby Derby, Kansas, the Town entered into a new, seven year contract in 2009 with Waste Connections to service 6900 customers. Residents pay $15.14 per month total for trash (using a 95 gallon cart) and for recycling. The City’s franchise established rates based on volume with a discount for a smaller 65 gallon cart, and a fee for each additional bag. The monthly fee includes biweekly recyclables pickup and reward points through the RecycleBank program. In addition, the cancellation fees paid by residents who formerly did business with a different hauler were credited to their new Waste Connections account upon request. In the City of Cheney, the City contracted with a private hauler (Lies Trash Service) for trash and curbside recycling collection beginning Jan. 1, 2008. Residents pay $16 per month for service. Before the franchise, Lies Trash Service was charging $20 per month for these services and Waste Management was reported to be charging $28 per month for refuse collection without recycling. Finally, in Park City, the City entered into an agreement with a private hauler (Stutzman Refuse Disposal) for citywide curbside recycling, and for refuse collection at a discounted rate. All households are provided with curbside recycling and customers can either continue with by company licensed as a trash hauler in Park City or switch to the City designated hauler. Those who prefer to contract with Stutzman Refuse Disposal at the agreed upon rate (currently at $11.00 per month) have the charges included on their monthly utility bill. All households are billed for recycling at $3.00 per month whether they use the City refuse collection contractor or not. The City reported that households who switched from Waste Connections to Stutzman for trash service saw their bills drop from $28 to $11 per month in 2009.

Appendix A - Analysis of Consolidated Collection Systems for the Chittenden Solid Waste District
Los Angeles County Implementation of Franchise Areas Los Angeles County began to franchise refuse collection in the unincorporated areas of the County in 2007 because the County found that the “open-market system has been ineffective in controlling rate increases, ensuring service excellence, and meeting the State waste reduction mandate.” The County also believes that the franchise system limits the wear and tear on County streets and reduces the need for new landfills. Under the new system, haulers have been selected through a competitive RFP process for each service area and awarded a seven year exclusive franchise to provide weekly refuse and recycling and seasonal organics collection services to all households in the franchised areas. The system was designed to provide uniform service standards for haulers operating in each franchise area; however some service specifications (and franchise agreements) differ based on community requests. The system is being set up by the County through consulting with community members of each geographic area by holding a series of community meetings, use of survey cards and soliciting telephone feedback. For example, in the West Whittier Area, the franchise was awarded to Universal Waste Systems. Each household receives three 96-gallon containers: one green container for yard waste, one black container for refuse, and one blue container for recyclables. Additional containers for either recyclables or green waste are provided at no additional cost, and smaller refuse carts are also available. The rate for basic service is $18.56 per month with a discounted senior rate is $13.92 per month or $41.76 per quarter (August 2010) which accounts for changes in the Consumer Price Index (CPI), Producer Price Index (PPI), and solid waste disposal tipping fees. Rates are calculated in accordance with the terms of the franchise and reviewed and verified by the County to ensure the adjustment is justified. Residents may opt out of the system and self haul trash and recycling but must provide proof of recycling or disposal to Universal Waste. A Customer Bill of Rights is sent to each customer with the new franchise agreement and each rate increase. Customers may not choose another hauler. However residents may contract directly with another hauler for roll-off or construction waste collection. The franchised hauler bills customers every three months in advance. Customers have termination rights and the right to self-haul. They must provide 90 days notice to cancel service except for cases of certain emergencies (e.g. hauler fails to provide service - such as missing pick-up, or failing to timely repair or replace containers- incorrect billings, moving out of Town) While an extra green waste or recyclable container is provided free of charge, extra refuse containers are provided for an additional charge of $5 per month. Other services included in the standard fee include Holiday Tree Collection, annual curbside clean-up events, on-call bulky item and electronic waste collections, on-call bagged green waste collections in unlimited quantities (twice per year); and four special community clean-up events per year.

Appendix A - Analysis of Consolidated Collection Systems for the Chittenden Solid Waste District
Unincorporated Areas of Gwinnett County, Georgia Consolidated Collection Plan Gwinnett County is a rapidly growing suburban county adjacent to Atlanta, Georgia. Gwinnett County moved from subscription and drop-off refuse and recycling collection to consolidated curbside collection in July 2010. Contracts were negotiated with five private refuse collection companies to provide recycling and refuse collection in exclusive franchise zones using 96 or 65 gallon carts for refuse and standard “blue boxes” for single stream recyclables. The County assessed a fee on the property tax bill to each household for the first eighteen months of service based on an average cost of $17.80 per month. According to the Atlanta Journal – Constitution (February 27, 2010), implementation of the new consolidated collection plan for roughly 188,000 households in the unincorporated areas of Gwinnett County was the outgrowth of a 2008 plan to award exclusive collection franchises to two private haulers. The 2008 ordinance establishing the six collection zones was halted by a Superior Court judge. The two private haulers awarded the exclusive franchises subsequently sued the County for $40 million, and were joined by three additional haulers who had lost in their bid to obtain a collection franchise. The new ordinance was adopted in response to the lawsuit, with all five companies being awarded exclusive franchise collection areas by the County under a negotiated settlement. Highland Park, IL Franchise/Collection Contract for Multi-Family Households and Commercial Accounts Highland Park is a relatively wealthy suburb of Chicago, with 11,500 households (including Michael Jordan’s residence). Highland Park issued an RFP for a single contract/franchise to collect all refuse, recycling and yard waste from commercial, industrial, institutional and multi-family households. The contract excludes roll-off wastes and C&D wastes. The RFP includes detailed bid specs for all sizes of containers, and for lease as well as owned containers. It is a franchise (and the City newsletter calls it a franchise) in that the City does not pay the contractor, the contractor bills for the service based on the bid rates and collects the revenue “on behalf of the City”. It is an exclusive five or seven year arrangement with the City. The City newsletter states that the City implemented it to: increase recycling services available to the business community; improve sustainability of the community; lower costs to “most businesses”; and reduce vehicle emissions. Businesses have one year from the start of the agreement to switch over to Waste Management – which won the franchise. Presentations leading up to the decision to franchise indicated that City and Solid Waste Agency of Lake County research found that businesses could save as much as 50 percent of refuse collection costs when comparing commercial franchise rates with surveys of what businesses were currently paying. For example, average monthly costs for weekly collection of 1.5 and 2 cubic yard containers under the subscription service were $85.17 and $104, respectively, but are estimated to cost $36 and $46, respectively, under franchised collection.

Appendix A - Analysis of Consolidated Collection Systems for the Chittenden Solid Waste District
Collection Consolidation Studies, Pennsylvania Department of Environmental Protection The Pennsylvania Department of Environmental Protection funded four separate studies for Pennsylvania Townships between 2006 and 2008 assessing the potential for switching from subscription curbside collection of residential waste and recyclables to consolidated contract collection. These studies were:
Assessment of the Existing Individual Refuse and Recycling Collection Services for Seven Municipalities in the Greater Johnstown Vicinity Compared to a Conceptual Consolidated Regional Collection System, R.W. Beck, June 2006
Hatfield Township Evaluation of Single-Hauler Waste and Recyclables Collection Alternatives, SWANA Recycling Technical Assistance Study, Prepared by Gannet Fleming, Inc., June 2007
Single-Hauler Waste and Recyclables Collection Alternatives, East Whiteland Township, Chester County, Pennsylvania, SWANA Recycling Technical Assistance Study, Prepared by Gannet Fleming, Inc., December 2007
Contracted Waste and Recycling Program Study, Thornbury Township, Chester County, SWANA Recycling Technical Assistance Study, Prepared by Gannet and Fleming, Inc., July 2008
The 2006 RW Beck study was similar to the DSM analysis for the CSWD in that it compared current reported subscription curbside collection prices with estimated costs based on a conceptual design for a consolidated private collection contract for the 16,744 households in seven municipalities represented by the Johnstown Intergovernmental Council. RW Beck estimated that the average household would pay $115 per year for consolidated collection versus an average of $126 per year under the existing subscription system. All three SWANA Recycling Technical Assistance studies concluded that households would save between 15 and 35 percent by switching from subscription service to consolidated collection. However, only one of the studies – the Hatfield Study, used actual consolidated collection prices in surrounding communities to compare against the cost of subscription service in Hatfield Township. June 2006 prices for bid weekly curbside collection of refuse and recyclables ranged from $200 per year for Pottstown Borough to $300 per year for White Marsh Township when compared to $405 per year for similar subscription service for Hatfield Township. This represented a savings ranging from 25 to 50 percent over subscription pricing. DSM followed up on all four studies to determine if any action had been taken to move from subscription service to consolidated collection. We have not yet heard back from the Cambria County Solid Waste Authority (Greater Johnstown Vicinity), but no action has been taken to consolidate collection based on the other three studies. Hatfield Township decided not to move forward based on objections from local residents to consolidation. The Public Works Director for East Whiteland Township stated that the Manager had referred the study to a committee, but that no action had been taken. No action was taken on the study by Thornbury Township, which continues to be provided with subscription service.

Appendix A - Analysis of Consolidated Collection Systems for the Chittenden Solid Waste District
City of Los Angeles Evaluation of Franchising The City of Los Angeles provides refuse and recycling collections service to households in 1-4 family dwelling units. Larger multi-family complexes and commercial buildings are served by 125 haulers permitted by the City. As a result, many truck collection routes overlap, some business and apartment customers pay much higher rates than others, despite similar services, and not all customers have recycling service. In addition, air quality standards are compromised in part because waste haulers in open markets (e.g. private waste haulers not contracted by the City or County) in Los Angeles are exempt from requirements for solid waste collection vehicles to transition to cleaner-burning or alternative-fuel technologies. A new report by the Los Angeles Alliance for a New Economy has called for a franchise process to organize collection routes to create equitable rates for all customers and reduce costs, consolidate collection routes to improve route and economic efficiencies (and in turn reduce environmental costs and wear and tear on roads), increase access to recycling, and require cleaner vehicles be used to collect refuse and recycling.