the costs of production of alternative jet fuel
TRANSCRIPT
LAE.MIT.EDU
ASCENT ADVISORY COMMITTEE MEETING | APRIL 18, 2017
A Harmonized, Stochastic Assessment
The Costs of Production of
Alternative Jet Fuel
2
AGENDA
Motivation
Conversion process overview
Methods
Results
Policy analysis
3
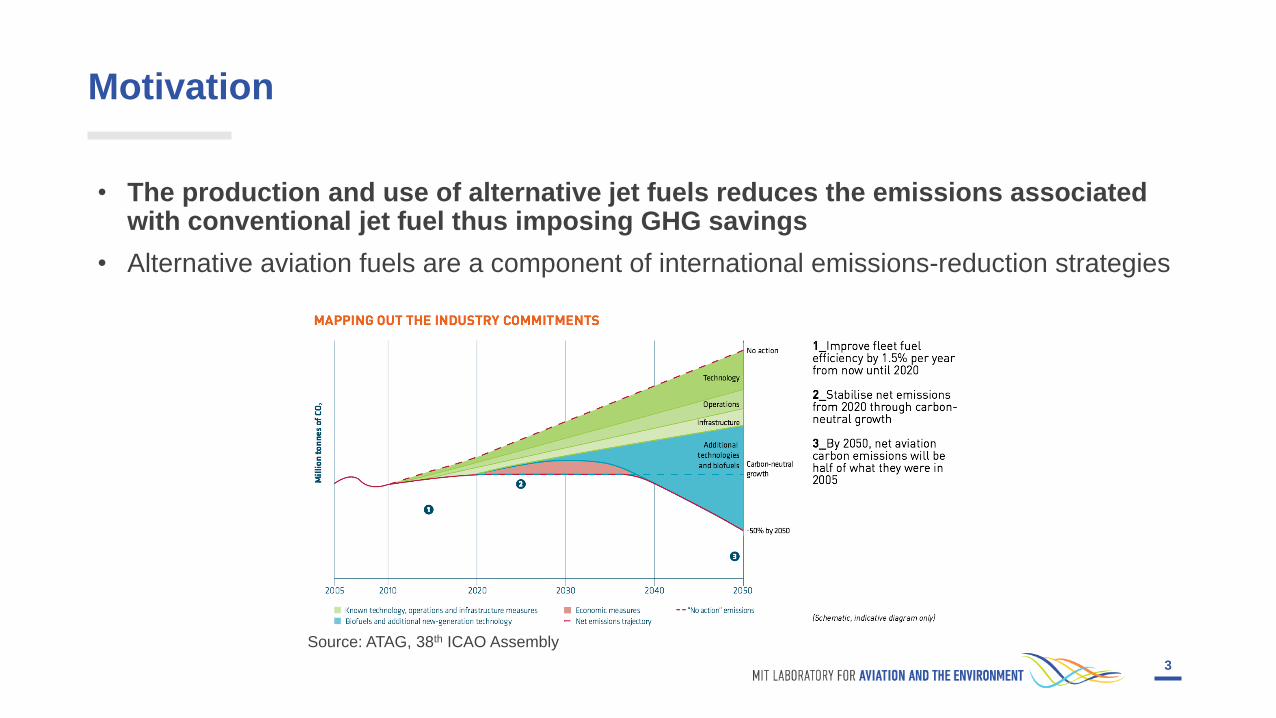
Motivation
• The production and use of alternative jet fuels reduces the emissions associated with conventional jet fuel thus imposing GHG savings
• Alternative aviation fuels are a component of international emissions-reduction strategies
Source: ATAG, 38th ICAO Assembly

4
Research focus
Analyze and compare the performance of renewable jet fuel pathways using stochastic estimation (Monte Carlo):
Perform harmonized stochastic and analysis to evaluate uncertainty
Quantify costs of productions in terms of minimum selling price and net present value (TEA)
Quantify performance under the Renewable Fuel Standard (RFS2)
5
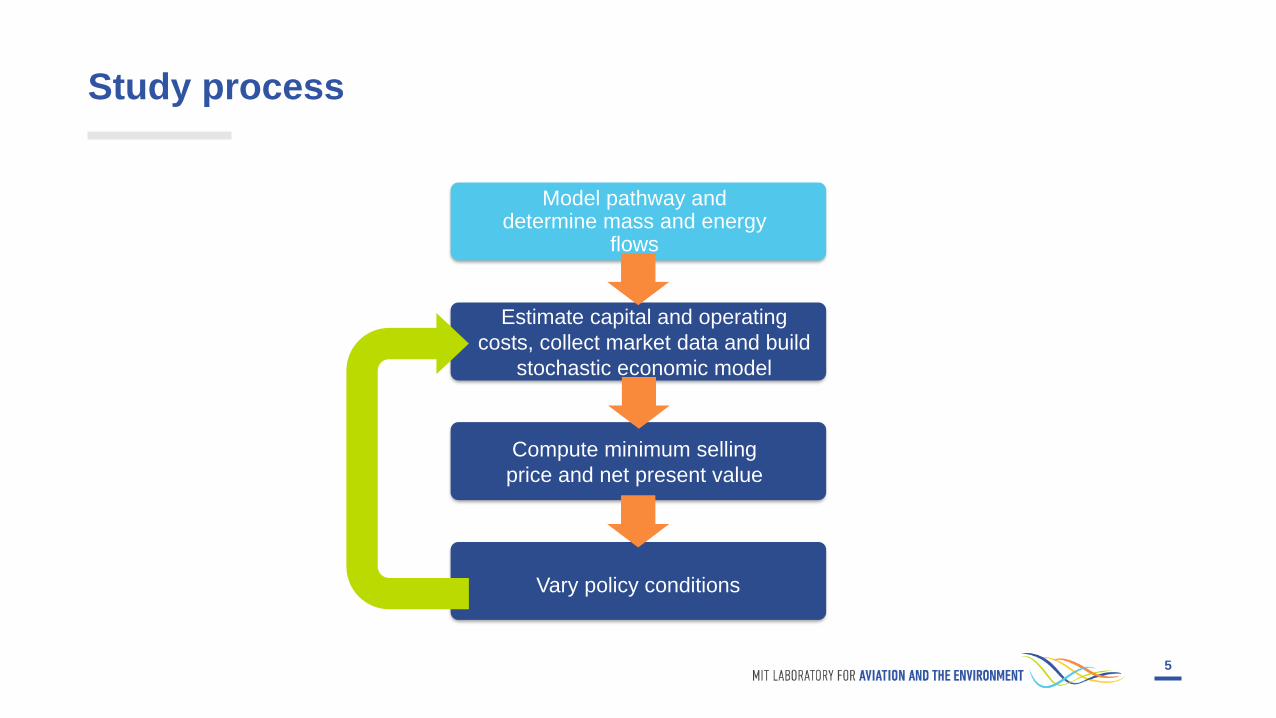
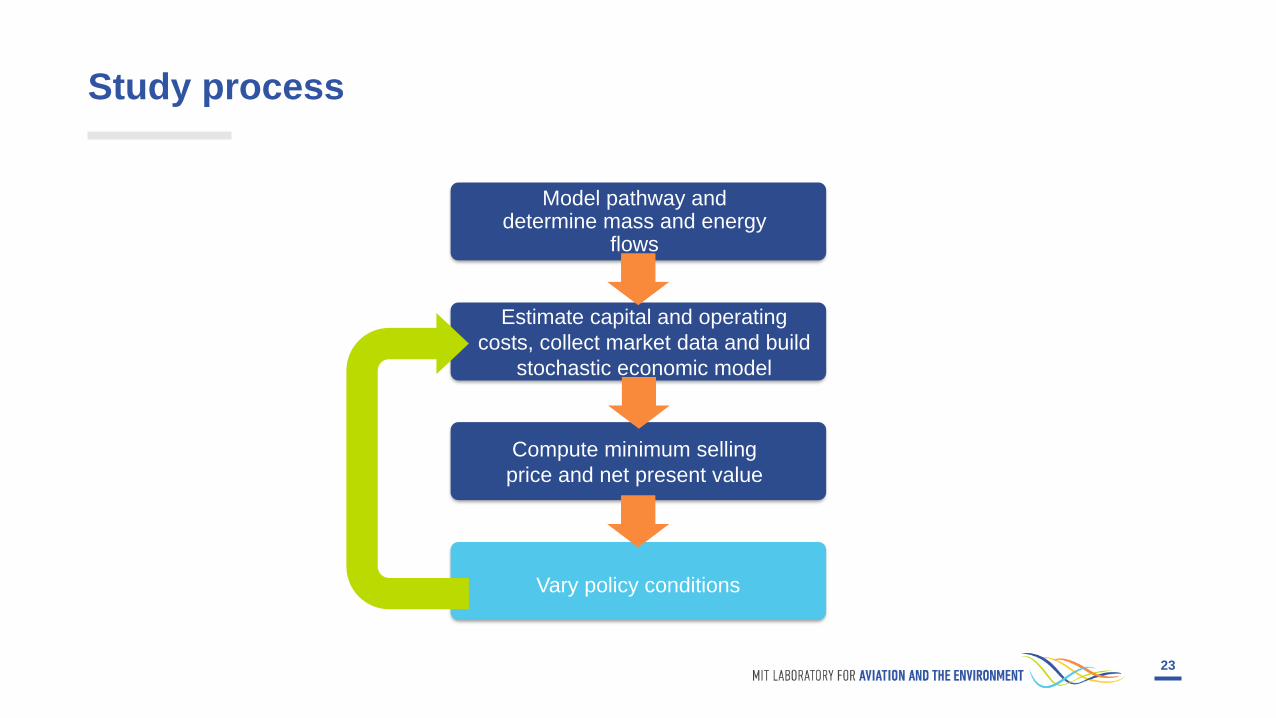
Study process
Model pathway and determine mass and energy
flows
Estimate capital and operating
costs, collect market data and build
stochastic economic model
Compute minimum selling
price and net present value
Vary policy conditions
6
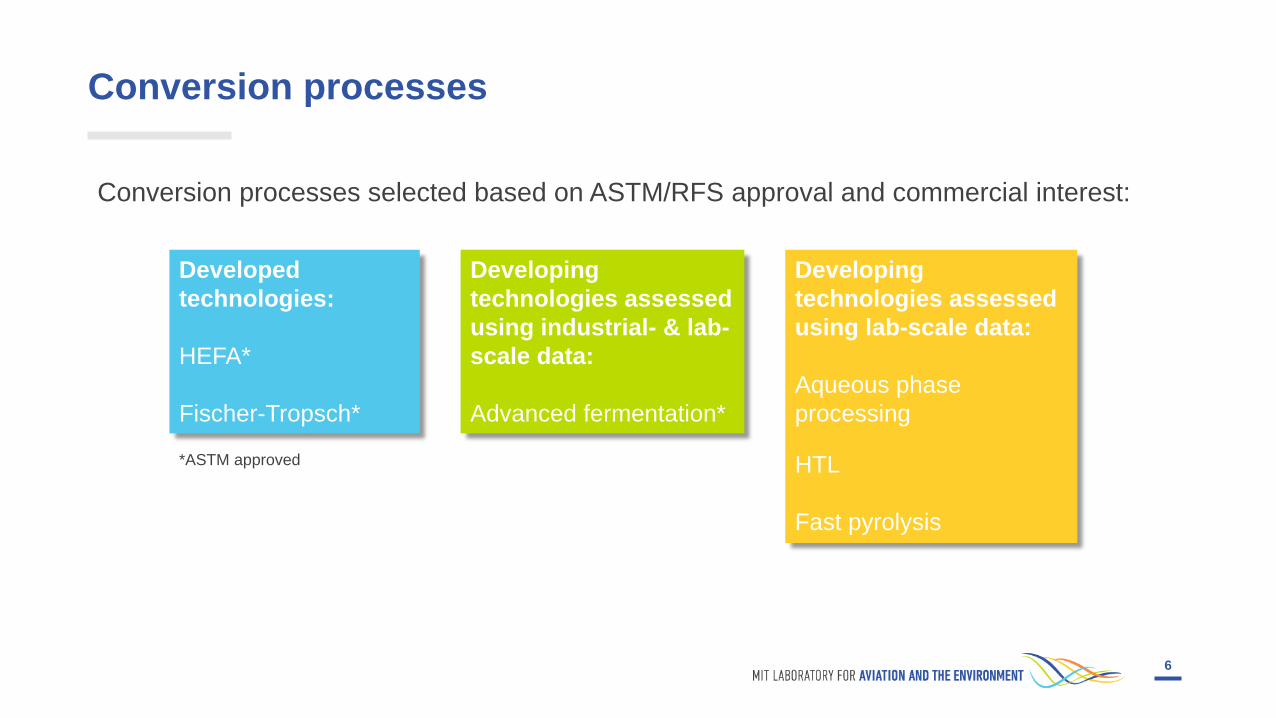
Conversion processes
Conversion processes selected based on ASTM/RFS approval and commercial interest:
Developed
technologies:
HEFA*
Fischer-Tropsch*
Developing
technologies assessed
using industrial- & lab-
scale data:
Advanced fermentation*
Developing
technologies assessed
using lab-scale data:
Aqueous phase
processing
HTL
Fast pyrolysis
*ASTM approved

7
Feedstock selection with corresponding pathway
Herbaceous
biomass
Energy crops
Waste greases
Corn grain
Sugarcane MSW
Woody biomass
Corn stover
• HEFA
• Advance fermentation
• Aqueous phase
processing
• Fischer-Tropsch
• Hydrothermal liquefaction
• Fast pyrolysis

8
Hydroprocessed esters and fatty acids process (HEFA)
Source: Pearlson et. al., 2013
Soybean oil
Yellow grease
Tallow
Hydro-deoxygena
tion
Isomerization and catalytic
crackingSeparation
Light ends, naphtha, jet and diesel
9
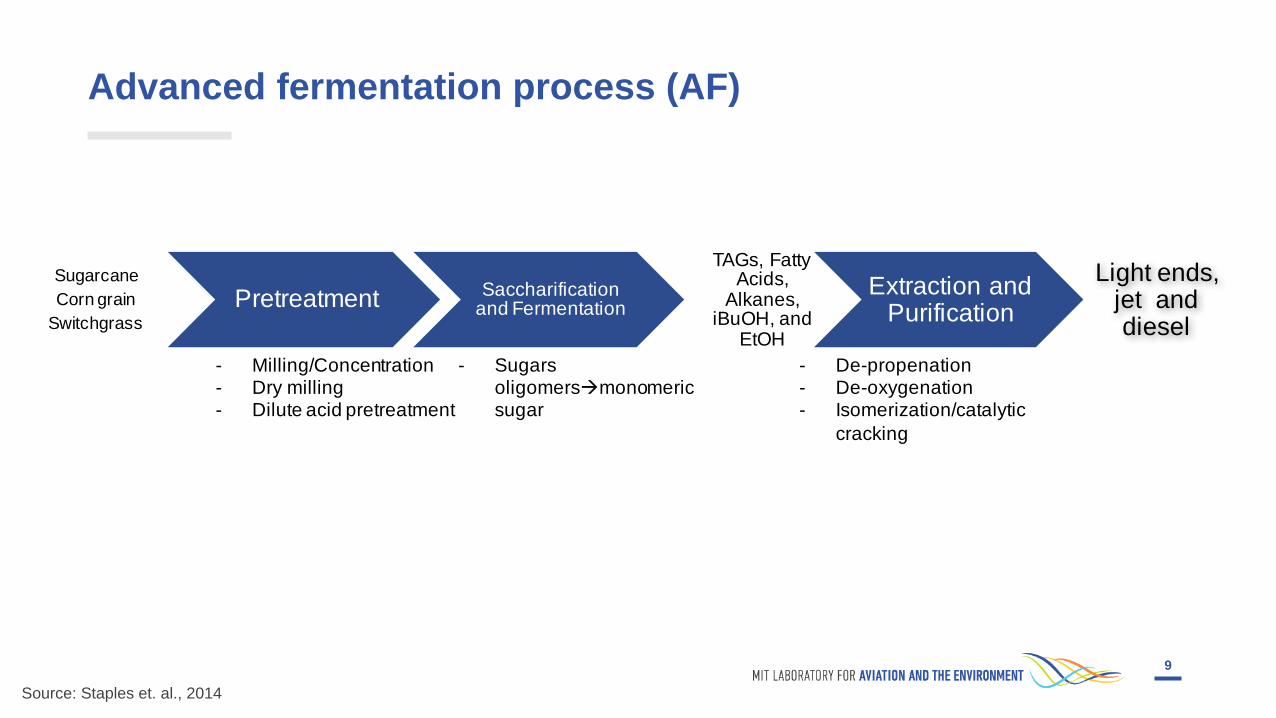
Advanced fermentation process (AF)
Source: Staples et. al., 2014
Sugarcane
Corn grain
Switchgrass
Pretreatment Saccharification and Fermentation
TAGs, FattyAcids,
Alkanes, iBuOH, and
EtOH
- Milling/Concentration- Dry milling- Dilute acid pretreatment
- Sugars oligomersàmonomeric sugar
Extraction and Purification
- De-propenation- De-oxygenation- Isomerization/catalytic
cracking
Light ends, jet and diesel
10
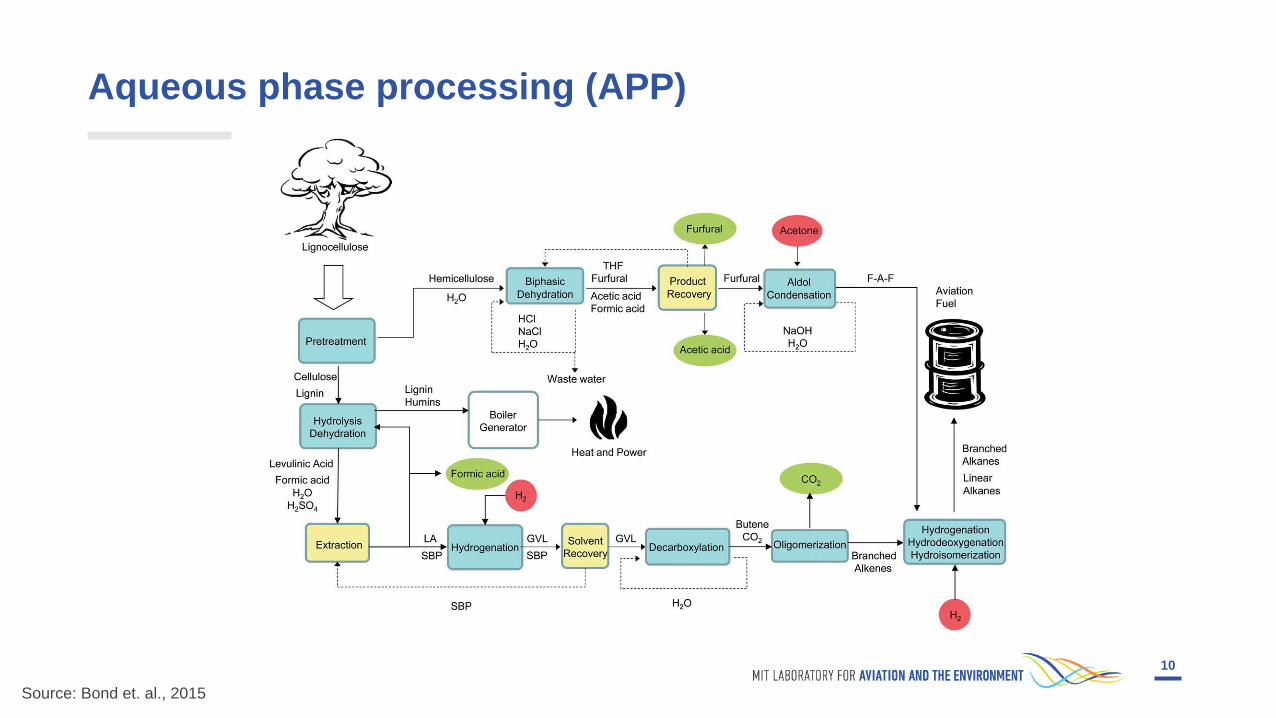
Aqueous phase processing (APP)
Source: Bond et. al., 2015
11
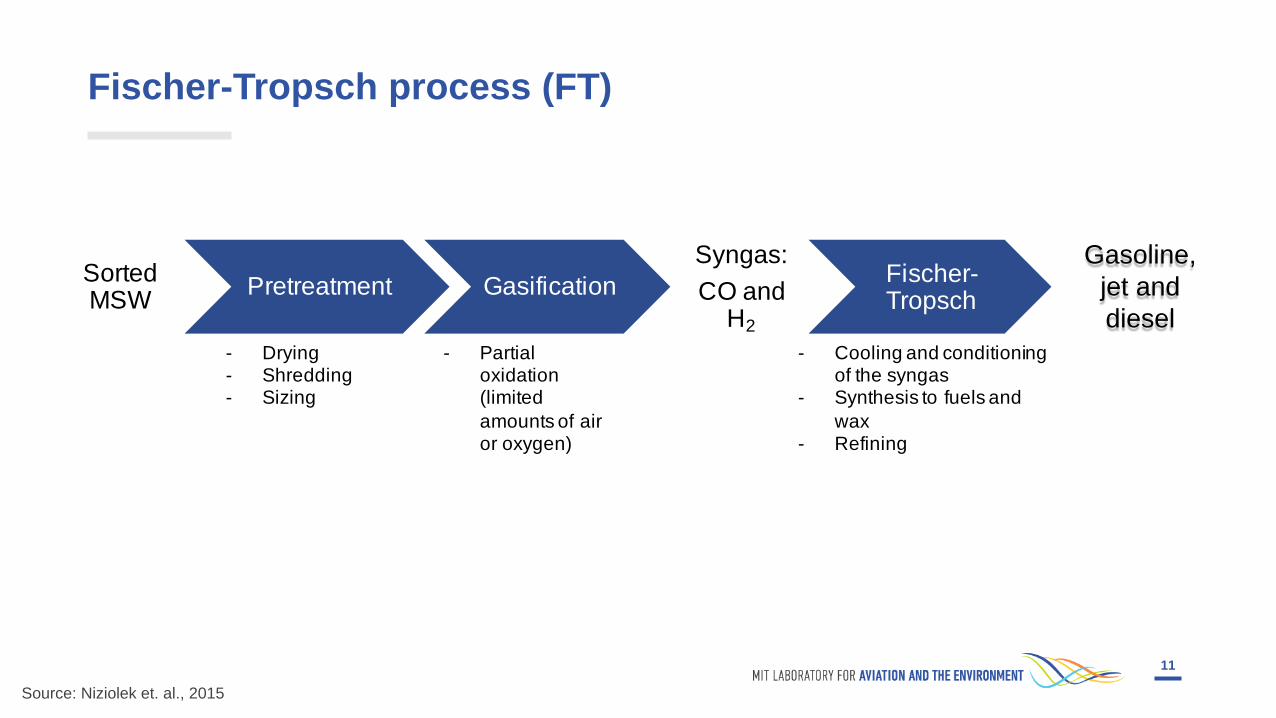
Fischer-Tropsch process (FT)
Source: Niziolek et. al., 2015
Sorted MSW
Pretreatment Gasification
Syngas:
CO and H2
- Drying- Shredding- Sizing
- Partial oxidation (limited
amounts of air or oxygen)
Fischer-Tropsch
- Cooling and conditioning of the syngas
- Synthesis to fuels and
wax- Refining
Light ends, jet and diesel
Gasoline,
jet and
diesel

12
Hydrothermal liquefaction process (HTL)
Source: Zhu et. al., 2014
Woody biomass Pretreatment
HTL process
Bio-oil
- Softening & preheating
Hydro-processing
- Hydrotreating- Hydrocracking & product
separation
Gasoline, jet and diesel

13
Fast pyrolysis and hydroprocessing (FPH)
Source: Bittner et. al., 2015; Brown et. al. 2012
Corn stover Pretreatment
Pyrolysis reaction
Bio-oil
- Chopping & drying
Hydro-processing
- Hydrotreating- Hydrocracking & product
separation
Gasoline, jet and diesel

14
Study process
Model pathway and determine mass and energy
flows
Estimate capital and operating
costs, collect market data and build
stochastic economic model
Compute minimum selling
price and net present value
Vary policy conditions
15
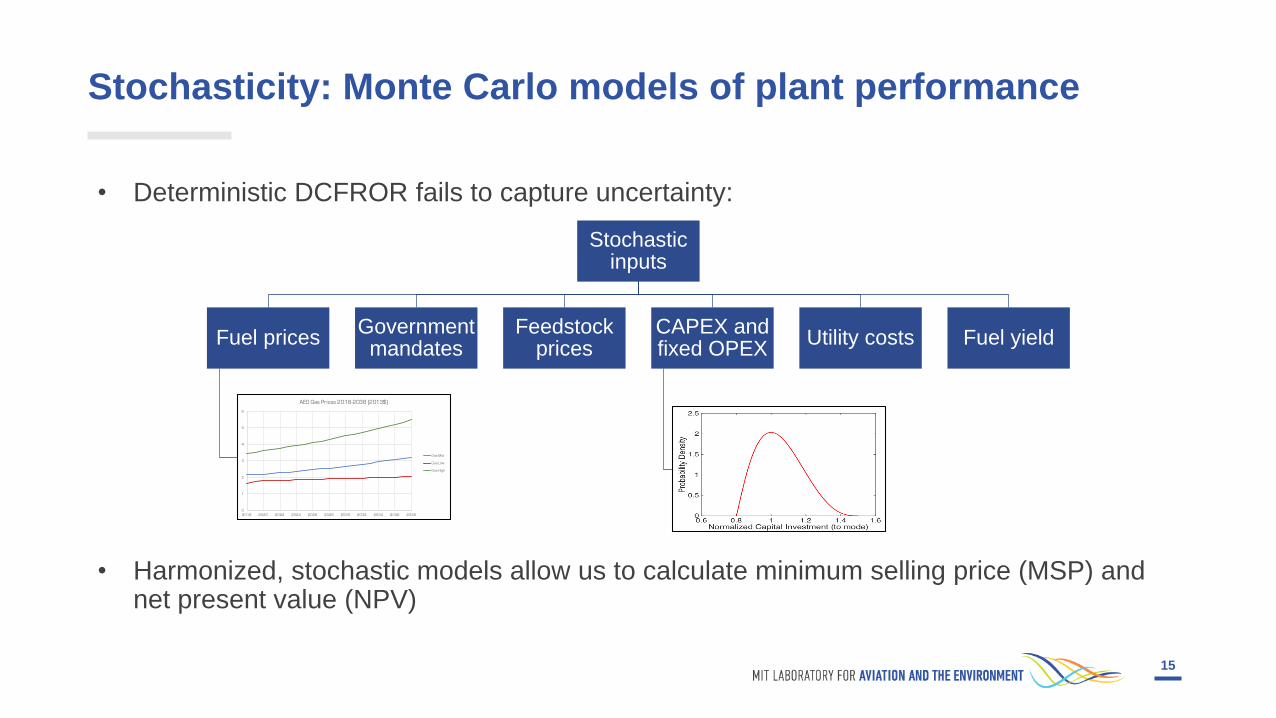
Stochasticity: Monte Carlo models of plant performance
• Deterministic DCFROR fails to capture uncertainty:
• Harmonized, stochastic models allow us to calculate minimum selling price (MSP) and net present value (NPV)
Stochasticinputs
Fuel pricesGovernment mandates
Feedstock prices
CAPEX and fixed OPEX
Utility costs Fuel yield
16
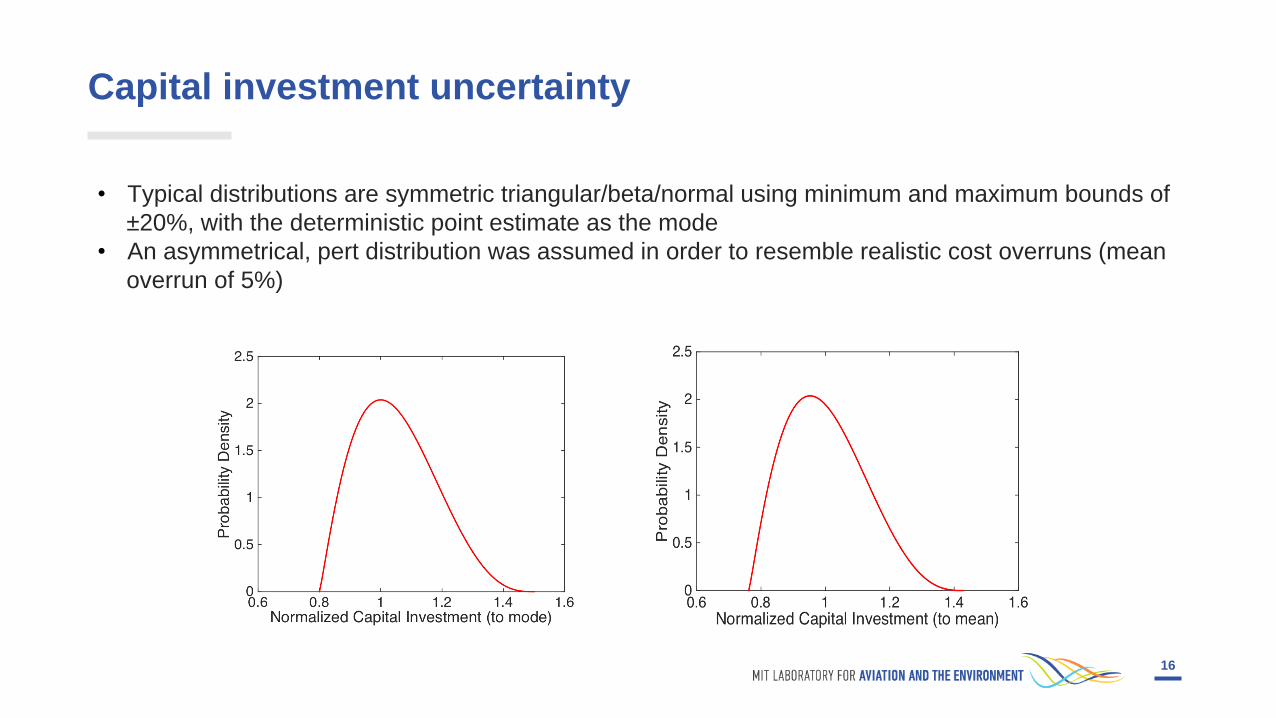
Capital investment uncertainty
• Typical distributions are symmetric triangular/beta/normal using minimum and maximum bounds of
±20%, with the deterministic point estimate as the mode
• An asymmetrical, pert distribution was assumed in order to resemble realistic cost overruns (mean
overrun of 5%)
17
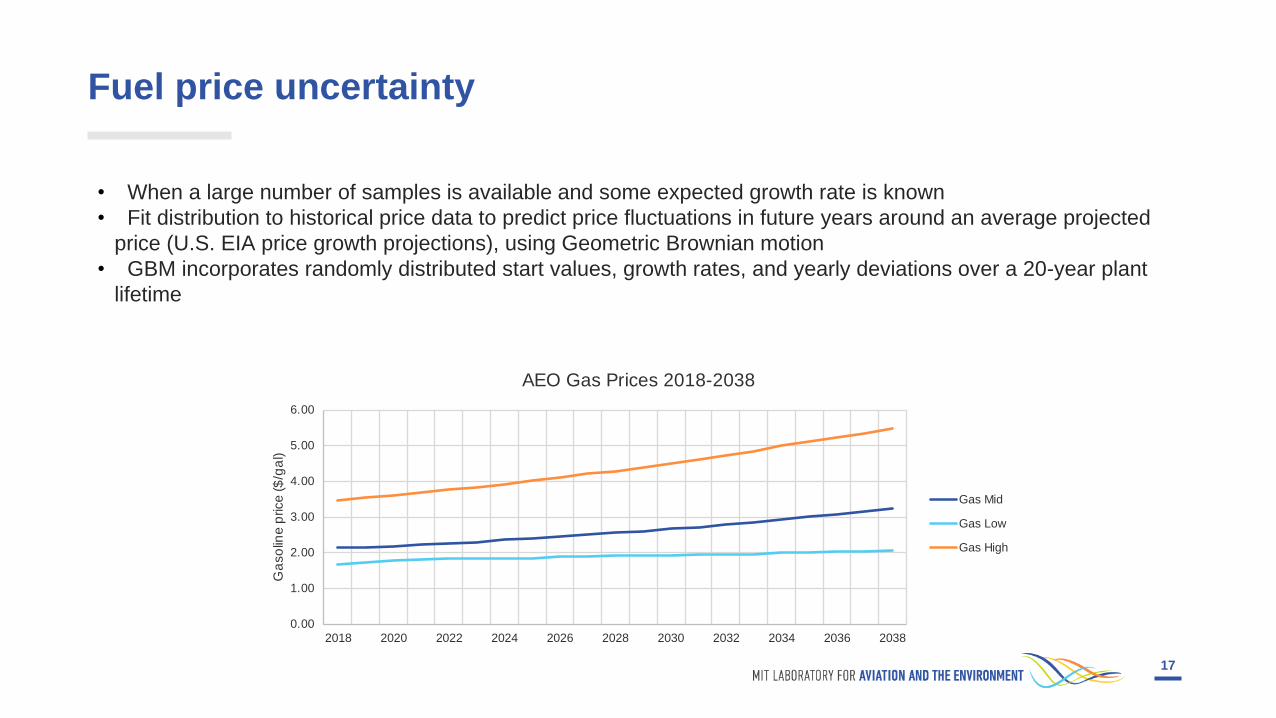
Fuel price uncertainty
• When a large number of samples is available and some expected growth rate is known
• Fit distribution to historical price data to predict price fluctuations in future years around an average projected
price (U.S. EIA price growth projections), using Geometric Brownian motion
• GBM incorporates randomly distributed start values, growth rates, and yearly deviations over a 20-year plant
lifetime
0.00
1.00
2.00
3.00
4.00
5.00
6.00
2018 2020 2022 2024 2026 2028 2030 2032 2034 2036 2038
Ga
so
line
price
($
/ga
l)
AEO Gas Prices 2018-2038
Gas Mid
Gas Low
Gas High

18
Study process
Model pathway and determine mass and energy
flows
Estimate capital and operating
costs, collect market data and build
stochastic economic model
Compute minimum selling
price and net present value
Vary policy conditions
19
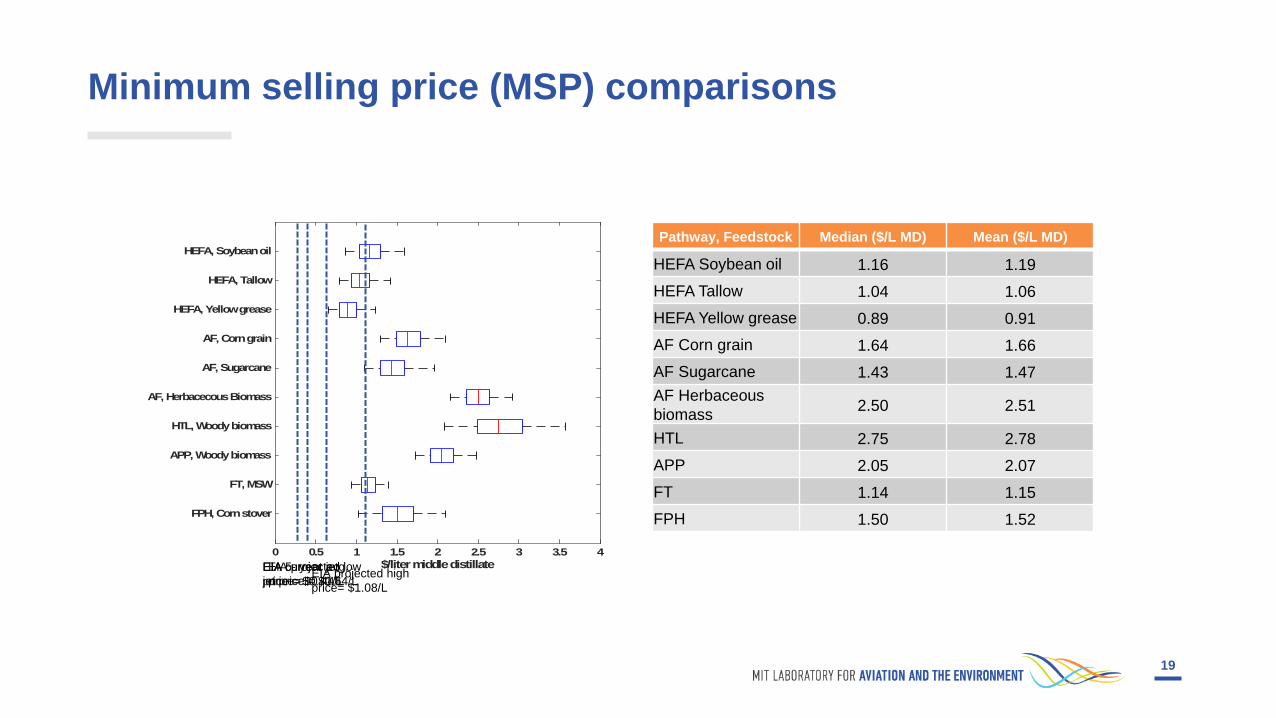
Minimum selling price (MSP) comparisons
Pathway, Feedstock Median ($/L MD) Mean ($/L MD)
HEFA Soybean oil 1.16 1.19
HEFA Tallow 1.04 1.06
HEFA Yellow grease 0.89 0.91
AF Corn grain 1.64 1.66
AF Sugarcane 1.43 1.47
AF Herbaceous
biomass2.50 2.51
HTL 2.75 2.78
APP 2.05 2.07
FT 1.14 1.15
FPH 1.50 1.52
EIA 5- year avg.
jet price = $0.64/L
0 0.5 1 1.5 2 2.5 3 3.5 4
$/liter middle distillate
FPH, Corn stover
FT, MSW
APP, Woody biomass
HTL, Woody biomass
AF, Herbacecous Biomass
AF, Sugarcane
AF, Corn grain
HEFA, Yellow grease
HEFA, Tallow
HEFA, Soybean oil
EIA current jet
price = $0.41/LEIA projected high
price= $1.08/L
EIA projected low
price= $0.44/L
20
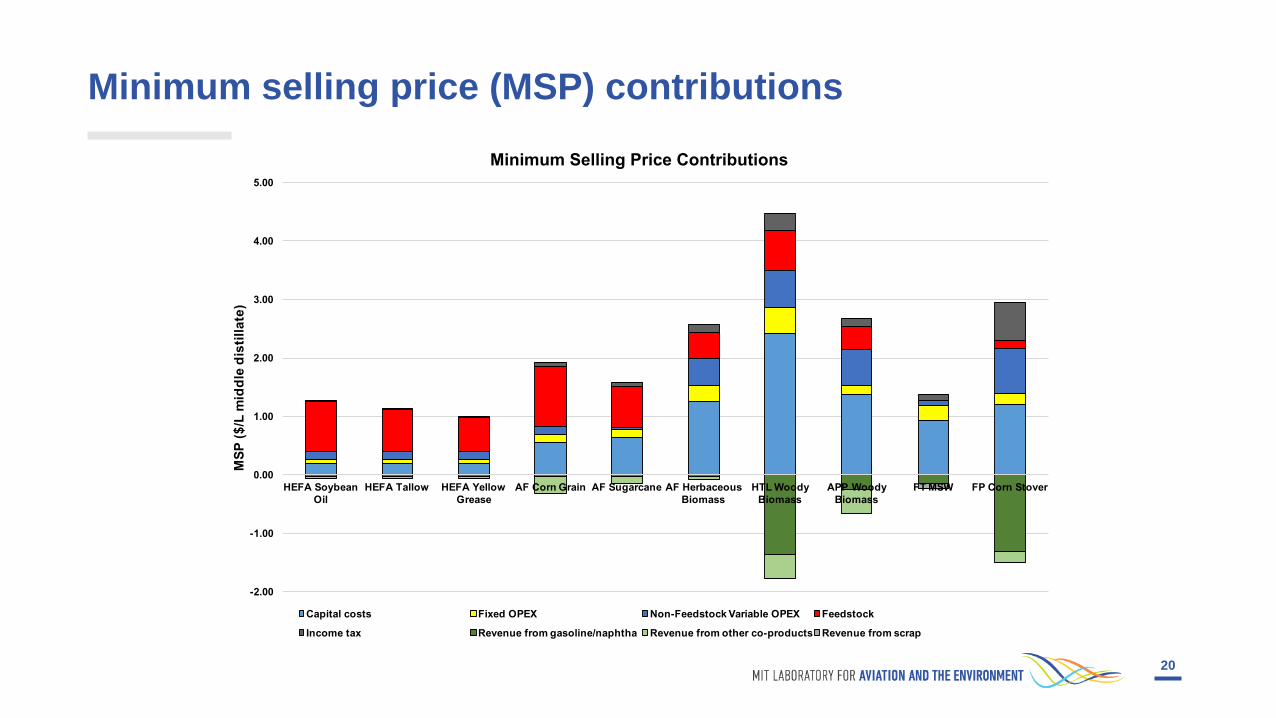
Minimum selling price (MSP) contributions
-2.00
-1.00
0.00
1.00
2.00
3.00
4.00
5.00
HEFA Soybean
Oil
HEFA Tallow HEFA Yellow
Grease
AF Corn Grain AF Sugarcane AF Herbaceous
Biomass
HTL Woody
Biomass
APP Woody
Biomass
FT MSW FP Corn Stover
MS
P (
$/L
mid
dle
dis
till
ate
)
Minimum Selling Price Contributions
Capital costs Fixed OPEX Non-Feedstock Variable OPEX Feedstock
Income tax Revenue from gasoline/naphtha Revenue from other co-products Revenue from scrap
21
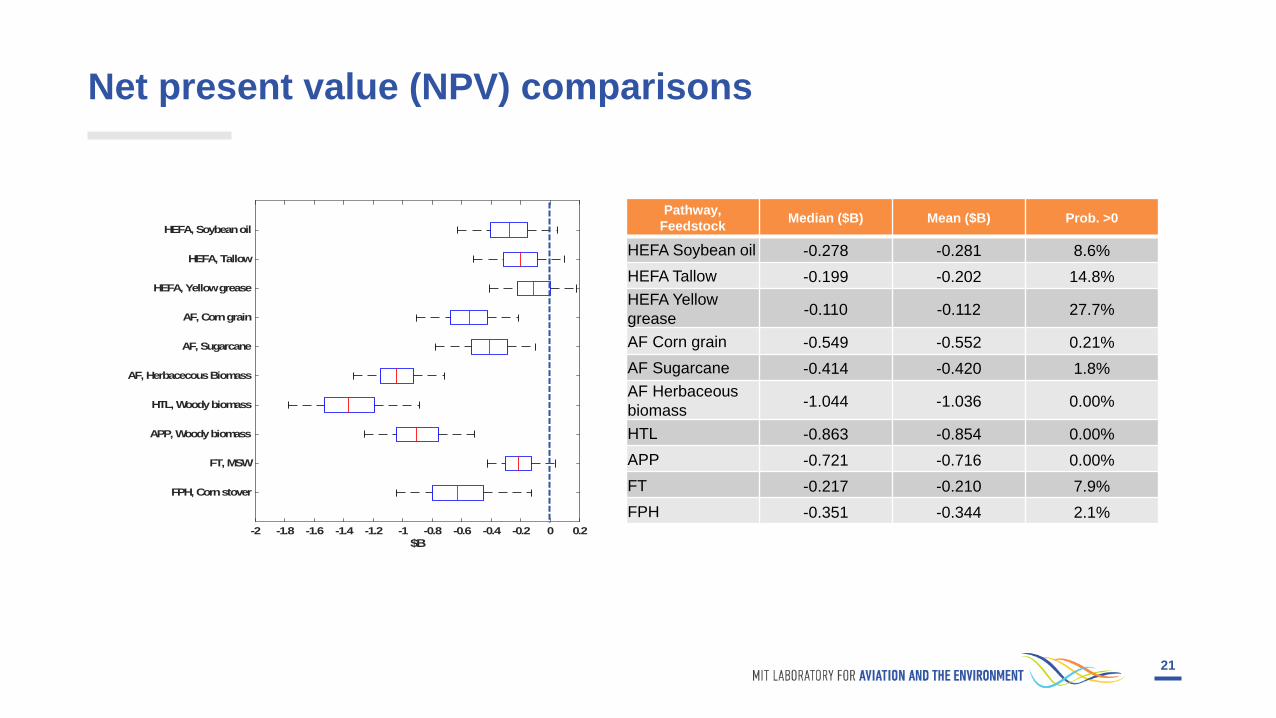
Net present value (NPV) comparisons
Pathway,
FeedstockMedian ($B) Mean ($B) Prob. >0
HEFA Soybean oil -0.278 -0.281 8.6%
HEFA Tallow -0.199 -0.202 14.8%
HEFA Yellow
grease-0.110 -0.112 27.7%
AF Corn grain -0.549 -0.552 0.21%
AF Sugarcane -0.414 -0.420 1.8%
AF Herbaceous
biomass-1.044 -1.036 0.00%
HTL -0.863 -0.854 0.00%
APP -0.721 -0.716 0.00%
FT -0.217 -0.210 7.9%
FPH -0.351 -0.344 2.1%-2 -1.8 -1.6 -1.4 -1.2 -1 -0.8 -0.6 -0.4 -0.2 0 0.2
$B
FPH, Corn stover
FT, MSW
APP, Woody biomass
HTL, Woody biomass
AF, Herbacecous Biomass
AF, Sugarcane
AF, Corn grain
HEFA, Yellow grease
HEFA, Tallow
HEFA, Soybean oil
22
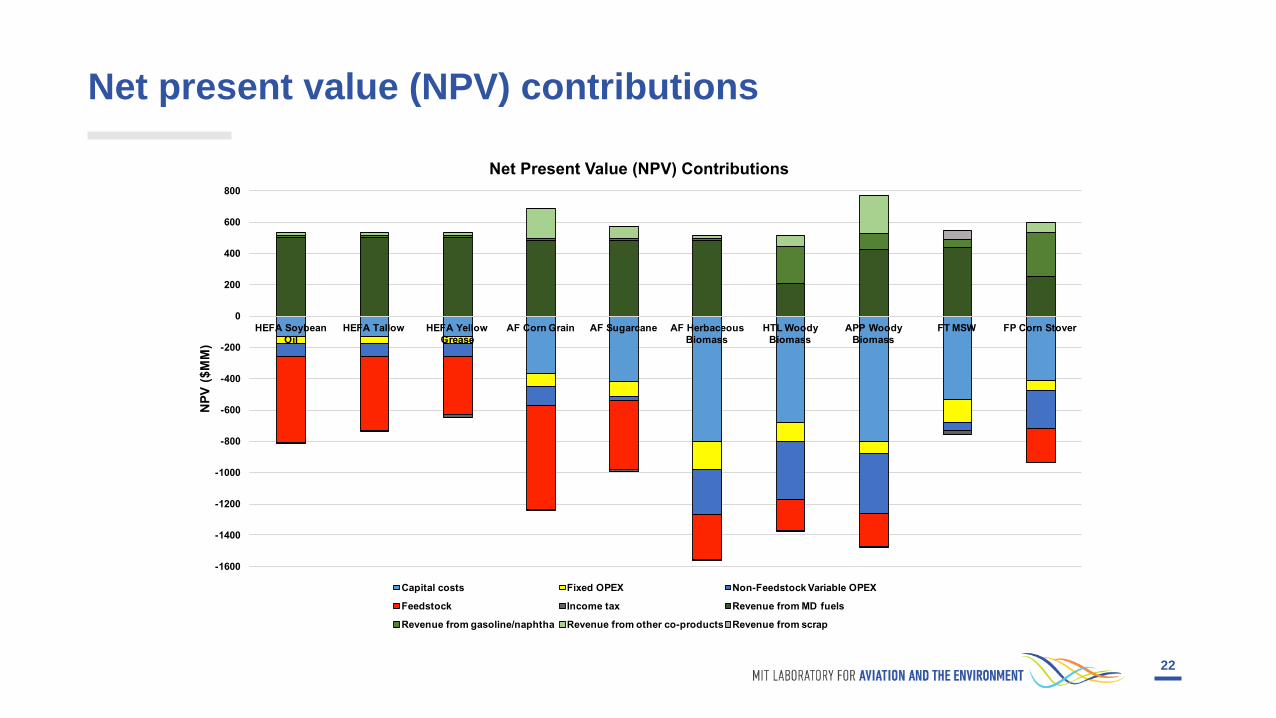
Net present value (NPV) contributions
-1600
-1400
-1200
-1000
-800
-600
-400
-200
0
200
400
600
800
HEFA Soybean
Oil
HEFA Tallow HEFA Yellow
Grease
AF Corn Grain AF Sugarcane AF Herbaceous
Biomass
HTL Woody
Biomass
APP Woody
Biomass
FT MSW FP Corn Stover
NP
V (
$M
M)
Net Present Value (NPV) Contributions
Capital costs Fixed OPEX Non-Feedstock Variable OPEX
Feedstock Income tax Revenue from MD fuels
Revenue from gasoline/naphtha Revenue from other co-products Revenue from scrap
23
Study process
Model pathway and determine mass and energy
flows
Estimate capital and operating
costs, collect market data and build
stochastic economic model
Compute minimum selling
price and net present value
Vary policy conditions

24
Renewable Identification Numbers (RINs)
RIN CategoryGHG Intensity
Reduction
Feedstock
Examples
Pathway
Examples
Renewable fuel 20% Corn starch
Dry mill
process,
fermentation
Advanced
biofuel50%
Sugarcane,
corn stover,
soybean oil
HEFA, AF
Biomass-based
diesel50%
Sugarcane,
corn stover,
soybean oil
HEFA, AF
Cellulosic
biofuel/biodiesel60%
Woody
biomass,
switchgrass
FPH, HTL
Incre
asin
g v
alu
e
25
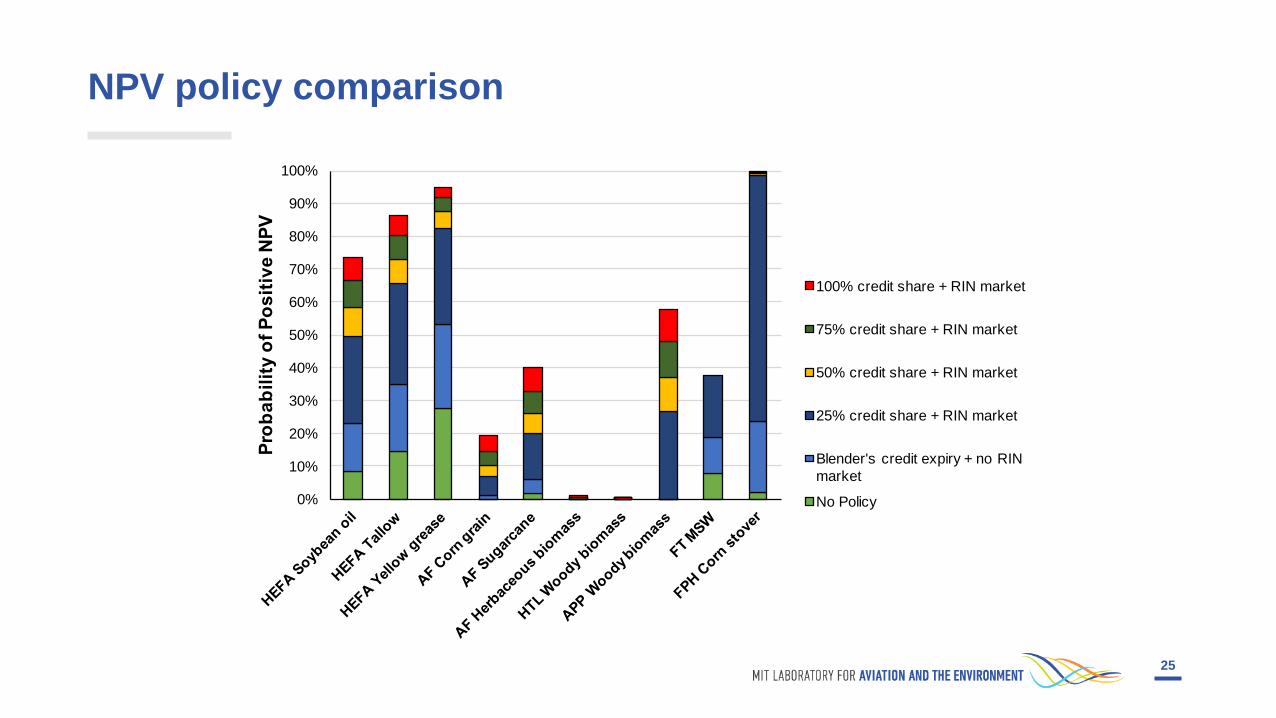
NPV policy comparison
0%
10%
20%
30%
40%
50%
60%
70%
80%
90%
100%
Pro
ba
bil
ity
of
Po
sit
ive
NP
V100% credit share + RIN market
75% credit share + RIN market
50% credit share + RIN market
25% credit share + RIN market
Blender's credit expiry + no RIN
market
No Policy

27
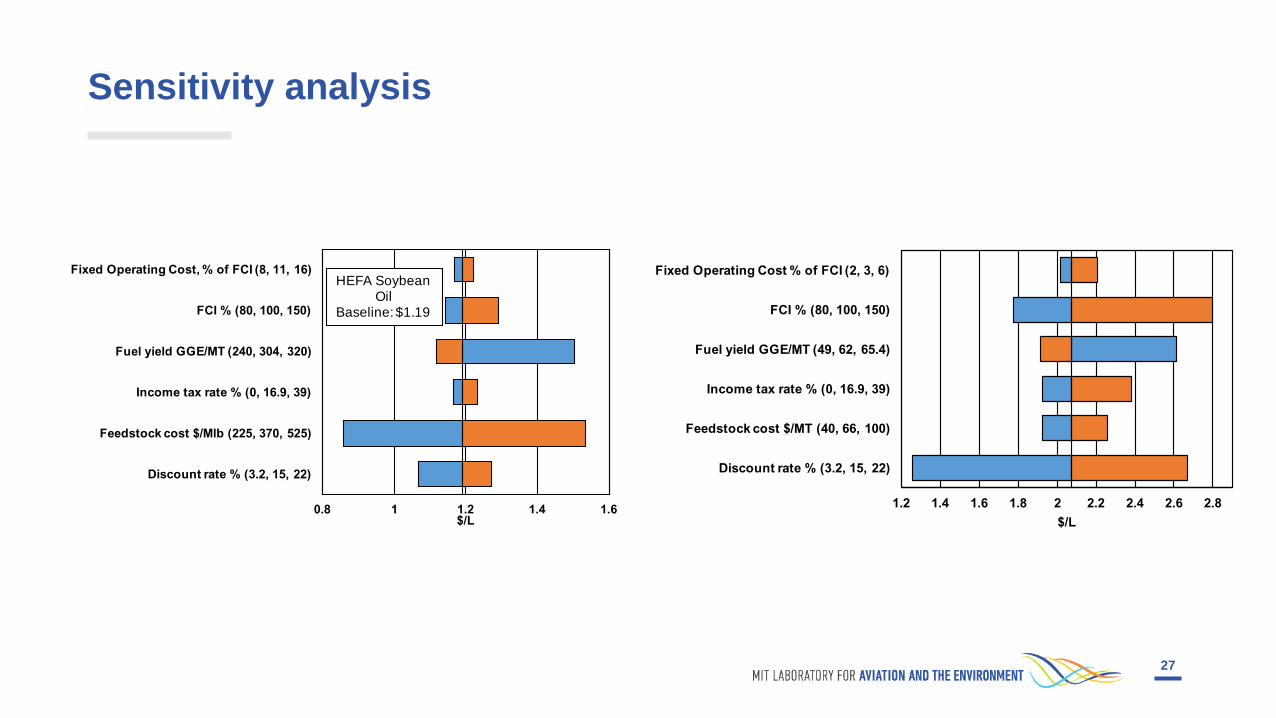
Sensitivity analysis
0.8 1 1.2 1.4 1.6
Discount rate % (3.2, 15, 22)
Feedstock cost $/Mlb (225, 370, 525)
Income tax rate % (0, 16.9, 39)
Fuel yield GGE/MT (240, 304, 320)
FCI % (80, 100, 150)
Fixed Operating Cost, % of FCI (8, 11, 16)
$/L
HEFA Soybean Oil
Baseline: $1.19
1.2 1.4 1.6 1.8 2 2.2 2.4 2.6 2.8
Discount rate % (3.2, 15, 22)
Feedstock cost $/MT (40, 66, 100)
Income tax rate % (0, 16.9, 39)
Fuel yield GGE/MT (49, 62, 65.4)
FCI % (80, 100, 150)
Fixed Operating Cost % of FCI (2, 3, 6)
$/L