the cost of nationalising the water industry in england · the cost of nationalising the water ......
TRANSCRIPT

The cost of nationalising the water industry in England

2
FIRST PUBLISHED BY
The Social Market Foundation, February 2018
11 Tufton Street, London SW1P 3QB
Copyright © The Social Market Foundation, 2018
ISBN: 978-1-910683-33-0
The moral right of the author(s) has been asserted. All rights reserved. Without limiting the rights under copyright reserved above, no part of this publication may be reproduced, stored or introduced into a retrieval system, or transmitted, in any form or by any means (electronic, mechanical, photocopying, recording, or otherwise), without the prior written permission of both the copyright owner and the publisher of this book.
THE SOCIAL MARKET FOUNDATION
The Foundation’s main activity is to commission and publish original papers by independent academic and other experts on key topics in the economic and social fields, with a view to stimulating public discussion on the performance of markets and the social framework within which they operate. The Foundation is a registered charity and a company limited by guarantee. It is independent of any political party or group and is funded predominantly through sponsorship of research and public policy debates. The views expressed in this publication are those of the author, and these do not necessarily reflect the views of the sponsors or the Social Market Foundation.
CHAIR DIRECTOR Mary Ann Sieghart James Kirkup
MEMBERS OF THE BOARD Matthew d’Ancona
Baroness Olly Grender MBE
Nicola Horlick
Baroness Tessa Jowell DBE
Sir Brian Pomeroy CBE
Peter Readman
Baroness Gillian Shepherd
ACKNOWLEDGMENTS
This report was commissioned by Anglian Water, Severn Trent, South West Water and United Utilities, and was produced independently by the Social Market Foundation, which retains full editorial independence, using publicly available information and sources. Any views expressed in the report do not necessarily reflect those of the commissioning bodies.
3
CONTENTS
EXECTUIVE SUMMARY ............................................................................................................. 4
Purpose of the research .............................................................................................. 4
Research findings ....................................................................................................... 4
CHAPTER 1: INTRODUCTION AND CONTEXT ............................................................................... 6
CHAPTER 2: WHAT IS THE VALUE OF ENGLAND’S WATER COMPANIES? ........................................7
What is the “takeover value” for the water companies? ..................................................7
Ofwat’s “Regulatory Capital Value” as a gauge of takeover value ................................... 8
Enterprise value ......................................................................................................... 10
Other considerations .................................................................................................. 11
Would the government need to pay the “takeover value” for the water companies? ....... 12
CHAPTER 3: IMPLICATIONS FOR THE PUBLIC FINANCES OVER TIME .......................................... 14
Borrowing costs and profits – can water nationalisation pay for itself? ........................... 14
Future investment requirements ................................................................................. 17
CHAPTER 4: IMPLICATIONS FOR BILLPAYERS AND UK HOUSEHOLDS .......................................... 19
Who owns the water companies and who would be directly affected by nationalisation? 19
Implications for billpayers .......................................................................................... 20
CHAPTER 5: ALTERNATIVE OWNERSHIP MODELS .................................................................... 22
Companies Limited by Guarantee or consumer mutuals ............................................... 22
Municipalisation........................................................................................................ 23
CHAPTER 6: CONCLUSIONS ................................................................................................... 24
4
EXECTUIVE SUMMARY
Purpose of the research
This report presents the Social Market Foundation’s assessment of the likely costs associated with nationalising the water and sewerage industry in England (generally referred to here as just “the water industry”). The research draws on a range of existing academic studies, as well as publicly available data from Ofwat, the London Stock Exchange and the annual accounts of the water companies. The report seeks to provide an overview of the likely implications of nationalisation on public sector debt levels, and to provide points for discussion with respect to the ongoing impacts of nationalisation for public sector net borrowing.
We emphasise that this report is not a full assessment of the merits and drawbacks of a nationalised versus a privatised water industry; our focus here is to consider the costs that the government could initially face if it wished to purchase the companies from their current owners.
Research findings
The key findings of our research are:
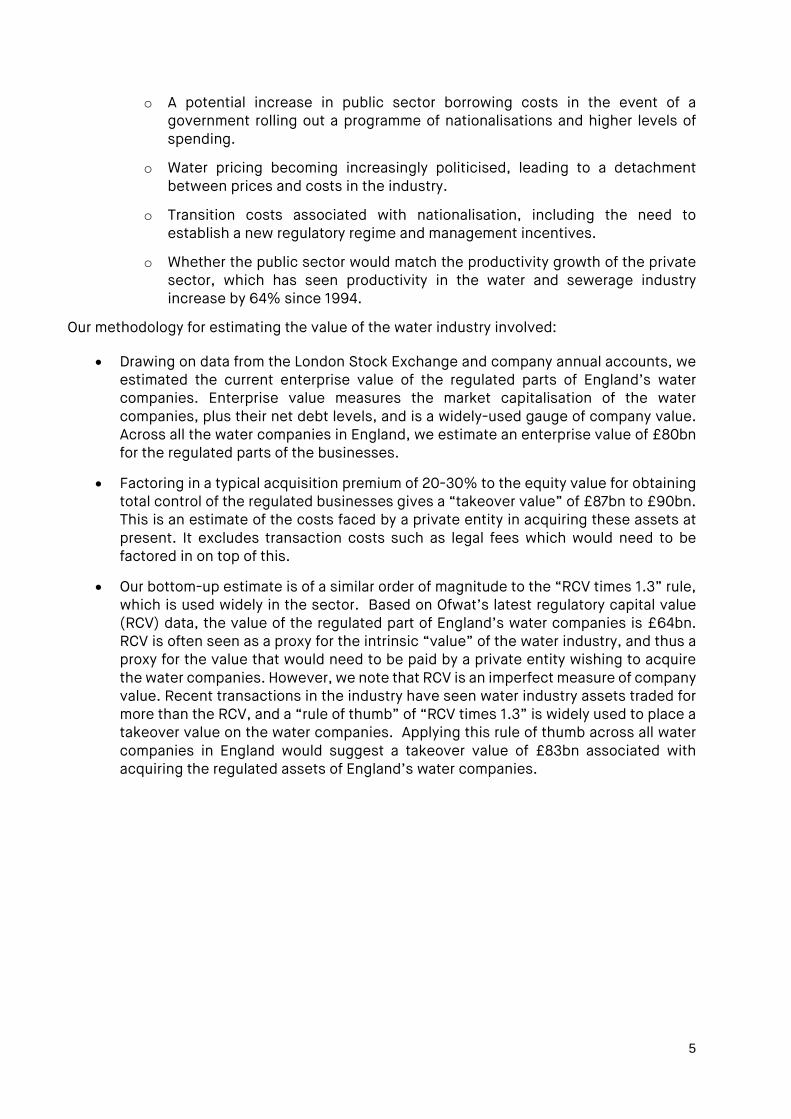
• Our best estimate of the costs of obtaining control of the regulated businesses gives a ‘takeover value’ of £90bn.
• If the government were to purchase the water industry’s assets at a takeover value of £90bn, it would entail a 5% increase in government debt levels.
• The government would also need to meet the long-term investment requirements in the water sector, which we estimate to stand at over £100bn over the next 25 years, in 2016/17 prices. The research assesses how public sector capital expenditure would have been divided in the 2016/17 fiscal year, if water investment in that year was undertaken by the government. It reveals that water investment would be the third biggest category of capital expenditure, accounting for 13% of all public capital expenditure.
• If the government were to acquire the water industry’s assets for less than the market price, it would have financial implications for UK households, including the workers in the water companies. There are major UK ownership interests in the listed companies with more than six in ten of shareholders across all three listed regional water and sewerage companies being UK-based. The figures are similar across the three listed firms, ranging from 60% in Severn Trent to 70% in Pennon (owner of South West Water and Bournemouth Water). Further, many workers own shares in the listed water companies. A third of employees in United Utilities participate in their employee share scheme, as do two thirds of South West Water employees and 70% of Severn Trent’s UK employees.
• If it were to purchase the water companies in England, the government would acquire an asset which at present makes a profit. A wide range of factors would determine the profitability and self-sufficiency of a state-owned water industry. Factors that could affect profitability include:
5
o A potential increase in public sector borrowing costs in the event of a government rolling out a programme of nationalisations and higher levels of spending.
o Water pricing becoming increasingly politicised, leading to a detachment between prices and costs in the industry.
o Transition costs associated with nationalisation, including the need to establish a new regulatory regime and management incentives.
o Whether the public sector would match the productivity growth of the private sector, which has seen productivity in the water and sewerage industry increase by 64% since 1994.
Our methodology for estimating the value of the water industry involved:
• Drawing on data from the London Stock Exchange and company annual accounts, we estimated the current enterprise value of the regulated parts of England’s water companies. Enterprise value measures the market capitalisation of the water companies, plus their net debt levels, and is a widely-used gauge of company value. Across all the water companies in England, we estimate an enterprise value of £80bn for the regulated parts of the businesses.
• Factoring in a typical acquisition premium of 20-30% to the equity value for obtaining total control of the regulated businesses gives a “takeover value” of £87bn to £90bn. This is an estimate of the costs faced by a private entity in acquiring these assets at present. It excludes transaction costs such as legal fees which would need to be factored in on top of this.
• Our bottom-up estimate is of a similar order of magnitude to the “RCV times 1.3” rule, which is used widely in the sector. Based on Ofwat’s latest regulatory capital value (RCV) data, the value of the regulated part of England’s water companies is £64bn. RCV is often seen as a proxy for the intrinsic “value” of the water industry, and thus a proxy for the value that would need to be paid by a private entity wishing to acquire the water companies. However, we note that RCV is an imperfect measure of company value. Recent transactions in the industry have seen water industry assets traded for more than the RCV, and a “rule of thumb” of “RCV times 1.3” is widely used to place a takeover value on the water companies. Applying this rule of thumb across all water companies in England would suggest a takeover value of £83bn associated with acquiring the regulated assets of England’s water companies.

6
CHAPTER 1: INTRODUCTION AND CONTEXT
The water industry in England and Wales was privatised in 1989 under the government of Margaret Thatcher. This was a pioneering policy; to this day, England and Wales are the only countries in the world to have a fully privatised water and sewerage system.
The Labour Party, under the leadership of Jeremy Corbyn, has proposed an agenda of nationalisation which would be implemented if it were to become the party of Government. Speaking at the 2017 Labour Party conference, the Shadow Chancellor John McDonnell suggested that the water industry would be included in this programme of nationalisation.
If the water and sewerage system were to be nationalised, it could entail significant financial costs for the government. Purchasing the assets of the water companies, and taking on their debts, could entail a substantial addition to government debt levels. The extent to which the government could make a “profit” or cover the costs associated with the industry depends on a wide range of factors.
This report presents the Social Market Foundation’s assessment of the likely costs associated with nationalising the water industry in England. The Wales Act 2017 formally devolved responsibility for water and sewerage policy in Wales to the Welsh government. Water nationalisation in Wales is not considered in this report. In Scotland and Northern Ireland, water and sewerage are already run by state-owned organisations – Northern Ireland Water and Scottish Water – meaning that they are also not included in this analysis.
We emphasise that this report is not a full assessment of the merits and drawbacks of a nationalised versus a privatised water industry; our focus here is to consider the costs that the government could initially face if it wished to purchase the companies from their current owners. Other issues around water nationalisation are discussed at a much higher level; we are not seeking to carry out a full cost-benefit analysis here.
The structure of this report is as follows:
• Chapter 2 provides an assessment of the underlying value of the water industry in England. That is, it considers what a reasonable “takeover value” for the water companies would be, based on conventional measures of company valuation and data used by the water regulator, Ofwat.
• Chapter 3 examines other financial considerations for a government wishing to nationalise the water industry, beyond the takeover value.
• Chapter 4 discusses the potential implications of water nationalisation for UK billpayers, including an assessment of the potential distributional consequences. It also considers the ownership structure of the water companies in England, and the implications of nationalisation for those that currently have a stake in England’s water companies.
• Chapter 5 examines the implications of mutualisation and other alternative ownership models for the water industry.
• Chapter 6 draws conclusions from the preceding analysis.

7
CHAPTER 2: WHAT IS THE VALUE OF ENGLAND’S WATER COMPANIES?
This chapter of the report considers the appropriate “takeover value” of England’s water companies – the value that would typically be faced by a private entity wishing to purchase the companies. If the UK government were to nationalise the water industry in England, one approach would be for it to do so by purchasing the companies according to their takeover values.
Having said that, the UK government could decide to pay below a conventional takeover value for the water companies. This would have corresponding negative financial implications for those holding a stake in the companies and potentially for investor confidence in other parts of the economy. We discuss these issues later in this chapter.
The UK government would need to purchase a range of companies if it were to nationalise the water industry in England – the nine large regional water and sewerage monopolies (1-9 in the list below), plus a number of small water-only companies:
1. Anglian Water Services Limited 2. Northumbrian Water Limited 3. Severn Trent Water Limited 4. South West Water Limited1 5. Southern Water Services Limited 6. Thames Water Utilities Limited 7. United Utilities Water Limited 8. Wessex Water Services Limited 9. Yorkshire Water Services Limited 10. Affinity Water Limited 11. Bristol Water plc 12. Dee Valley Water plc (which supplies water to parts of North West England in
addition to North East Wales) 13. Portsmouth Water Limited 14. Sutton & East Surrey Water plc 15. South East Water Limited 16. South Staffordshire Water plc
What is the “takeover value” for the water companies?
The takeover value for purchasing the companies listed above is subject to debate and there are a range of methodologies that could be adopted.
Establishing an estimate of company value is complicated by the fact that only three of the nine regional water companies – United Utilities, Pennon and Severn Trent - are publicly listed. As such, for six companies, there is no data on market capitalisation which can feed into an estimate of company valuation.
Even for the listed companies, there is significant debate to be had around the extent to which widely-used metrics such “market capitalisation” (the aggregate value of the outstanding shares in a company) and “enterprise value” are fair reflections of the “takeover value” of a company. Volatility in share prices means market capitalisation is sometimes subject to significant variation over short spaces of time.

8
Furthermore, we note that the prospect of nationalisation can depress share prices for a company. That is to say, the rhetoric of a government with respect to nationalisation and the price it is willing to pay for assets has an impact on market capitalisation. For example, if it became evident that a nationalising government would pay less than the current share price for a company, the share prices would fall accordingly to reflect this. In such circumstances, one could argue that a measure of company value based on share price is unlikely to be a fair reflection of its intrinsic worth.
In addition, we note that mergers and acquisitions often see buyers of companies paying an “acquisition premium” over and above the inherent value of a company2. It is unclear whether or not a nationalising government would pay such an acquisition premium.
Another consideration is the segments of the companies that would be purchased. We work on the basis that the government would only purchase the regulated parts of the water and sewerage companies. Some companies, such as Pennon, have sizeable non-regulated parts to their businesses, such as waste management services, which the government is unlikely to want to nationalise.
Below, we discuss potential approaches for assessing the takeover value of England’s water industry and provide estimates of the current takeover value of the industry. This value may well be considerably different in the future, depending on the proposed timing of a nationalisation. Nevertheless, we believe what follows gives a useful order of magnitude for the likely takeover value of the industry.
Ofwat’s “Regulatory Capital Value” as a gauge of takeover value
Regulatory Capital Value (RCV) is a key measure developed and used by Ofwat – the economic regulator of the water sector in England & Wales – to set price limits in regulated parts of the water industry.
The RCV starts with a direct measure of the value placed on each company’s capital and debt by the financial markets following privatisation. This initial RCV is calculated as the average of the market value of each water and sewerage company for the first 200 days for which the shares were listed, plus the total value of debt at privatisation. A proxy for the initial market value was used for the water only companies that were not privatised in 1989 (and hence no market information was available). This initial value was taken as the opening value of the RCV for 1990.
This initial value is rolled forward each year. The RCV is recalculated annually in outturn prices. The closing value from the previous year is adjusted by the movement in the retail price index (RPI). This adjusted figure gives the opening value for the year.
Capital expenditure to enhance and maintain the water and sewerage network, which is assumed in setting price limits, is added to the RCV. Any capital grants or contributions towards the cost of the new assets are deducted. Current cost depreciation, which is assumed in setting price limits, is deducted from the RCV each year.
Expenditure in any one year to maintain and replace infrastructure assets is not directly added to the RCV, but compared with the infrastructure renewals charge (IRC). The balance, the infrastructure renewals accrual or prepayment, is added to or deducted from the RCV each year. This reflects the extent to which more (or less) money has been spent on maintaining the

9
infrastructure asset base than assumed in price limits, thus increasing (or decreasing) the value of the capital base to be remunerated.
Ofwat notes that “RCV is now widely used by the investment community as a proxy for the market value of the regulated businesses”3. Given this, there is a case to be made for taking the RCV of the regulated water industries in England to represent the takeover value associated with nationalisation. As table 1 below shows, the latest Ofwat estimates put the RCV of the water and sewerage industry in England & Wales at £69bn in March 2017. Excluding Welsh Water gives a total RCV of about £64bn for the water companies operating in England4.
Table 1 RCV at 31 March 2017, in March 2017 prices RCV - £ million
Anglian Water Services Limited 7,376
Welsh Water 5,218
Northumbrian Water Limited 4,014
Severn Trent Water Limited 8,244
South West Water Limited 3,2915
Southern Water Services Limited 4,620
Thames Water Utilities Limited 12,944
United Utilities Water Limited 10,565
Wessex Water Services Limited 2,942
Yorkshire Water Services Limited 6,144
Affinity Water Limited 1,156
Bristol Water plc 471
Dee Valley Water plc 89
Portsmouth Water Limited 136
Sutton & East Surrey Water plc 234
South East Water Limited 1,231
South Staffordshire Water plc 348
Industry total 69,022
Source: Ofwat
However, while RCV is a widely-used proxy for the value of the water companies, it is unlikely to be a perfect measure. In recent years, water assets have commonly traded hands with a premium above RCV, and “RCV times 1.3” has become a widely-used rule of thumb for assessing the takeover value of water companies6. The fact that takeover values for companies are often above RCV is likely to reflect the ability of some companies to outperform the expectations of the regulator. They may do this in a number of ways, including: over-achieving against Outcomes Delivery Incentives and

10
thus gaining additional financial rewards, acquiring capital at a lower cost than the baseline and / or delivering their services with a higher level of efficiency than required.
Based on this rule of thumb, an appropriate takeover value for the water industries in England is arguably a mark-up above the RCV: £64bn x 1.3 = £83bn.
Enterprise value
A widely used measure of the value of a company used in takeovers is “enterprise value”. Enterprise value (EV) is calculated as the market capitalization (the value of outstanding shares in a company) plus debt, minority interest and preferred shares, minus total cash and cash equivalents.
Enterprise value (EV) can be thought of as the theoretical takeover price of a company. EV differs significantly from market capitalisation in several ways, and many consider it to be a more accurate representation of a firm's value. The value of a firm's debt, for example, might need to be paid off by the buyer when taking over a company. In that case, enterprise value provides a more accurate takeover valuation because it includes debt in its value calculation, unlike market capitalisation.
There are similarities between EV and RCV, and investors often use RCV as a proxy for EV. Nevertheless, there are reasons to expect a difference between these two metrics (such as those described above) – which could leave us with two markedly different estimates of takeover value.
Given this, the SMF has attempted to estimate the EV for the regulated aspects of the water companies in England. This requires us to gather data on market capitalisation and net debt for the companies in question.
Net debt information has been gathered from the latest regulated annual accounts of the water companies.
Market capitalisation data has been gathered from the London Stock Exchange for the three listed water companies.7 By comparing regulated pre-tax profit to the group’s pre-tax profit we were able to form a judgement on what proportion of the listed companies market capitalisation related to the regulated parts of their businesses. For the unlisted companies, we have produced an estimate of the theoretical market capitalisation. To do this, we have applied the average price-to-earnings ratio of two8 of the listed companies (United Utilities and Severn Trent) to the regulated earnings data gathered from the annual accounts of the unlisted companies. Multiplying these two variables together provides an estimated market capitalisation. To account for volatility, we have taken a five-year average of market capitalisation.
As table 2 below shows, our estimates suggest a total enterprise value of £80bn for the water industries in England. This includes the value of net debt for the water companies, this information was sourced from their 2016/17 annual reports. This is approximately 25% higher than the £64bn RCV stated earlier, though this is perhaps not surprising. An EV in excess of RCV can potentially be explained if markets believe that the water companies can make more money than the regulator, Ofwat, has assumed – something that ought to be reflected in the market value for the companies.

11
Table 2 Estimated enterprise value, March 2017, £ million
A Implied market value (based on five-year average of share prices and earnings data)
33,989
B Net debt, March 2017 45,788
C = A+B Approximate enterprise value 79,776
Source: SMF analysis. Numbers may not sum due to rounding
As we noted earlier, an “acquisition premium” for control is usually paid in the event of market takeovers, with a typical premium of 20-30% on share prices widely cited in the business and academic literature9. Applying such a share price premium gives us an estimated takeover value – that is, the enterprise value plus a control premium that arguably ought to be paid by the government, in line with usual conventions for company takeover. A 20% premium gives a takeover value of about £87bn, while a 30% premium gives a takeover value of about £90bn.
Table 3 Estimated takeover value, March 2017, £ million
Acquisition/control premium paid on equity
20% 25% 30%
86,574 88,273 89,973
Source: SMF analysis
We note that these figures are a similar order of magnitude to the takeover value implied by the “rule of thumb” measure of RCV multiplied by 1.3: £83bn.
Other considerations
None of the figures presented above on potential takeover value take account of the transaction costs that would probably be involved in acquiring the water companies. These include fees that would potentially need to be paid to lawyers, accountants and financiers as part of the process. It is difficult to gauge the potential size of such transaction costs, so they are omitted from our calculations. Ultimately, such an omission leaves us with a relatively more conservative estimate of the takeover value.
Another consideration is the measure of net debt used in our enterprise value. This is based on the “carrying value” of the debt held by the companies, rather than the “fair/marked-to-market” value of the debt. If a nationalising government wished to buy out the debt held by the water companies and convert this into government bonds, it would have to pay the fair value for this debt. Given the dramatic decline in gilt yields in recent years and continuation of low interest rates, the fair value of the debt held by the water companies is likely to be higher than the carrying value. Again, this leaves us with a more conservative estimate of takeover value.
Arguably, a nationalising government does not need to buy out the debt of the water companies, and would only need to buy out the equity, which would suggest a much lower takeover value. However, we note that even if the government just bought out the equity at our approximate “market value” of £41-44bn (including a 20-30% acquisition premium), it would still be adding a corporate debt pile of £46bn to its liabilities. Ultimately, the decision of whether or not to buy out the debt leaves the government with a similar magnitude of liabilities added to its balance sheet.

12
Would the government need to pay the “takeover value” for the water companies?
There has been some discussion around the extent to which a nationalising government would pay the “market rate” for companies it wished to place under state control. The Shadow Chancellor, John McDonnell, has suggested that he would consider paying below the market rate for the relevant assets with respect to companies that have behaved “unfairly”10 – for example, companies that have been deemed, under some criteria, to have been “overcharging” customers of making “excessive” profits.
A report by David Hall at the University of Greenwich has noted that the UK Government is under no legal obligation to pay a market price for an industry it wishes to nationalise.11 Indeed, his report cites examples of the government paying below the market rate when nationalising, including Northern Rock, which was nationalised without shareholders being remunerated. However, the circumstances surrounding Northern Rock were very different to those that surround the water industry. Northern Rock was in a crisis whereas the English water industry is profitable.
In this context, the immediate costs of nationalisation could theoretically vary substantially, depending on the intentions of the government and the position taken by parliament. David Hall has argued that the government could potentially compensate the current owners of the water company according to the “book value” of the companies rather than the “market value”. Book value is calculated from the balance sheet, and it is the difference between a company's total assets and total liabilities. It is often lower than the market value of a company, given that market value reflects a mark-up associated with the earning power of the company’s net assets.
David Hall has also suggested that the government could deduct historic government subsidies from market value when compensating company owners, or make a deduction to compensation depending on how some water companies have handled their tax affairs (that is, including some kind of tax avoidance deduction).
All of these approaches entail compensating shareholders at a rate significantly below what many would consider a conventional takeover value for a water company. While this would reduce the costs for government associated with nationalisation, the economic implications of such a move are likely to be significant, particularly if they coincide with similar nationalisations in other industries. The potential for the government to acquire assets at substantially below their intrinsic value could curtail inward investment into the UK, for example – with associated implications for tax revenues.
If the government were to pay below market price for the water industry’s assets, there is an associated loss of wealth for shareholders. As we show later, there are significant UK-based shareholders with a stake in England’s water companies, including workers in the water businesses.
The government would lose out on capital gains tax revenue if it were to purchase shares at a rate below market value. In addition, the negative wealth effect for households and enterprises, arising from such a move, would lead to lower VAT and other tax revenues than would be the case if the government paid the full market rate.
As ever in economics, there is no “free lunch” – savings realised by the government by paying below the market rate would have (potentially long-lasting) implications for investment, the economy and tax revenues, which ought to be considered were such a move to be made. Ultimately, these factors

13
mean that the long-term net savings to a nationalising government from purchasing below the market rate could be substantially reduced or even more than offset.

14
CHAPTER 3: IMPLICATIONS FOR THE PUBLIC FINANCES OVER TIME
The previous chapter of the report examined the likely takeover value for a government wishing to nationalise the water industry in England. Our estimate, based on enterprise value, suggests a takeover cost of £87-90bn, depending on the acquisition premium paid. This is a similar order of magnitude to a takeover value based on RCV multiplied by 1.3 (£83bn) –a widely-used “rule of thumb” in the water industry.
Acquiring the assets and liabilities of the water industry would imply a significant addition to government debt levels. With the latest public finances data, covering November 2017, showing central government gross debt standing at £1,731bn, this implies an addition to government gross debt of about 5% based on our estimated takeover value.
The servicing costs associated with this debt will have implications for public borrowing levels.
At the same time, by nationalising the water industry the government would obtain a set of assets which currently generate a profit. Depending on how a publicly-managed water industry is run, there is scope for the nationalisation to be ultimately self-financing, with financial surpluses covering or even exceeding the debt servicing costs. However, this is not guaranteed, and there are a number of factors that could prevent such self-financing being realised.
Borrowing costs and profits – can water nationalisation pay for itself?
The extent to which water nationalisation could pay for itself depends on a wide range of factors. While some, including David Hall at the University of Greenwich, have argued that the revenues from water nationalisation would offset the associated costs (including debt servicing costs), we note there are a wide range of factors that could affect the ability of a state-owned water industry to do so – both in the short and long term.
Borrowing costs – gilt yields under a nationalising government
One argument that has been made by David Hall in favour of water nationalisation is that borrowing costs faced by the government are lower than they are for the private industries. Lower borrowing costs could translate into lower water bills for consumers.
David Hall’s calculations are sensitive to the prevailing borrowing costs that a pro-nationalisation government would face. His calculations, which examine the savings to households from re-financing corporate debt into government bonds, are based on current historic low gilt yields. Professor Hall works on the basis of an interest rate of just 1.25% on government debt.
However, it is likely that government borrowing costs would increase, potentially significantly, if a pro-nationalisation government were to come into power. This would occur, for example, if market participants became concerned about significantly higher levels of public sector debt under such a government. This could lead to participants demanding a higher risk premium for government debt, resulting in greater public sector borrowing costs.
Ultimately, the scale of such an increase in borrowing costs would depend very much on the broader range of policies introduced by a government intending to nationalise the water industry. As such, such a risk premium effect is difficult to quantify. Nevertheless, it suggests that working on the basis of current government borrowing costs is far from guaranteed.
15
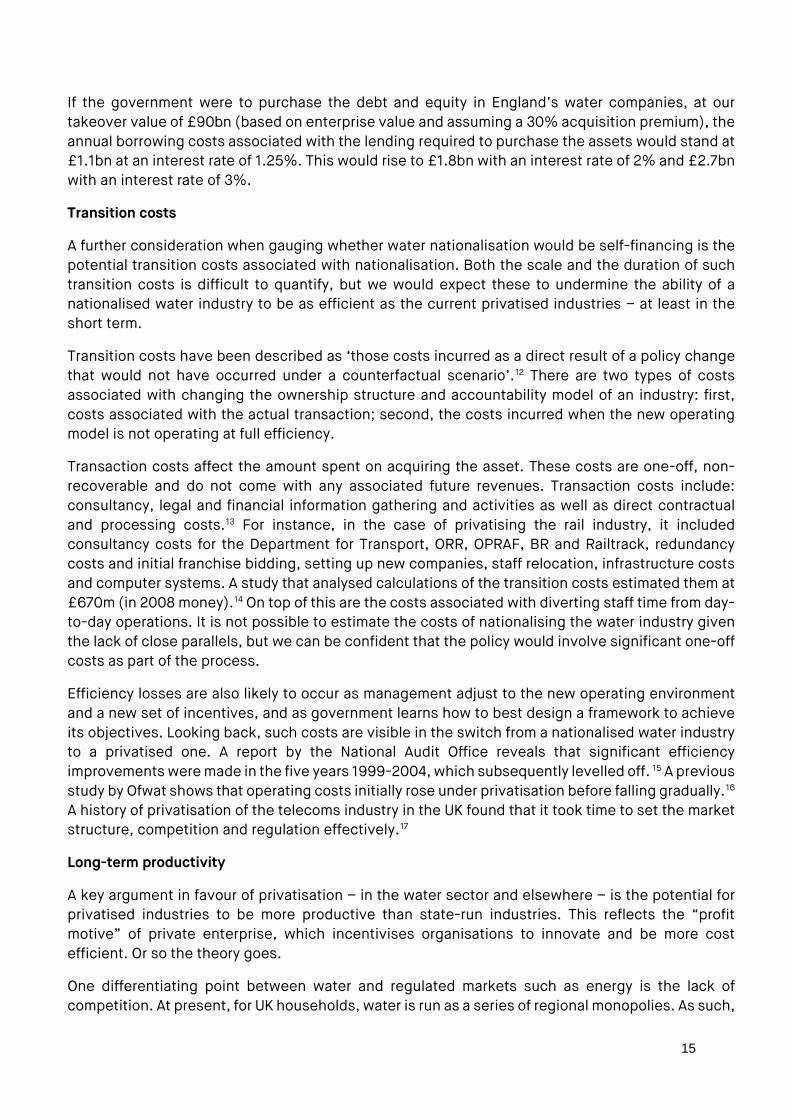
If the government were to purchase the debt and equity in England’s water companies, at our takeover value of £90bn (based on enterprise value and assuming a 30% acquisition premium), the annual borrowing costs associated with the lending required to purchase the assets would stand at £1.1bn at an interest rate of 1.25%. This would rise to £1.8bn with an interest rate of 2% and £2.7bn with an interest rate of 3%.
Transition costs
A further consideration when gauging whether water nationalisation would be self-financing is the potential transition costs associated with nationalisation. Both the scale and the duration of such transition costs is difficult to quantify, but we would expect these to undermine the ability of a nationalised water industry to be as efficient as the current privatised industries – at least in the short term.
Transition costs have been described as ‘those costs incurred as a direct result of a policy change that would not have occurred under a counterfactual scenario’.12 There are two types of costs associated with changing the ownership structure and accountability model of an industry: first, costs associated with the actual transaction; second, the costs incurred when the new operating model is not operating at full efficiency.
Transaction costs affect the amount spent on acquiring the asset. These costs are one-off, non-recoverable and do not come with any associated future revenues. Transaction costs include: consultancy, legal and financial information gathering and activities as well as direct contractual and processing costs.13 For instance, in the case of privatising the rail industry, it included consultancy costs for the Department for Transport, ORR, OPRAF, BR and Railtrack, redundancy costs and initial franchise bidding, setting up new companies, staff relocation, infrastructure costs and computer systems. A study that analysed calculations of the transition costs estimated them at £670m (in 2008 money).14 On top of this are the costs associated with diverting staff time from day-to-day operations. It is not possible to estimate the costs of nationalising the water industry given the lack of close parallels, but we can be confident that the policy would involve significant one-off costs as part of the process.
Efficiency losses are also likely to occur as management adjust to the new operating environment and a new set of incentives, and as government learns how to best design a framework to achieve its objectives. Looking back, such costs are visible in the switch from a nationalised water industry to a privatised one. A report by the National Audit Office reveals that significant efficiency improvements were made in the five years 1999-2004, which subsequently levelled off. 15 A previous study by Ofwat shows that operating costs initially rose under privatisation before falling gradually.16 A history of privatisation of the telecoms industry in the UK found that it took time to set the market structure, competition and regulation effectively.17
Long-term productivity
A key argument in favour of privatisation – in the water sector and elsewhere – is the potential for privatised industries to be more productive than state-run industries. This reflects the “profit motive” of private enterprise, which incentivises organisations to innovate and be more cost efficient. Or so the theory goes.
One differentiating point between water and regulated markets such as energy is the lack of competition. At present, for UK households, water is run as a series of regional monopolies. As such,

16
one of the common arguments for greater efficiency under privatisation – competitive pressures – is not there. Nevertheless, price caps set by the regulator, Ofwat, should at least in theory curtail “excessive” profit-making while at the same time encouraging water companies to be as cost efficient as possible. In addition, Ofwat has sought to replicate market competition through mechanisms such as upper quartile comparative assessments which encourage suppliers to achieve performance levels of the most efficient suppliers. Under the regime that will apply from 2019, companies will be challenged to achieve forecast upper quartile performance each year18.
A key unknown is the extent to which a state-owned water company could be as productive, and see as much productivity growth, as a series of privately-owned water companies. Evidence suggests that productivity in the water and sewerage industry has increased by 64% since 1994 and productivity growth has averaged 2.1% per year since privatisation when adjusting for output quality (such as improved drinking water quality).19 Of course, this tells us little about how performance compares with a hypothetical scenario in which the water industry was run by the state. We note the general trend of weak government productivity growth in recent decades; data from the ONS show that productivity in the public sector grew by less than 2% between 1997 and 201720. However, with respect to water, some international studies suggest little evidence of productivity gains under privatisation21.
Given the arguments on both sides, and the current evidence, we believe it is difficult to quantify or argue either way as to whether or not a nationalised water industry would be inherently more or less productive than a series of privatised industries. Ultimately, much depends on the regulatory environment, the attitude of the government, and the degree of competition (if any) in the water sector.
Government intentions
The extent to which water nationalisation can pay for itself will depend upon the intentions of the nationalising government, and indeed any subsequent governments. Ultimately, the government may wish to pursue an approach in which the state-run water industry is run on a loss-making basis, with this loss offset by an increase in general taxation. As we discuss in the next chapter of this report, a government concerned about reducing inequality could conceivably adopt such an approach.
Political risks – the politicisation of the price-setting process
We note that a potential challenge to the self-sufficiency of a nationalised water industry is the likelihood of water pricing becoming a much more politicised issue if it were set by a state-owned enterprise. Depending on the regulatory structures and safeguards put in place, there is a risk of water pricing becoming increasingly detached from the costs associated with the water network. One could envision, for example, water price increases being held back around the timing of general elections.
One of the merits of a regulated, privatised water industry is that (as with Bank of England independence) policy is removed from the political process and the desire for politicians to increase their popularity among the electorate. This separation is much harder to achieve in a nationalised industry. This is particularly pronounced in the trade-off between providing benefits to current bill-payers and taxpayers versus making investments to benefit future generations.

17
Future investment requirements
If the water industry in England were to be nationalised, the government would be responsible for meeting future investment needs. This includes the need to replace ageing water and sewerage infrastructure, to implement efficiency-saving technologies and to account for growth in the size of the UK population.
A National Audit Office report from 2015 showed that, since privatisation, the water industry had spent £126 billion22 on building and maintaining water and sewerage services23.
Future investment needs are likely to be substantial. These are driven by a wide range of factors including population growth, and expected consequences of climate change such as drier summers and wetter winters with implications for drainage and drought resilience.24 A report published by Severn Trent in 2010 estimated real terms costs of capital expenditure in the water industry in England & Wales of £96bn over the years 2010-2030.
The National Infrastructure Delivery Plan published by the government last year provides an overview of infrastructure delivery in the pipeline in the medium term. The pipeline identifies £17bn of capital expenditure in the water industry in England over the four fiscal years 2016/17 to 2019/20 – an average of about £4bn per year (expressed in inflation-adjusted 2016/17 prices).
Conversations with the water industry carried out as part of the research indicate that expectations are that capital expenditure in the long-term will continue at a broadly similar pace, given the need to replace ageing infrastructure and meet other requirements. This would point to real-term capital expenditure requirements of over £100bn between the 2016/17 and 2040/41 fiscal years, expressed in 2016/17 prices.
Figure 1 Cumulative capital expenditure on water in England from 2016/17, expressed in real 2016/17 prices, £bn
Source: National Infrastructure Delivery Plan data up to 2019/20. Projection beyond this based on real-terms capital expenditure in line with the average seen between 2016/17 and 2019/20.
0
20
40
60
80
100
120
2016
/17
2017
/18
2018
/19
2019
/20
2020
/21
2021
/22
2022
/23
2023
/24
2024
/25
2025
/26
2026
/27
2027
/28
2028
/29
2029
/30
2030
/31
2031
/32
2032
/33
2033
/34
2034
/35
2035
/36
2036
/37
2037
/38
2038
/39
2039
/40
2040
/41
18
Whether or not such costs have a bearing on government borrowing depends very much on the pricing structure of a nationalised water industry and the extent to which the government would seek to cover such investment costs from billpayers. Ultimately, the government may wish to fund water investment at least partly through higher rates of general taxation, or through government borrowing – in which case there would be implications for the exchequer.
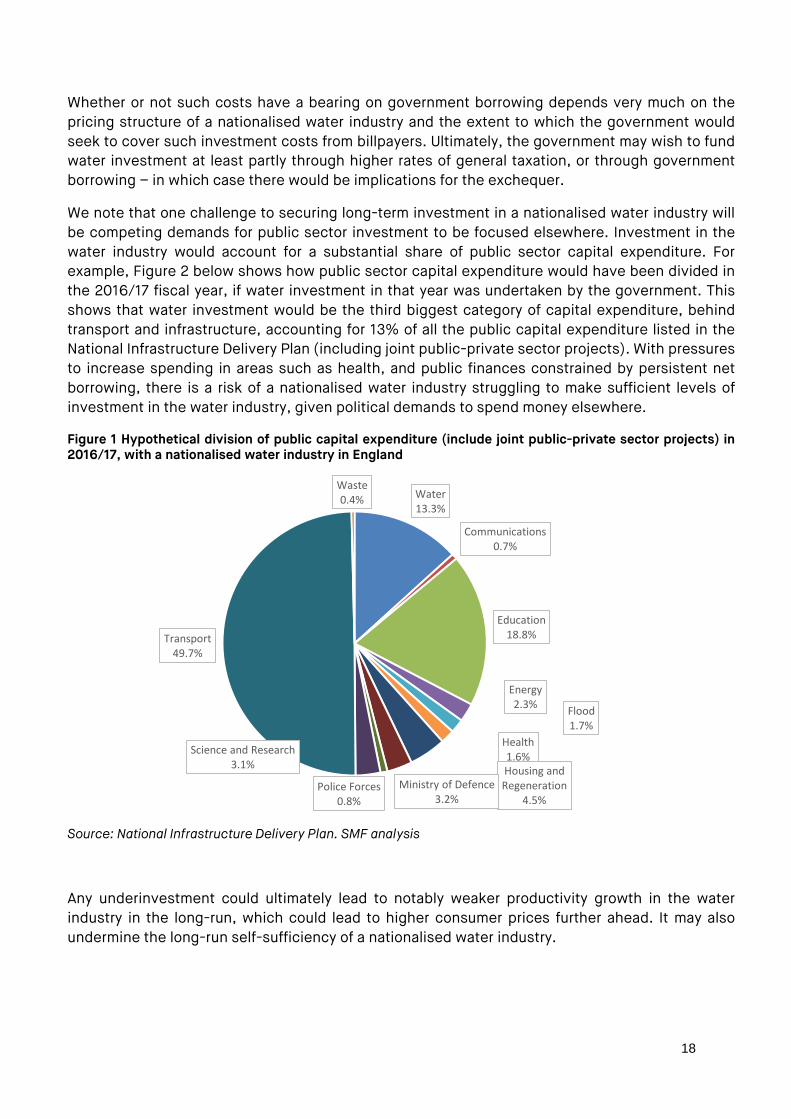
We note that one challenge to securing long-term investment in a nationalised water industry will be competing demands for public sector investment to be focused elsewhere. Investment in the water industry would account for a substantial share of public sector capital expenditure. For example, Figure 2 below shows how public sector capital expenditure would have been divided in the 2016/17 fiscal year, if water investment in that year was undertaken by the government. This shows that water investment would be the third biggest category of capital expenditure, behind transport and infrastructure, accounting for 13% of all the public capital expenditure listed in the National Infrastructure Delivery Plan (including joint public-private sector projects). With pressures to increase spending in areas such as health, and public finances constrained by persistent net borrowing, there is a risk of a nationalised water industry struggling to make sufficient levels of investment in the water industry, given political demands to spend money elsewhere.
Figure 1 Hypothetical division of public capital expenditure (include joint public-private sector projects) in 2016/17, with a nationalised water industry in England
Source: National Infrastructure Delivery Plan. SMF analysis
Any underinvestment could ultimately lead to notably weaker productivity growth in the water industry in the long-run, which could lead to higher consumer prices further ahead. It may also undermine the long-run self-sufficiency of a nationalised water industry.
Water13.3%
Communications0.7%
Education18.8%
Energy2.3% Flood
1.7%Health1.6%Housing and Regeneration
4.5%Ministry of Defence
3.2%Police Forces
0.8%
Science and Research3.1%
Transport49.7%
Waste0.4%
19
CHAPTER 4: IMPLICATIONS FOR BILLPAYERS AND UK HOUSEHOLDS
The previous two chapters of this report examined the potential financial implications of water nationalisation for the UK government – both in terms of the immediate takeover costs and the longer-term implications for public borrowing (for which there is a significant degree of uncertainty).
This chapter discusses some of the implications of water nationalisation for households and businesses. In particular, we discuss issues around current ownership of the water companies and the extent to which some individuals would lose out in the event of a nationalising government paying a level of compensation below the market value of the companies.
We also discuss, at a high level, the potential distributional consequences of water nationalisation for UK households.
Who owns the water companies and who would be directly affected by nationalisation?
Company owners will be directly affected by the nationalisation of the water industry and by the level of compensation that parliament determines. As can be seen below there are major UK ownership interests in the listed companies with more than six in ten of shareholders across all three listed regional water & sewerage companies being UK-based. Ownership of the privately-owned companies is more likely to be overseas although there are still important UK ownership interests in some cases.
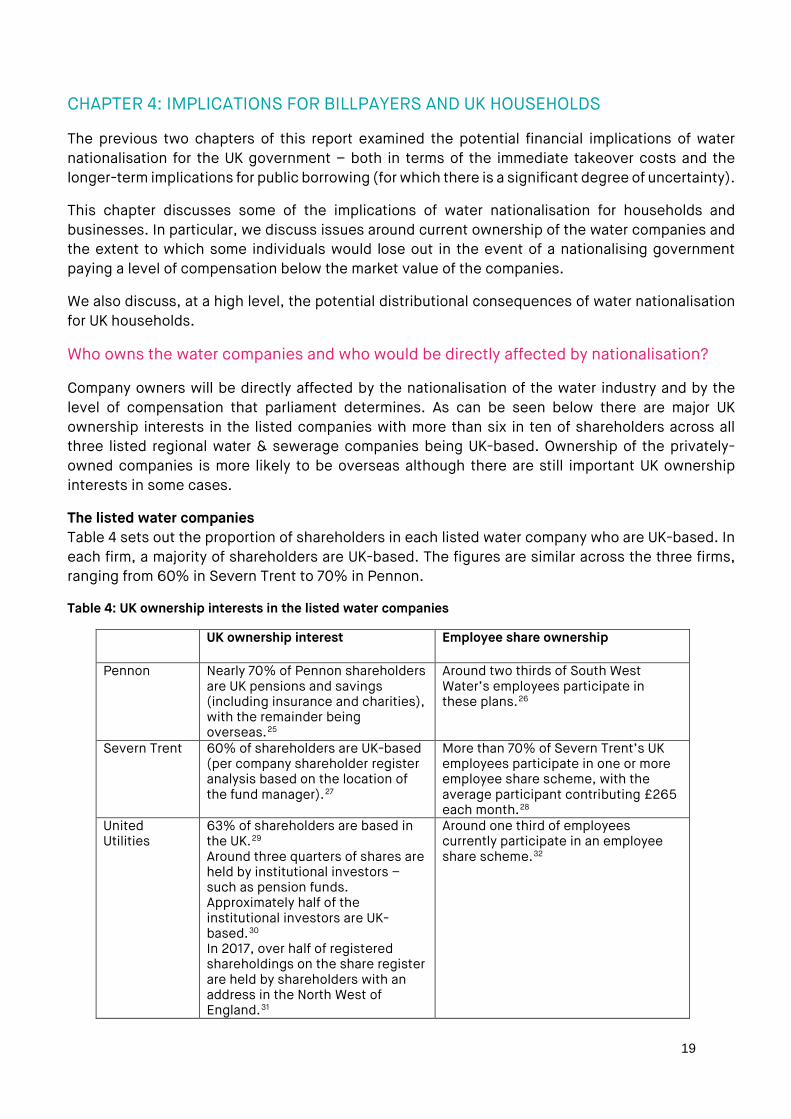
The listed water companies Table 4 sets out the proportion of shareholders in each listed water company who are UK-based. In each firm, a majority of shareholders are UK-based. The figures are similar across the three firms, ranging from 60% in Severn Trent to 70% in Pennon.
Table 4: UK ownership interests in the listed water companies
UK ownership interest Employee share ownership
Pennon Nearly 70% of Pennon shareholders are UK pensions and savings (including insurance and charities), with the remainder being overseas.25
Around two thirds of South West Water’s employees participate in these plans.26
Severn Trent 60% of shareholders are UK-based (per company shareholder register analysis based on the location of the fund manager).27
More than 70% of Severn Trent’s UK employees participate in one or more employee share scheme, with the average participant contributing £265 each month.28
United Utilities
63% of shareholders are based in the UK.29 Around three quarters of shares are held by institutional investors – such as pension funds. Approximately half of the institutional investors are UK-based.30 In 2017, over half of registered shareholdings on the share register are held by shareholders with an address in the North West of England.31
Around one third of employees currently participate in an employee share scheme.32

20
Table 4 , also shows that employee share schemes are common in the sector and that many workers own shares in the listed water companies. A third of employees in United Utilities participate in the share scheme, two thirds of South West Water’s workers own shares and 70% of Severn Trent’s UK employees do the same.
The privately-owned companies
The unlisted companies are owned by institutions rather than a mix of institutional investors and retail investors, as is the case for the listed companies. Most owners of the unlisted water companies are overseas investors. However, there are some significant exceptions to this. Dalmore Capital and GLIL Infrastructure LLP, a joint venture between Lancashire, Merseyside, West Yorkshire, London, and Greater Manchester local government pension schemes, owns 15% of Anglian Water.33 The BT pension scheme bought a 13% share in Kemble Water Holdings, Limited which owns Thames Water.34
Implications for billpayers
Water nationalisation would almost certainly have implications for billpayers in England. Indeed, a key rationale for potentially nationalising the water industry is to give the government a greater level of control in the prices faced by billpayers.
Some, such as David Hall at the University of Greenwich, have pointed to potential savings to households that could arise from the water industry being run on a not-for-profit basis. The argument is that consumers would benefit from profits being translated into lower water prices. Savings may also be realised from lower costs associated with servicing the debt of the water companies, though as we argued in the previous chapter of the report, we have some reservations about the extent to which this could be fully realised in practice.
Furthermore, factors such as transition costs associated with nationalisation, mean that current levels of profit in the water industry cannot simply be translated into savings for households – there are some deductions that would need to be made, at least initially.
It is conceivable though, that whatever the “profitability” and self-sufficiency of a state-run water sector, that the government may pursue an agenda of lower water prices. The government could, for example, run the water industry on a loss-making basis, supporting the industry via general taxation.
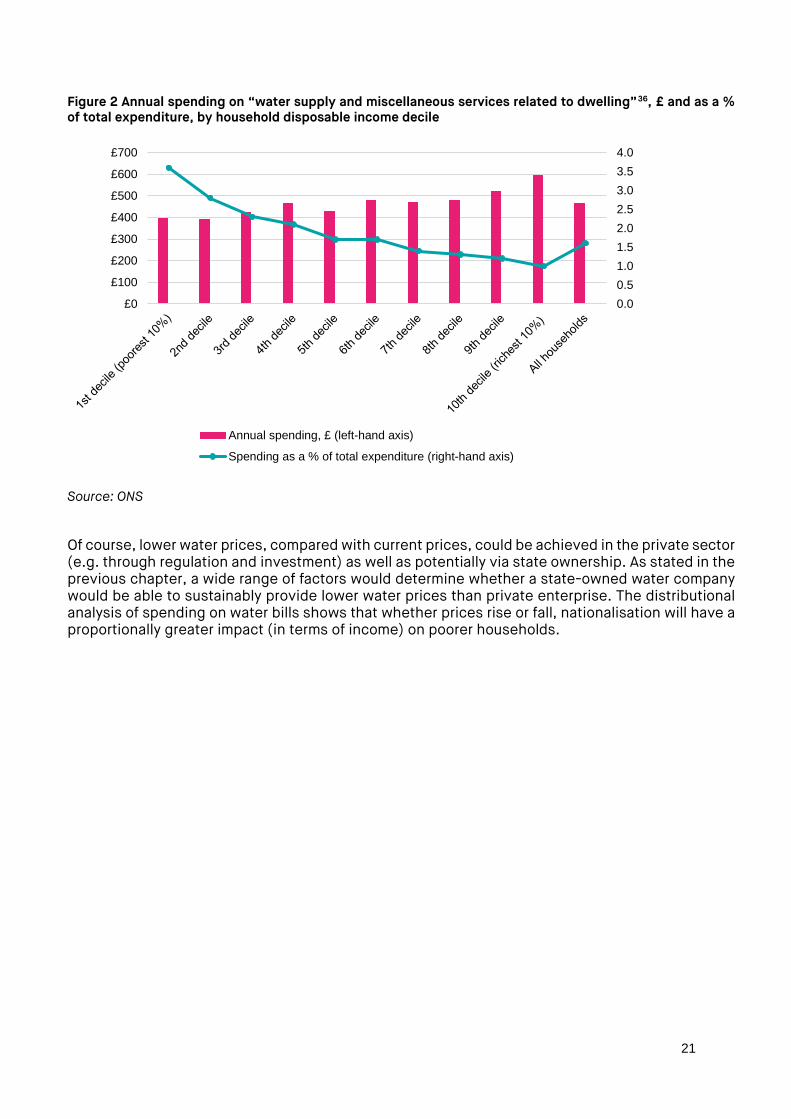
Analysis of data in the ONS Living Costs and Food Survey shows that water accounts for a higher proportion of total expenditure among lower income households. This suggests that policies which reduce water prices are generally progressive – benefitting poorer households the most when expressed as a proportional of their total expenditure or income. It should be noted that water companies already offer social tariffs to some low-income households. The Consumer Council for water has reported that, at the end of 2016-17, 260,540 customers in England and Wales benefited from having lower bills because of this.35 Therefore, the progressivity of any general policy on water bills would be affected by decisions also on the social tariff.
21
Figure 2 Annual spending on “water supply and miscellaneous services related to dwelling”36, £ and as a % of total expenditure, by household disposable income decile
Source: ONS
Of course, lower water prices, compared with current prices, could be achieved in the private sector (e.g. through regulation and investment) as well as potentially via state ownership. As stated in the previous chapter, a wide range of factors would determine whether a state-owned water company would be able to sustainably provide lower water prices than private enterprise. The distributional analysis of spending on water bills shows that whether prices rise or fall, nationalisation will have a proportionally greater impact (in terms of income) on poorer households.
0.00.51.01.52.02.53.03.54.0
£0
£100
£200
£300
£400
£500
£600
£700
Annual spending, £ (left-hand axis)
Spending as a % of total expenditure (right-hand axis)
22
CHAPTER 5: ALTERNATIVE OWNERSHIP MODELS
The Labour Party’s 2017 manifesto indicates that its preferred strategy would be to nationalise the water industry.37 The manifesto commits to ‘replace our dysfunctional water system with a network of regional publicly-owned water companies’.38 However, elsewhere the Shadow Chancellor has spoken more obliquely that ‘building an economy for the many also means bringing ownership and control of the utilities and key services into the hands of people who use and work in them.’39 The Labour Party manifesto was accompanied by a review of alternative business models, which discussed the potential for other forms of ownership.40
Below we describe briefly the direct implications of transferring ownership to alternative models.
Companies Limited by Guarantee or consumer mutuals
One alternative scenario is that a future government creates regional companies limited by guarantee to deliver water services. Turning all the water companies into companies limited by guarantee would require a forced sale to be determined by parliament, as with nationalisation. Owners would expect to be compensated appropriately and the funds for the purchase of the asset would have to be raised from somewhere. As at present, a regulator would be required to set prices and performance criteria.
Welsh Water (Dwr Cymru) was set up and run initially as a PLC like the other major utility companies. In 1996, Dwr Cymru acquired the electricity company SWALEC and became known as Hyder. A combination of factors including large debts arising from the acquisition of SWALEC, a windfall profits tax and the 1999 Ofwat review of pricing contributed to a dramatic fall in the market value of the company. The company started to sell parts of its business, including the water element. Initially this was bought by Western Power Distribution. In 2000, Welsh Water (and its debts) was sold by Western Power Distribution to Glas Cymru, a company limited by guarantee for £1.41 Glas Cymru is a ‘single purpose company with no shareholders and is run solely for the benefit of customers’.42 Glas Cymru raised £1.9bn in bond finance to finance the debts that accompanied Welsh Water. Glas Cymru reinvests any profits or retains them as an equity buffer.43
Depending on how the policy of changing company ownership structures were to be pursued, there would be major differences from nationalisation. Public sector debt would not necessarily increase under this model, assuming that the assets were purchased privately by the new entities (probably on the basis of bonds) and future investment was financed privately by them. However, if the Government were to intervene in the running of these organisations then the debt may be reclassified as government debt (as occurred with Network Rail and housing associations).
Assuming that the new entities purchased the assets privately, then the new companies would be highly indebted and 100% geared on inception, affecting their risk status and options for raising capital. For instance, such organisations would not be able to raise capital by selling equity. This level of gearing could be reduced over time by retaining profits and diverting income from bills to build up a capital buffer – Welsh Water reports reducing its gearing from 93% in 2001 to 56% in 2017.44 Ultimately, the costs of borrowing would be determined by the markets who would make lending decisions based on their judgement of the likelihood of the organisation being able to service its debts in the future.

23
The companies would lose their accountability to shareholders and would have to develop alternative mechanisms for promoting efficiency and responding to consumers’ needs. Given the fact that each regional water company supplies millions of consumers, the new organisations would have to develop processes for representing and reflecting consumer interests. In the case of Welsh Water, this includes appointing 65 members whose function is to hold the Board to account.45
Municipalisation
‘Gas and water socialism’ of the nineteenth and early twentieth century was one of the earliest forms of government intervention in utility markets in the UK.
If municipal ownership were to be pursued as a compulsory option, parliament would have to determine the level of compensation to be paid. Local authorities – or regional combinations of local authorities – could purchase the water companies and establish regional water companies. This would re-create a system not dissimilar from that of the 1970s. Local government borrowing counts towards Public Sector Net Debt46 – therefore the purchase and future investment costs would raise the UK’s stock of PSND. If local government rather than national government borrowed to purchase the water companies, the costs of servicing the debt to the councils would probably be higher given the fact that the Public Works Loan Board offers loans at the Government’s borrowing costs plus a premium (which was historically 0.20% but is now 0.6% to 1%).47 It is unlikely that a municipal bond could be raised at a rate lower than the UK government’s borrowing costs. In such a scenario, the prices and quality of the water services would be – at least partly – determined by local government rather than national government. However, it should be noted that in the 1970s national government retained ultimate accountability for the water industry, including approving the plans and programmes of the regional water companies.48

24
CHAPTER 6: CONCLUSIONS
Nationalising the water industry in England would imply a significant addition to government debt levels. If the water industry were to be nationalised at present, and the government were to pay a conventional acquisition value to do so, this would constitute a 5% increase in government debt.
While the government would face increased borrowing costs associated with servicing this debt, it will also have acquired an asset which at present generates a profit. A key uncertainty is the extent to which a nationalised water industry could remain self-sufficient/profit raising, and not require public borrowing or higher general taxation to bankroll it. Key risks to the self-sufficiency of a nationalised water industry include:
• Higher public sector borrowing costs in the event of a government intending to significantly increase public sector debt levels through a programme of nationalisation and increased spending.
• Water pricing becoming increasingly politicised, making it harder for water prices to rise in line with increasing costs.
• Transition costs associated with moving from a privatised to a nationalised water sector.
• The government potentially failing to commit to long-term investment needs in the water industry, undermining long-term efficiency in the sector.
It has been suggested that a nationalising government may pay below the market rate to acquire the assets of England’s water industry. While such a move may, at face value, reduce nationalisation costs for the government, there is potential for it to reduce tax revenues for the government. For example, such a move would imply lower capital gains tax receipts compared with purchasing assets at the market rate, and the risk of such a move being seen as “expropriation” could curtail investment in UK industry – with associated implications for economic activity and tax receipts.
Our analysis of company ownership of England’s water companies identifies significant UK-based interests, among employees and other UK savers. These individuals stand to lose out financially in the event of the UK government purchasing assets at below the market rate.
Ultimately, the long-term implications of water nationalisation are complex. Our main focus in this report has been to identify the initial acquisition costs of nationalisation. These are non-trivial.
25
ENDNOTES
1 South West Water now owns Bournemouth Water. 2 For a brief overview, see, for example, https://www.investopedia.com/terms/a/acquisitionpremium.asp 3 https://www.ofwat.gov.uk/publications/rd-0410-regulatory-capital-values-2010-15/ 4 We would expect a nationalising UK government to only purchase the elements of Dee Valley Water which relate to England. As such this might be a slight overestimate of the RCV of England’s water industry. We emphasise slight – Dee Valley Water’s RCV in March 2017 stood at about £89 million, just 0.1% of industry-wide RCV in England & Wales. 5 The value of South West Water includes Bournemouth Water, 6 See, for example, https://www.ft.com/content/4ff1842e-c882-11e2-acc6-00144feab7de 7 The value is taken on March 31st for the last five financial years. http://www.londonstockexchange.com/statistics/markets/aim/aim.htm 8 We exclude Pennon from this average given its relatively more sizeable non-regulated business, which potentially skews its PE ratio. 9 See, for example, http://www.informit.com/articles/article.aspx?p=2109325&seqNum=4 10 See, for example, http://www.independent.co.uk/news/uk/politics/labour-conference-2017-nationalising-john-mcdonnell-shareholders-compensation-not-recieve-royal-mail-a7965536.html . The Shadow Chancellor is reported to have said that ““The perceived behaviour affects the price. That will be determined by parliament.” 11 Hall (2017), “Bringing water into public ownership: costs and benefits” 12 Dawn Louise Robbins, ‘Evaluating the Long Term Impacts of Transport Policy: The Case of Passenger Rail Privatisation in Great Britain’ (PhD. Thesis, Southampton University, 2011) 13 Ibid. 14 Ibid. 15 NAO, The economic regulation of the water sector (2015) 16 Ofwat, The Development of the Water Industry in England and Wales (2006), Figure 7.5.1 17 Institute for Government, The Privatisation of British Telecom (2015) 18 Ofwat, Delivering Water 2020: Our final methodology for the 2019 price review, December 2017 (December 2017) 19 Frontier Economics, Productivity Improvement in the Water and Sewerage Industry in England since privatisation (2017) 20https://www.ons.gov.uk/employmentandlabourmarket/peopleinwork/labourproductivity/articles/quarterlypublicserviceproductivityexperimentalstatistics/apriltojune2017 21 For example, a review of the global literature on all aspects of efficiency in water supply concluded that: “there is no hard evidence which points to a causal relation between management ownership and efficiency”(González-Gómez et al 2008). Similarly, a 2005 World Bank report by Estache et al concluded “in general, there is no statistically significant difference between the efficiency performance of public and private operators in this sector” 22 In 2014/15 prices 23 https://www.nao.org.uk/wp-content/uploads/2014/07/The-economic-regulation-of-the-water-sector.pdf 24 Water UK, Water resources long term planning framework (2015-2065) (2016) 25 Information provided by Pennon 26 Information provided by Pennon 27 Information provided by Severn Trent. 28 https://www.stwater.co.uk/content/dam/stw/apr/STW-ARA-FINAL.pdf 29 2014 data. http://corporateresponsibility2014.unitedutilities.com/Aboutourshareholdersandinvestors.aspx 30 2014 data. http://corporateresponsibility2014.unitedutilities.com/Aboutourshareholdersandinvestors.aspx 31 http://unitedutilities.annualreport2017.com/media/83269/united-utilities-ar2017-web-ready.pdf 32 2014 data. http://corporateresponsibility2014.unitedutilities.com/documents/Full_Report_2014_Final_Version.pdf 33 https://www.localgov.co.uk/Council-pension-schemes-purchase-shares-in-Anglian-Water-/44418 34 https://corporate.thameswater.co.uk/About-us/Our-investors/Our-corporate-governance/Ownership-structure
26
35 Consumer Council for Water, Staying afloat: Addressing customer vulnerability in the water sector (2016-17) (2017). Note the Consumer Council’s figure may double-count some customers who receive help from both a water company and a water and sewerage company. 36 This category of spending includes fees associated with refuse and sewerage collection. However, we believe that the bulk of this ONS expenditure category is accounted for by water bills. 37 Labour Party, Manifesto 2017 38 Labour Party, Manifesto 2017 39 http://press.labour.org.uk/post/165721772504/shadow-chancellor-john-mcdonnell-speech-to-labour 40 http://labour.org.uk/wp-content/uploads/2017/10/Alternative-Models-of-Ownership.pdf 41 Des McKibbin, An examination of business models within the Water and Sewerage Industry in the UK and Republic of Ireland, Research and Information Service Research Paper (Northern Ireland Assembly, 2014) 42 http://www.dwrcymru.com/en/Company-Information.aspx 43 Des McKibbin, An examination of business models within the Water and Sewerage Industry in the UK and Republic of Ireland, Research and Information Service Research Paper (Northern Ireland Assembly, 2014) 44 Glas Cymru, Report & Accounts 2016—2017 (2017) 45 http://www.dwrcymru.com/en/Company-Information/Governance/Membership.aspx 46 https://www.ons.gov.uk/economy/governmentpublicsectorandtaxes/publicsectorfinance/bulletins/publicsectorfinances/july2017 47 Mark Sandford, Local government in England: capital finance (House of Commons Library, 2016) 48 Ofwat, The Development of the Water Industry in England and Wales (2006)