the cost of innovation in the pharmaceutical industry a … · 16.04.2014 2 executive summary •...
TRANSCRIPT

16.04.2014
1
The Cost of Innovation in thePharmaceutical Industry – A Review
Prof. Dr. Alexander Schuhmacher, Reutlingen University, March 2014
Conflict of interest: nothing to disclose

16.04.2014
2
Executive Summary
• Despite scientific, technical and process-related advances in
the past years and an escalating demand for medicine and a
growing global healthcare market, the pharmaceutical industry
is still facing huge challenges
• These are related to the nature of the pharmaceutical industry
as its main driver of growth is innovation
• In the past years, the R&D costs per new drug increased and
the R&D efficiency of pharmaceutical companies reduced
• Today, discovering and developing a new drug costs more than
1.8 billion USD
Key Facts on PharmaceuticalR&D
A detailed analysis of the situation

16.04.2014
3
FDA approved 1,346 NMEs since 1950
2521
29
53
39
30
35
2724
1721
31
18 1816
2119
15
24
33
25
2 2 13
6 73 2
57 6 5
24
2 36 6 6 6
2
0
10
20
30
40
50
60
New
dru
gs
app
rove
d
NMEs BLAs
NME (New Molecular Entity), BLA (Biologic License Application), Source: Hughes B. (2009) Nature Reviews Drug
Discovery 8: 93-96; Mullard A. (2012) Nature Reviews Drug Discovery 11:91-94; Mullard A (2014) Nature Reviews Drug
Discovery 13: 85-91; Munos B (2009) Nature Reviews Drug Discovery 8: 959-968; www. fda.org
25-30 new drugs p.a.
Only some pharmacos have been successful over a longer period of time
Source: Munos B (2009) Nature Reviews Drug Discovery 8: 959-968, pharmacos (pharmaceutical companies)
Approx. 4,300
pharmaceutical
companies
Since 1950,
261 pharmacos have
registered at least
1 NME
593 NMEs from
137 pharmacos that
disappeared by M&A
21 companies have
produced 50% of all
NMEs since 1950
360 NMEs by 9 big
pharmacos that
exist since 1950
Most productive
pharmacos since
1950: Merck & Co.
(56), Eli Lilly (51),
Roche (51)

16.04.2014
4
76% of pharmacos with active R&D come from Europe and US and top pharmacos invest more than USD 5 billion p.a. in R&D
AstraZeneca
Eli Lilly GSK Merck&Co.
Novartis Pfizer Roche Sanofi
Number of total employees:
57.200 38.080 97.389 86.000 123.686 103.700 80.129 113.719
Group R&D Expenditures (2011) [USD million]:
5.523 5.021 5.007 7.742 9.239 9.112 8.688 8.902
R&D rate (%): 16,4 20,7 14,2 16,1 20,8 15,8 19,0 20,1
Number of R&D employees:
11.300 7.400 12.687 11.000 23.000 14.000 18.000 18.000
Number of main R&D sites:
14 9 14 n.a. 11 10 18 25
Source: Evaluate Pharma®, Annual Company Reports 2011 and 2012
Pharmacos are among the top investors in R&D WW
Toyota Motors
1st
Roche 2nd
Microsoft 3rd
Volkswagen 4th
Pfizer 5thNovartis
6thNokia
7th
Johnson& Johnson
8th
SanofiAventis
9th
Samsung 10th
Source: European Comission, Joint Research Center, Directorate General Research (2010) The 2010 EU Industrial
R&D Investment Scoreboard

16.04.2014
5
The Pharma Innovation Process and the R&D Value Levers
From Cost to Efficiency
Drug Discovery Preclinical Clinical Development FDA Review Launch
1 FDA
approved
drug
3-6 years 6-8 years 0,5-2 years
Number of volunteers
5.000-10.000
compounds
20-100 100-500 1.000-5.000
Phase I Phase II Phase III
IND
subm
itte
d
ND
A s
ubm
itte
d
250 5-10
The pharmaceutical R&D process is highly regulated, lengthy, and risky
IND (Investigational New Drug), NDA (New Drug Application), FDA (Food and Drug Administration)
Figure adapted from PhRMA (2011) Pharmaceutical Industry 2011 Profile

16.04.2014
6
Pharmaceutical R&D has a low probability of success
1DiMasi JA et al. (2010) Clinical Pharmacology & Therapeutics 87 (3): 272-277, 2Bergren R et al. (2012) Nature
Reviews Drug Discovery 11: 435-436, 3Arrowsmith J (2011) Nature Reviews Drug Discovery 10: 1, 4Arrowsmith
J and Miller P (2013) Nature Reviews Drug Discovery 12: 569, 5Munos B (2009) Nature Reviews Drug
Discovery 8: 959-968
• Cumulated phase transition rate from Phase I to submission1: 16%
• Only 8% of drug candidates successfully make it to the market2
Probability of success (PoS) for SMOLs: 7%
PoS biologics: 11%
• Most failures in Phase II and III resulted from lack of efficacy3,4
• PoS that a company is generating 2 or 3 NMEs p.a. is 0,06% and 0,003%, respectively5
Clinical Development
Phase I Phase II Phase III
64% 39%
Possible reasons for high attrition rates in R&D despite scientific and technical advances in the last years
• Shift towards developing drugs for chronic diseases correlate with
reduced PoS1
Average PoS for chronic diseases: 6.88%
Average PoS for acute diseases 8.77%
• Target-based drug discovery contributes to the high attrition rates
in pharmaceutical R&D2
1Pammolli F et al. (2011) Nature Reviews Drug Discovery 10: 428-438, 2Swinney DC and Anthony J (2011) Drug
Discovery Today 10:507-519

16.04.2014
7
Drug R&D last for decades
• Average time of clinical development phases ranges from 6-8
years1, 2
• The total time for drug R&D increased in the past years to 14 years
(2013)2,3
Not including time for basic research, target identification and
validation or Phase IV trials
1Pammolli F et al. (2011) Nature Reviews Drug Discovery 10: 428-438, 2Reichert JM (2003) Nature Reviews Drug
Discovery 2: 695-702, 3Remnant J et al. (2013) Measuring the return from pharmaceutical innovation 2013, accessible via
http://thomsonreuters.com/business-unit/science/subsector/pdf/uk-manufacturing-measuring-the-return-from-
pharmaceutical-innovation-2013.pdf
New drug approvals today are associated with R&D
expenditures that were invested many years ago
The costs of pharmaceutical R&D increased significantly (1950s – 1987)
Period R&D Costs Literature Commentary
1950s-
1960s
USD 0.5
million
Schnee JE (1972) Development costs:
Determinants and overruns, Journal of
Business: 347-374
Partial cost estimation: Discovery costs
and costs of unsuccessful R&D projects
not considered, no capitalization
1976 USD 54
millions
Hansen RW (1980) Pharmaceutical
development costs by therapeutic
categories, University of Rochester
Graduate School of Management Working
Paper No. GPB-80-6
Full cost estimation
1987 USD 231
millions
DiMasi JA (1991) Journal of Health
Economics 10: 107-142
Full cost estimation: Out of the pocket
costs USD 114 million, 9% discount rate
2003 USD 802
millions
DiMasi JA (1991) Journal of Health
Economics 23: 151-185
Full cost estimation: Out of the pocket
costs USD 403 million and discount rate
of 11%
Data derived from: DiMasi JA (1991) Journal of Health Economics 10: 107-142; DiMasi JA et al. (2003) Journal of Health
Economics 22: 151-185
Since mid 1980s, out-of-the-packet costs and capitalized costs per NME
increased by 7,6% and 7,4% p.a. (above general price inflation), respectively

16.04.2014
8
Substantially higher costs of clinical development have resulted in higher R&D costs
8454
138
214
104
318335
467
802
0
100
200
300
400
500
600
700
800
900
Preclinical Clinical Total
US
D m
illio
n
1979
1991
2003
Source: DiMasi et al. (2003) Journal of Health Economics 23: 151-185
+ 350%
Development costs of biologics are higher
• Capitalized costs per biologic: USD 1,318 million1
• The capitalized costs of drug development per new asset increased
from USD 1,019 million (2010) to USD 1,219 million (2013)2
• Calculations do not include Phase IV (post-approval) costs, costs for
regulatory approval in non-US markets or new indications
1DiMasi JA, Grabowski HG (2007) Managerial and Decision Economics 28: 469-479, 2Remnant J et al. (2013) Measuring
the return from pharmaceutical innovation 2013, accessible via http://thomsonreuters.com/business-
unit/science/subsector/pdf/uk-manufacturing-measuring-the-return-from-pharmaceutical-innovation-2013.pdf

16.04.2014
9
Today, capitalized costs per launch are USD 1.8 billionand clinical development accounts for 63% of total costs
Target-
to-hit
Hit-to-
lead
Lead
optimi-
zation
Pre-
clinical
Phase
I
Phase
II
Phase
III
Sub-
mission
to
launch
Launch
p(TS) 80% 75% 85% 69% 54% 34% 70% 91%
WIP needed
for 1 launch
24,3 19,4 14,6 12,4 8,6 4,6 1,6 1,1 1
Cycle times
(years)
1,0 1,5 2,0 1,0 1,5 2,5 2,5 1,5
Cost per
launch
(million USD)
24 49 146 62 128 185 235 44 873
Capitalized
costs per
launch
(million USD)
94 166 414 150 273 319 314 48 1.778
Source: Paul SM et al. (2010) Nature Reviews Drug Discovery 9: 203-214
Total pharma R&D expenditures increased
0
10
20
30
40
50
60
1995 1996 1997 1998 1999 2000 2001 2002 2003 2004 2005 2006 2007 2008 2009 2010
US
D b
illio
n
R&D Expenditures (USD billion)
Source: PhRMA (2011) Pharmaceutical Industry 2011 Profile; PhRMA (Pharmaceutical Research and Manufacturers
of America); substantial proportions of R&D expenditures are missing: (1) expenditure of in-licensed drugs and
(2) not every pharmaceutical company is PhRMA member

16.04.2014
10
• Annual increase in capitalized R&D costs since 1950: 12.3%1
• Inflation since 1950: 3.7% p.a.
• Remaining 8.6% p.a. may result from
Advanced complexity of drug targets
Greater complexity of clinical trials
Higher demands of regulatory authorities
More R&D personnel2 Clinical development functions account
for more than 50% of all R&D expenditures
1Munos B (2009) Nature Reviews Drug Discovery 8: 959-968, 2Cohen FJ (2005) Nature Reviews Drug Discovery 4: 78
R&D costs increased by 8.6% p.a. since 1950
The dimensions of R&D efficiency are cost per launch
Inputs Output Outcome
R&D efficiency:
Cost per launch
R&D effectiveness:
Value per launch
Productivity = Value per cost
Source: Paul SM et al. (2010) Nature Review Drug Discovery 9: 203-214

16.04.2014
11
What are the costs per launch?
26
35
38
2829
26
31
34
26
35
2,7 2,2 2,33,4 3,7 4,6 4,2 3,7
2,63,8
0
5
10
15
20
25
30
35
40
2002 2003 2004 2005 2006 2007 2008 2009 2010 2011
NM
Es,
US
D b
illio
n
NMEs and BLAs Cost per NME or BLA (USD billion)
Source: PWC (2012) From vision to decision Pharma 2020 (www.pwc.com/pharma2020)
What are the costs per launch?
Number of approved
drugs
Median (USD
million)
Mean (USD million)
8-13 5,459 5,998
4-6 5,151 5,052
2-3 1,803 2,303
1 351 953
Source: http://www.forbes.com/sites/matthewherper/2013/08/11/how-the-staggering-cost-of-inventing-
new-drugs-is-shaping-the-future-of-medicine/
10 years R&D spending
(USD million)
Median (USD
million)
Mean (USD million)
>20,000 6,348 6,623
>5,000 2,883 2,961
>2,000 1,917 2,480
>1,000 1,459 741

16.04.2014
12
Rank Company NMEs 10 years R&D
spending (USD
million)
R&D costs per
drug (USD million)
1 Abbott/Abbvie 1 13,183 13,183
2 Sanofi 6 60,768 10,128
3 AstraZeneca 4 38,245 9,561
4 Roche 8 70,928 8,866
5 Pfizer 10 77,786 7,779
6 Wyeth 3 22,702 7,567
7 Eli Lilly 4 26,710 6,678
8 Bayer 5 33,118 6,624
9 Schering-Plough 3 18,845 6,282
9 Novartis 10 60,727 6,073
10 Takeda 4 24,132 6,033
What are the costs per launch?
Source: http://www.forbes.com/sites/matthewherper/2013/08/11/the-cost-of-inventing-a-new-drug-98-
companies-ranked/
Number of NMEs per billion USD of R&D spendinghas nearly halved every 9 years since 1950
Source: Scannell JW et al. (2012) Nature Reviews Drug Discovery 11: 191-200
Nature Reviews | Drug Discovery
b Rate of decline over 10-year periods
Log (drugs p
er b
illion U
S$)*
–1.0
–0.5
0
0.5
1.0
1.5
2.0
1950 1960 1970 1980 1990 2000 2010
c Adjusting for 5-year delay in spending impact
Num
ber o
f dru
gs p
er
billion U
S$ R
&D
spend
ing*
0
1
10
100
1950 1960 1970 1980 1990 2000 2010
a
Num
ber
of d
rugs p
er billion U
S$ R
&D
spend
ing*
0.1
1.0
10
100
1950 1960 1970 1980 1990 2000 2010
Drugs per billion US$ R&D spending 5 years previously
Drugs per billion US$R&D spending
FDA tightensregulationpost-thalidomide
First wave ofbiotechnology-derived therapies
FDA clears backlogfollowing PDUFAregulations plus smallbolus of HIV drugs
The magnitude and duration of Eroom’s
Law also suggests that a lot of the things that
have been proposed to address the R&D pro-
ductivity problem are likely, at best, to have a
weak effect. Suppose that we found that it cost
80 times more in real terms to extract a tonne
of coal from the ground today than it did
60 years ago, despite improvements in mining
machinery and in the ability of geologists
to find coal deposits. We might expect coal
industry experts and executives to provide
explanations along the following lines: “The
opencast deposits have been exhausted and
the industry is left with thin seams that are
a long way below the ground in areas that
are prone to flooding and collapse.” Given
this analysis, people could probably agree
that continued investment would be justified
by the realistic prospect of either massive
improvements in mining technology or large
rises in fuel prices. If neither was likely, it
would make financial sense to do less digging.
However, readers of much of what has
been written about R&D productivity in
the drug industry might be left with the
impression that Eroom’s Law can simply be
reversed by strategies such as greater man-
agement attention to factors such as project
costs and speed of implementation26, by
reorganizing R&D structures into smaller
focused units in some cases27 or larger units
with superior economies of scale in others28,
by outsourcing to lower-cost countries26,
by adjusting management metrics and
introducing R&D ‘performance score-
cards’29, or by somehow making scientists
more ‘entrepreneurial’30,31. In our view, these
changes might help at the margins but it
feels as though most are not addressing
the core of the productivity problem.
There have been serious attempts to
describe the countervailing forces or to
understand which improvements have been
real and which have been illusory. However,
such publications have been relatively
rare. They include: the FDA’s ‘Critical Path
Initiative’23; a series of prescient papers by
Horrobin32–34, arguing that bottom-up
science has been a disappointing distraction;
an article by Ruffolo35 focused mainly on
regulatory and organizational barriers;
a history of the rise and fall of medical inno-
vation in the twentieth century by Le Fanu36;
an analysis of the organizational challenges
in biotechnology innovation by Pisano37;
critiques by Young38 and by Hopkins et al.39,
of the view that high-affinity binding of a
single target by a lead compound is the best
place from which to start the R&D process;
an analysis by Pammolli et al.19, looking at
changes in the mix of projects in ‘easy’ versus
‘difficult’ therapeutic areas; some broad-
ranging work by Munos24; as well as a
handful of other publications.
There is also a problem of scope. If we
compare the analyses from the FDA23,
Garnier27, Horrobin32–34, Ruffolo35, Le Fanu36,
Pisano37, Young38 and Pammolli et al.19, there
is limited overlap. In many cases, the differ-
ent sources blame none of the same counter-
vailing forces. This suggests that a more
integrated explanation is required.
Seeking such an explanation is important
because Eroom’s Law — if it holds — has
very unpleasant consequences. Indeed,
financial markets already appear to believe
in Eroom’s Law, or something similar to it,
and the impact is being seen in cost-cutting
measures implemented by major drug com-
panies. Drug stock prices indicate that inves-
tors expect the financial returns on current
and future R&D investments to be below
the cost of capital at an industry level40, and
Eroom’s Law in pharmaceutical R&D. a
b
c
REFS 24,86,87
(REF. 86) REF. 87
REFS 24,87
a
PERSPECTIVES
192 | M ARCH 2012 | VOLUM E 11 www.nature.com/reviews/drugdisc
© 2012 Macmillan Publishers Limited. All rights reserved

16.04.2014
13
Possible reasons for the reduced R&D efficiency
• Insufficient number of projects in preclinical and early clinical phases1
• Increasing number of approved drugs raise the hurdle for approval
and reimbursement of new drugs2
• A lower risk tolerance of drug regulators increases both the
challenges for launching new drugs and the development-associated
costs2
• Target-based screening in drug discovery replaced an older and
perhaps more productive method of drug research (phenotypic
screening)2
• Increasing number of mergers might have influenced pharmaceutical
R&D negatively3
Source: 1Paul SM (2010) Nature Reviews Drug Discovery 9: 207, 2Scannell JW et al. (2012) Nature Reviews
Drug Discovery 11: 191-200, 3LaMattina JL (2011) Nature Reviews Drug Discovery 10: 559-560
How did the pharmaceutical industry react?
P =WIP x PTRS x V
CT x C
Optimize
Work in
progress
Increase
Probability
of
SuccessIncrease
Value of
Pipeline
Reduce
Costs per
clinical
candidate
Decrease
Cycle
Times
Source: Paul SM et al. (2010) Nature Review Drug Discovery 9: 203-214

16.04.2014
14
The global R&D pipeline is growing ...
0
2000
4000
6000
8000
10000
12000
2001 2002 2003 2004 2005 2006 2007 2008 2009 2010 2011 2012 2013 2014
Nu
mb
ero
fp
ipel
ine
dru
gs
Source: Citeline (2013) Pharma R&D Annual Review (http://www.citeline.com/wp-content/uploads/Citeline_
2013_RD_Annual_Review1.pdf)
… as pharmacos have increased the number of R&D projects in their pipelines
Source: Citeline (2013) Pharma R&D Annual Review (http://www.citeline.com/wp-content/uploads/Citeline_
2013_RD_Annual_Review1.pdf)
Position in
2014
Company Number of R&D pipeline drugs
(2014)
1 GlaxoSmithKline 261
2 Roche 248
3 Novartis 223
4 Pfizer 205
5 AstraZeneca 197
6 Merck & Co. 186
7 Sanofi 180
8 Johnson & Johnson 164
9 BMS 133
10 Takeda 132

16.04.2014
15
Pharmacos have reduced their R&D costs …
Source: Germann PG et al. (2013) Human Genomics 7: 5
• Pharmacos have reduced their personnel in R&D1
• Outsourcing to provide lean and flexible R&D organizations
• Some pharmacos reduced their R&D rates under the historical
benchmark of 20%
AstraZeneca (2011): 15,6%
Sanofi (2011): 15,1%
Pfizer (2011): 14,8%
GlaxoSmithKline (2011): 14,5%
…and focused on licensing and acquiring drug candidates from external sources
Source: DiMasi JA et al. (2010) Clinical Pharmacology
& Therapeutics 87 (3): 272-277
65%
40%
64%
16%
82%
65% 64%
27%
Phase transition rates
Self-originated In-licensed
22%
28%
13%
7%
30%
0%
10%
20%
30%
40%
50%
60%
70%
External Internal
Pipeline sources
Acquisitions Co-development
Licensing Line extensions
NME
Source: Remnant J et al. (2013) Measuring the return
from pharmaceutical innovation 2013, accessible via
http://thomsonreuters.com/business-
unit/science/subsector/pdf/uk-manufacturing-measuring-
the-return-from-pharmaceutical-innovation-2013.pdf

16.04.2014
16
Did these measures effect an increased R&D efficiency?
• “…the drug industry produces no more NMEs today
than 60 years ago.“1
• Average of 25-30 NMEs p.a. “… may reflect the
innovative capacity of the established R&D model.“1
1Munos B (2009) Nature Reviews Drug Discovery 8: 958-968
How many NMEs are required for large pharma?
1Munos B (2009) Nature Reviews Drug Discovery 8: 958-968, 2Kola I and Landis J (2004)
Nature Reviews Drug Discovery 3: 711
“ … large pharmaceutical companies ... need to produce an
average of 2-3 NMEs per year to meet their growth objectives,
the fact that none of them has ever approached this level of
output is concerning.“1
“Pfizer with pharmaceutical revenues in 2003 of approximately
USD 45 billion, will need to generate approximately nine high-
quality NCEs per annum.“2

16.04.2014
17
As the R&D efficiency is reduced, could the pharmaceutical industry increase the value resulting from drug R&D?
• Projected revenues of NMEs launched between 2012 and 2016
(USD 58 billion1) will not compensate the revenue losses by
patent expirations between 2010 and 2014 (USD 89.5 billion)
• Average peak sales per NME is expected to decline from 900
million USD (2012) to 600 million USD (2015), showing the
increasing difficulty of offering benefits over existing treatments
in light of the increasing price pressure1
1Bergren R et al. (2012) Nature Reviews Drug Discovery 11: 435-436
Are there any alternatives in view of thesechallenges?
337
205
127
205183
425
194
149
499
273
0
100
200
300
400
500
600
US EU5 Japan Pharmerging ROW
US
D b
illio
n
There is a rapidly increasing demand for medicines in emerging countries
2011
2020E
Source: PWC (2012) From vision to decision Pharma 2020 (www.pwc.com/pharma2020)

16.04.2014
18
Consequently, four big pharmacos already earn a third of their revenues outside the main markets
0 10 20 30 40 50 60
Eli Lilly
Johnson & Johnson
Abbott/Abbvie
Roche
Merck & Co.
AtraZeneca
GlaxoSmithKline
Sanofi
Novartis
Pfizer
Prescription sales (2011) (USD billion)
ROW
US/EU5/JP
Source: PWC (2012) From vision to decision Pharma 2020 (www.pwc.com/pharma2020)
Patients in the growth markets can‘t afford costly new drugs, such as biologics
Private share of
healthcare
expenditures (%)
Per capita health
spending, 2010 (USD)
Population with net
assets of USD 10.000
or less (%)
Brazil 53,0 990 62,1
China 46,4 221 66,4
India 70,8 54 92,8
Russia 37,9 525 75,4
Source: PWC (2012) From vision to decision Pharma 2020 (www.pwc.com/pharma2020)
• Growing countries currently lack the financial power to reward
innovation
• Increase in pharma sales is expected to come from generics

16.04.2014
19
What else could be done to increase efficiency of pharmaceutical R&D and the value of pharmaceutical innovation?
Research & Development
• Focus on therapeutic areas
and compounds with the
greatest probability of success
• R&D focused on patients‘
needs
• Personalized medicine
• Opening R&D towards external
innovation (e.g. crowdsourcing,
licensing)
• Further reducing R&D costs
(e.g. outsourcing, virtual R&D)
Marketing & Sales
• Specialty products
• Oncology as a key revenue
generator
• Higher value of biologics
Thank you for your attention
Prof. Dr. Alexander Schuhmacher
School of Applied ChemistryReutlingen UniversityAlteburgstr. 150DE-72760 ReutlingenEmail: [email protected]

16.04.2014
20
Back-up Slides
Defining Innovation
• “Innovation encompasses both the development and application of a new product, process or service. It assumes novelty in the device, the application, or both. Thus, innovation can include the use of an existing type of product in a new application or the development of a new device in an existing application.“
• “Incremental [sequential or follow-on] innovations ... are improvements ... on existing innovations.“ Examples: Reformulations or me-too drugs
• “Radical [major, stand-alone discontinuous] innovations … [are] innovations that represent something completely new and different.” Example: First-in-class drugs
• “NME is a new drug product that contain active moieties that have not been approved by FDA previously, either as a single ingredient drug or as part of a combination product“ [http://www.fda.gov/drugs/developmentapprovalprocess/druginnovation/default.htm]
Source: Cohen FJ (2005) Nature Reviews Drug Discovery 4: 78-84

16.04.2014
21
Rewardable Innovation
• An innovation must be novel and useful
• Usefulness can come from:
• Benefit in a condition with no existing effective treatment
• Improvement in the treatment of a condition that does not have consistently
satisfactory treatment
• Safer treatment
• More cost-effective treatment
• More convenient treatment
• Rewardable innovation is defined as “a medical product that provides …
something novel, with the potential or proven ability to yield … a treatment
not previously available or clinically significant improvement in treatment …
at an acceptable cost.”
Source: Aronson JK et al. (2012) Nature Reviews Drug Discovery 11: 253-254
Rewardable Innovation
• A highly innovative product may result from a new target or a mechanism-
of-action, from improved identification of patients who are likely to benefit
or from a novel application of an existing drug
• A moderately innovative product may result from a new class of
compound, fewer adverse reactions or drug-drug interactions, or a novel
method of synthesis
• A slightly innovative product may result from improved pharmacokinetics or
improved formulations
• A non-health-related innovation may result from a improved production
method
Source: Aronson JK et al. (2012) Nature Reviews Drug Discovery 11: 253-254

16.04.2014
22
Impact of Incremental Innovations
• Simply counting NMEs may underestimate the innovation potential of
pharmaceutical R&D
• Not all NMEs provide blockbuster potential
• Incremental innovations are an important source of revenues and profits as they
provide fewer technical risks at reduced costs
• Between 1990-2003 FDA approved 1,174 NDAs (New Drug Applications), of which 34%
were NMEs (New Molecular Entities) and 66% were non-NMEs (new formulations,
dosages, indications)1
• Incremental innovation generate significant economic and health benefits2
• Improved patient compliance
• Improved pharmacokinetics
• Reduced adverse effects
• Ability to effectively treat a new patient population
1Cohen FJ (2005) Nature Reviews Drug Discovery 4: 78-84; 2Berndt ER et al. (2006) Pharmacoeconomics 24(2): 69-86
Impact of Incremental Innovations
• First-in-class or best-in-class drugs are important for the success of
pharmacos
• Many pharmacos are pursuing the same disease areas, working with
the same targets, following the same rationals and providing similar
innovations, which is not suitable in todays payers‘ climate
• The development of blockbuster drugs is becoming increasingly
complex, as the development of a superior product in an area where a
previous highly efficacious blockbuster went off patent is very difficult
Source: Berndt ER et al. (2006) Pharmacoeconomics 24(2): 69-86, DiMasi JA (2003) Journal of Health
Economics 22: 151-185
16.04.2014
23
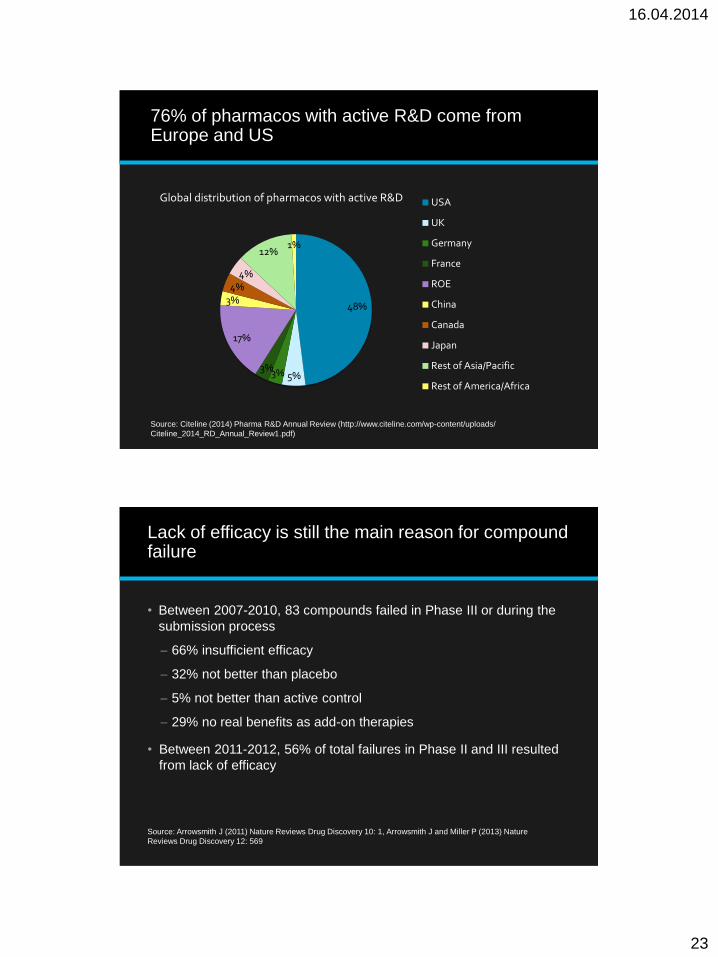
76% of pharmacos with active R&D come fromEurope and US
48%
5%3%3%
17%
3%4%
4%
12%1%
Global distribution of pharmacos with active R&D USA
UK
Germany
France
ROE
China
Canada
Japan
Rest of Asia/Pacific
Rest of America/Africa
Source: Citeline (2014) Pharma R&D Annual Review (http://www.citeline.com/wp-content/uploads/
Citeline_2014_RD_Annual_Review1.pdf)
Lack of efficacy is still the main reason for compound failure
• Between 2007-2010, 83 compounds failed in Phase III or during the
submission process
66% insufficient efficacy
32% not better than placebo
5% not better than active control
29% no real benefits as add-on therapies
• Between 2011-2012, 56% of total failures in Phase II and III resulted
from lack of efficacy
Source: Arrowsmith J (2011) Nature Reviews Drug Discovery 10: 1, Arrowsmith J and Miller P (2013) Nature
Reviews Drug Discovery 12: 569

16.04.2014
24
Mean clinical phase and approval time from 60 to 80 months
Data derived from: Reichert JM (2003) Nature Reviews Drug Discovery 2: 695-702; 504 NDAs, 50 BLAs
0
20
40
60
80
100
120
140
mo
nth
s
554 NMEs (approval 1980-2001)
Mean clinical phase length [months] Mean approval time [months]
FDA Drug Approval Times
8,1
6,9
6,5
6,5
6,4
5,8
5,4
5,3
4,5
1,9
0,7
1,2
1,3
1
2,4
1,2
0,8
0,5
0 1 2 3 4 5 6 7 8 9
CNS
Antineoplastic
Endocrine
Cardiovascular
Immunologic
Gastroentestinal
Anti-infectives
Anesthetic/analgesic
AIDS antiviral
Years
Clinical phase
Approval phase
Source: Kaitin KI and DiMasi JA (2011) Clinical Pharmacology and Therapeutics 89(2): 183-188

16.04.2014
25
66,0%
21%
7%
6%
Phase III and submissionfailures2
Efficacy
Safety
Financial
Other
Trends in attrition rates in 2011-2012
Source: Arrowsmith J and Miller P (2013) Nature Reviews Drug Discovery 12: 569
51%
19%
29%
1%
Phase II failures2
Efficacy
Safety
Strategic
Operational
Costs of Innovation (1987)
Phase Mean Duration
[months]
Mean Phase
Costs [USD
millions]
Capitalized
Costs [USD
millions]*
Preclinical 42.6 65.5 155.6
Phase I 15.5 9.3 17.8
Phase II 24.3 12.9 21.4
Phase III 36.0 20.2 27.1
Long-term
animal studies
33.6 5.3 8.2
Other animal
studies
33.6 0.4 0.7
Total 113.6 230.8
Data derived from: DiMasi JA (1991) Journal of Health Economics 10: 107-142
*23% success rate in clinical phases, 9% discount rate

16.04.2014
26
New drug approvals today are associated with R&D expenditure that were invested many years ago ...
2,8 2,72,4
1,4 1,51,3
5,7 5,8
6,4 6,5 6,66,4
0
1
2
3
4
5
6
7
1980-1984 1985-1989 1990-1994 1995-1999 2000-2004 2005-2009
Yea
rs
Aproval phase
Clinical phase
Source: Kaitin KI and DiMasi JA
(2011) Clinical Pharmacology
and Therapeutics 89(2): 183-188
„Shorter FDA approval times since mid 1990s were associated with the Implementation of the
Prescription Drug Use Fee Act of 1992“ [DiMasi et al. (2003) Journal of Health Economics 23: 151-
185]
Total Size of R&D Pipeline by Development Phase (2014)
0
1000
2000
3000
4000
5000
6000
Preclinical Phase I Phase II Phase III Pre-reg Registered Launched Suspended
Nu
mb
er
of
pip
elin
ed
rug
s
Source: Citeline (2013) Pharma R&D Annual Review (http://www.citeline.com/wp-content/uploads/Citeline_
2013_RD_Annual_Review1.pdf)

16.04.2014
27
26% of all drug targets are in the field of oncology
397
222
148
137
117
112
110
95
74
52
51
47
71
0 50 100 150 200 250 300 350 400 450
Oncology
CNS
Anti-infectives
Muscoloskeletal
Cardiovascular
Immun system
Endocrine
Gastroenterology
Respiratory
Haematology
Dermatology
Sensory
Other
Number of targets in development by therapeutic area (2011)
Berggren R et al. (2012) Nature Reviews Drug Discovery 11: 435-436
How many NMEs are required for large pharma?
2002
sales
Anticipated
sales from
current
products in
2012
Annual
real
growth
rate
Sales gap for
new
products to
fill in 2012
Estimated number
of NCEs required to
fill the gap (over ten
years)
Year 2012
required
NCE output
USD 45
billion
USD 30 billion 5% USD 43.5
billion
75-90 9.5-11
USD 30
billion
USD 20 billion 5% USD 29 billion 50-60 6.5-7.5
USD 20
billion
USD 13.3
billion
5% USD 19.3
billion
33-40 4.3-5
USD 15
billion
USD 10 billion 5% USD 14.5
billion
25-30 3.25-3.75
USD 10
billion
USD 6.67
billion
5% USD 9.67
billion
16.5-20 2.15-2.25
1Munos B (2009) Nature Reviews Drug Discovery 8: 958, 2Kola I and Landis J (2004) Nature Reviews Drug Discovery 3:
711

16.04.2014
28
Pharmacos have reduced their R&D personnel
Company Date Notes
1 Novartis Jan. 2012 2.000 US sales jobs
2 Sanofi Imminent Up to 2.000 French jobs
3 Pfizer 2005 Still another 12.100 of planned 60.000 jobs to be cut
4 Roche June 2012 Nutley site closed, 1.000 R&D jobs cut
5 GlaxoSmithKline n.a. Ongoing restructering, no specific job target announced
6 Merck & Co. July 2011 12-13% workforce reduction in addition to earlier cuts
following the Schering-Plough merger
7 Johnson &
Johnson
Nov. 2009 7.000 – 8.200 jobs
8 Abbott Jan. 2012 700 manufacturing jobs
9 Bristol-Myers
Squibb
n.a. Ongoing, 295 jobs cut in 2012
10 AstraZeneca Feb. 2012 7.300 jobs (incl. 2.200 in R&D)
Source: Germann PG et al. (2013) Human Genomics 7: 5