the cost effectiveness of digital subtraction angiography in the
TRANSCRIPT

The Cost Effectiveness of DigitalSubtraction Angiography in the Diagnosis
of Cerebrovascular Disease
May 1985
NTIS order #PB85-241115
HEALTH TECHNOLOGY CASE STUDY 34
The Cost Effectiveness ofDigital Subtraction Angiography
in the Diagnosis ofCerebrovascular Disease
MAY 1985
This case study was performed as part of OTA’s Assessment of
Medical Technology and Costs of the Medicare Program
Prepared for OTA by:Matthew Menken, M.D.
Gordon H. DeFriese, Ph.D.Thomas R. Oliver, M.H.A.
Irwin Litt, M.D.
The Health Services Research CenterUniversity of North Carolina at Chapel Hill
This Case Study was submitted in final version for OTA editing in October 1983.
OTA Case Studies are documents containing information on a specific medicaltechnology or area of application that supplements formal OTA assessments. Thematerial is not normally of as immediate policy interest as that in an OTA Report,nor does it present options for Congress to consider.
CONGRESS OF THE UNITED STATES
OfRce d Technology AssessmentWashington, D C 20510
.
Recommended Citation:Menken, Matthew, et al., The Cost Effectiveness of Digital Subtraction Angiography inthe Diagnosis of Cerebrovascular Disease (Health Technology Case Study 34), OTA-HCS-34, Washington, DC: U.S. Congress, Office of Technology Assessment, May 1985.This case study was performed as part of OTA’s assessment of Medical Technology andCosts of the Medicare Program.
Library of Congress Catalog Card Number 85-600542
For sale by the Superintendent of DocumentsU.S. Government Printing Office, Washington, DC 20402

PrefaceThe Cost Effectiveness of Digital Subtraction
Angiography in the Diagnosis of CerebrovascularDisease is Case Study 34 in OTA’s Health Tech-nology Case Study Series. This case study hasbeen prepared in connection with OTA’s projecton Medical Technology and Costs of the MedicareProgram, which was requested by the HouseCommittee on Energy and Commerce and its Sub-committee on Health and the Environment andthe Senate Committee on Finance, Subcommit-tee on Health. A listing of other case studies inthe series is included at the end of this preface.
OTA case studies are designed to fulfill twofunctions. The primary purpose is to provideOTA with specific information that can be usedin forming general conclusions regarding broaderpolicy issues, The first 19 cases in the Health Tech-nology Case Study Series, for example, were con-ducted in conjunction with OTA’s overall projecton The Implications of Cost-Effectiveness Anal-ysis of Medical Technology. By examining the 19cases as a group and looking for common prob-lems or strengths in the techniques of cost-effec-tiveness or cost-benefit analysis, OTA was ableto better analyze the potential contribution thatthose techniques might make to the managementof medical technology and health care costs andquality.
The second function of the case studies is toprovide useful information on the specific tech-nologies covered. The design and the funding lev-els of most of the case studies are such that theyshould be read primarily in the context of the as-sociated overall OTA projects. Nevertheless, inmany instances, the case studies do represent ex-tensive reviews of the literature on the efficacy,safety, and costs of the specific technologies andas such can stand on their own as a useful contri-bution to the field.
Case studies are prepared in some instances be-cause they have been specifically requested bycongressional committees and in others becausethey have been selected through an extensive re-view process involving OTA staff and consulta-tions with the congressional staffs, advisory panelto the associated overall project, the Health Pro-gram Advisory Committee, and other experts invarious fields. Selection criteria were developedto ensure that case studies provide the following:
● examples of types of technologies by func-
tion (preventive, diagnostic, therapeutic, andrehabilitative);examples of types of technologies by physicalnature (drugs, devices, and procedures);examples of technologies in different stagesof development and diffusion (new, emerg-ing, and established);examples from different areas of medicine(e.g., general medical practice, pediatrics,radiology, and surgery);examples addressing medical problems thatare important because of their high frequen-cy or significant impacts (e. g., cost);examples of technologies with associated highcosts either because of high volume (for low-cost technologies) or high individual costs;examples that could provide information ma-terial relating to the broader policy and meth-odological issues being examined in theparticular overall project; andexamples with sufficient scientific literature.
Case studies are either prepared by OTA staff,commissioned by OTA and performed under con-tract by experts (generally in academia), or writ-ten by OTA staff on the basis of contractors’papers.
OTA subjects each case study to an extensivereview process. Initial drafts of cases are reviewedby OTA staff and by members of the advisorypanel to the associated project. For commissionedcases, comments are provided to authors, alongwith OTA’s suggestions for revisions. Subsequentdrafts are sent by OTA to numerous experts forreview and comment. Each case is seen by at least30 reviewers, and sometimes by 80 or more out-side reviewers. These individuals may be fromrelevant Government agencies, professional so-cieties, consumer and public interest groups, med-ical practice, and academic medicine. Academi-cians such as economists, sociologists, decisionanalysts, biologists, and so forth, as appropriate,also review the cases.
Although cases are not statements of officialOTA position, the review process is designed tosatisfy OTA’s concern with each case study’sscientific quality and objectivity. During the vari-ous stages of the review and revision process,therefore, OTA encourages, and to the extentpossible requires, authors to present balanced in-formation and recognize divergent points of view.
. . .Ill

Health Technology Case Study Seriesa
Case Study Case study title; author(s); Case Study Case study title; author(s);Series No. OTA publication numberb Series No. OTA publication numberb
1
2
3
4
5
6
7
8
9
10
11
12
13
14
15
16
17
Formal Analysis, Policy Formulation, and End-Stage RenalDisease;
Richard A. Rettig (OTA-BP-H-9(1))C
The Feasibility of Economic Evaluation of Diagnostic Pro-cedures: The Case of CT Scanning;
Judith L. Wagner (OTA-BP-H-9(2))Screening for Colon Cancer: A Technology Assessment;
David M. Eddy (OTA-BP-H-9(3))Cost Effectiveness of Automated Multichannel ChemistryAnalyzers;
Milton C. Weinstein and Laurie A. Pearlman(OTA-BP-H-9(4))
Periodontal Disease: Assessing the Effectiveness and Costs ofthe Keyes Technique;
Richard M. Scheffler and Sheldon Rovin(OTA-BP-H9(5))
The Cost Effectiveness of Bone Marrow Transplant Therapyand Its Policy Implications;
Stuart O. Schweitzer and C. C. Scalzi (OTA-BP-H-9(6))Allocating Costs and Benefits in Disease Prevention Programs:An Application to Cervical Cancer Screening;
Bryan R. Luce (Office of Technology Assessment)(OTA-BP-H-9(7))
The Cost Effectiveness of Upper Gastrointestinal Endoscopy;Jonathan A. Showstack and Steven A. Schroeder(OTA-BP-H-9(8))
The Artificial Heart: Cost, Risks, and Benefits;Deborah P. Lubeck and John P. Bunker(O-I-A-BP-H-9(9))
The Costs and Effectiveness of Neonatal Intensive Care;Peter Budetti, Peggy McManus, Nancy Barrand, andLu Ann Heinen (OTA-BP-H-9(1O))
Benefit and Cost Analysis of Medical Interventions: The Caseof Cimetidine and Peptic Ulcer Disease;
Harvey V. Fineberg and Laurie A. Pearlman(OTA-BP-H-9(11))
Assessing Selected Respiratory Therapy Modalities: Trends andRelative Costs in the Washington, D.C. Area;
Richard M. Scheffler and Morgan Delaney(OTA-BP-H-9(12))
Cardiac Radionuclide Imaging and Cost Effectiveness;William B. Stason and Eric Fortess (OTA-BP-H-9(13))
Cost Benefit/Cost Effectiveness of Medical Technologies: ACase Study of Orthopedic Joint Implants;
Judith D. Bentkover and Philip G. Drew (OTA-BP-H-9(14))Elective Hysterectomy: Costs, Risks, and Benefits;
Carol Korenbrot, Ann B. Flood, Michael Higgins,Noralou Roos, and John P. Bunker (OTA-BP-H-9(15))
The Costs and Effectiveness of Nurse Practitioners;Lauren LeRoy and Sharon Solkowitz (OTA-BP-H-9(16))
Surgery for Breast Cancer;Karen Schachter Weingrod and Duncan Neuhauser(OTA-BP-H-9(17))
18
19
20
21
22
23
24
25
26
27
28
29
30
31
32
33
34
The Efficacy and Cost Effectiveness of Psychotherapy;Leonard Saxe (Office of Technology Assessment)(OTA-BP-H-9(18))d
Assessment of Four Common X-Ray Procedures;Judith L. Wagner (OTA-BP-H-9(19))’
Mandatory Passive Restraint Systems in Automobiles: Issuesand Evidence;
Kenneth E. Warner (OTA-BP-H-15(20))fSelected Telecommunications Devices for Hearing-ImpairedPersons;
Virginia W. Stern and Martha Ross Redden(OTA-BP-H-16(21))g
The Effectiveness and Costs of Alcoholism Treatment;Leonard Saxe, Denise Dougherty, Katharine Esty,and Michelle Fine (OTA-HCS-22)
The Safety, Efficacy, and Cost Effectiveness of TherapeuticApheresis;
John C. Langenbrunner (Office of Technology Assessment)(OTA-HCS-23)
Variation in Length of Hospital Stay: Their Relationship toHealth Outcomes;
Mark R. Chassin (OTA-HCS-24)Technology and Learning Disabilities;
Candis Cousins and Leonard Duhl (OTA-HCS-25)Assistive Devices for Severe Speech Impairments;
Judith Randal (Office of Technology Assessment)(OTA-HCS-26)
Nuclear Magnetic Resonance Imaging Technology: A Clinical,Industrial, and Policy Analysis;
Earl P. Steinberg and Alan Cohen (OTA-HCS-27)Intensive Care Units (ICUs): Clinical Outcomes, Costs, andDecisionmaking;
Robert A. Berenson (OTA-HCS-28)The Boston Elbow;
Sandra J. Tanenbaum (OTA-HCS-29)The Market for Wheelchairs: Innovations and Federal Policy;
Donald S. Shepard and Sarita L. Karen (OTA-HCS-30)The Contact Lens Industry: Structure, Competition, and PublicPolicy;
Leonard G. Schifrin with William J. Rich (OTA-HCS-31)The Hemodialysis Equipment and Disposable Industry;
Anthony A. Romeo (OTA-HCS-32)Technologies for Managing Urinary Incontinence;
(OTA-HCS-33)The Cost Effectiveness of Digital Subtraction Angiography inthe Diagnosis of Cerebrovascular Disease;
Matthew Menken, Gordon H. DeFriese, Thomas R. Oliver,and Irwin Litt (OTA-HCS-34)
aAvailable for sale by the Superintendent of Documents, I J.S, Government dBackgound paper #3 t. The imp]icat;o~ of C’ost-Effectiveness Analysls ofPrinting Office, Washington, DC, 20402, and by the National Technical Medical Technology,Information Service, 5285 Port Royal Rd., Springfield, VA, 22161. Call ‘Background Paper #5 to The Implications of C’ost-Effectiveness Analysis ofOTA’S Publishing Office (224-8996) for availability and ordering infor- Medical Technology.
fBackWound paper #1 to OTA’S May 1982 report Technology and Handi-mation.boriglna] publication numbers appear in parentheses. capped People.cThe first 17 cases in the series wem 17 separately issued cases in Background gBackground Pa~r #2 to Technology and FIandicapped People.Paper #2: Case Studies of Medical Technologies, prepared in conjunctionwith OTA’S August 198J report The implications of Cost-Effectiveness Anal-vsis ot Medical Technology.
iv
OTA Project Staff for Case Study #34
Roger Herdman, Assistant Director, OTAHealth and Life Sciences Division
Clyde J. Behney, Health Program Manager
Anne Kesselman Burns, Project Director
Katherine E. Locke, Research Assistant
Pamela J. Simerly,l Research Assistant
Edward Seibert,2 Research Assistant
Brad Larson,3 Research Assistant
Virginia Cwalina, Administrative Assistant
Beckie I. Erickson, P. C./Word Processor Specialist
Brenda Miller,4 P. C./Word Processor Specialist
Diann Hohenthaner,5 Secretary
Carol Guntow,6 Clerical Assistant
‘Until September 1984‘September 1984‘S]nce March 1985‘Until January 1985.‘S]nce February 1985‘S]nce October 1984

Medical Technology and Costs of the Medicare Program Advisory Panel*
Stuart Altman, Panel ChairDean, Florence Heller School, Brandeis University
Frank BakerVice PresidentWashington State Hospital Association
Robert BlendonSenior Vice PresidentThe Robert Wood Johnson Foundation
Jerry CromwellPresidentHealth Economics ResearchChestnut Hill, MA
Karen DavisChair, Department of Health Policy and
ManagementSchool of Hygiene and Public HealthJohns Hopkins University
Robert DerzonVice PresidentLewin & AssociatesWashington, DC
Howard FrazierDirectorCenter for the Analysis of Health PracticesHarvard School of Public Health
Clifton GausPresident, Foundation for Health Services
ResearchWashington, DC
Jack HadleyDirectorCenter for Health Policy StudiesGeorgetown University
Kate IrelandChairman, Board of GovernorsFrontier Nursing ServiceWendover, KY
Judith LaveProfessorDepartment of Health EconomicsUniversity of Pittsburgh
Mary MarshallDelegateVirginia House of Delegates
Walter McNerneyProfessor of Health PolicyJ. L. Kellogg Graduate School of ManagementNorthwestern University
Morton MillerImmediate Past PresidentNational Health CouncilNew York, NY
James MonganExecutive DirectorTruman Medical CenterKansas City, MO
Seymour PerryDeputy DirectorInstitute for Health Policy AnalysisGeorgetown University Medical Center
Robert SigmondDirector, Community Programs for
Affordable Health CareAdvisor on Hospital Affairs Blue Cross/Blue
Shield Associations
Anne SomersProfessorDepartment of Environmental and
Community and Family MedicineUMDNJ—Rutgers Medical School
Paul TorrensSchool of Public HealthUniversity of California, Los Angeles
Keith WeikelGroup Vice PresidentAMIMcLean, VA
*The affiliations of the panel members reflect their positions during the assessment (June 1982-July 1984).
vi

Contents
PageCHAPTER 1: INTRODUCTION AND
SUMMARY . . . . . . . . . . . . . . . . . . . . . . . . . 3Background . . . . . . . . . . . . . . . . . . . . . . . . . . . . 3Summary and Conclusions . . . . . . . . . . . . . . 4Organization of the Case Study . . . . . . . . . . 6
CHAPTER 2: STROKE AS A CLINICALPROBLEM . . . . . . . . . . . . . . . . . . . . . . . . . . 9
The Extent of the Problem . . . . . . . . . . . . . . 9Treatment of Stroke . . . . . . . . . . . . . . . . . . . . 10
CHAPTER 3: INTRODUCTION TODIGITAL SUBTRACTIONANGIOGRAPHY . . . . . . . . . . . . . . . . . . . . 15
Technological Development . . . . . . . . . . . . . . 15Contemporary Methods and Clinical
Applications . . . . . . . . . . . . . . . . . . . . . . . . . 15Clinical Efficacy and Effectiveness
of DSA . . . . . . . . . . . . . . . . . . . . . . . . . . . . . 19The Safety (Associated Patient Risks)
of DSA . . . . . . . . . . . . . . . . . . . . . . . . . . . . . 20
CHAPTER 4: THE COSTS OF DIGITALSUBTRACTION ANGIOGRAPHY . . . . . 25
Purchase and Utilization Costs . . . . . . . . . . . 25Patient Costs and Charges . . . . . . . . . . . . . . . 26Implicit and Intangible Costs . . . . . . . . . . . . 26Diffusion and Social Costs . . . . . . . . . . . . . . 27
CHAPTER 5: THE COST EFFECTIVENESSOF DIGITAL SUBTRACTIONANGIOGRAPHY . . . . . . . . . . . . . . . . . . . . 31
Review of Existing Studies of the CostEffectiveness of DSA . . . . . . . . . . . . . . . . . 31
New Technology and Patterns ofMedical Practice: CriticalAssumptions Underlying an Analysis
of Cost Effectiveness. . . . . . . . . . . . . . . . . . . . 33Quantitative Estimates of the CostEffectiveness of DSA . . . . . . . . . . . . . . . . . . . 36
APPENDIX A: ACKNOWLEDGMENTSAND HEALTH PROGRAMADVISORY COMMITTEE . . . . . . . . . . . 45
APPENDIX B: GLOSSARY OF TERMSAND ACRONYMS. . . . . . . . . . . . . . . . . . . 48
REFERENCES . . . . . . . . . . . . . . . . . . . . . . . . . . 53
TablesTable No. Page2-1.
3-1.
3-2.
3-3.
3-4.
5-1.
5-2.
5-3.
5-4.
5-5.
5-6.
5-7.
Death Rates for CerebrovascularDiseases by Age Groups,United States, 1980 . . . . . . . . . . . . . . . . . 9Attempted Applications of DSAReported in the Literature . . . . . . . . . . . 17Comparative Advantages of DSAand Conventional Arteriography . . . . . 18Levels At Which DiagnosticTechnologies May Be Assessed . . . . . . . 19DSA Radiation Exposure Estimatesfor Cerebrovascular Studies . . . . . . . . . 20Data Used for Cost-EffectivenessAnalysis of DSA. . . . . . . . . . . . . . . . . . . 32Estimated Charges forDSA Examinations . . . . . . . . . . . . . . . . . 38Estimates of the Cost Effectivenessof DSA (with fixed charges forarteriography) . . . . . . . . . . . . . . . . . . . . . 38Estimates of the Cost Effectivenessof DSA (with variable charges forarteriography) . . . . . . . . . . . . . . . . . . . . . 39Estimates of Cost Effectivenessof DSA for Expanded PopulationAt Risk With Variable Yield Ratesfor Positive Findings . . . . . . . . . . . . . . . . 40Estimates of the Cost Effectivenessof DSA for a Population At RiskWith Variable DSA Yield Rates andVariable Arteriography Charges . . . . . . 41Estimates of the Cost Effectivenessof DSA for a Population At RiskExpanded Four-Fold With VariableYield Rates for Baseline Findings . . . . . 42
FiguresFigure No. Page3-1.
5-1.
5-2.
Diagram of a Digital SubtractionAngiography (DSA) System . . . . . . . . . 16Clinical Alternatives WithoutDSA Available.. . . . . . . . . . . . . . . . . . . . 33Clinical Alternatives WithDSA Available . . . . . . . . . . . . . . . . . . . . . 33
vii

OTA Note
These case studies are authored works commissioned by OTA. Each authoris responsible for the conclusions of specific case studies. These cases are not state-ments of official OTA position. OTA does not make recommendations or endorseparticular technologies. During the various stages of review and revision, there-fore, OTA encouraged the authors to present balanced information and to recog-nize divergent points of view.
. . .Vlll

1.
Introduction and Summary

1.
Introduction and Summary
BACKGROUND
Digital subtraction angiography (DSA) is anew, and rapidly developing, technology in thefield of diagnostic radiology. DSA is one of sev-eral computer-assisted radiologic tools for diag-nosing conditions associated with the internalstructure of blood vessels. The technique usuallyinvolves injecting contrast medium into the veinsand measuring over time the changing concentra-tion of contrast medium passing through thevascular structures of interest. 1 Through the useof a computer, the images before the contrast in-jection are “subtracted” from those after injectionto give a numerical representation of the arterialstructure under study. This relatively noninva-sive2 technique can be performed on an outpatientbasis with very low risk of morbidity comparedto conventional and (invasive) techniques such asarteriography. 3
DSA has been shown to have important clini-cal uses in diagnostic studies of the carotid, re-nal, intracranial, and peripheral arteries, the aortaand in pulmonary studies. There are reasonableexpectations that this procedure will develop tothe point where it will have wide applicability inthe diagnosis of coronary artery disease in the nextseveral years.
Since 1980, when prototype commercial sys-tems were introduced in the United States, im-provements in the design and capacity of avail-able DSA equipment have established the clinicalefficacy and effectiveness of this procedure for cer-
‘With respect to cembrovascular diagnostic studies, both intra-venous and intra-arterial DSA have been employed. However, inthis case study the notation “DSA” is used to signify intravenousapplications only. The focus is limited to intravenous DSA, becauseit is the method employed in the evaluation of the extracranial cir-culation, especially the carotid arteries, in most cases as of October1983, when this case study was submitted to OTA for final editing.
2A relatively noninvasive technique is a technique that involvespuncturing or atheterizing a vein, which carries considerably lowermorbidity than techniques that involve puncturing or catheterizingan artery, such as conventional arteriography.
‘See the glossary of terms for definitions of selected medical terms(app. B).
tain purposes. These improvements have alsoraised the possibility of applications in dozens ofadditional areas of diagnostic radiology.
The rapidity with which this technology hasbeen developed and diffused throughout the med-ical care system in the United States raises impor-tant public policy questions about the cost impli-cations of the procedure, especially its relative costeffectiveness when compared to other diagnosticradiology technologies it may replace. It is likelythat the fact that this technique is relatively nonin-vasive will increase its importance and frequencyof use as a preliminary examination procedure forthe diagnosis of certain types of diseases. For thesereasons, it is important to know under what con-ditions it may be expected to yield cost savingsover currently available technologies.
In this case study, a single category of clinicalproblems where DSA is in use on a broad scale—cerebrovascular disease—is selected as the con-text within which the cost effectiveness of DSAis explored.4 This case study does not present newprimary data from a prospective study of DSAuse in the diagnosis and management of cerebro-vascular disease. Rather, the data derived fromthe very few studies that already exist are usedto test certain assumptions about the cost effec-tiveness of this new technology compared to con-ventional arteriography. Furthermore, because thedata available to explore these questions are notprecisely what would be required to conduct theappropriate test, the calculations presented in thiscase study will not be completely satisfactory tothose with expertise in cost-effectiveness analysis.
The intention of this study, however, is to pre-sent a careful description of the current and po-tential application of DSA within the area of diag-
4A majority of the DSA procedures performed are examinationsof the carotid arteries. The diagnosis of carotid artery disease (acommon manilkstation of cerebrovascular disease) is important sinceit is a major cause of stroke.
3

4
nostic radiology concerned with cerebrovasculardisease and to suggest the implications of the tech-nology for patterns of clinical practice and patientcare costs under different assumptions. The diag-nosis and treatment of stroke, as well as the prob-lems of identifying patients at high risk for stroke,represent clinical activities with broad implica-tions for American health care resource alloca-
SUMMARY AND CONCLUSIONS
DSA is clearly a major technological advancein the field of diagnostic imaging radiography.Further refinements of the basic technology in thenext several years are expected to enhance its pres-ent utility in the diagnosis of cerebrovascular dis-ease, a major cause of death in the United States.
There are several technologies of varying de-grees of invasiveness already in widespread usein the diagnosis and treatment of cerebrovasculardisease. DSA presents a new alternative to con-ventional arteriography for establishing the pres-ence or absence of carotid artery stenosis (nar-rowing). Although the technique is more sensitiveand specific than some noninvasive tests (i. e.,ultrasonography) for the diagnosis of arterialstenosis, and more effective than real-time ultra-sound for the diagnosis of ulcers, DSA remainssomewhat less accurate than conventional arte-riography, especially for the evaluation of ulcera-tive lesions. However, as technological improve-ments take place, the speed and spatial resolutionof DSA images of the cerebral vascular systemare expected to eventually approach the accuracyof arteriography. Physician acceptance of DSAas a substitute for arteriography is expected to oc-cur rapidly and to reach a level beyond 80 per-cent replacement (64), except perhaps in someteaching medical centers. In these centers, diag-nostic evaluations are often duplicative.
For those patients who are now being exam-ined by arteriography, it is relatively simple toformulate a reasonable estimate of the numberwho may subsequently receive only a DSA ex-amination. It is more difficult to estimate the num-ber of patients at risk of cerebrovascular diseasein the general population who might be screened
tion. Because of the importance of stroke as aleading cause of death, and because of the highcost of acute medical care, rehabilitation, andlong-term care requirements for stroke victims,the investigation of new techniques for clinicalmanagement of this set of problems merits seri-ous attention by health care providers and pol-icymakers alike.
through the use of DSA, but who would not beconsidered candidates for arteriography orsurgery.
This case study outlines a number of assump-tions about the way in which DSA might be in-tegrated with current patterns of practice in pri-mary care and neurological specialties. In theUnited States, 87 percent of the patients servedby neurologists are referred by other (usuallyprimary care) physicians. The management ofpatients with a clinical diagnosis of transientischemic attack (TIA), one of the most commonclinical indicators of cerebrovascular disease andpossibly a forthcoming stroke, is determined bythe physician who has first contact with the pa-tient following such an event. Because a physi-cian will almost never witness a TIA, most TIAsare diagnosed on the basis of the history and phys-ical examination of the patient some time afterthe TIA has occurred. Since TIAs are presumedsigns of a possible forthcoming stroke, they usu-ally precipitate the patient’s contact with the med-ical care provider.
There is considerable ambiguity and confusionamong physicians (in neurology and in primarycare specialties) over the most appropriate man-agement strategies for patients with a history ofTIAs (105). Moreover, there is a significant riskthat some patients will be misdiagnosed as hav-ing had a TIA. It is important to recognize thatTIA is a clinical diagnosis; it is not a diagnosisformulated on the basis of a radiographic test orprocedure. When arterial stenosis is discoveredwith a DSA exam, the physician may concludethat a patient’s dizzy spell, temporary numbnessin a hand or foot, or an unusual ocular problem

5
was a TIA. The problem with this pattern of deci-sionmaking and medical practice is that asymp-tomatic atherosclerosis is prevalent in the generalpopulation. A temporary neurological problemand arterial stenosis often coexist, and yet maybe totally unrelated to one another. Causality isestablished through clinical judgment alone.
At present, conventional arteriography is themost accurate technology for testing the hypoth-esis of carotid artery stenosis. Because of the riskof morbidity and the special circumstances underwhich this procedure is done (usually requiringhospitalization of the patient), there are many fac-tors operating to constrain the overuse of conven-tional arteriography. The introduction of DSAmakes available a less costly, relatively low risk,highly accurate, and useful source of the samediagnostic information now available througharteriography.
The introduction of any new medical technol-ogy is usually followed by a period of experimen-tation during which individual physicians explorethe utility and accuracy of the new technology,while continuing to use those techniques withwhich they are familiar, Such a pattern may beexpected with DSA. In the near future, DSA maybe expected to duplicate or supplement the diag-nostic information provided by other noninvasivetests, and arteriography, the test currently usedin the diagnosis of arterial stenosis. Later, theother noninvasive tests may be expected to beused less frequently. As the accuracy of DSA be-comes accepted as a sufficient basis for surgicaldecisionmaking, the utilization of conventionalarteriography for the diagnosis of carotid arterystenosis may be expected to significantly declineas well.
An important variable in determining the costsof DSA is the level of use of each DSA facility(whether in a hospital or non-hospital setting)–that is, its operational efficiency. Moreover, it isnecessary to measure the subsequent use of con-ventional arteriography and other imaging facil-ities. For example, if the use of arteriography de-clines substantially, but the equipment, facilities,and personnel are maintained, then the costs ofDSA will only add to the total costs of diagnos-tic imaging services taken as a whole. Similarly,
if DSA equipment diffuses widely, and is not uti-lized efficiently, then the high fixed costs of thetechnology will exceed any expected benefits.
As with all types of technology, there is an ef-ficient level of use that includes regionalizationand the sharing of facilities. However, there areimportant features of many diagnostic technol-ogies, like DSA and arteriography, that presentspecial problems with respect to their cost impact.Unlike therapeutic technologies, which are di-rected toward known manifestations of disease,diagnostic technologies have been developed toaid in the search for clinical evidence to defineand explain conditions of presently unknownorigin. Some of these technologies have been de-veloped for the diagnosis of particular diseases,but later have been found to have wider applica-tions (5). It is the general pattern of clinical useof these technologies (which can entail ratheropen-ended exploratory uses of a wide variety oftechnologies), combined with their technical so-phistication and accessibility, that determines theireventual cost effectiveness.
The estimation of the cost effectiveness of DSAmust be undertaken in a broad context. In thiscost-effectiveness analysis, concern is with themeasurement of the incremental cost of a unit ofbenefit under average conditions of use. In thefield of medical practice, it is “average conditionsof use” that make the estimation of cost effective-ness so problematic.
This case study suggests that DSA is likely tobe cost effective if its pattern of use is a substi-tute for, rather than a supplement to, conven-tional arteriography in the diagnosis of carotidartery disease. Preliminary accuracy and sen-sitivity data for DSA suggest the prospects for thispattern of acceptance and use are rather high.
However, under average conditions of use, theavailability of DSA is likely to result in a muchlarger number of patients evaluated for possiblecarotid artery disease. In fact, seven times thenumber of patients now receiving conventionalarteriography would, it is estimated, receive DSAexaminations in connection with the diagnosis ofcarotid artery disease, and it is likely that manyof these patients will also receive more than asingle DSA exam during the same episode of care.

6
Because DSA offers an alternative to conven-tional arteriography that has a lower risk of mor-bidity and can be done on an outpatient basis,it can be expected that many patients (once theyknow about its availability) will want the proce-dure performed. These patients and their fami-lies are likely to value the procedure highly forits ability to reduce the worry and uncertaintyassociated with certain diagnostic conditions.
Given the demonstrated high quality, sensitiv-ity and specificity of DSA images for the studyof carotid artery disease, the relatively low riskof morbidity and the lack of need for hospitali-zation, it is likely that an increasing number ofpatients will have DSA studies ordered by theirprimary care physicians prior to consultation with
a necrologic specialist. Whereas conventionalarteriography was almost never performed with-out benefit of a necrologic opinion, DSA will fre-quently become part of the primary physician’sinitial evaluation protocol. Since DSA results areof such high quality and presumably easier to in-terpret, it is likely that necrologic consultants willbe bypassed more frequently by primary physi-cians in their decisions to refer patients for sur-gical therapy when carotid artery disease is diag-nosed. The use of DSA by primary care physiciansin diagnosing carotid artery disease is likely to in-crease the volume of unnecessary surgical ther-apy for patients undergoing DSA examinations,These trends warrant careful attention over thenext several years.
ORGANIZATION OF THE CASE STUDY
Chapter 2 presents an overview of cerebrovas-cular disease generally, and stroke specifically, asclinical problems. After discussing the direct andindirect costs of stroke, the theory of preventivetherapy is introduced, using TIAs as an example.Numbness of a foot or a hand, blindness in oneeye or double vision, are all “early warning”signals of stroke and should lead to further neu-rological examination. Chapter 2 concludes thatnew medical techniques are needed to help in theearly diagnosis of stroke.
Chapter 3 provides an indepth look at the tech-nology, DSA. It describes the development,growth and operation of DSA and compares DSAto arteriography. Efficacy and safety are high-lighted as two explicit advantages of DSA. Theevaluation of aortic arch abnormalities, aorticcoarctation, and vascular bypass grafts are some
of the clinical applicationschapter 3.
o f D S A d i s c u s s e d i n
Chapter 4 looks at the costs of DSA. There aremany costs involved in acquiring a new technol-ogy. Chapter 4 initially analyzes two main typesof costs: capital costs (computers, X-ray equip-ment and facilities) and operating costs (person-nel and supplies). Next, direct implicit and intangi-ble costs, costs related to diffusion, and socialcosts are all discussed.
The purpose of chapter 5 is to study the costeffectiveness of DSA. “Cost per procedure” and“cost per lesion” are compared with the same datafound for arteriography. Conclusions are thenmade concerning the increase in future use of DSAin the diagnosis of cerebrovascular disease.

.
2.Stroke as a Clinical Problem

.
2 .Stroke as a Clinical Problem
THE EXTENT OF THE PROBLEM
Stroke (completed cerebral infarction) is thethird most common cause of death in the UnitedStates. In addition to its importance as a causeof mortality, stroke and associated disordersaffecting the central nervous system account fora significant burden of illness treated by the med-ical care system. A major cause of stroke is carotidartery disease (a common manifestation of cere-brovascular disease), which is often diagnosedthrough digital subtraction angiography (DSA)examination.
Several studies have reported that the incidenceof stroke has declined over the last several yearsin the United States (40,41,79,95). Future projec-tions of the need for diagnostic or therapeutictechnologies for treating stroke need to take thesetrends into account. However, the age-specificdeath rates from these conditions, taken as awhole, have continued to be significantly higherfor persons beyond the age of 55 than for youngerpersons (see table 2-1). Likewise, the volume ofdiagnostic procedures used in the care of personssuspected of having cerebrovascular disease ishigher among those older age groups.
Table 2-1 .—Death Rates for Cerebrovascular Diseasesby Age Groups, United States, 1980 (number of deaths
per 100,000 resident population)
Total, all ages, adjusted . . . . . . . . . . . . . . . . . . . . 41.5Total, all ages, crude . . . . . . . . . . . . . . . . . . . . . . . 76.6Under 1 year . . . . . . . . . . . . . . . . . . . . . . . . . . . . . . 3.81-14 years . . . . . . . . . . . . . . . . . . . . . . . . . . . . . . . . 0.315-24 years . . . . . . . . . . . . . . . . . . . . . . . . . . . . . . . 1.225-34 years . . . . . . . . . . . . . . . . . . . . . . . . . . . . . . . 2.735-44 years . . . . . . . . . . . . . . . . . . . . . . . . . . . . . . . 8.645-54 years . . . . . . . . . . . . . . . . . . . . . . . . . . . . . , . 26,155-64 years . . . . . . . . . . . . . . . . . . . . . . . . . . . . . . . 67.865-74 years . . . . . . . . . . . . . . . . . . . . . . . . . . . . . . . 222.475-84 years . . . . . . . . . . . . . . . . . . . . . . . . . . . . . . . 834.785 years and older , . . . . . . . . . . . . . . . . . .......2,094.0SOURCE: U.S Department of Health and Human Services, National Center for
Health Statistics, Hea/th, Lhifed States, 1982, table 19, p 67
Cerebrovascular disease in general has beenestimated to have an annual incidence of 195 per100,000 population per year (62). The Office ofGraduate Medical Education of the U.S. Depart-ment of Health and Human Services (DHHS) con-vened a special panel of experts to consider thenumber of neurological care physicians needed tocare for this volume of illness on an annual basis(42). This panel concluded that 967 hours ofneurological specialty care would be required an-nually per 100,000 population. This level of med-ical specialty care would also be provided by typesof health personnel other than neurologists—physiatrists (specialists in rehabilitation medicine),physical therapists, speech pathologists, occupa-tional therapists, and others (42).
Cerebrovascular disease occupies a significantportion of the practice of primary care physiciansas well. Although stroke is not among the top 25outpatient diagnostic encounters recorded byfamily physicians, cerebrovascular disease (ICD-9Code 336: “Acute, but ill-defined, cerebrovasculardisease”) is the second most common diagnosisfor hospital patients of office-based general prac-tice and family physicians in the United States(43). It has been estimated that 13 percent of allhospital patients have a primary and/or second-ary necrologic diagnosis (113), and that at least50 percent of these diagnoses are for cerebrovas-cular disorders (46). This situation reflects the fre-quency with which stroke patients require long-term institutional care.
The costs of stroke are enormous. In 1975, thedirect and indirect costs of stroke were estimatedto be approximately $9.5 billion annually (103).Because many patients with a stroke have lossesof intellect and locomotion that require long-terminstitutionalization, prevention of stroke is a ma-jor health care objective at this time.
9

10
TREATMENT OF STROKE
Once a completed stroke has occurred, noknown treatment can repair damaged tissue to re-store function. Thus, preventive care is essentialin the management of patients with cerebrovas-cular disorders. Since completely effective preven-tive therapy—the elimination of hypertension andatherosclerosis—is not available at this time,“half-way” preventive therapies are currentlyemployed. These include general medical meas-ures, such as control of hypertension and cardiacarrhythmias, if present, as well as surgical meas-ures, such as endarterectomy (the surgical removalof cholesterol plaque from the inner surfaces ofarteries) or cerebral bypass surgery.
The dominant theory underlying preventivetherapies for stroke is the identification of stroke-prone individuals who have had transient ische-mic attacks (TIAs). A TIA is a reversible episodeof cerebrovascular insufficiency that usually lastsless than one hour, and always lasts (by defini-tion) less than 24 hours. These “warning spells”have an incidence of 30 per 100,000 total popu-lation per year (62). The interval between episodicattacks varies from several hours to severalmonths or longer. While the episodes often fol-low a stereotyped pattern in a given patient, theirmodes of occurrence vary. It is most commonlythought that they arise from the passage of micro-emboli of fibrin-platelets or cholesterol into thecerebral circulation.
Although TIAs area form of physiologic distur-bance, they are generally grouped on an anatomicbasis by clinicians according to the visible symp-toms. TIAs include those of carotid artery origin,those of vertebral and basilar artery origin, andthose of indeterminate origins. It should be notedthat a physician rarely witnesses a TIA and is de-pendent for clinical diagnosis upon the patient’srecall and medical history. The hallmark of a TIAis the localized disturbance of brain function thatis associated with specific physiologic symptoms.A hand or foot may become numb, or one sideof the body may show such symptoms. One eyemay become blind, or partly blind, or double vi-sion (diplopia) may occur. Vertigo and dizziness,disturbances of speech and language, and episodes
of leg weakness, are other symptoms that mayreflect the occurrence of a TIA.
When a TIA is suspected, a clinician performsa complete physical neurological examination andsearches for evidence of heart disease or diseaseof the carotid/vertebrobasilar systems. A mur-mur (bruit), audible with a stethoscope, over amajor artery in the neck is often a sign of turbulentblood flow resulting from atherosclerosis of theunderlying vessel. This sign is a good bedside in-dicator of arterial narrowing (stenosis), but boththe presence or absence of a bruit may be mis-leading. For example, it is known that as a vesselbecomes progressively narrowed, the loudness ofa bruit may actually diminish, so that when dis-ease is severe and advanced, no bruit maybe audi-ble. Other bedside signs include a difference ofgreater than 15 percent between the blood pres-sures recorded in both arms, absence of a palpablebranch of the external carotid artery, or thevisualization of embolic material in the retinal cir-culation with an ophthalmoscope.
To supplement bedside testing, a number of“noninvasive” tests (requiring neither arterial norvenous punctures) are currently employed toassess the extracranial circulation. Ophthalmo-dynamometry enables physicians to record theblood pressure in the ophthalmic artery, the firstmajor intracranial branch of the carotid arteryitself. A computed tomography (CT) scan maydemonstrate a stroke in the brain. Such a test sug-gests that the clinical impression of TIA was inerror, and that a completed cerebral infarction,or stroke, has actually occurred. Strokes may beischemic (reduced CT density), hemorrhagic (in-creased CT density), or both. Thermography mayshow a diminished temperature over the medialforehead, which may indicate carotid artery dis-ease. Real-time ultrasound (also known as a B-scan, a test which measures the anatomical struc-ture of vessels), and a Doppler device (an imag-ing device for measuring the flow velocity ofblood through the arteries), may provide evidenceof the extent of arterial lumen compromise anddisturbance of blood flow.
11
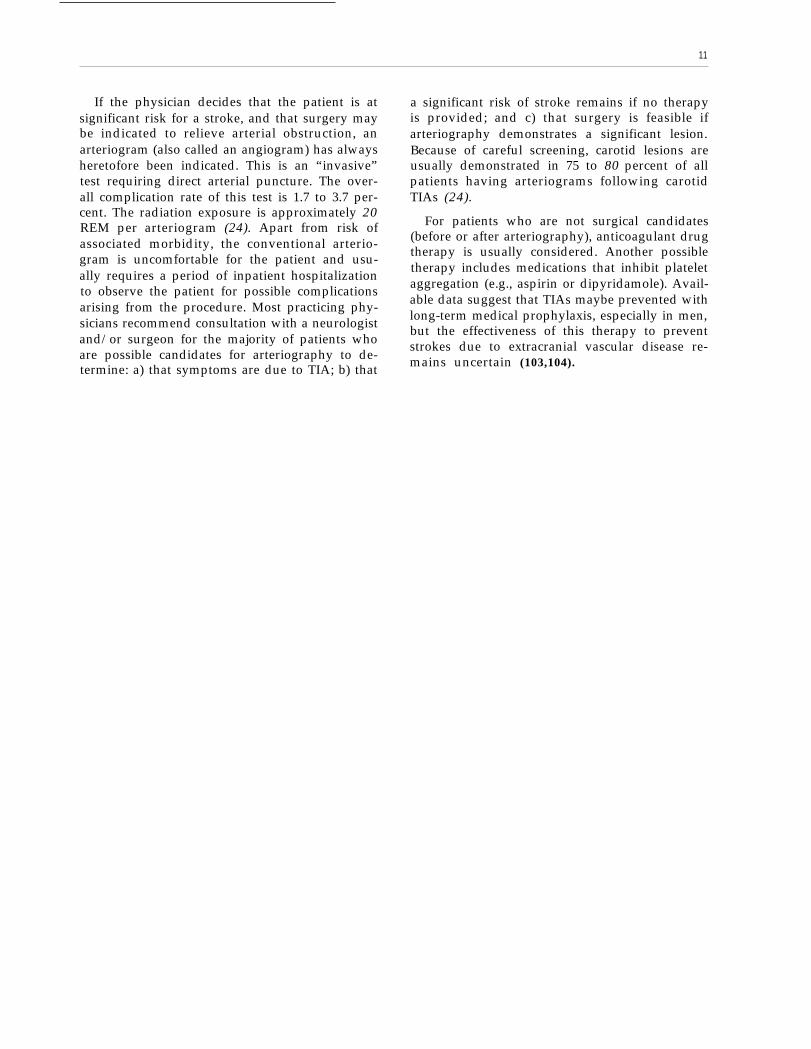
If the physician decides that the patient is atsignificant risk for a stroke, and that surgery maybe indicated to relieve arterial obstruction, anarteriogram (also called an angiogram) has alwaysheretofore been indicated. This is an “invasive”test requiring direct arterial puncture. The over-all complication rate of this test is 1.7 to 3.7 per-cent. The radiation exposure is approximately 20REM per arteriogram (24). Apart from risk ofassociated morbidity, the conventional arterio-gram is uncomfortable for the patient and usu-ally requires a period of inpatient hospitalizationto observe the patient for possible complicationsarising from the procedure. Most practicing phy-sicians recommend consultation with a neurologistand/or surgeon for the majority of patients whoare possible candidates for arteriography to de-termine: a) that symptoms are due to TIA; b) that
a significant risk of stroke remains if no therapyis provided; and c) that surgery is feasible ifarteriography demonstrates a significant lesion.Because of careful screening, carotid lesions areusually demonstrated in 75 to 80 percent of allpatients having arteriograms following carotidTIAs (24).
For patients who are not surgical candidates(before or after arteriography), anticoagulant drugtherapy is usually considered. Another possibletherapy includes medications that inhibit plateletaggregation (e.g., aspirin or dipyridamole). Avail-able data suggest that TIAs maybe prevented withlong-term medical prophylaxis, especially in men,but the effectiveness of this therapy to preventstrokes due to extracranial vascular disease re-mains uncertain (103,104).

3.Introduction to Digital
Subtraction Angiography

Introduction to DigitalSubtraction Angiography
Digital subtraction angiography (DSA) is a newradiographic technology used in diagnosing vas-cular disease. DSA is employed to obtain imagesof arteries in various parts of the body and ishighly effective in contrasting arterial structureswith their surrounding bone and soft tissue (3).DSA has proven especially useful in the identifica-tion of vascular abnormalities, including occlu-sions, stenoses, ulcerated plaques, and aneurysms(21,58,107).
The potential importance of DSA in the diag-nosis of cerebrovascular disease is suggested byReuter’s (87) observation that as much as one-
TECHNOLOGICAL DEVELOPMENT
The development of DSA was a result of theresearch of medical physics groups at the Univer-sity of Wisconsin, the University of Arizona, andthe Kinderklinik in Kiel, West Germany duringthe early 1970s (21,58,74). Fundamental advancesin intravenous arteriography, which had been in-termittently used since the 1930s, were made pos-sible by the introduction of cesium iodine imageintensifiers and advances in digital electronicmethods of storing and manipulating information(21). By 1978, the feasibility of DSA for humansubjects was demonstrated, and prototype com-mercial DSA systems were introduced in 1980 atthe Universities of Arizona and Wisconsin, theCleveland Clinic, and South Bay Hospital inRedondo Beach, California (57,58,74). There are
quarter of the combined volume of neuroradiol-ogy and angiography services in some medicalcenters is now directed toward evaluating carotidand cerebral atherosclerosis, including stroke. TheCooperative Study of Transient Ischemic Attacks(TIAs) (102) reported an average of 5.4 definiteTIAs per 100 acute beds per year in the partici-pating medical centers. Estimates of the use ofarteriography procedures for these hospitalizedpatients range between 87 and 97 percent (23).DSA will either supplement or replace a large por-tion of the arteriographic procedures.
now nearly 20 manufacturers of DSA systems andmany more in the process of developing new sys-tems (18).
The size of the market for DSA equipment issomewhat difficult to estimate because of the un-certain future of demonstrated uses of DSA in cor-onary angiography. A spokesperson for one ofthe major manufacturers of DSA equipmentshared two projections of investment bankingfirms for all types of DSA units for the periodfrom 1982 through 1986. One firm projected totalsales of 5,160 units, while the other firm projectedsales of 9,800 units for the same period. Therewere estimated to be about 600 DSA units of alltypes in operational status as of January 1983.
CONTEMPORARY METHODS AND CLINICAL APPLICATIONS
With respect to cerebrovascular diagnostic in the evaluation of the extracranial circulation,studies, both intravenous and intra-arterial DSA especially the carotid arteries, in most cases.1
have been employed. However, in this case studythe notation “DSA” is used to signify intravenousapplications only. The focus is limited to intra- ‘As of October 1983, when this case study was submitted to OTAvenous DSA, because it is the method employed for final editing.
15

16
DSA systems work in the manner depicted infigure 3-1 as follows: a contrast medium is injectedintravenously; X-ray detection of the contrastmedium produces 1 to 30 exposures per second(before and after the injection of contrast me-dium); and arterial images are converted fromanalog to digital form and transmitted to a com-puter-storage complex (55). The digitalized im-age information makes it possible to “subtract”the precontrast images from those obtained aftercontrast injection so as to visualize arterial struc-tures without direct arterial puncture and injec-tion. The data can be recalled for viewing on avideo screen, and successive images createdthrough subtraction techniques which allow thecontrast of the arterial structures to be visualizedfor the detection of abnormalities.
The purpose of the subtraction process used inDSA is to eliminate (or factor out) the bone andsoft tissue images that would otherwise be super-imposed on the artery under study (12,58). Theserial images show changes in the contrast appear-ance over time (temporal subtraction) and at vary-ing X-ray intensities (energy subtraction) (12,57).
Most DSA examinations require 25 to 45 min-utes to perform (63,99,112), if there are no tech-nical complications (e.g., difficulties with catheter-ization), and can be performed on an outpatientbasis. This is a considerable advantage in safetyand cost over most standard arteriographic ex-aminations, which require at least overnightobservation of the patient in the hospital to detectpost-procedure arterial obstruction or hemorrhage(24,33). However, a small number of the latterhave been safely performed on an ambulatorybasis in recent years (45).
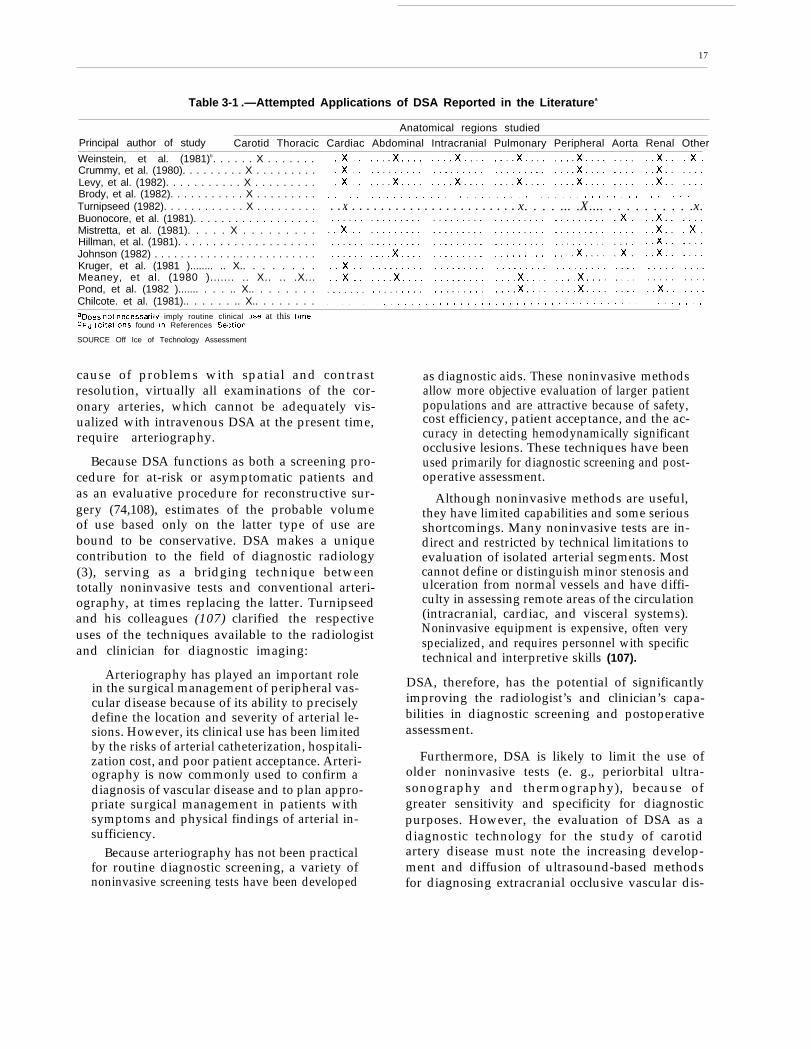
DSA has a wide range of clinical applicationsin addition to its use in carotid artery studies.Mistretta and his colleagues (74) at the Univer-sity of Wisconsin have substituted DSA for stand-ard arteriography in the evaluation of aortic archanomalies, aortic coarctation, and vascular by-pass grafts. Digital subtraction techniques havealso been used for imaging of the abdominal, car-diac, pulmonary, carotid, intracerebral, andperipheral vessels. Table 3-1 provides an overviewof the range of attempted applications of DSA im-aging technology reported in the literature. Be-
Figure 3-1 .—Diagram of a Digital Subtraction Angiography (DSA) System
II
III
/IIIIIIIIII
III
;IIII
SOURCE: Office of Technology Assessment. Adapted with permission of the General Electric Co, from G. S. Keyes, N. J, Pelc, S, J. Riederer, et al., Digita/ F/uorographyA Teclmology (@date (Milwaukee, Wl: General Electric Co., 1981),
17
Table 3-1 .—Attempted Applications of DSA Reported in the Literaturea
Anatomical regions studiedPrincipal author of study Carotid Thoracic Cardiac Abdominal Intracranial Pulmonary Peripheral Aorta Renal Other
Weinstein, et al. (1981)b. . . . . . X . . . . . . .Crummy, et al. (1980). . . . . . . . . X . . . . . . . . .Levy, et al. (1982). . . . . . . . . . . X . . . . . . . . .Brody, et al. (1982). . . . . . . . . . . X . . . . . . . . .Turnipseed (1982). . . . . . . . . . . . X . . . . . . . . .Buonocore, et al. (1981). . . . . . . . . . . . . . . . . .Mistretta, et al. (1981). . . . . X . . . . . . . . .Hillman, et al. (1981). . . . . . . . . . . . . . . . . . . .Johnson (1982) . . . . . . . . . . . . . . . . . . . . . . . . .Kruger, et al. (1981 )........ .. X.. . . . . . . .Meaney, et al. (1980 )....... .. X.. .. .X...Pond, et al. (1982 )....... . . . .. X.. . . . . . . .Chilcote. et al. (1981).. . . . . . .. X.. . . . . . . .
. . . . . . . . . . . . . . . . . . . . . . . . . . . . . . . . . . . . . . . . . . . . . . . . . .x. . . . . . . . . . . . . . . . . . . . . . . . . . x. . . . ... .X.... . . . . . . . . . .x.
. . . . . . . . . . . . . . . . . . . . . . . . . . . . . . . . . . . . . . . . . . . . . . . . . . . . . .aDoe~ not necess~ily imply routine clinical use at this timebFull cltatlons found In References Sect!on
SOURCE Off Ice of Technology Assessment
cause of problems with spatial and contrastresolution, virtually all examinations of the cor-onary arteries, which cannot be adequately vis-ualized with intravenous DSA at the present time,require arteriography.
Because DSA functions as both a screening pro-cedure for at-risk or asymptomatic patients andas an evaluative procedure for reconstructive sur-gery (74,108), estimates of the probable volumeof use based only on the latter type of use arebound to be conservative. DSA makes a uniquecontribution to the field of diagnostic radiology(3), serving as a bridging technique betweentotally noninvasive tests and conventional arteri-ography, at times replacing the latter. Turnipseedand his colleagues (107) clarified the respectiveuses of the techniques available to the radiologistand clinician for diagnostic imaging:
Arteriography has played an important rolein the surgical management of peripheral vas-cular disease because of its ability to preciselydefine the location and severity of arterial le-sions. However, its clinical use has been limitedby the risks of arterial catheterization, hospitali-zation cost, and poor patient acceptance. Arteri-ography is now commonly used to confirm adiagnosis of vascular disease and to plan appro-priate surgical management in patients withsymptoms and physical findings of arterial in-sufficiency.
Because arteriography has not been practicalfor routine diagnostic screening, a variety ofnoninvasive screening tests have been developed
as diagnostic aids. These noninvasive methodsallow more objective evaluation of larger patientpopulations and are attractive because of safety,cost efficiency, patient acceptance, and the ac-curacy in detecting hemodynamically significantocclusive lesions. These techniques have beenused primarily for diagnostic screening and post-operative assessment.
Although noninvasive methods are useful,they have limited capabilities and some seriousshortcomings. Many noninvasive tests are in-direct and restricted by technical limitations toevaluation of isolated arterial segments. Mostcannot define or distinguish minor stenosis andulceration from normal vessels and have diffi-culty in assessing remote areas of the circulation(intracranial, cardiac, and visceral systems).Noninvasive equipment is expensive, often veryspecialized, and requires personnel with specifictechnical and interpretive skills (107).
DSA, therefore, has the potential of significantlyimproving the radiologist’s and clinician’s capa-bilities in diagnostic screening and postoperativeassessment.
Furthermore, DSA is likely to limit the use ofolder noninvasive tests (e. g., periorbital ultra-sonography and thermography), because ofgreater sensitivity and specificity for diagnosticpurposes. However, the evaluation of DSA as adiagnostic technology for the study of carotidartery disease must note the increasing develop-ment and diffusion of ultrasound-based methodsfor diagnosing extracranial occlusive vascular dis-
18
ease. These technologies have developed very rap-idly and newer methods are likely in the future.Because of the safety of these tests, their popu-larity in clinical practice is not likely to bedisplaced by DSA in complex or poorly under-stood clinical situations. However, it may be ex-pected that, where the diagnosis of a carotid TIAseems highly likely on clinical grounds alone, thephysician may select DSA as the initial diagnos-tic test.
Of the large and growing number of nonin-vasive tests, ultrasound imaging has proved to bethe most versatile and reliable in clinical practice.A combination of B-mode real-time imaging, witha Doppler scanning device (often called “duplexscanning”), has become increasingly prevalent.Using this method, an image of the carotid vesselis obtained with the B-scan, and then the bloodflow pattern at a given anatomic location is deter-mined with the Doppler signal. This method isadvantageous in noninvasive diagnosis in skilledhands, but it takes considerable experience for anoperator to become sufficiently expert in the useof this tool to produce reliable and reproducibleinformation of clinical value. However, in partbecause these techniques have proved popularwith practicing clinicians, and in part because theyare affordable in office-based practice, industryis likely to respond to the demand for this tech-nology with more accurate and more easily per-formed duplex scanning in the near future.
By way of comparison, the indirect noninvasivetests (e.g., periorbital ultrasonography), whichmonitor the cerebral and orbital circulationsbeyond (downstream from) a carotid lesion, havebeen shown in most practice settings to have alower sensitivity and specificity than DSA and/orarteriography and are employed much less fre-quently at this time than was the case only a fewyears ago. This trend is likely to be accentuatedin the coming years.
As described above, DSA is also likely to limitthe use of, or substitute for, arteriography undermany clinical circumstances. In addition, it willbe employed in situations where arteriography isinapplicable, thus increasing the total volume ofarterial examinations. For example, some patientsfor whom arteriography is risky—such as elderly
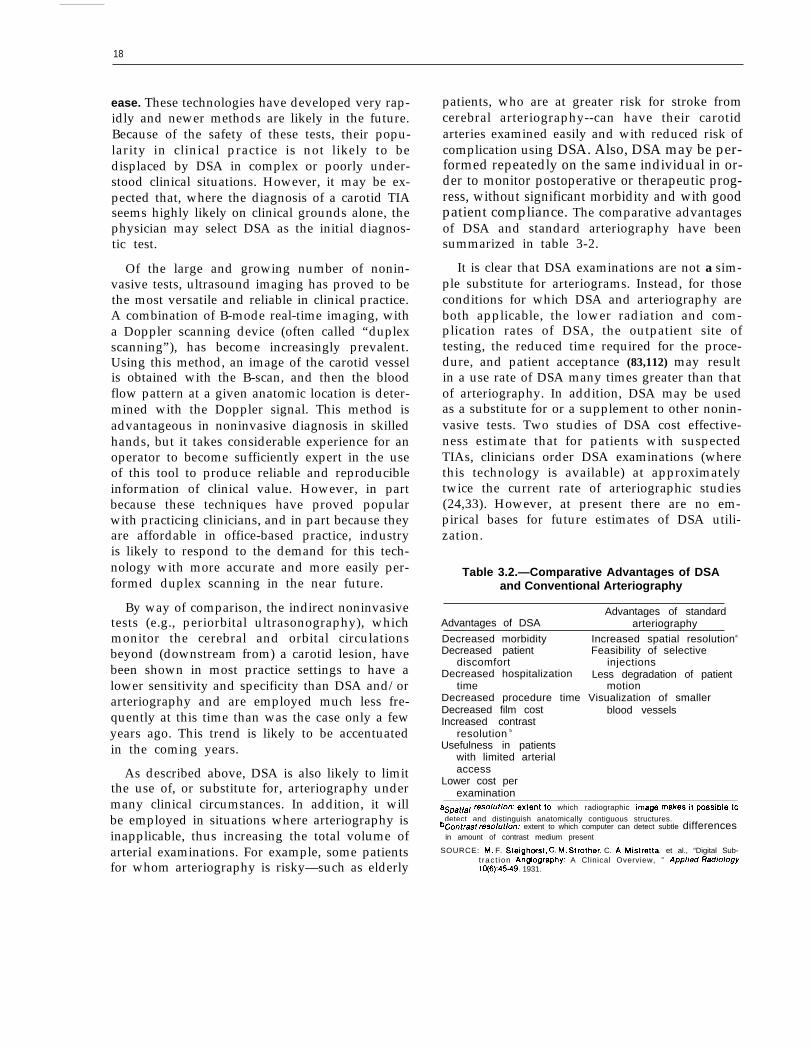
patients, who are at greater risk for stroke fromcerebral arteriography--can have their carotidarteries examined easily and with reduced risk ofcomplication using DSA. Also, DSA may be per-formed repeatedly on the same individual in or-der to monitor postoperative or therapeutic prog-ress, without significant morbidity and with goodpatient compliance. The comparative advantagesof DSA and standard arteriography have beensummarized in table 3-2.
It is clear that DSA examinations are not a sim-ple substitute for arteriograms. Instead, for thoseconditions for which DSA and arteriography areboth applicable, the lower radiation and com-plication rates of DSA, the outpatient site oftesting, the reduced time required for the proce-dure, and patient acceptance (83,112) may resultin a use rate of DSA many times greater than thatof arteriography. In addition, DSA may be usedas a substitute for or a supplement to other nonin-vasive tests. Two studies of DSA cost effective-ness estimate that for patients with suspectedTIAs, clinicians order DSA examinations (wherethis technology is available) at approximatelytwice the current rate of arteriographic studies(24,33). However, at present there are no em-pirical bases for future estimates of DSA utili-zation.
Table 3.2.—Comparative Advantages of DSAand Conventional Arteriography
Advantages of standardAdvantages of DSA arteriography
Decreased morbidity Increased spatial resolutiona
Decreased patient Feasibility of selectivediscomfort injections
Decreased hospitalization Less degradation of patienttime motion
Decreased procedure time Visualization of smallerDecreased film cost blood vesselsIncreased contrast
resolution b
Usefulness in patientswith limited arterialaccess
Lower cost perexamination
asPafjal ~e~olut~on: extent to which radiographic image makes it possible todetect and distinguish anatomically contiguous structures.
bcontrast reso/u//on: extent to which computer can detect subtle differencesin amount of contrast medium present
SOURCE: M. F. Steighorst, C. M. Strother, C. A. Mistretta, et al., “Digital Sub-t rac t ion Arrgiography: A Clinical Overview, ” Applied F?adlo/ogy10(6):45-49, 1931.

19
CLINICAL EFFICACY AND EFFECTIVENESS OF DSAThe claimed advantages and disadvantages of
DSA derive, in large part, from the efficacy andsafety of the technology. A substantial volumeof evidence regarding the efficacy and safety ofDSA is now available through clinical testing ofDSA in several medical centers.
Banta and Behney (8) define technological ef-ficacy as “the probability of benefit to individualsin a defined population from a medical technol-ogy applied for a given medical problem underideal conditions of use” (emphasis added). Effec-tiveness is the probability of benefit under aver-age conditions of use. The literature to date onDSA generally addresses clinical efficacy andsafety, not effectiveness. Most studies have beenconducted in institutions engaged in clinical re-search under carefully monitored conditions (21).An exception is the experience documented atScottsdale Memorial Hospital in Arizona (63). Itis not clear whether experimental and early clini-cal data from academic medical centers, such asthe Universities of Wisconsin and Arizona—eachwith several years of pioneering experience inDSA use—can be employed reliably to predict theeffectiveness and safety of DSA by radiologistsand clinicians in community hospitals, clinics, andgroup practices and the resulting patterns of DSAuse.
Measurement of the efficacy of DSA is multi-dimensional, as depicted in table 3-3 (adapted
from Fryback [38]), because benefits can bediscerned at the levels of: 1) physical image; 2)the detection, accuracy, and sensitivity of tests;3) diagnostic decisionmaking; 4) therapeutic deci-sionmaking (or “management efficacy”); 5) pa-tient outcome; and 6) social utility (38). Implicitin this scheme is the belief that increasing diag-nostic accuracy is not an end in itself, but ratheran instrumental value. The overall efficacy ofDSA, then, lies in its contributions to better pa-tient outcomes and ultimately to improved socialwelfare (31,38),
Most of the clinical evaluations of DSA havetaken place at levels 1 and 2 of the Fryback model,namely, with a focus on image quality or on diag-nostic sensitivity, specificity, and accuracy. “Sen-sitivity” may be defined as the proportion ofpositive tests in all patients with disease; “speci-ficity” is the proportion of all negative tests in pa-tients without disease; and “accuracy” is the ratioof correct diagnoses to all diagnoses.
Investigations of the efficacy of DSA have notyet concentrated on the effects of DSA through-out the medical care system. The literature gen-erally does not address differences in physiciandiagnosis, selection of treatment alternatives, pa-tient outcomes, or social welfare attributable toDSA. The majority of studies consider the ac-curacy of DSA for diagnosis in comparison toother diagnostic techniques, usually conventional
Table 3-3.—Levels At Which Diagnostic Technologies May Be Assessed
Level of the measurement Typical output measures
Level 1: Image efficacy . . . . . . . . . . .
Level 2: Image andobserver efficacy . . . . . . . . . . . . . . .
Level 3: Diagnostic efficacy . . . . . . .
Level 4: Management efficacy(therapeutic decisionmaking) . . . .
Level 5: Patient outcome efficacy . .
Level 6: Societal efficacy
quality of image resolution
percentage yield of abnormal cases; percentagecorrect diagnoses; sensitivity; specificity
change in order of clinician’s diagnosticconsiderations
percentage change in therapeutic protocol;percentage change to appropriate therapy
survival rates; percentage cures; morbidity measures;reduced worry of patient and family
(or utility) . . . . . . . . . .’. . . . . . . . . . . dollars added to GNP; age-adjusted survival ratesSOURCE: Off Ice of Technology Assessment, Adapted from D G, Fry back, “A Conceptual Model for Output Measures in Cost.
Effectiveness Evaluation of Diagnostic Imaging, ” paper presented at the Symposium International de EvaluationCout. Eff!caclte en Neuroradiologie, Bordeaux, France, May 14.15, 1982.
20
arteriography. For images of good diagnostic ing the scan procedure. The quality of images canquality (approximately 85 percent), the sensitivity be affected by swallowing, breathing, peristalsis(95 percent), specificity (99 percent), and accuracy (movement of esophagus), or other physical mo-(97 percent) of DSA appear to be very good tions, depending on the vessels to be visualized(19,112). (112). Other causes of failure are inadequate ve-
in general, the principal reason for inadequatenous access, leakage of dye, and faulty injection.
visual resolution is movement of the patient dur-
THE SAFETY (ASSOCIATED PATlENT RISKS) OF DSA
OTA defines the “safety” of a medical technol-ogy to be:
. . . the judgment of the acceptability of relativerisk in a specified situation;
while “risk” is defined as:
. . . the probability of an adverse or untowardoutcome occurring and the severity of the resul-tant harm to health of individuals in a definedpopulation associated with use of a medical tech-nology applied for a given medical problemunder specified conditions for use (8).
Using these definitions, the safety of DSA maybe measured and compared to the present meth-ods of diagnostic imaging for vascular diseases.As noted by Patterson (81), the efficacy and safetyof neurosurgical and related technologies are onlyestimated informally, because of measurement dif-ficulties, different conditions of use, and the ex-perimental nature of some technologies. This ap-pears to be the case for DSA. There are norigorous epidemiological or randomized clinicalstudies that document either the direct or indirectsafety effects. This seems to be due to the fact that
most clinicians are impressed with the apparentlow risk of DSA relative to benefit, as comparedwith alternatives.
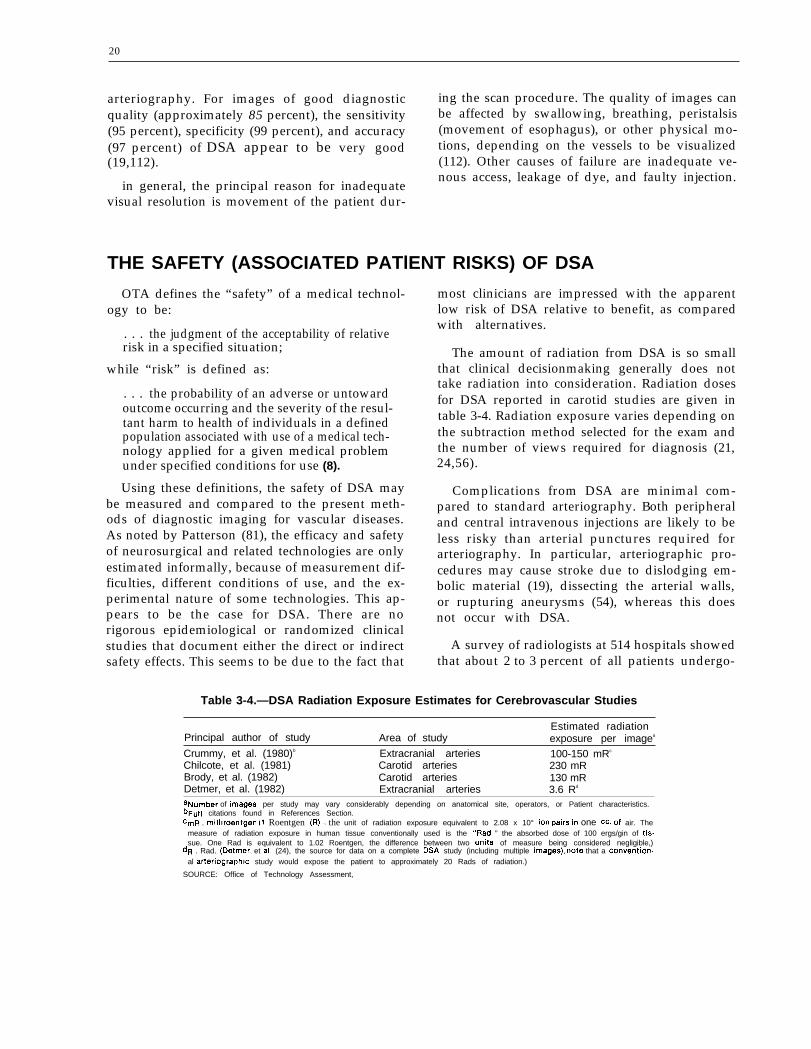
The amount of radiation from DSA is so smallthat clinical decisionmaking generally does nottake radiation into consideration. Radiation dosesfor DSA reported in carotid studies are given intable 3-4. Radiation exposure varies depending onthe subtraction method selected for the exam andthe number of views required for diagnosis (21,24,56).
Complications from DSA are minimal com-pared to standard arteriography. Both peripheraland central intravenous injections are likely to beless risky than arterial punctures required forarteriography. In particular, arteriographic pro-cedures may cause stroke due to dislodging em-bolic material (19), dissecting the arterial walls,or rupturing aneurysms (54), whereas this doesnot occur with DSA.
A survey of radiologists at 514 hospitals showedthat about 2 to 3 percent of all patients undergo-
Table 3-4.—DSA Radiation Exposure Estimates for Cerebrovascular Studies
Estimated radiationPrincipal author of study Area of study exposure per imagea
Crummy, et al. (1980)b Extracranial arteries 100-150 mRc
Chilcote, et al. (1981) Carotid arteries 230 mRBrody, et al. (1982) Carotid arteries 130 mRDetmer, et al. (1982) Extracranial arteries 3.6 Rd
aNurnber of images per study may vary considerably depending on anatomical site, operators, or Patient characteristics.bFull citations found in References Section.cmR . milliroentgen (I Roentgen (R) = the unit of radiation exposure equivalent to 2.08 x 10° iOfI pairs in one cc. of air. The
measure of radiation exposure in human tissue conventionally used is the “Rad, ” the absorbed dose of 100 ergs/gin of tis.sue. One Rad is equivalent to 1.02 Roentgen, the difference between two units of measure being considered negligible,)
dR . Rad. (Detmer, et ai, (24), the source for data on a complete DSA study (including multiple ima9eS), note that a convention-al arteriographic study would expose the patient to approximately 20 Rads of radiation.)
SOURCE: Office of Technology Assessment,
.
21
ing a total of 118,591 arteriographic exams—transfemoral, transaxillary, translumbar—suf-fered complications which required additionaltherapy or prolonged the patient’s hospital stay(54). These complications included 30 deaths (0.03percent of all exams). Another study indicatedthat of 1,328 patients who were suspected of hav-ing TIAs and had arteriograms, 13 percent hadtemporary complications and 0.65 percent suf-fered permanent neurological complications (102).Johnson (56) concludes that:
“(t)he complexity, expense, and a certain mor-bidity and mortality associated with this radio-graphic procedure [arteriography] compel a setof indications virtually as strict as that for sur-gery.”
Certain complications can arise in DSA examsdue to leakage of contrast medium outside thevein, venous reflux (contrast medium going intovein the wrong direction), or patient reaction to
the contrast medium (21,57,108,112). Variousclinical studies have documented only a smallnumber of such problems—all were transient—of several thousand patients examined (19,21,57,112).
The safety as well as the clinical efficacy of DSAwill depend to a considerable extent on the qualityof the particular equipment being used (a factorwhich also affects diagnostic accuracy and speci-ficity); the compatibility of new DSA equipmentwith existing facilities; the techniques used; andthe experience of the physicians and allied healthpersonnel performing and interpreting these diag-nostic images. Several investigators have notedsome variability in imaging capabilities of DSAunder different technical conditions and haveevaluated the physical requirements of the imag-ing systems with regard to assuring high qualitystandards (6,67).

4.The Costs of Digital
Subtraction Angiography

4 .The Costs of Digital
Subtraction Angiography
The costs of acquiring digital subtraction angi- many forms. This chapter attempts to summarizeography (DSA), building or modifying an existing existing experience with respect to the costs ofphysical facility to house the equipment, and ini- DSA in the United States.tiating the service in an operational mode are of
PURCHASE AND UTILIZATION COSTS
A technology such as DSA requires both capi-tal and operating expenditures. Capital outlaysare necessary in most instances for the equipmentitself and for the physical space within which tooperate the equipment. Unfortunately, it is diffi-cult to estimate the rate of amortization of DSAequipment at this stage in the development andimplementation of the technology.
Freedman (33) estimated that the investment ina DSA computer, X-ray equipment, and room willrange from $400,000 to $800,000. The costs a hos-pital or clinic may incur depend on whether theradiographic/fluoroscopic equipment is alreadypresent. If so, most hospitals can add a digitalcomputer to their radiography rooms for an aver-age cost of $250,000. The price range for these“add-on” systems in January 1982 was $135,000to $350,000 (61). In the future, considerable sav-ings are expected from combining the data proc-essing and storage requirements of the variouskinds of computer-assisted radiographic tech-niques, such as the use of a single computer toretrieve and store information from more than oneDSA machine (1,29).
Operating costs include fixed personnel costsand variable supply costs. Personnel costs, al-though fixed for a given facility, vary consid-erably among facilities depending both on the fa-cility’s caseload and the configuration of DSA inrelation to other radiologic technologies. For ex-ample, a physician is required to be physicallypresent in or around a DSA unit to supervise theinjection of the contrast agent, but this physician
can also service a second adjacent room whereanother DSA or computed tomography (CT) scanunit is operating. There are circumstances wherea physician could supervise a third room as well,possibly a room equipped with a real-time ultra-sound unit. 1 Thus, a rotating physician can ef-fectively supervise several radiological proceduresin different, but adjacent, rooms simultaneously,therefore reducing the fixed personnel costs of allof these procedures.
With a caseload of six to eight cases per day(1,500 to 2,000 annually), it is commonly esti-mated that two full-time technicians (requiring atotal of $50,000 in salary and fringe benefits an-nually) will be required to operate a DSA effi-ciently (33). A secretary is required to make ap-pointments, complete insurance forms, and toperform other activities. Because this secretary islikely to participate in other activities, such asscheduling patients for other radiologic examina-tions, this fixed personnel cost is factored into amiscellaneous category (of about $50,000 an-nually) which includes insurance, administrativecosts, utilities, etc.
Supply costs were estimated in 1982 to aver-age approximately $100 per DSA examination,allowing for 20 percent waste and repeating thestudy (33). Since that time, special DSA proce-dure kits have been developed which cost approx-imately $60 each. Allowing for a 10 percent wastefactor, current supply costs should range between
‘See ch. 2 for a description of real-time ultrasound.
25

26
$65 to $75 per case. Some variation in costs isassociated with the way in which the contrastmedium is injected. A peripheral injection usu-ally requires a supply cost of approximately $80per case; when the catheter is placed in thesuperior or inferior vena cava, these costs are ap-proximately $100. Among the more expensiveitems that contribute to variable costs are the cath-eter ($18), floppy disk for the computer ($10), andthe contrast agent (150 cc. at $15) (33).
It is useful to summarize these cost data by wayof a breakeven analysis. If it is assumed thatvariable (supply) costs are $80 per case (with
PATlENT COSTS AND CHARGES
The total expenditures associated with perform-ing a procedure such as DSA also include institu-tional and professional charges billed to the pa-tient or the insurance carrier. Reports of billedcharges in the literature (24,33,61) average be-tween $175 and $300 for institutional providers.These figures incorporate fixed overhead costs,variable supply costs, and the volume of DSAprocedures performed. As the volume increases,the cost per procedure may decrease, although theactual charges to the patient may not.
On a national level, third-party insurer re-sponses to DSA are difficult to summarize. As anexample, however, in 1983 physicians and hos-pitals in New Jersey were paid at the rate of $500per DSA examination. The basis on which thisfigure was determined is not clear, but informalconversations with individuals directly involvedwith setting the charge suggest that the figure wasderived by examining the costs of inpatient arte-
IMPLICIT AND INTANGIBLE COSTS
peripheral injection of contrast agent), and thereis a caseload of eight patients per day, 250 daysper year, the total variable costs would be$160,000 per year. If this figure is added to an an-nual fixed cost of $400,000, a figure within therange of actual experience in late 1982 (33), thetotal annual costs of operating a DSA unit on aper case basis can then be calculated. Using thesefigures, one can estimate a total annual cost of$560,000 assuming a total of 250 working daysper year. With an annual caseload of 2,000 pa-tients (250 days X 8 patients per day), this yieldsa breakeven cost of $280 per case.
riography, a more expensive procedure that pro-duces similar information. Detmer and colleagues(24) assumed a charge of $1,120 for inpatientarteriography in their study, including the costof hospitalization and professional fees. In NewJersey, however, the arteriography charge appearsto be substantially higher, perhaps in the neigh-borhood of $2,300 per arteriogram.
Despite the seemingly arbitrary current ratesof DSA reimbursement, it is clear that third-partypayers view DSA as a potential cost-saving tool.Not only does DSA eliminate the necessity forhospitalization of the patient, but there is the pos-sibility that with time and experience, as well asfurther technological advances, this procedure willsubstantially replace a large portion of the cur-rent demand for inpatient cerebrovascular arteri-ography. A reduction in inpatient arteriographywill lead to overall lower costs for each patientexamined.
The costs as delineated above are likely to Another significant problem with this type ofchange. Thus, a long-range evaluation of the cost evaluation is that the future level of use of con-effectiveness of DSA as compared to alternative ventional arteriography is uncertain. Currently,imaging technologies is very difficult. This is an arteriography is available in most U.S. hospitals.inherent problem of evaluating the costs and ben- If DSA substantially reduces the need for arteri-efits of an evolving technology. ography, as is contemplated, the costs of main-

27
taining the fixed arteriography facilities will rap-idly increase on a per-arteriogram basis. Theseunit cost increases may be partially offset by theintegration of DSA and arteriography units, orby the closure and consolidation of arteriographicfacilities among inpatient care institutions. Theadoption of Medicare’s diagnosis-related group(DRG) and other prospective payment systems islikely to further stimulate this consolidationprocess.
On the other hand, arteriography use may re-main high despite the widespread introduction ofDSA. The digital subtraction processes used in in-travenous DSA are now being applied to conven-tional arterial studies; the improvements in com-puter data processing and image quality mayallow the study of previously inaccessible vascularstructures. Thus, a prospective cost analysis can-not treat arteriography as a “steady-state” tech-nology, nor its current level of utilization as astable pattern. The cost-effectiveness analysis of
DIFFUSION AND SOCIAL COSTS
Diffusion of a technology may lower per pro-cedure expenditures, depending on economies ofscale in production and further innovations of thetechnology. Similarly, the per procedure costs ofDSA may decrease in association with its increasein availability. This could further result in reduc-tion of the economic and social impact of stroke(3,103).
However, technology diffusion also has the po-tential for enormous aggregate costs as well assavings. Any assessment of DSA must considernot only how the costs of DSA compare witharteriography, but the extent to which DSA leadsto increases in the total volume of diagnosticstudies performed. Thus, the evaluation of theeconomic impact of DSA should include thechange in expenditures per examination as wellas the increase (or decrease) in total examinationsperformed.
It seems certain that the demand for DSA tech-nology by many clinical specialists will be veryhigh. Neurosurgeons, cardiologists, vascular sur-geons, neurologists, and other physicians will
DSA in chapter 5 incorporates flexible levels ofarteriography use to reflect this uncertainty.
The costs of DSA equipment may change dra-matically as well. Presumably, the high costs ofresearch and development (R&D) are incorpo-rated into the early models. These R&D costsshould decrease over time, and with economiesof scale in production, lower the cost, and hencethe price, of the equipment. One possible offset-ting factor, though, is that manufacturers maybeable to make continual qualitative improvementsin the technology and thereby maintain a highprice. If present equipment becomes obsolete, thiswill stimulate either the purchase of new equip-ment before the existing units are fully depreciatedor the upgrading of existing equipment throughthe purchase of additional components. It is likelythat DSA is not yet a mature technology—eitherin technical development or in its medical appli-cations—and will experience significant changessimilar to the CT scan in years ahead.
make frequent use of DSA. Also, general practi-tioners and family physicians learn of diagnosticimaging breakthroughs in primary care journals(29) and may refer their patients for those imag-ing studies.
If diffusion of DSA is unconstrained, utiliza-tion of DSA will undergo rapid growth. This willoccur because: 1) the lower complexity and risksof DSA will make it useful for large numbers ofpatients who would not ordinarily undergo arteri-ography; 2) the applications of DSA are increas-ing; 3) the numbers of specialists who would useDSA (and are being trained in its use) are grow-ing, and they are more widely dispersed geo-graphically; and 4) the ambulatory nature of DSAmakes it available to a greater number and vari-ety of health care institutions, including grouppractices, multispecialty clinics, and hospitals.
Restraints on the diffusion of DSA can comefrom at least two sources, health planning agen-cies and third-party payers for medical care. A1980 OTA study found that health planners wereprimarily oriented toward health “needs,” usually
28
consider only capital costs, and never explicitlyweigh costs and benefits in certificate-of-need rec-ommendations (as reported in 8). The economic(or political) reason for this behavior is that thereis no mechanism for effecting a direct budget con-straint in the health planning process (8). It istherefore disadvantageous for a local agency todeny specified medical needs and benefits whenthe costs of adopting the new technology arespread throughout the insurance system.
Similarly, the enthusiasm of technology man-ufacturers, providers, and insured patients for theexpanded use of DSA is not likely to be offset bythe reimbursement procedures of third-party pay-ers. Medicare and Blue Cross/Blue Shield, as ex-amples, make coverage decisions based on: 1) ef-ficacy, 2) safety, 3) state of development, and 4)acceptance by the medical community (8,44,51).Billed charges are not a criterion for decidingwhether to cover a new procedure. Charges be-come relevant only with respect to decisions re-garding the level of payment.
Since fee schedules generally reward the use oftechnology-intensive services (68), “it may be
more advantageous to a physician to order andread diagnostic tests than to expend the time hespends with a patient performing a physical ex-amination” (23). It has been demonstrated thata physician can triple his/her income merely byordering a higher volume of tests for the samenumber of patients (93).
Greenberg and Derzon (44) note these and otherdifficulties with medical payment policies, and of-fer four general options: 1) restrict coverage of“unproven” procedures, presumably those whoseefficacy has not been demonstrated in controlled,randomized clinical trials; 2) introduce cost effec-tiveness criteria; 3) educate physicians in appro-priate uses of technology; and 4) educate con-sumers. The introduction of these criteria forinsurance coverage, particularly cost effectiveness,is not likely to have a substantial impact by itself(8). For reasons already stated, there are strongforces operating against the control of technol-ogy development and diffusion in the case ofDSA.

5.The Cost Effectiveness of
Digital Subtraction Angiography
5.The Cost Effectiveness of
Digital Subtraction Angiography
The final objective of a thorough cost andquality assessment of any new medical technol-ogy is to ascertain the degree of relationship be-tween the incremental costs of the new procedureand the extent to which the prevention and/ortreatment (cure) of the relevant diseases hasoccurred or is likely to occur. In this case studyof digital subtraction angiography (DSA), thefocus of inquiry is somewhat more limited. Al-though it would be ideal to be able to compareall technologies of all types relevant to cerebro-vascular disease on the basis of their contributionto improvements in patient morbidity, mortality,disability, longevity, and productivity, the infor-mation needed for such an analysis simply doesnot exist. Thus, the conventional approach to cost
REVIEW OF EXISTING STUDIES OFCOST EFFECTIVENESS OF DSA
Two cost effectiveness studies of DSA havebeen performed (24,33). Each compared conven-tional arteriography with DSA in the evaluationof patients with transient ischemic attacks (TIAs).Freedman (33) limited his analysis to the cost ofstudies of the carotid arteries. The primary unitof analysis in both studies was the “cost per iden-tified lesion”; Detmer and colleagues (24) also in-cluded a measure of “radiation dose per lesionfound.” The key assumption, monetary values,and findings from each study are listed in table5-1.
In these studies, the population to be studiedwith DSA is assumed to be approximately twiceas large as the population currently examined witharteriography. These estimates are derived froma cooperative study of TIAs conducted in five aca-demic medical centers (102). Freedman (33) notesthat the incidence of TIAs reported in the coop-erative study appears to be low. He argues that
effectiveness analysis for a diagnostic imagingtechnology is to compare the “cost per procedure”and the “cost per lesion found” between the newtechnology and one or more existing technologies(24,33).
In the case of carotid artery disease, a “signifi-cant lesion” is usually defined as arterial stenosisof 50 percent or greater. This is the approachtaken in this analysis of the cost effectiveness ofDSA. In other words, this analysis seeks to meas-ure the “cost per unit of effectiveness” of DSA incomparison with conventional arteriography, acompeting alternative technology with commonobjectives (8). It also reviews the existing cost ef-fectiveness analyses.
THE
incidence can range up to four or five times thatlevel in a community with a large elderly popu-lation. It would appear, then, that the populationat risk has tremendous implications for the over-all costs of DSA imaging as a technological alter-native to conventional arteriography.
Yield rates (the numbers of lesions found perpopulation screened) are also widely variable,even for arteriography. Eisenberg and Nicklin (28)observed that abnormalities found in arteri-ographic studies ranged from 22-42 percent to 100percent for TIA patients. This variability is dueto the inclusion or exclusion of ulcerative lesions,differences in the populations screened, local dif-ferences in patterns of practice in certain medicalspecialties, and whether the findings were reportedin the clinical or radiological literature. Detmerand colleagues (24) base their estimated yield of75 percent for arteriography on the actual yieldof that technology at the University of Wiscon-
31

32
Table 5-1 .—Data Used for Cost-Effectiveness Analysis of DSA
Assumptions Detmer, et al. (1982)a Freedman (1982)a
1.
II.
Ill.
Iv.
Patient populationA. Definite TIAs . .B. Possible TIAs. .
Yield rates:A. DSA . . . . . . . . . .
B. Arteriography . .
Cost/procedure:A. DSA . . . . . . . . . .B. Arteriography . .
examined:. . . . . . . . . . . . . . . . . . . . . . . 8.4 TIAs/100 beds. . . . . . . . . . . . . . . . . . . . . . . 17.4 TIAs/100 beds
. . . . . . . . . . . . . . . . . . . . . . . High = 75 percentLow = 25 percent
. . . . . . . . . . . . . . . . . . . . . . . High = 75 percentLow = 25 percent
. . . . . . . . . . . . . . . . . . . . . . . $ 225
. . . . . . . . . . . . . . . . . . . . . . . $1,120
Cost effectiveness (cost/lesion found)Population
5.4 TIAs/100 beds16.8 TIAs/100 beds
High = 80 percentLow = 40 percentHigh = 80 percentLow = 40 percent
$ 500$1,200
examined
Screening protocols Low HighA.B.
c.
D.
Arteriography only . . . . . . . . . . . . . . . . . . . . $1,492DSA followed by arteriography if DSA ispositive. . . . . . . . . . . . . . . . . . . . . . . . . . . . . . $1,438 $1,590DSA, followed by arteriography in only 50percent of positive DSA exams as aconfirmatory measure . . . . . . . . . . . . . . . . . $ 936 $1,065(1) DSA, followed by arteriography in only
10 percent of positive DSA exams(Freedman) . . . . . . . . . . . . . . . . . . . . . . . . –
(2) DSA, followed by arteriography in only5 percent positive DSA exams(Detmer. et al.) . . . . . . . . . . . . . . . . . . . . . $ 376 $ 512
Low High$1,500
$1,825 $2,033
$1,225 $1,433
$ 775 $ 950
—aFull citations found in References Section.
SOURCE Office of Technology Assessment
sin Hospital; they assume that DSA accuracy isequal to that figure (adjusted for a 5-percent rateof technical failure of DSA). Detmer and his col-leagues (24) noted, however, that DSA does notcurrently approach that level of accuracy forulcerative lesions. The generalizability of this rateis quite limited, and the estimated yield rates forDSA means that the Detmer and the Freedmanstudies must be carefully interpreted. The sameconditions will limit the accuracy of this cost ef-fectiveness analysis of DSA in the diagnosis ofcerebrovascular disease.
The validity of the estimated costs of DSA andarteriography are also subject to scrutiny. Detmerand colleagues (24) present no cost findings at all,but simply list the billed charges for these proce-
dures at the University of Wisconsin Hospital.Further, costs in their analysis do not include pro-fessional fees (approximately $150) (33). Freed-man (33) does not provide detailed estimates ofthe fixed and variable costs of DSA imaging, butonly gives “point estimates, ” rather than ranges,of cost effectiveness.
Interpretation of these studies is further com-plicated by the fact that the estimates are derivedfrom operational costs in two large and innova-tive radiology practices, one of which is part ofan academic medical center. These practices mayreflect a very different cost experience from com-munity hospitals and ambulatory sites, particu-larly with respect to the allocation of overheadcosts.

33
NEW TECHNOLOGY AND PATTERNS OF MEDICAL PRACTICE:CRITICAL ASSUMPTIONS UNDERLYING AN ANALYSIS OFCOST EFFECTIVENESS
In order to investigate the cost effectiveness ofa new diagnostic tool such as DSA, it is impor-tant to attempt to understand its potential rolein the care of patients with TIAs or patients whomay have had a completed stroke. It is essentialthat predicted changes in the process of health caredelivery and its outcome be identified. Thus, acost effectiveness analysis of DSA should proceedfrom a conceptual model of how this technologywill “fit” with existing technologies and patternsof practice relevant to the disease(s) of focal in-terest.
The hypothesis made in this case study of theimpact of DSA on existing patterns of medicalpractice and technology use in the diagnosis andtreatment of cerebrovascular disease is illustratedin figures 5-1 and 5-2. Prior to the introductionof DSA, as figure 5-1 depicts, the physician whoencountered a patient with a TIA or a stroke hadseveral diagnostic procedural options to consider.For a number of reasons, the physician may havedecided that no tests were indicated, perhaps be-cause of coexistent medical problems that madeinvasive testing and surgical therapy unwar-ranted. In other circumstances, the physician mayhave moved to noninvasive testing followed byarteriography, or arteriography could have beenemployed as the initial test. The interplay of tech-nologies illustrated in figure 5-1 is based on threeimportant assumptions:
1. No surgical therapy is currently performedwithout arteriography.
2. Arteriography maybe the initial diagnostictest.
3. Arteriography may be the only diagnostictest.
A possible fourth assumption, and one that iscertainly true in many medical centers, is thatradiologists and other physicians are reluctant toundertake tests with significant morbidity risks(e.g., arteriography) without the opinion of aneurologist to determine that the patient’s symp-toms are due to TIA and therefore warrant theuse of arteriography and/or surgical therapy.
Figure 5-1.— Clinical Alternatives WithoutDSA Available
TIA
SOURCE: Off Ice of Technology Assessment
TIA
therapy therapy therapy
SOURCE: Office of Technology Assessment.
As DSA becomes increasingly available, thepatterns of care associated with TIA are likely toundergo significant changes. It may be hypothe-sized that arteriography will less often be the ini-tial diagnostic test, even in the case of patientswith a history of definite TIA. As indicated in fig-ure 5-2, DSA may become the initial test ofchoice, or it may follow noninvasive testing ofother types. On the output side, DSA maybe thefinal test before medical or surgical therapy, orit may lead to arteriography prior to medical/sur-gical intervention. The important assumptionsunderlying the hypothesized patterns of patientcare diagramed in figure 5-2 are:
1. The sensitivity and specificity of DSA aregenerally much greater than for other non-invasive procedures under ordinary condi-tions of use.
34
2.
3.
4.
The accuracy of DSA is somewhat less thanarteriography, but DSA is much safer andless uncomfortable for the patient.Arteriography is almost never performed(except in certain academic medical centers)without prior DSA examination, where thelatter test is readily available.Surgery may be undertaken without arteri-ography in selected cases.
Support for some of these assumptions is pro-vided by Little and colleagues (65):
In a previous study (19), . . . there was ex-cellent correlation between the conventionalangiogram and the intravenous [DSA] when thecarotid bifurcation was well visualized (i.e., sen-sitivity, 95 percent; specificity, 99 percent; ac-curacy, 97 percent). When the carotid bifurca-tion was not well visualized by intravenous[DSA], there was a substantial chance of mis-interpretation of the study results. The mostcommon cause of misregistration was the pa-tient’s swallowing. Overall, the intravenousdigital subtraction angiogram was found to ac-curately demonstrate the carotid bifurcations in71 percent of the arteries evaluated. In the pres-ent study, 96 percent of the carotid bifurcationswere adequately visualized.
Although conventional angiography was usu-ally recommended in patients treated surgically,intravenous [DSA] obviated the need for con-ventional studies in the evaluation of many pa-tients. Some patients having extracranial and in-tracranial studies underwent carotid arterysurgery without the need for further investi-gations.
The sponsors of the first outpatient ambulatoryneurodiagnostic center in the State of New Jerseyindicate anecdotally (45) that DSA has proven tobe a significant advance in the evaluation of pa-tients with cerebrovascular disease. According toMichael L. Gruber, M. D., a neurologist with thisgroup:
. . . Our experience indicates that of those pa-tients who have surgically amenable abnormal-ities of the carotid bifurcations, no further studiesare indicated in the majority (approximately 80percent). In other words, the surgeon will oper-ate on the basis of the digital subtraction angio-gram. In the other 20 percent of cases, furtherstudy is required . . . because of technical prob-lems with the DSA; because (the test revealed)
total occlusion on the DSA; (in such cases the)standard procedure is to follow this with a con-ventional angiogram; and lastly the reluctanceon the part of some surgeons to accept this newmodality of investigation (45).
As a further indication of the extent to whichDSA may substitute for conventional angiographyas the diagnostic test establishing the need forcarotid artery surgical therapy, Little and col-leagues (64) summarized the experience with DSAat the Cleveland Clinic:
DSA examinations frequently obviated theneed for conventional angiography. Some pa-tients having satisfactory extracranial and in-tracranial studies underwent carotid endarter-ectomy without further contrast studies. Thenumber of patients undergoing carotid surgerywithout conventional arteriography continues toincrease.
Because DSA has not yet gained widespread useas a diagnostic procedure, the data do not existby which to accurately predict the patterns of usewhich will develop for the diagnosis and treat-ment of cerebrovascular disease. It is possible,however, to speculate on some of the ways inwhich DSA might be used, given current patternsof practice in disciplines such as neurology andprimary care specialities. The following six as-sumptions are made as the basis of a cost effec-tiveness analysis of DSA:
1.
2.
The technical proficiency of DSA is expectedto rapidly improve as a result of the intensecompetition among the major imaging equip-ment manufacturers.
As the speed and spatial resolution of DSAstudies improve and the quality of ancillarytechnology improves, more and more pa-tients will have only a DSA procedure beforeundergoing cerebrovascular surgery.
Detmer and colleagues (24) estimated that if nomore than 5 percent of positive DSA examina-tions were followed by conventional arteriog-raphy for confirmation purposes, a savings of ap-proximately $1,100 per discovered lesion wouldresult.
3. It is unlikely that only one DSA study willbe performed per discovered lesion. It seemsmore likely that a minimum of two DSA ex-

35
aminations (one before and one after ther-apy) will become the pattern of care.
This would especially be the case for all surgicallytreated patients, since the postoperative DSA ex-amination would serve as a new “baseline” for thefuture. Among medically treated patients, it seemsreasonable to assume that many will receive re-peat examinations at yearly intervals to determinewhether the pathology has progressed and to learnwhether the stenosis of the carotid arteries has be-come more serious. Hence, only among patientswhere the DSA exam did not find a lesion can oneassume that a single examination will suffice.
4. The population of patients receiving DSA ex-aminations in the future is likely to be muchlarger than the current number who receivein-hospital arteriography.
Freedman (33), and Detmer and colleagues (24)both estimate the number of patients who will re-ceive DSA examinations as twice the number pres-ently having conventional arteriography. The1977 Cooperative Study of TIA (102) reported anaverage of 5,4 definite TIAs per 100 acute carebeds per year (the highest rate being 8.8 TIAs per100 beds per year). Freedman (33) and Detmer (24)assumed that 95 percent of the higher prevalenceestimate (or 8.5 per 100 beds) would receivearteriograms. Thus, previous studies and theirassumptions suggest that as many as 17.4 DSAexaminations per 100 acute care beds will be per-formed annually in U.S. hospitals.
Because DSA is an ambulatory care procedure,however, the “burden of illness” in the total pop-ulation may be a more reasonable guide for theestimation of potential utilization, rather than thefrequency of relevant diagnoses per 100 acute hos-pital beds. Available data (62) suggest that the in-cidence of TIA is 30 per 100,000 population peryear with an average episodic duration of 5 years,or a prevalence of 150 per 100,000. Physicians arelikely to “follow” patients with recurrent TIAswith repeated examinations, especially as the im-aging quality improves.
In addition, virtually all patients with a com-pleted stroke would likely receive a DSA exami-nation. The incidence of stroke is 150 per 100,000per year with an average duration of 4 years.
Since a completed stroke is considered to be a rela-tive contraindication for surgical intervention, fewsuch patients now receive arteriography unlesssubsequent TIAs occur, or the treating physicianfinds evidence that a major stroke might subse-quently occur after a minor stroke that has leftrelatively little intellectual and motor impairment.Since DSA is much safer than arteriography, itis assumed that many stroke patients will receivethis examination. A DSA exam following a strokemay help the physician determine prognosis forfamily counseling, even though relatively fewdemonstrated lesions in stroke patients will receivesurgical therapy.
If one assumes that 90 percent of new TIAs,70 percent of new strokes, 30 percent of old TIAs,and 10 percent of old strokes receive a DSA ex-amination annually, then 237 (27 + 105 + 45 +60) DSA examinations for carotid artery diseaseper 100,000 population would seem a reasonableestimate. This figure is much larger than one basedon hospital data from New Haven, Connecticut,that was estimated at 33 per 100,000 population(34).
5. The prevalence of asymptomatic extracranialocclusive vascular disease will further in-crease the volume of DSA procedures per-formed.
It has been estimated that in asymptomatic in-dividuals, there is a 22 percent prevalence ofarterial stenosis of the extracranial and major in-tracranial vasculature sufficiently severe to com-promise the arterial lumen by at least 50 percent(96,97). Many of these patients have abnormalclinical signs on examination, even though nosymptoms were present before the exam. Thesesigns include bruits (murmurs) audible througha stethoscope placed adjacent to a compromisedartery, diminished arterial pulsations, and an ab-normally low blood pressure recorded distal to(beyond) a stenotic vessel. Many of these patientswill likely receive a DSA examination, especiallyprior to administration of general anesthesia fora surgical procedure elsewhere in the body, be-cause of a concern that a stroke might occur dur-ing surgery even in the absence of prior symp-toms. Except under unusual circumstances (suchas prior to prolonged surgery) patients with

36
asymptomatic occlusive vascular disease do notnow receive arteriograms. With the ready avail-ability of a safe and effective diagnostic tool suchas DSA, many asymptomatic patients with ab-normal signs on clinical examination will likelyreceive a diagnostic evaluation. It appears to bea safe assumption that the indications for surgi-cal therapy may be expanded to include asymp-tomatic patients with severe stenosis discoveredby DSA examinations. This will result in an over-all increase in the number of surgically treatedlesions.
6. The increasing availability of DSA, its tech-nical quality and its extremely low morbid-ity will significantly alter the pathwaythrough which patients with TIA are evalu-ated and/or referred by primary care phy-sicians.
Because of the risk of complication associated withconventional arteriography and the relativelylarge radiation exposure (20 roentgens per exam-ination for arteriography vs. 3.6 for DSA), pa-tients are now carefully screened by their physi-cians before arteriography is scheduled. Thisscreening occurs in two ways: First, as shown infigure 5-1 above, preliminary noninvasive tests(e.g., ultrasonography) are often performed in or-der to reduce the likelihood of a “true negative”arteriographic examination. Most experienced cli-nicians prefer to screen all but the most urgentpatients before performing an arteriogram. Thus,patients for whom arteriography is the first andonly examination are a minority of those receiv-ing this examination.
Second, the screening process includes a neurol-ogist’s opinion that a patient’s symptoms are likely
QUANTITATIVE ESTIMATES OF THECOST EFFECTIVENESS OF DSA
to come from extracranial occlusive vascular dis-ease. Many primary care physicians diagnose TIAfor symptoms that necrologic specialists wouldplace in other categories. For example, dizzinessis a common symptom among the elderly, espe-cially when one first arises from a seated or lyingposition. Neurologists know that most dizzy pa-tients do not suffer the types of stroke that wouldsignal the occurrence of TIAs even if they havesymptoms of dizziness and vertigo (without othersymptoms and signs). Furthermore, symptoms inthe extremities may represent focal seizures(localized to one part of the body), and these maybe misdiagnosed as TIAs by the less experiencednon-neurologist. Many patients with acute con-fusional states, due to a variety of toxic andmetabolic causes, are also falsely labeled as hav-ing had TIAs. For these and other reasons, manyradiologists will not accept patients for arteri-ographic examinations of the extracranial vascula-ture unless a neurologist has been consulted.
It maybe hypothesized that DSA may signifi-cantly alter the pathway through which patientswith suspected cerebrovascular disease are man-aged. It is possible that both primary care physi-cians and radiologists may become convinced thatthe superior quality of DSA images and the lowermorbidity risk of the procedure itself can allowsome proportion of patients with suspected TIAto be managed without neurology specialty con-sultation. However, the American NeurologicalSociety strongly suggests that appropriate neuro-logical advice should be sought even in the moststraightforward of cases.
Measuring the cost effectiveness of DSA in the The data presented in the tables that follow rep-diagnosis of patients with carotid artery disease resent the variability in cost effectiveness whichis a complex task. Because several factors which can be expected in the operation of DSA underinfluence the acquisition, use, and efficacy of DSA different institutional and clinical circumstances.are variable, a range of costs must be incorporated These data are largely based on secondary infor-into the analysis. mation in previous studies of DSA (see principally
37
24,33). These studies provide important indicatorsof the specific cost parameters of DSA. Becausetheir methods are limited in scope, these studiesalso pose certain limitations for these analyses.
Estimates of the cost effectiveness of DSA re-ported in this case study are based on the pre-dicted patient charges necessary to cover the costsof operation of a DSA unit. The use of billedcharges in the calculation of cost effectiveness in-dicators does not identify the actual flow of re-sources (revenues) to the production of DSA ex-aminations, since patient or insurance paymentswill most likely fall below the level of billedcharges. The primary concern here, however, iscomparing the relative amount of outlays for aspecific set of medical procedures—the diagnos-tic imaging of carotid artery disease—as a newtechnology (DSA) is introduced into the field ofdiagnostic radiology. Since data on the costs ofconventional carotid arteriography are unavail-able in the literature, DSA charges have been esti-mated for comparison with charges for conven-tional arteriography reported by Freedman (33)and Detmer and colleagues (24).
Another issue is the appropriateness of the costeffectiveness indicators employed in this analy-sis. It may be argued that the indicator used inprior studies, cost per lesion found, is an in-complete measure of the costs of cerebrovasculardiagnosis. Because arteriograms are assumed tofollow only positive DSA tests, the costs of fur-ther diagnostic evaluation following negative DSAtests are missing.
Hypothetically, the costs associated with neg-ative DSA results may be of two kinds: 1) costsof arteriography or other testing ordered by con-servative clinicians who want to confirm the neg-ative DSA results, and 2) costs of patient disabilityor death due to false negative DSA tests, wherethe failure of DSA to show arterial disease pre-vented timely medical or surgical intervention.Realistically, technical improvements in DSA im-aging and physician experience with the technol-ogy should reduce followup testing of negativeDSA findings to insignificant levels. Indeed, it islikely that positive DSA exams will be a sufficientbasis for making decisions regarding surgical in-tervention (45,64,65). Furthermore, clinical tests
of DSA show that when a good (i. e., diagnos-tically useful) image is produced (approximately85 percent with an experienced radiologist), thesensitivity of the procedure is close to 95 percentin the examination of the carotid arteries (19). Inother words, only 5 percent of all patients withactual arterial disease will have a negative DSAfinding.
It is reasonable, therefore, to assume that nearlyall the costs of carotid artery imaging are incor-porated into the measures of “charges per lesionfound” and “charges per patient examined” as esti-mated in this case study. These measures are notideal, because they do not indicate the effective-ness of DSA in improving clinical therapy or pa-tient outcomes, but they do estimate an impor-tant unit of analysis, the cost of diagnosing carotidartery disease.
DSA charges must reflect: 1) fixed capital costsof the DSA equipment and facility; 2) semi-fixedcosts for radiological personnel, equipment main-tenance, administration, and utilities; 3) costs ofsupplies; and 4) professional fees. Total annualfixed costs are estimated by Freedman (33) to befrom $274,000 to $448,000. Table 5-2 shows thecharges which are necessary to cover the costs ofDSA operation at a volume of 1,500 and 2,000cases per year at several levels of fixed costs fora DSA facility.1 These charges range from $446to $648 per examination.
The most important determinants of the costeffectiveness of DSA, as calculated in tables 5-3through 5-7, are charges and yield rates for DSAexams and charges for arteriograms which maybe ordered to followup DSA findings. By vary-ing the values of these three parameters, it is pos-sible to conduct a sensitivity analysis of the costeffectiveness of DSA under various clinical andinstitutional patterns of operation.
Yield rates for DSA—the number of lesionsidentified per 100 DSA exams performed—arepredicted to reach 80 percent for the examinationof patients who previously would have receivedan arteriogram. This figure is comparable to the
‘This case study, following Freedman (33), assumes that patientrevenues will be approximately 80 percent of billed charges due tobad debts and cost-based reimbursements.
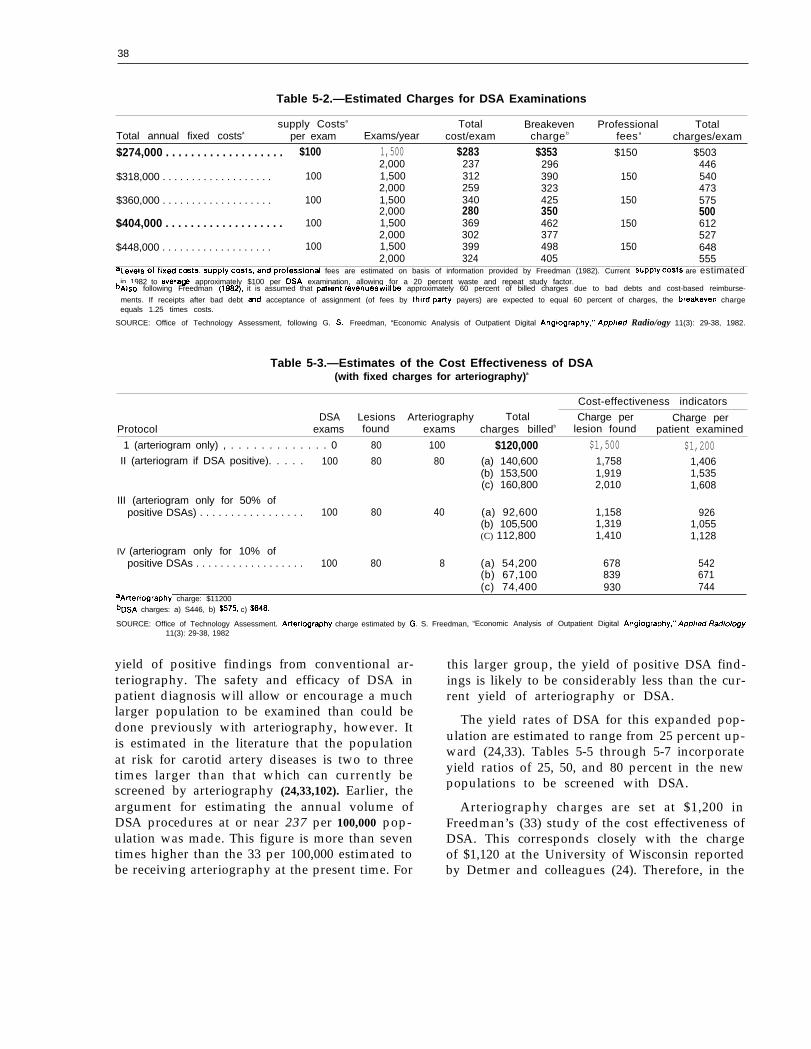
38
Table 5-2.—Estimated Charges for DSA Examinations
supply Costsa Total Breakeven Professional TotalTotal annual fixed costsa per exam Exams/year cost/exam charge b fees a charges/exam
$274,000 . . . . . . . . . . . . . . . . . . . $100 1,500 $283 $353 $150 $5032,000 237 296
$318,000 . . . . . . . . . . . . . . . . . . .446
100 1,500 312 390 150 5402,000 259 323 473
$360,000 . . . . . . . . . . . . . . . . . . . 100 1,500 340 425 150 5752,000
$404,000 . . . . . . . . . . . . . . . . . . .280 350 500
100 1,500 369 462 150 6122,000 302 377 527
$448,000 . . . . . . . . . . . . . . . . . . . 100 1,500 399 498 150 6482,000 324 405 555
aLe@S of fixed c~ts, supply costs, and profession~ fees are estimated on basis of information provided by Freedman (1982). Current SupPIY cOStS are estimatedin 1982 to avera@ approximately $100 per DSA examination, allowing for a 20 percent waste and repeat study factor.
bAlso following Freedman (1~), it is assumed that patient revenues will be approximately 60 percent of billed charges due to bad debts and cost-based reimburse-
ments. If receipts after bad debt md acceptance of assignment (of fees by third-pafiy payers) are expected to equal 60 percent of charges, the breakeven chargeequals 1.25 times costs.
SOURCE: Office of Technology Assessment, following G. S, Freedman, “Economic Analysis of Outpatient Digital Angiography,” App//ed Radio/ogy 11(3): 29-38, 1982.
Table 5-3.—Estimates of the Cost Effectiveness of DSA(with fixed charges for arteriography)a
Cost-effectiveness indicators
DSA Lesions Arteriography Total Charge per Charge perProtocol exams found exams charges billedb lesion found patient examined
1 (arteriogram only) , . . . . . . . . . . . . . 0 80 100 $120,000 $1,500 $1,200II (arteriogram if DSA positive). . . . . 100 80 80 (a) 140,600 1,758 1,406
(b) 153,500 1,919 1,535(c) 160,800 2,010 1,608
III (arteriogram only for 50% ofpositive DSAs) . . . . . . . . . . . . . . . . . 100 80 40 (a) 92,600 1,158 926
(b) 105,500 1,319 1,055(C) 112,800 1,410 1,128
IV (arteriogram only for 10% ofpositive DSAs . . . . . . . . . . . . . . . . . . 100 80 8 (a) 54,200 678 542
(b) 67,100 839 671(c) 74,400 930 744
~A~erlography charge: $11200bDSA charges: a) S446, b) $575, c) $648.
SOURCE: Office of Technology Assessment. Arteriography charge estimated by G. S. Freedman, “Economic Analysis of Outpatient Digital Angiography,” App/ied Radio/ogy11(3): 29-38, 1982
yield of positive findings from conventional ar-teriography. The safety and efficacy of DSA inpatient diagnosis will allow or encourage a muchlarger population to be examined than could bedone previously with arteriography, however. Itis estimated in the literature that the populationat risk for carotid artery diseases is two to threetimes larger than that which can currently bescreened by arteriography (24,33,102). Earlier, theargument for estimating the annual volume ofDSA procedures at or near 237 per 100,000 pop-ulation was made. This figure is more than seventimes higher than the 33 per 100,000 estimated tobe receiving arteriography at the present time. For
this larger group, the yield of positive DSA find-ings is likely to be considerably less than the cur-rent yield of arteriography or DSA.
The yield rates of DSA for this expanded pop-ulation are estimated to range from 25 percent up-ward (24,33). Tables 5-5 through 5-7 incorporateyield ratios of 25, 50, and 80 percent in the newpopulations to be screened with DSA.
Arteriography charges are set at $1,200 inFreedman’s (33) study of the cost effectiveness ofDSA. This corresponds closely with the chargeof $1,120 at the University of Wisconsin reportedby Detmer and colleagues (24). Therefore, in the

39
Table 5-4.—Estimates of the Cost Effectiveness of DSA(with variable charges for arteriography)a
Cost-effectivenessindicators
Total Charges ChargesDSA Lesions Arteriography Arteriography charges per lesion per patient
Protocol exams found exams charge billed b found examined
I (arteriogram only) . . . . . . . . . 0 80 100 $1,200 $120,000 $1,500 $1,200II (arteriogram if DSA
positive) . . . . . . . . . . . . . . . . . 100 80 80 1,232 (a) 143,160 1,790 1,432
Ill (arteriogram onlyof positive DSAs)
IV (arteriogram onlyof positive DSAs)
(b) 156,060 1,951 1,561(C) 163,360 2,042 1,634
for 50%. . . . . . . . . 100 80 40 1,306 (a) 96,840
(b) 109,740(c) 117,040
for 100/0. . . . . . . . . 100 80 8 1,379 (a) 55,632
(b) 68,532(C) 7 5 , 8 3 2
,211 968,372 ,097,463 ,170
695 556685
. , 758857948
aThe variable charges for arferiography reflect the following assumptions:1 Patient charges are set at a level such that actual patient receipts will just offset, or break even with, the costs of patient care at the current volume of procedures
If patient receipts, after bad debts and acceptance of assignment, average 60 percent of billed charges, then the estimated breakeven cost per arteriogram is $960(0.60 x $1200 current charge)
2 The cerebrovascular studies in which DSA may effectively replace arteriography represent about one-quarter of the current volume of arteriograms.3 Approximately 50 percent of the long-run costs of arieriographic facilities are fixedGiven these assumptions, the estimated breakeven charge per arteriogram at any new volume of arteriography is equal to”
Where the new volume of arteriography is equal to the current volume of arteriography minus one-quarter the percentage reduction in cerebrovascular arteriographydue to DSA substitution
bDSA charges a) $446, b)$575, c) $648
SOURCE: Office of Technology Assessment
calculations in tables 5-3 and 5-5, a fixed chargeof $1,200 for arteriograms is used in calculatingtotal imaging charges per patient examined andper lesion found.
It is reasonable to assume the DSA will replacea certain percentage of arteriography. As the vol-ume of arteriograms changes, the charges neces-sary to cover the fixed capacity of arteriographicfacilities must also vary. Fineberg (31) notes thatonly 5 to 15 percent of the costs of CT scanningare variable with volume, and variable costs ofDSA appear to range from 25 to 35 percent oftotal costs. For arteriography, high fixed costsmay be lowered considerably by the combinationof DSA and arteriographic facilities and person-nel. Thus, tables 5-4, 5-6, and 5-7 assume that 30percent of all costs of arteriography are fixed andcalculate the measures of cost effectiveness on the
basis of anticipated new (reduced) charges forarteriograms.
It should be noted that utilization of arteri-ography may not decrease in terms of the abso-lute numbers of examinations performed. The useof arteriography depends on the acceptance ofDSA by radiologists and clinicians as a substituteimaging procedure. Data in table 5-7 show thatif the population examined for carotid artery dis-ease expands to four times its current volume (i.e.,from 100 to 400 DSA exams), it is very likely thatthe demand for arteriography will rise (and its costper exam will fall). The clinical protocols devel-oped by Freedman (33) are used in tables 5-3through s-7 to estimate the “charges per lesionfound” and “charges per patient examined” asDSA is partially substituted for arteriography inthe diagnosis of carotid artery disease. At this time

40
Table 5-5.—Estimates of Cost Effectiveness of DSA for Expanded Population At Riska
With Variable Yield Rates for Positive Findings
Cost-effectivenessindicators
Total Charges ChargesDSA Lesions Arteriography charges
Protocol found bper lesion per patient
exams exams billed c found examinedII (arteriogram if DSA
positive) . . . . . . . . . . . . . . . . . 200 A. 160 160
200 B. 130 130
200 c. 105 105
Ill (arteriogram only for 50%of positive DSAs) . . . . . . . . . 200 A. 160 80
200 B. 130 65
200 c. 105 53
IV (arteriogram only for 10%of positive DSAs) . . . . . . . . . 200 A. 160 16
200 B. 130 13
200 c. 105 11
(a) $281,200(b) 307,000(C) 321,600
(a) 245,200(b) 271,000(C) 285,600
(a) 215,200(b) 241,000(C) 255,600
(a) 185,200(b) 211,000(C) 225,600
(a) 167,200(b) 193,000(C) 207,600
(a) 152,800(b) 178,600(C) 193,200
(a) 108,400(b) 134,200(C) 148,800
(a) 104,800(b) 130,600(C) 145,200
(a) 102,400(b) 128,200(C) 142,800
$1,7581,9192,0101,8862,0852,197
2,0502,2952,434
1,1581,3191,410
1,2861,4851,597
1,4551,7011,840
678839930
8061,0051,117
9751,2201,360
$1,4061,5351,608
1,2261,3551,428
1,0761,2051,278
9261,0551,128
836965
1,038764893966
542671744524653726
512641714
aAssumes the ~op~ation at risk which can &j safely studied will double in size (24). This is regarded as a minimum level of additional volume Of DSA procedures Performed.bDSA yield ratios:
(A) 60 percent (if volume of procedures is assumed at current level)(B) 50 percent(C) 25 percent (Yield ratios of those procedures beyond the current volume, e.g., 100 procedures in this example. Hence, yield ratios in (B) and (C) are calculated
at 60 percent for the first 100 procedures performed and at 50 percent and 25 percent, respectively, for all procedures performed beyond the initial 100,)CDSA charges: a) $446, b) $575, c) $648. Arterlography char9e: $11200
SOURCE: Office of Technology Assessment.
there is no simple level of substitution that seemsmost likely; instead, it appears that over time,substitution of DSA for arteriography will in- ●
crease, but with no predictable upper limit.
Because the patterns of clinical use of DSA aredifficult to predict, it is also difficult to estimateaccurately the cost effectiveness of this new tech- ,nology. Certain trends are evident from the datapresented in tables 5-3 through 5-7, however:
Ž As DSA substitutes for arteriography in thediagnosis of carotid artery disease, the cost
effectiveness of DSA increases, and totalcosts of diagnostic imaging are reduced.As the yield of positive findings with DSAdecreases due to the application of this tech-nology to a larger population of cases, thecosts per patient decline, but the cost per le-sion found rises.As the population examined for carotid le-sions increases, total costs per diagnostic im-aging are virtually certain to increase regard-less of how effective DSA is or how muchit replaces arteriography. That is, the intro-
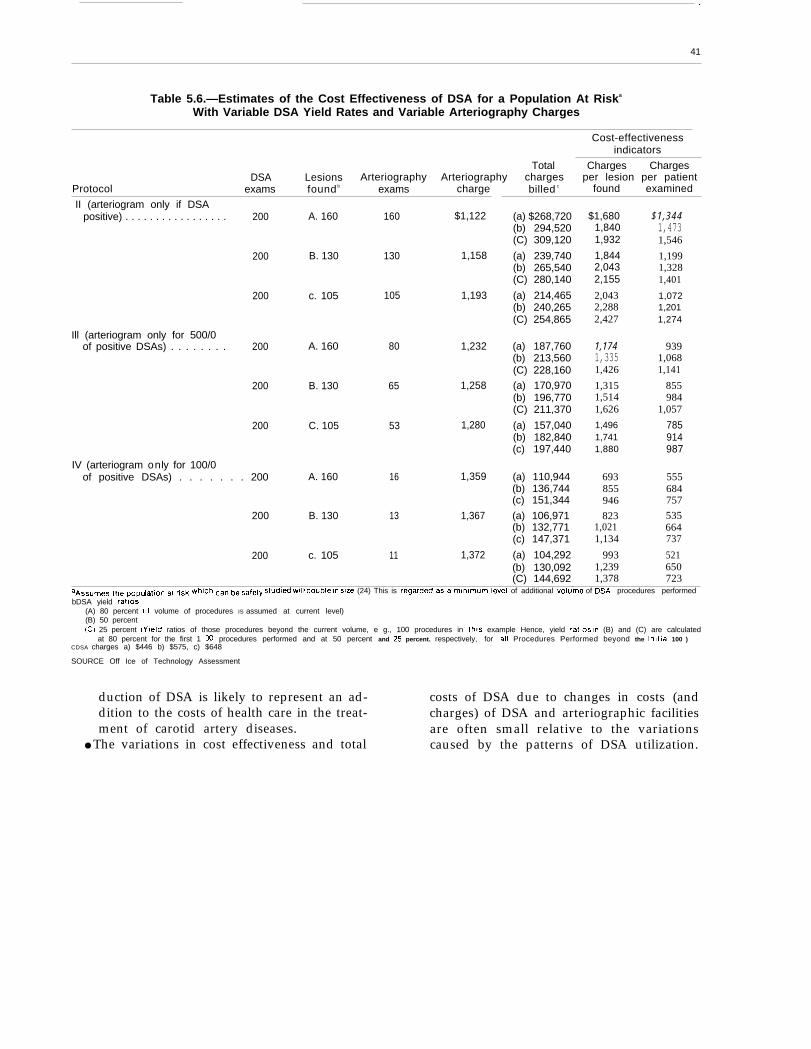
—
41
Table 5.6.—Estimates of the Cost Effectiveness of DSA for a Population At Riska
With Variable DSA Yield Rates and Variable Arteriography Charges
Cost-effectivenessindicators
Total Charges ChargesDSA Lesions Arteriography Arteriography charges per lesion per patient
Protocol exams found b exams charge billed c found examined
II (arteriogram only if DSApositive) . . . . . . . . . . . . . . . . . 200 A. 160 160 $1,122 (a) $268,720
(b) 294,520(C) 309,120
200 B. 130 130 1,158 (a) 239,740(b) 265,540(C) 280,140
200 c. 105 105 1,193 (a) 214,465(b) 240,265(C) 254,865
Ill (arteriogram only for 500/0of positive DSAs) . . . . . . . . 200 A. 160 80 1,232 (a) 187,760
(b) 213,560(C) 228,160
200 B. 130 65 1,258 (a) 170,970(b) 196,770(C) 211,370
200 C. 105 53 1,280 (a) 157,040(b) 182,840(c) 197,440
IV (arteriogram only for 100/0of positive DSAs) . . . . . . . 200 A. 160 16 1,359 (a) 110,944
(b) 136,744(c) 151,344
200 B. 130 13 1,367 (a) 106,971(b) 132,771(c) 147,371
200 c. 105 11 1,372 (a) 104,292(b) 130,092(C) 144,692
aA~~U~e~ ~he ~OP~~~iOn ~~ ~l~k ~hlCh can be safely ~tud{~ ~ill d~ub[e (n sl~e (24) This is regarded as a MlrllrnUrTl level of additional volume of DSA procedures performed
bDSA yield rat!os(A) 80 percent (If volume of procedures IS assumed at current level)(B) 50 percent(C) 25 percent (Y!eld ratios of those procedures beyond the current volume, e g., 100 procedures in th!s example Hence, yield ratios In (B) and (C) are calculated
at 80 percent for the first 1 CO procedures performed and at 50 percent and 25 percent. respectively, for all Procedures Performed beyond the Initial 100 )CDSA charges a) $446 b) $575, c) $648
SOURCE Off Ice of Technology Assessment
$1,6801,8401,932
1,8442,0432,155
2,0432,2882,427
1,1741,3351,426
1,3151,5141,6261,4961,7411,880
693855946823
1,0211,134
9931,2391,378
$1,3441,4731,546
1,1991,3281,401
1,0721,2011,274
9391,0681,141
855984
1,057
785914987
555684757535664737
521650723
duction of DSA is likely to represent an ad- costs of DSA due to changes in costs (anddition to the costs of health care in the treat- charges) of DSA and arteriographic facilitiesment of carotid artery diseases. are often small relative to the variations
● The variations in cost effectiveness and total caused by the patterns of DSA utilization.
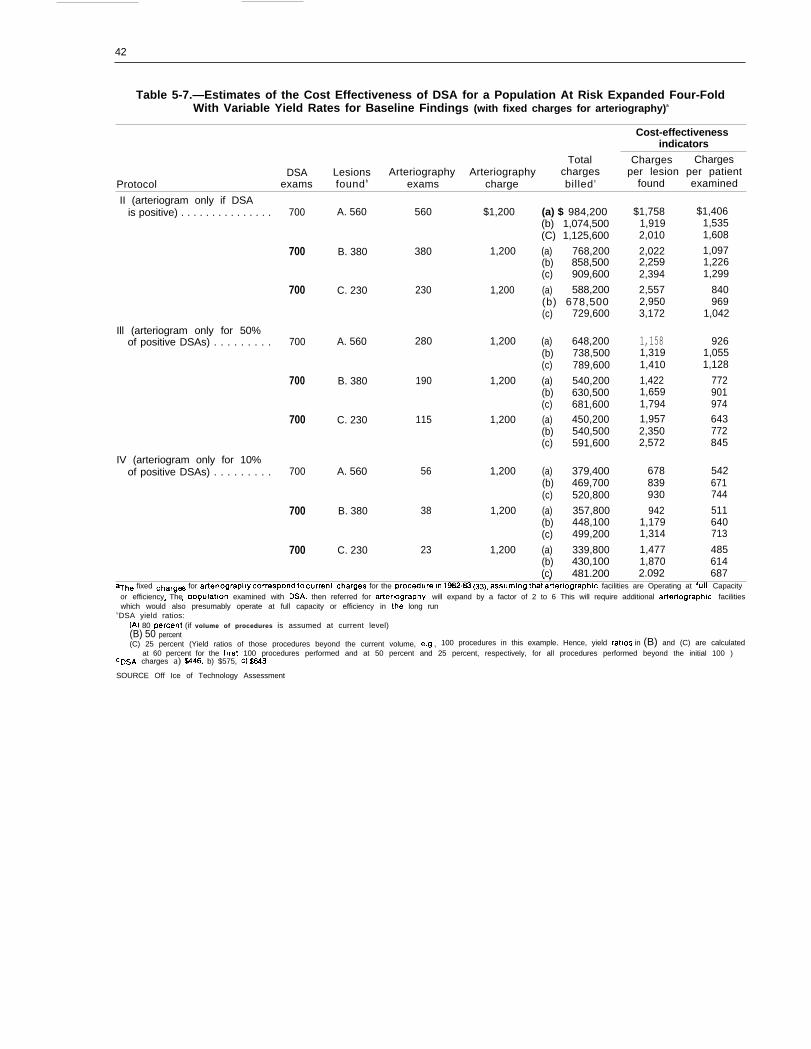
42
Table 5-7.—Estimates of the Cost Effectiveness of DSA for a Population At Risk Expanded Four-FoldWith Variable Yield Rates for Baseline Findings (with fixed charges for arteriography)a
Cost-effectivenessindicators
Total Charges ChargesDSA Lesions Arteriography Arteriography charges per lesion per patient
Protocol exams found b exams charge billed c found examined
II (arteriogram only if DSAis positive) . . . . . . . . . . . . . . . 700
700
700
Ill (arteriogram only for 50%of positive DSAs) . . . . . . . . . 700
700
700
IV (arteriogram only for 10%of positive DSAs) . . . . . . . . . 700
700
700
A. 560 560 $1,200
B. 380 380 1,200
C. 230 230 1,200
A. 560 280 1,200
B. 380 190 1,200
C. 230 115 1,200
A. 560 56 1,200
B. 380 38 1,200
C. 230 23 1,200
(a) $ 984,200(b) 1,074,500(C) 1,125,600
(a) 768,200(b) 858,500(c) 909,600
(a) 588,200(b) 678,500(c) 729,600
(a) 648,200(b) 738,500(c) 789,600
(a) 540,200(b) 630,500(c) 681,600
(a) 450,200(b) 540,500(c) 591,600
(a) 379,400(b) 469,700(c) 520,800
(a) 357,800(b) 448,100(c) 499,200
(a) 339,800(b) 430,100(c) 481.200
$1,7581,9192,010
2,0222,2592,394
2,5572,9503,172
1,1581,3191,410
1,4221,6591,7941,9572,3502,572
678839930
9421,1791,314
1,4771,8702.092
$1,4061,5351,608
1,0971,2261,299
840969
1,042
9261,0551,128
772901974643772845
542671744
511640713
485614687. ,
aThe fixed ~harg= for a~eriograplly ~~rre~P~nd to ~“rrent Cflarges for the procedure in 1982.83 (33), assuming that arteriographic facilities are Operating at futl Capacityor efficiency The Domlatlon examined with DSA, then referred for arteriography, will expand by a factor of 2 to 6 This will require additional arteriographic facilities. . .which would also presumably operate at full capacity or efficiency in th; long run
bDSA yield ratios:(A) 80 Dercent (if volume of procedures is assumed at current level)(B) 50 percent(C) 25 percent (Yield ratios of those procedures beyond the current volume, e.g , 100 procedures in this example. Hence, yield ratios in (B) and (C) are calculated
at 60 percent for the first 100 procedures performed and at 50 percent and 25 percent, respectively, for all procedures performed beyond the initial 100 )CDSA charges a) W46, b) $575, c) $648
SOURCE Off Ice of Technology Assessment

Appendixes

Appendix A. — Acknowledgments andHealth Program Advisory Committee
The development of this case study was greatly aided by the advice of a number of people. The authorsand OTA staff would like to express their appreciation to the Medical Technology and Costs of the MedicareProgram Advisory Panel, to the Health Program Advisory Committee, and especially to the following individuals:
Harold Margulies Robert MoliterOffice of Health Technology Assessment General Electric Co,National Center for Health Services Research Washington, DCRockville, MD Dermis CotterRosanna Coffey Prospective Payment Assessment CommissionNational Center for Health Services Research Washington, DCRockville, MD Murray GoldsteinMimi Fahs National Institute of Neurological andNational Center for Health Services Research Communicative Disorders and StrokeRockville, MD
Walter L. ScottNational Center for Devices and
HealthFood and Drug AdministrationRockville, MD
Robert G. McCune
National Institutes of HealthBethesda, MD
Radiological Pat RubnerBlue Cross/Blue Shield AssociationChicago, IL
David TannenbaumBlue Cross/Blue Shield Association
National Electrical Manufacturers AssociationWashington, DC
Monica WaltersOffice of Medical Applications of ResearchNational Institutes of HealthBethesda, MD
Brad PerryOffice of ResearchHealth Care Financing AdministrationBaltimore, MD
Don DetmerUniversity of Wisconsin Medical CenterMadison, WI
Chicago, IL
Gerald FreedmanTemple Radiology GroupNew Haven, CT
Richard SchefflerSchool of Public HealthUniversity of California at BerkeleyBerkeley, CA
William B. StasonHarvard School of Public HealthBoston, MA
45

46
HEALTH PROGRAM ADVISORY COMMITTEE
Sidney S. Lee, Committee ChairPresident, Milbank Memorial Fund
New York, NY
Stuart H. Altman*DeanFlorence Heller SchoolBrandeis UniversityWaltham, MA
H. David BantaDeputy DirectorPan American Health OrganizationWashington, DC
Carroll L. Estes**ChairDepartment of Social and Behavioral SciencesSchool of NursingUniversity of California, San FranciscoSan Francisco, CA
Rashi FeinProfessorDepartment of Social Medicine and Health PolicyHarvard Medical SchoolBoston, MA
Harvey V. FinebergDeanSchool of Public HealthHarvard UniversityBoston, MA
Melvin A. Glasser** *DirectorHealth Security Action CouncilCommittee for National Health InsuranceWashington, DC
Patricia KingProfessorGeorgetown Law CenterWashington, DC
Joyce C. LashofDeanSchool of Public HealthUniversity of California, BerkeleyBerkeley, CA
Alexander LeafProfessor of MedicineHarvard Medical SchoolMassachusetts General HospitalBoston, MA
Margaret Mahoney*PresidentThe Commonwealth FundNew York, NY
Frederick MostellerProfessor and ChairDepartment of Health Policy and ManagementSchool of Public HealthHarvard UniversityBoston, MA
Norton NelsonProfessorDepartment of Environmental MedicineNew York University Medical SchoolNew York, NY
Robert OseasohnAssociate DeanUniversity of Texas, San AntonioSan Antonio, TX
Nora PioreSenior AdvisorThe Commonwealth FundNew York, NY
Mitchell Rabkin**PresidentBeth Israel HospitalBoston, MA
Dorothy P. RiceRegents LecturerDepartment of Social and Behavioral SciencesSchool of NursingUniversity of California, San FranciscoSan Francisco, CA
‘Until April 1983.● ’Until March 1984.● **Until October 1983,
‘Until August 1983.● *Until April 1983.

47
Richard K. Riegelman Frederick C. RobbinsAssociate ProfessorGeorge WashingtonSchool of MedicineWashington, DC
Walter L. Robb
PresidentUniversity Institute of Medicine
Washington, DC
Rosemary StevensProfessor
Vice President and General Manager Department of History and Sociology of ScienceMedical Systems Operations University of PennsylvaniaGeneral Electric Co. Philadelphia, PAMilwaukee, WI

Appendix B. —Glossary of Terms and Acronyms
Glossary of Terms
Accuracy: The number of correct test results dividedby the total number of tests performed. Diagnosticaccuracy may vary with the prevalence of the dis-ease in the population.
Aneurysm: A permanent abnormal blood-filled dila-tion of a blood vessel resulting from disease of thevessel wall.
Arterial lumen: The cavity of a tubular organ.Arteriography: Visualization of an artery using photo-
graphs made with X-rays after the injection ofradiopaque (impervious to the rays) material intothe bloodstream.
Atherosclerosis: A chronic disease characterized by thedeposition of fatty substances in the inner layer ofthe arteries.
Bruit: A sound or murmur heard in an organ, espe-cially an abnormal one.
Carotid bifurcation: The division into two branchesof the principal artery in the neck.
Cerebral infarction: An area of dead tissue in the ce-rebrum caused by a deficiency of blood due to func-tional constriction or actual obstruction of a bloodvessel.
Cerebrovascular disease: A disease affecting or per-taining to the blood vessels of the cerebrum orbrain.
Cholesterol: A steroid alcohol present in animal cellsand body fluids, important in physiological proc-esses, and implicated experimentally as a factor inarteriosclerosis.
Digital subtraction angiography (DSA): A radiologictool used for the diagnosis of conditions pertain-ing to the internal structure of blood vessels. Theprocedure involves injecting a contrast medium intothe veins and then monitoring the change of themedium as it passes through the veins. The com-puter subtracts the images before the injection fromthe images after the injection to attain a numericalrepresentation of the arterial structure.
Diplopia: A vision disorder in which two images ofa single object are seen because of unequal actionof the eye muscles (also called “double vision”).
Doppler device: A radar-like device used to measurethe velocity of blood flow through the arteries.
Duplex scanning: The combination of the B-scan andthe Doppler device. Using this method both the im-age of the blood vessel and the flow pattern at agiven location can be determined.
Effectiveness: Same as efficacy except that it refers to,, . . . average or actual conditions of use. ”
Efficacy: The probability of benefit to individuals ina defined population from a medical technology ap-plied for a given medical problem under ideal con-ditions of use.
Endarterectomy: Surgical removal of the inner layerof an artery when thickened and obstructed.
Energy subtraction: Using digital subtraction angi-ography to show changes in the contrast appearanceof the artery at varying X-ray intensities.
Fibrin: A white insoluble protein formed from fi-brinogen during the clotting of blood.
Hemorrhagic: Of or pertaining to a copious dischargeof blood from the blood vessels,
Microemboli: A microscopic abnormal particle cir-culating in the blood.
Noninvasive technique: A diagnostic method that doesnot involve the penetration (by surgery or hypoder-mic needle) of the skin.
Occlusion: The blocking off or obstruction of bloodflow through a vessel.
Periorbital ultrasonography: A diagnostic techniqueusing ultrasonic waves to examine the orbit or theeye socket.
Peristalsis: Successive waves of involuntary contrac-tion passing along the walls of the intestine or otherhollow muscular structure and forcing the contentsonward.
Platelet: A disk-shaped structure found in the bloodof all mammals. It is known for its role in bloodcoagulation.
Prophylaxis: Measures designed to preserve health (asof society) and prevent the spread of disease.
Real-time ultrasound (B-scan): A device used to meas-ure the anatomical structure of vessels by vibrationsof the same physical nature of sound, but with fre-quencies above the range of human hearing.
Risk: A measure of the probability of an adverse oruntoward outcome and the severity of the resultantharm to health of individuals in a defined popula-tion and associated with use of a medical technol-ogy applied for a given medical problem underspecified conditions of use.
Safety: A judgment of the acceptability of risk in aspecified situation.
Sensitivity: The number of positive test results dividedby the number of patients that actually have thedisease.
Specificity: The number of negative test results dividedby the number of patients that actually have thedisease.
Stenosis: A narrowing or constriction of a bodilypassage or orifice.
48
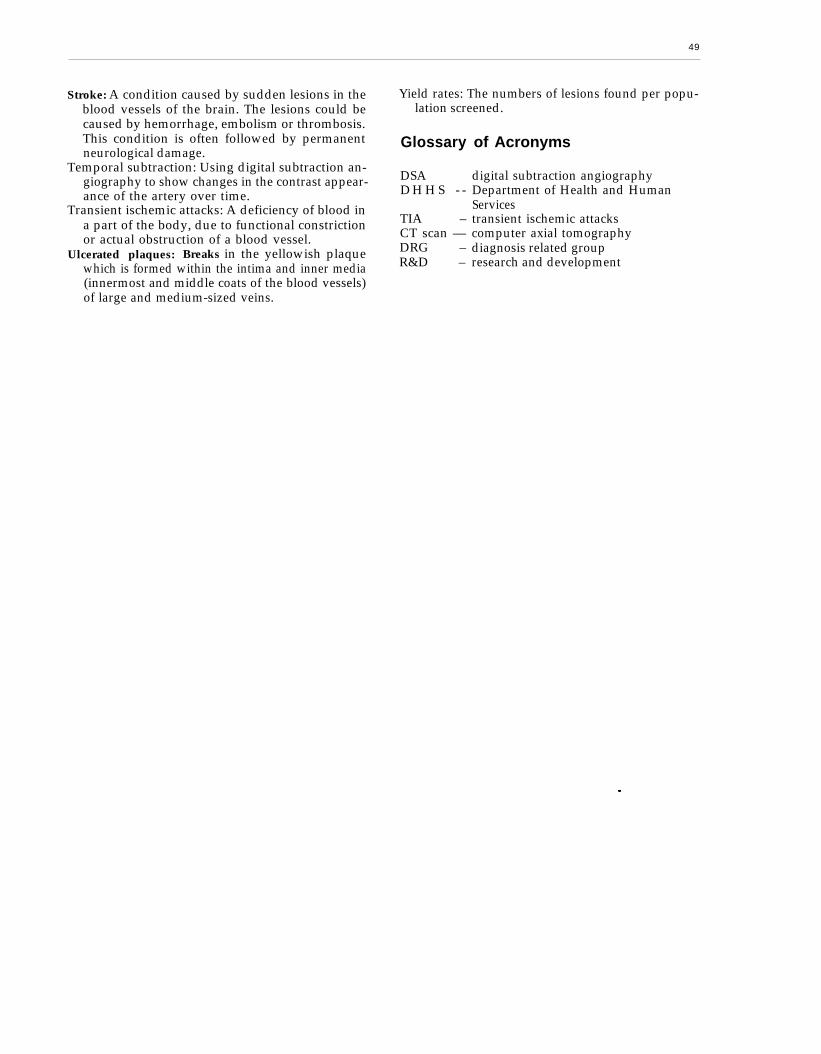
49
Stroke: A condition caused by sudden lesions in the Yield rates: The numbers of lesions found per popu-blood vessels of the brain. The lesions could be lation screened.caused by hemorrhage, embolism or thrombosis.This condition is often followed by permanent Glossaryneurological damage.
Temporal subtraction: Using digital subtraction an-giography to show changes in the contrast appear- DSA
ance of the artery over time. D H H S - -
Transient ischemic attacks: A deficiency of blood ina part of the body, due to functional constriction TIA –
CT scan —or actual obstruction of a blood vessel.Ulcerated plaques: Breaks in the yellowish plaque DRG –
which is formed within the intima and inner media R&D –
(innermost and middle coats of the blood vessels)of large and medium-sized veins.
of Acronyms
digital subtraction angiographyDepartment of Health and HumanServicestransient ischemic attackscomputer axial tomographydiagnosis related groupresearch and development
.

References
References1<
2.
3.
4.
5.
6.
7.
8.
9.
10,
11.
12.
13.
14.
15.
Ackerman, L. V., “Computers in Radiology, ” Ra-diology 139:505-6, 1981.Ackerman, R. H., “A New Image for the Neuro-radiologist, ” Am. J. NeuroRadiology 1:271-3,1980.Ackerman, R. H., “Impact of New Techniqueson the Diagnosis and Management of Cerebro-vascular Disease, ” paper presented at the In-ternational Symposium, Evaluation Cout-Effi-cacit+ en Neuroradiologic, Bordeaux, France,May 14-15, 1982; J. Neuroradiology 10:173-5,1983,Ackerman, R. H., “Non-Invasive Carotid Evalua-tion, ” Stroke 11(6): 675-8, November-December1980.Altman, S. H., and Blendon, R. (eds. ), “MedicalTechnology: The Culprit Behind Health CareCosts?” proceedings of the 1977 Sun ValleyForum on National Health, DHEW publicationNo. (PHS) 79-3216 (Hyattsville, MD: NationalCenter for Health Services Research, 1979).Arnold, B., Eisenberg, H., and Borger, D.,“Digital Video Angiography System Evaluation,”Applied Radiology 10(6):81-90, 1981.Arnstein, S., “Technology Assessment: Oppor-tunities and Obstacles, ” IEEE Transactions onSystems, Man, and Cybernetics SMC-7(8), 1977.Banta, H. D., and Behney, C. J., “Policy Formu-lation and Technology Assessment, ” A4ilbankMere. Fund Q./Health and Society 59(3):445-79,1981.Boyle, J. F., “NCHCT Could Impede Health CareAdvancement and Delivery, ” Medical instrumen-tation 15(5):296-8, 1981.Braun, P., “Need for Timely Information JustifiesNCHCT,” Medical Instrumentation 5(5):302-4,1981.Brody, W. R., Enzmann, D. R., Deutsch, L. S.,et al., “Intravenous Carotid Arteriography UsingLine-Scanned Digital Radiography, ” Radiology139:297-300, 1981.Brody, W. R., Enzmann, D, R., Miller, D, C.,et al., “Intravenous Arteriography Using DigitalSubtraction Techniques, ” J. A.M.A. 248(6):671-4, 1982.Brozovich, J. P., and Loftus, D. G., “Physician-Administrator Decision Making for High-Tech-nology Purchases: A Model Approach, ” I+CMReview 6:63-73, 1981.Bunker, J. P., “Health Care Technology Assess-ment Essential to Effective Medical Care, ” Med-ical Instrumentation 15(5):289-90, 1981.Bunker, J. P., Fowles, J., and Schaffarzick, R.,
16.
17.
18.
19.
20.
21.
22
23.
24.
25.
26.
27.
28.
29.
“Evaluation of Medical Technology Strategies, ”N. Eng. J. Med. 306(10):620-4, 1982.Bunker, J. P., Fowles, J., and Schaffarzick, R.,“Evaluation of Medical Technology Strategies, ”N. Eng. J. Med 306(11):687-92, 1982.Buonocore, E., Meaney, T. F., Borkowski, G. P.,et al., “Digital Subtraction Angiography of theAbdominal Aorta and Renal Arteries, ” Radiol-ogy 139:281-6, 1981.Capehart, C. E., “Digital Market Sizzles With24T0 Quarterly Growth, ” Diagnostic Imaging(December):23, 1982.Chilcote, W. A., Medic, M. T., Pavlicek, W. A.,et al., “Digital Subtraction Angiography of theCarotid Arteries: A Comparative Study in 100Patients,” Radiology 139:287-95, 1981.Christenson, P. C., Ovitt, T. W., Fisher, H. D.,et al., “Intravenous Angiography Using DigitalVideo Subtraction: Intravenous Cervicocerebro-vascular Angiography, ” Am. J. Radiology 135:1145-52, 1980.Crummy, A. B., Strother, C. M., Sackett, J. F.,et al., “Computerized Fluoroscope: Digital Sub-traction of Intravenous Angiocardiography andArteriography,” Am. J. Radiology 135:1131-40,1980.Cukier, D. S., “What’s Wrong With Radiology, ”N. Eng. J. Med 307(7):445-6, 1982.Deber, R., “Trends in Health Care Cost—TheContribution of Technology, ” Dimensions inHealth Services 59(1):16-19, 1982.Detmer, D. E., Fryback, D., and Strother, C. M.,“Cost Effectiveness of Digital Subtraction Arteri-ography, ” ch. 17 in C. A, Mistretta, A. B.Crummy, C. M. Strother, and J. F. Sackett (eds. ),Digital Subtraction Angiography: An Applica-tion of Computerized Fluoroscope (Chicago:Yearbook Publications, 1982).Drew, P. G., “Are Better Diagnostic InstrumentsCost-Effective?” Diagnostic Imaging, July 1982.Easton, J. D., and Sherman, D. G., “Carotid End-arterectomy, “ Mayo Clinic Proceedings 58:205-6, 1983.Edmonds, E. W., Hynes, D. M,, Baranoski, D.,and Rowlands, J., “Multiformat Cameras for theProduction of Hard Copy From Digital Radio-graphic Systems, ” Applied Radiology 11(1):31-5, 1982.Eisenberg, J, M., and Nicklin, D., “Use of Diag-nostic Service by Physicians in Community Prac-tice, ” Medical Care XIX(3) :297-309, 1981.Falk, D. E,, “Viewing Radiology’s New Image, ”Patient Care 16(2):63-97, 1982.
53

54
30,
31.
32.
33.
34.
35<
36,
37.
38.
39.
40.
41.
42.
43.
44.
Faulkner, P. L., et al., “Many Diagnostic TestsMay be Unnecessary,” Hospitals 55(8):57-9, 1981.Fineberg, H. V., “Impact of Technological Invest-ment on the Cost of the Health Care System, ”presentation at the Symposium International deEvaluation Cout-Efficacit4 en Neuroradiologic,Bordeaux, France, May 14-15, 1982; J. Neuro-radiology 10:199-204, 1983.Fineberg, H. V., and Hiatt, H. H., “Evaluationof Medical Practices: The Case for TechnologyAssessment, ” N. Eng. J. Med. 301(20):1086-90,1979.Freedman, G. S., “Economic Analysis of Out-patient Digital Angiography, ” Applied Radiology11(3):29-38, 1982.Freedman, G. S., and James, A. E., “A Focus onClinical Utility—Comparison of Outpatient Digi-tal Angiography and Inpatient Angiography:Some Financial Implications, ” unpublished man-uscript, Temple Radiology Associates, TempleMedical Center, New Haven, CT, no date.Friedman, E., “Imaging Technology Approachesthe Frontiers of Physics, ” Hospitals 55(1):76-82,1982.Friedman, E., “Small Hospitals and the GreatTechnology Debate, ” Trustee 35(1):25-32, 1982.Friedman, E., “Under One Roof: The Case forCentralized Radiology Services, ” Fiospitak 55(I):96-98, 1981.Fryback, D. G., “A Conceptual Model for Out-put Measures in Cost-Effectiveness Evaluation ofDiagnostic Imaging, ” paper presented at the Sym-posium International de Evaluation Cout-Effi-cacitd en Neuroradiologic, Bordeaux, France,May 14-15, 1982,Fuchs, V. R., ‘What Is CBA/CEA, and Why AreThey Doing This to Us?” N. Eng. J. Med 303(16):937-8, 1980.Garraway, M. W., Whisnant, J. P., Furlan, A.I., et al., “The Declining Incidence of Stroke,” N.Eng. J. Med. 300(9):449, 452, 1979.Garraway, M. W., Whisnant, J. P., Kurland, L.T., et al., “Changing Pattern of Cerebral Infarc-tion: 1945-1974, ” Stroke 10(6):657-63, 1979.Garrison, L. P., “Physician Requirements—1990:For Neurology, ” Battelle Memorial Institute Hu-man Affairs Research Centers, Seattle, WA, 1982.Geyman, J. P., “The Content of Family Practice:Current Status and Future Trends,” J. FamilyPractice 15:697, 706, 1982.Greenberg, B., and Derzon, R. A., “Determin-ing Health Insurance Coverage of Technology:Problems and Options, “ Medical Care XIX(10):967-77, 1981.
45.
46.
47,
48.
49.
50.
51.
52.
53.
54.
55.
56.
57.
58.
59.
60.
61
62.
63.
Gruber, M. L., Engle Neurological Associates, P.A., Englewood, NJ, personal written communi-cation to Matthew Menken, Dec. 30, 1982.Guez, M., and Anderson, P, J,, “Frequency ofNecrologic Diagnosis: Implications for Cur-riculum Design, ” The Mount Sinai Journal ofMedicine 47:364-72, 1980.Gunby, P., “Scanning the Field of Neuroradiol-ogy, ” J. A.M.A. 249(7):857-67, 1983.Guncheon, K. F., “Diagnostic Imaging: An In-side Look, ” Hospitals 55(1):86-95, 1981.Gutierrez, C., “The Birth and Growth of Neuro-radiology in the USA, ” Neuroradiology 21:227-37, 1981.Heilman, R. S., “What’s Wrong With Radiol-ogy?” N. Eng. J. Med. 306(8):477-9, 1982.Hellinger, E. J., “Controlling Costs by AdjustingPayment for Medical Technologies, ” Inquiry19:34-43, 1982.Hemenway, D., “The Optimal Location of Doc-tors, ” N. Eng. J. Med. 306(7):397-401, 1982.Hess, C. W., “Cost/Benefit Analysis—AnotherDimension, ” Medical Lwtrumentation 16(1):76-7, 1982.Hessel, S. J., Adams, D. F., and Abrams, H. L.,“Complications of Angiography,” Radiology138:273-81, 1981.Hillman, B. J., Ovitt, T. W., Nudelman, S., etal., “Digital Video Subtraction Angiography ofRenal Vascular Abnormalities, ” Radiology 139:277-80, 1981.Johnson, J. M., “Angiography and Ultrasound inDiagnosis of Carotid Artery Diseases: A Com-parison,” Contemporary Surgery 20:79-93, 1982.Johnson, W. C., Paley, R. H,, Castronuovo, J.J., et al., “Computed Tomographic Angiography,”Am. J. Surgery 14:434-40, 1981.Karasov, C, G., “Move Over for Digital Radiog-raphy,” Applied Radiology 10(6):37-42, 1981,Keyes, G. S., Pelc, N. J., Riederer, S. J., et al.,Digital Fluorography: A Technology Update(Milwaukee, WI: General Electric Co., 1981).Kruger, R. A., Anderson, R. E., Koehler, P. R.,et al., “A Method for the Noninvasive Evalua-tion of Cardiovascular Dynamics Using a DigitalRadiographic Device, ” Radiology 139:301-5,1981.Kuntz, E. F., “Digital Imaging Makes RapidGains,” Modern Healthcare 12(1):74-6, 1982.Kurtzke, J. F., “The Current Necrologic Burdenof Illness and Injury in the United States, ” NeuroZ-ogy 32:1207-14, 1982.Levy, J. M., Hessel, S. J., and Nykamp, P. W.,“Digital Subtraction Angiography: The Commu-

55
64.
65.
66.
67.
68.
69.
70.
71,
72.
73.
74.
75.
76.
77.
78.
79.
nity Hospital Experience, ” Diagnostic Imaging 23-28, 1982.Little, J. R., Furlan, A. J., Medic, M. T., “DigitalSubtraction Angiography in CerebrovascularDisease, ” Stroke 13(5):557-66, 1982.Little, J. R., FurIan, A. J., Medic, M. T., et al.,“Intravenous Digital Subtraction Angiography inBrain Ischema,’’ J. A. A4.A. 247(23):3213-6, 1982.Lodwick, G. S., “Must Better Diagnosis CostMore?” Applied Radiology 11(2):15, 1982.MacIntyre, W. J., Pavlicek, W., Gallagher, J. H.,et al., “Imaging Capability of an ExperimentalDigital Subtraction Angiography, ” RadioZogy139:307,313, 1981.Maloney, T. W., and Rogers, D. E., “MedicalTechnology—A Different View of the Conten-tious Debate Over Costs, ” N. Eng. J Med. 301(26):1413-8, 1979.Manana, J. P., “Ethics and Technology: Cross-roads in Decision Making, ” Trustee 35(1):33-8,1982.Martin, D., “Buying Technology: InternationalPerspectives, ” Health Technology NotebookDimensions in Health Services 58(10):27, 1981.Martin, D., “The Future of Diagnostic Imaging, ”Health Technology Notebook Dimensions inHealth Services 58(10):46, 1981.Meaney, T, F., Weinstein, M. A., and Buonocore,E., et al., “Digital Subtraction Angiography ofthe Human Cardiovascular System, ” Am. J. Ra-diology 135:1153-60, 1980.Menken, M., “The Coming Oversupply of Neu-rologists in the 1980’s: Implications for Neurologyand Primary Care, ” J. A.M.A. 245(23):2401-3,1981.Mistretta, C. A., Crummy, A. B., and Strother,C. M., “Digital Angiography: A Perspective, ”Radiology 139:273-6, 1981.Mosberg, W. H. “Neurosurgeons, ComputedTomographic Scanners, and the Health PlanningBureaucracy,“ Neurosurgery 8(2):287-94, 1981.Mosberg, W. H., “Regionalization: Not Yes orNo, But How Much,” Neurosurgery 8(2):287-94,1981.Najman, J. M., and Levine, S., “Evaluating theImpact of Medical Care and Technologies on theQuality of Life: A Review and Critique,” SocialScience and Medicine 15 F:107-15, 1981.Okean, M., “Vascular DSA Proves Worth inOutpatient Setting, ” Diagnostic Xmaging 56-59,1982.Ostfeld, A. M., “A Review of Stroke Epidemiol-ogy, ” in P. E. Sartwell, N. Nathanson (eds. ), Epi-demiologic Review 2:136-52, 1980.
80.
81.
82.
83.
84.
85.
86.
87.
88.
89.
90.
91
92.
93.
94.
95.
Ovitt, T. W., Christenson, P. C., Fisher, H. D.,et al., “Intravenous Angiography Using DigitalVideo Subtraction: X-Ray Imaging System, ” Am.1. Radiology 135:1141-4, 1980.Patterson, R. H., “Efficacy, Safety, and Com-pensability of Neurosurgical Procedures, ” Neuro-surgery 6(4):474-6, 1980.Pond, G. D., Osborne, R. W., Capp, M. P., etal., “Digital Subtraction Angiography of Periph-eral Vascular Bypass Procedures, ” Am. J. Radi-ology 138:279-81, 1982.Pond, G. D., Smith, J. R. L., and Hillman, B.J., et al., “Current Clinical Application of DigitalSubtraction Angiography,” Applied Radiology10(6): 71-9, 1981.Quest, D. O., “The Impact of Medical DeviceLegislation,” Neurosurgery 5(1):78, 1979.Relman, A. S., “An Institute for Health-CareEvaluation,” N. Eng. J. Med. 306(11):669-70,1982.Relman, A. S., “Technology Costs and Evalua-tion,” N. Eng. J. Med. 301(26):1444-5, 1979.Reuter, S. R., “Digital Subtraction Angiography”(editorial), Am. J. Radiology 135:1316, 1980.Robbins, F. C., “Health Practices AssessmentShould Include Social, Economic, and Ethical Im-placations, ” Medical instrumentation 15(5):293-5, 1981.Sage, M. R., Wilson, B. C., and Benness, G. T.,“Changes in Neurological Practice in SouthAustralia After the Introduction of ComputerizedTomography,” Med. J. Aust. 1:163, 1980.Sappenfield, R. W., Boudreau, A., Catrou, B.G., and Beeler, M. F., “Ranking DiagnosticProtocols—A Proposed Process Based on Use ofthe Nine-Cell Diagnostic Decision Matrix, ”A.J. C.P. 127-32, 1981.Sanders, C. A., “National Center for Health CareTechnology: An Important Resource for HealthCare Delivery, ” Medical Instrumentation 15(5):299-301, 1981.Schoellhorn, R. A., “Federal Technology Assess-ment Programs Should be Limited, ” Medical in-strumentation 15(5):291-2, 1981.Schroeder, S. A., and Showstack, J. A., “Finan-cial Incentives to Perform Medical Proceduresand Laboratory Tests: Illustrative Models of Of-fice Practice,” Medical Care XVI(4) :289-98, 1978.Showstack, J. A., Schroeder, S. A., and Mat-sumoto, M. F., “Changes in the Use of MedicalTechnologies, 1972, 1977,” New Eng. J. Med.306(12):706-12, 1982.Soltero, I., Kiang, L,, Cooper, R., et al., “Trendsin Mortality From Cerebrovascular Diseases in
56
96.
97.
98,
99.
100.
101.
102.
103.
104.
the United States, 1960-1975, ” Stroke 9:549-58,1978.Stein, B. M., McCormick, W. F., and Rodriguez,J. N., et al., “Postmortem Angiography of Cere-bral Vascular System,” Arch. Neurology 7:83-96,1962.Stein, B. M., McCormick, W. F., and Rodriguez,J. N., et al., “Postmortem Angiography of Cere-bral Vascular System, ” Arch. Neurology 7:545-59, 1962.Steinwachs, D. M., Levine, D. M., Elzinga, J.,et al., “Changing Patterns of Graduate MedicalEducation,” N. Erig. J. Med. 306(1):10-14, 1982.Stieghorst, M. F., Strother, C. M., and Mistretta,C. A., et al., “Digital Subtraction Angiography:A Clinical Overview,” Applied Radiology 10(6):45-9, 1981.Sussman, E. J., Eisenberg, J. M., Williams, S. V.,and the Diagnostic Services Utilization ReviewCommittee, “Diagnostic Services Utilization Re-view at a University Medical Center, ” kfCA4 Re-view 65-8, 1981.Strother, C. M., Fryback, D. F., and Detmer, D.E., “Digital Subtraction Angiography,”J. Neuro-radiology 10:192-5, 1983.Swanson, P. D., Clanchini, P. R., Dyken, M. L.,et al., “A Cooperative Study of Hospital Fre-quency and Character of Transient Ischemic At-tacks, ” J. A.M.A. 237(2):2202-6, 1977.Toole, J. F., “Diagnosis and Management ofStroke, ” American Heart Association, 1979.Toole, J. F., “Management of Cervical Athero-sclerosis,” Mayo Clinic Proceedings 57:267-8,1982.
105.
106,
107.
108.
109.
110.
111
112.
Toole, J. F., and Howard, G., “Physician At-titudes: Management of Asymptomatic CarotidArtery Murmur and Transient Ischemic Attacks,”Arch. Neurology 38:443-6, July 1981.Turnipseed, W. D., “Potential Clinical Applica-tions of Digital Subtraction Angiography, ” Ap-plied Radiology 11(3):83-91, 1982.Turnipseed, W. D., Crummy, A. B., Strother,C., et al., “Computerized Intravenous Arteri-ography: A Technique for Visualizing the Periph-eral Vascular System, ” Surgery 89(1):118-23,1981.U.S. Congress, Office of Technology Assessment,“The Implications of Cost-Effectiveness Analy-sis of Medical Technology, ” OTA-H-126 (Wash-ington, DC: U.S. Government Printing Office,1980).U.S. Congress, Office of Technology Assessment,“Policy Implications of the Computed Tomogra-phy (CT) Scanner” (Washington, DC: U.S. Gov-ernment printing Office, 1978).U.S. Department of Health and Human Services,Office of Health, Research, Statistics and Tech-nology, Health—United States, 1982, DHHSpublication No. (PHS)82-1232 (Hyattsville, MD:DHHS, 1982),Weinstein, M. A., Medic, M. T., Buonocore, E.,and Meaney, T. F., “Digital Subtraction Angiog-raphy: Clinical Experience at the Cleveland ClinicFoundation, ” Applied Radiology 10(6):53-69,1981.Yahr, M. D., “Summary Report of the JointCommission on Neurology, ” Neurology 25:497-501, 1975.
0