the cost-benefit analysis methodology - institute for social and
TRANSCRIPT

From Risk toResilience
The Cost-Benefit AnalysisMethodology
Working Paper 1
Reinhard Mechler (IIASA) &The Risk to Resilience Study Team


Reinhard Mechler (IIASA) &The Risk to Resilience Study Team
October, 2008
From Risk toResilience
The Cost-Benefit AnalysisMethodology
Working Paper 1

© Copyright, 2008
ProVention Consortium; Institute for Social and Environmental Transition;Institute for Social and Environmental Transition-Nepal.
This publication is made possible by the support of the ProVention Consortium and United Kingdom's Depart-ment for International Development (DFID). The research programme is supported through DFID grant numberOHM0837, NOAA award number NA06OAR4310081 and the Canadian International Development Research Centre(IDRC) Centre file 103232-001. Views and opinions expressed within do not necessarily reflect the positions ofProVention, IDRC, NOAA or DFID. The findings, interpretations and conclusions expressed in this paper are thoseof the authors alone.
Any part of this publication may be cited, copied, translated into other languages or adapted to meet local needswithout prior permission from ProVention Consortium, ISET or ISET-Nepal provided that the source is clearlystated.
First Edition: 2000October, 2008.
ISBN: 978-9937-8019-6-6
Series editors: Marcus Moench, Elisabeth Caspari & Anil Pokhrel.
Published by: ProVention Consortium, Institute for Social and Environmental Transition and Institute for Socialand Environmental Transition-Nepal.
Cover: Boats used for salvaging belongings from flooded areas after the Kosi embankment breach in August 2008.Photo by Anil Pokhrel.
DESIGN AND TYPESETTINGDigiscan Pre-press Pvt. Ltd., Kathmandu, Nepal.
PRINTED ATFormat Printing Press Pvt. Ltd., Kathmandu, Nepal.
Please use the following reference for this working paper:Mechler, R. and The Risk to Resilience Study Team, (2008): The Cost-Benefit Analysis Methodology, From Risk toResilience Working Paper No. 1, eds. Moench, M., Caspari, E. & A. Pokhrel, ISET, ISET-Nepal and ProVention,Kathmandu, Nepal, 32 pp.

Section 1: Cost-Benefit Analysis and its Role in CBA 1
Section 2: Essentials of CBA 5
Section 3: Application in Disaster Risk Management 9
Section 4: Assessing Risks 15
Section 5: Identification of Risk Management Measures and Associated Costs 19
Section 6: Analysis of the Benefits of Risk Management 21
Section 7: Calculation of Economic Efficiency 23
Section 8: Types of CBA Assessments and Requirements 25
Section 9: Conclusions 27
References 30
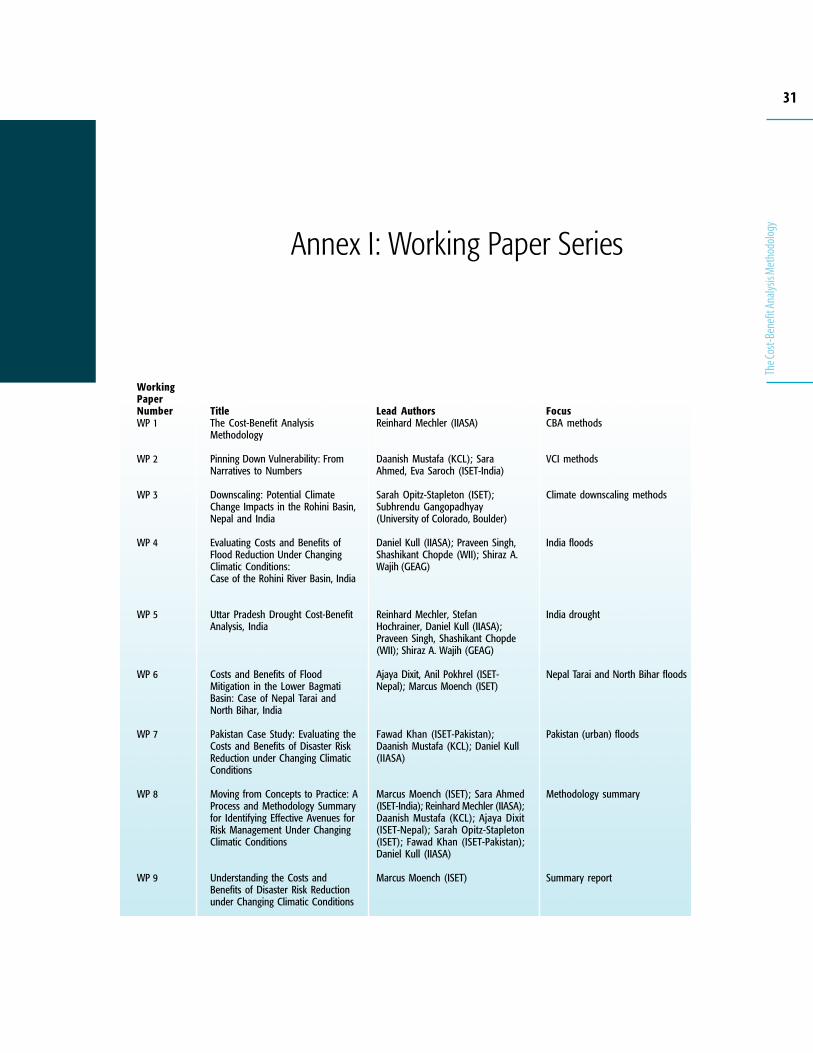
Annex I: Working Paper Series 31Annex II: Acknowledgements 32
Contents

.

1
The C
ost-B
enefi
t Ana
lysis M
etho
dolog
y
A limited number of studies have demonstrated that disaster prevention can payhigh dividends and found that for every Euro invested in risk management,broadly 2 to 4 Euros are returned in terms of avoided or reduced disaster impactson life, property, the economy and the environment (Mechler, 2005). Despite thebenefits, disaster risk management (DRM) measures are rarely implemented andthere is, for the most part, a reliance on reactive, after-the-fact approaches. Forexample, bilateral and multilateral donors still allocate 90% of their disastermanagement funds for relief and reconstruction and only the remaining 10% fordisaster risk management (Tearfund, 2006). This low level of investment inprevention can be explained by a lack of understanding and concrete evidenceregarding the types and extent of the cost and benefits of preventive disaster riskmanagement measures.
Cost-benefit analysis (CBA) is an established tool for determining the economicefficiency of development interventions. CBA compares the costs of conductingsuch projects with their benefits and calculates the net benefits or efficiency(measured by the net present value, the rate of return or the benefit-cost ratio).While the benefits created by development interventions are the additionalbenefits due to, for example, improvements in physical or social infrastructure, indisaster risk management the benefits are mostly the avoided or reduced potentialdamages and losses, including the benefits of the primary developmentinterventions.
OECD countries, such as the United Kingdom and the United States have usedCBA frequently for evaluating DRM in the context of development assistance.CBA is also frequently utilized by development banks such as the World Bank, theAsian Development Bank and the Inter-American Development Bank. The WorldBank is considered the "chief practitioner" of CBA. It is important to note,however, that actual usage of CBA in disaster management has been limited. Thissaid, interest in economic aspects of DRM has been increasing with high profiledisaster events such as the Indian Ocean Tsunami, the East Pakistan Earthquakeand Typhoon Sidr in Bangladesh and CBA is increasingly seen as a key tool foreconomic evaluation. Additionally, with climate change impacts already being
SECTION 1
Cost-benefit Analysis and its Rolein Disaster Risk Management

2
From Risk to Resilience
Working Paper No. 1
observed and projected with higher confidence, adaptation to extreme events andclimate variability and the fair and efficient allocation of adaptation funding isrising to the forefront of climate and DRM policy.
This working paper discusses key methodological aspects and findings from CBAof DRM strategies in a detailed case study in Uttar Pradesh, India (Risk toResilience Working Paper No. 5). It also provides a backdrop for other case studiescarried out under the Risk to Resilience project. It is a shorter version of a moredetailed guide on conducting CBA to be published in the main Risk to ResilienceProject Report.
We conclude that CBA can be a useful tool in DRM if a number of issues related toconducting a CBA assessment and using results are properly taken intoconsideration. These issues are discussed briefly in the sections below beforediscussing the essentials of CBA and its application in the specific context of DRM.
Clarify objectives of conducting a CBA on DRM
Before engaging in a CBA assessment, it is necessary to clarify the objectives,information needs and data situation among different potential stakeholders. Suchstakeholders may include representatives from local, regional and nationalplanning agencies, NGOs working in development and disaster risk management,disaster risk managers, officials concerned with public investment decisions,development cooperation staff and local communities. The type of envisagedproduct is closely linked to its potential users. A CBA may be conducted for merelyinformational purposes (such as in the Lai Basin case - Risk to Resilience WorkingPaper No. 7), as a pre-project appraisal (the India Uttar Pradesh flood study- Riskto Resilience Working Paper No. 4), as a full-blown project appraisal (the IndiaUttar Pradesh drought study- Risk to Resilience Working Paper No. 5) or as an ex-post evaluation (touched upon in the India Uttar Pradesh flood study as well).Purposes, resource and time commitments and the expertise required differsignificantly for these products. At a very early stage of the analysis, it is critical toachieve consensus among the interested and involved parties on the scope of theCBA to be undertaken.
Acknowledge complexities of estimating risk
Estimating disaster risk and the costs and benefits of risk management isinherently complex and climate change adds substantial additional complexity.Disaster events in essence are probabilistic events and, as a consequence, benefitsto risk management are probabilistic and arise only in case of an event occurring.Accordingly, benefits should be assessed in terms of probability multiplied by theconsequences, leading to an estimate of risk as the product of hazard, vulnerabilityand exposure. While enormous progress has been made in recent years in betterunderstanding and modelling disaster risks, the uncertainties in projecting futureclimate conditions at local levels and thus the probability of hazard events

3
The C
ost-B
enefi
t Ana
lysis M
etho
dolog
y
(droughts, extreme storms, floods, and so on) adds additional complexity. This isdue to inherent limitations in modelling the climatic system and anthropogenicinterventions.
Often, attempts to probabilistically estimate future disasters risks in ways thatinclude the effects of climate change are defeated by the lack of reliable probabilisticinformation. Furthermore, even given a good understanding of the system as awhole, conducting a CBA of DRM measures is often difficult due to lack of data,expertise and the high demand on resources. Often, methodological shortcuts haveto be used and assumptions made in order to arrive at a broader understanding ofkey risks and benefits of DRM. These specific challenges and characteristics ofdisaster risk management need to be properly communicated and understood inorder to properly interpret results derived in a CBA.
Process-Orientation
Given the complexities involved in estimating the costs and benefits of DRM andthe history and current usage of CBA as a decision support tool, we conclude thatthe role of CBA in DRM is strongly related to process rather than outcome. CBA is auseful tool for organizing, assessing and finally presenting the cost and benefits, andpros and cons of interventions; it demands a coherent methodological, transparentapproach. Yet, given the difficulties of properly accounting for extreme event risk andwith processes such as climate change affecting risk significantly, CBA should not beviewed as a purely outcome-oriented tool for evaluation of DRM. This is particularlytrue in data-restricted environments such as those frequently encountered indeveloping countries. If this is properly understood, this caveat effectively may beused to the advantage of CBA in DRM, where process-orientation and inclusion of ahost of stakeholders play critical roles. One tool to organize such a process is sharedlearning dialogues (SLDs), which, by bringing together the perspectives of diversecommunity, expert and government groups, can be used to assess uncertainties.They can also be used to refine and bound assessments of recurrence periods,valuations, etc. As a result, SLDs provide perhaps the best avenue of assessing manyof the variables where quantitative data are lacking or insufficient.
Based on the case studies conducted in India, Pakistan and Nepal in the Risk toResilience project, we explore the above findings in more detail in the followingsections. The next focuses on the essentials of CBA generally. Following that, weoutline key components necessary for utilizing CBA to assess DRM interventions.We continue by providing more detail on these key aspects by discussing theassessment of risk in Section 4, the identification of risk management measures andassociated costs in Section 5, the analysis of the benefits of risk management inSection 6 and finally provide an outline of methods for calculating the economicefficiency of DRM. In the final sections, 8 and 9, we summarize key aspects of thecase studies conducted and conclude.

4
From Risk to Resilience
Working Paper No. 1

5
The C
ost-B
enefi
t Ana
lysis M
etho
dolog
y
SECTION 2
Essentials of CBA
Cost-benefit analysis (CBA) is an economic technique used to organize, appraiseand present the costs and benefits, and inherent tradeoffs of public investmentprojects and policies taken by governments and public authorities in order toincrease public welfare (Kopp et al., 1997). CBA is similar to (and often confusedwith) rate-of return assessment or financial appraisal methods undertaken inbusiness operations to assess whether investments are profitable or not. Yet, CBAtakes a broader perspective and aims at estimating the overall "profit" for societyrather than mere financial gains accruing to an individual business.
The need for economic evaluation is related to the basic economic functions ofgovernments. These include the allocation of public goods (education, safety, cleanenvironment) and assets (infrastructure), and achieving a more equal distributionof income (e.g. Gramlich, 1981). The overarching objective is to increase per capitaincome and consumption. In order to judge if a project or other investment is aworthwhile undertaking, benefits have to be compared to costs by a commonyardstick. Costs are the opportunity costs of not being able to invest scarcegovernment resources (essentially tax revenue) into other objectives. Broadlyspeaking, if benefits exceed costs then a project should be undertaken. The task ofCBA is to systematically assess the costs and benefits and check whether socialwelfare is indeed maximized. The following box outlines the typical stages of aproject cycle. The stages where CBA may play a key role are marked in bold (Box 1).
General development programming defines guidelines,principles and priorities for development cooperation.The actual project planning starts with projectidentification and specification. This leads to the next,the appraisal stage where project feasibility fromdifferent perspectives is checked. Alternative versions ofa project will be assessed under criteria of social,environmental and economic viability. In a fourth stage,the financing dimension of the projects will bedetermined which is followed by the actual
1. Programming
2. Project identification and specification
3. Appraisal: technical, environmental and economic viability
4. Financing
5. Implementation
6. Evaluation
Source: Based on Benson/Twigg, 2004.
BOX 1Stages of project cycle with stages where CBAcan be used shown in bold face

6
From Risk to Resilience
Working Paper No. 1
implementation. Finally, projects should be evaluated after completion in order todetermine actual project benefits and whether the implemented projects did meetthe expectations (Benson and Twigg, 2004; Brent, 1998).
While CBA's main function is to inform the actual project appraisal stage, it isimportant in the other phases of a project cycle as well. Broad-based analyses mayinform the programming stage regarding priority sectors. CBA may also be used togenerate very specific information in the project identification and specificationstage (pre-project appraisal stage) where it can be used to help select potentialprojects and reject others. In the evaluation phase, CBA is regularly used forassessing if a project really has added value to society.
Pros and Cons of CBA
There are numerous limitations to CBA that must be considered. One importantissue is that CBA does not address the distribution of benefits and costs.1 Societalwelfare is maximized by simply aggregating individual welfare over all peopleaffected and changes therein due to projects and policies. A focus on maximizingwelfare, rather than optimizing its distribution is a consequence (Dasgupta andPearce, 1978). Changes in outcomes of "winners" are lumped together with those of"losers", and compensation between those two groups is not required. Moreover,perceptions regarding who is losing or winning can be subjective. CBA also cannotresolve the strong differences in value judgments that are often present incontroversial projects (for example, nuclear power, bio-technology, rivermanagement, etc.). This distributional issue has been a major reason why the Riskto Resilience project has focused on distributional factors by incorporating them inthe qualitative analyses and shared learning dialogues discussed in the projectsummary (Risk to Resilience Working Paper No. 9) and the case studies. Generally,it is advisable to use CBA in conjunction with other decision support methods,such as cost-efficiency or multi-criteria analysis.
A difficulty with CBA is the challenge of assessing of non-market impacts, such ason health and the environment. Although methods exist for quantifying suchvalues, this often involves difficult ethical judgments, particularly regarding thevalue of human life, for which CBA should be used with caution. Another importantissue is the issue of discounting. In economic efficiency calculations, future benefitsare discounted in relation to current benefits to reflect an (empirically confirmed)preference for living and consuming today versus doing so in the future. Applyinghigh discount rates, as often suggested particularly for development cooperation,expresses a strong preference for the present while potentially shifting largeburdens to future generations assuming future generations will be better off andable to deal with those burdens. Yet, this underlying key assumption is not valid
1 A key tenet of CBA is that those benefiting from a specific project or policy should potentially be able tocompensate those that are disadvantaged by it (Dasgupta and Pearce, 1978). Whether compensation is actuallydone, however, is often not of importance. Also, methods to account for the distribution of costs and benefitsexist, but are hardly used in practice due to the additional methodological complexity involved (Little andMirrlees, 1990).

7
The C
ost-B
enefi
t Ana
lysis M
etho
dolog
y
when impacts are large-scale and irreversible, and consequently the application of adiscount rate demands careful scrutiny. For example, for the analysis ofembankments in the Uttar Pradesh flood case, when following strictly an analysisthat focuses on engineering benefits only, high benefit/cost ratios in terms of floodlosses avoided are calculated. Yet, given the many disbenefits such large-scaleinfrastructure brings about (waterlogging, health disamenities, etc.) and associateduncertainties with such estimates, it cannot reasonably be concluded thatembankments have historically performed economically satisfactorily.
Time and scale of projects are important considerations when doing a CBA. Whileoriginally strictly focused on a project level, CBA has frequently been used toinform larger-scale investment decisions such as dam construction and other largescale infrastructural development such as the siting of airports and nuclearreactors, It has even been used to inform global climate change policy related to theUNFCCC negotiations. Generally, as the scale and time horizon of projects andthus uncertainties increases, as illustrated in the accompanying chart, it isimportant to question the usefulness and robustness of CBA.
Yet, keeping these limitations in mind, CBA can be a usefultool and its main strength is its explicit and rigorousaccounting of those gains and losses that can be effectivelymonetized, and in so doing, making decisions moretransparent. CBA is a framework that supports coherentand systematic decision-making and provides a commonyardstick with a money metric against which to measureprojects (Kopp et al., 1997). However, CBA has to be seen asa guide to decision-making and leading to an approximationof preferences of society rather than an expression of theexact economic value of a given investment. CBA andeconomic efficiency considerations should not be solecriterion for evaluating policies. They should rather be partof a larger decision-making framework incorporating social, economic and culturalconsiderations. However to many (government) decision-makers, economicefficiency is the most important aspect. In the USA, for example, cost-benefitconsiderations have "at times dominated the policy debate on natural hazards"(Burby, 1991).
Source: Gowdy, 2007
CBA of no use
GlobalWarming
A large-scale dam project
Localproject
TimeCBA very useful
Scale
| FIGURE 1 | Usefulness of CBA in time and space

8
From Risk to Resilience
Working Paper No. 1

9
The C
ost-B
enefi
t Ana
lysis M
etho
dolog
y
In the context of DRM, two important issues deserve special attention whenconducting a CBA.
1. Assessment of risk: The analysis should be done in a stochastic manner in orderto account for the specific nature of natural hazards and associated disasterimpacts. This is to say that analyses should take account of the probability offuture disaster events occurring.
2. Assessment of avoided risks: As disaster risk is a downside risk, benefits are therisks avoided. The core benefit generated by investments in disaster riskmanagement is the reduction in future impacts and losses.
For the DRM context, we operationalize the CBA process in four steps as shown inFigure 2.
| FIGURE 2 | Framework for estimating risk as a function of hazard and vulnerability
SECTION 3
Application of CBA to DisasterRisk Management

10
From Risk to Resilience
Working Paper No. 1
1. Risk analysis: risk in terms of potential impacts without risk management has tobe estimated. This entails estimating and combining hazard(s), exposure andvulnerability.
2. Identification of risk management measures and associated costs: based on theassessment of risk, potential risk management projects and alternatives and theircosts can be identified.
3. Analysis of risk reduction: benefits of reducing risk are estimated.4. Calculation of economic efficiency: finally, economic efficiency is assessed by
comparing benefits and costs.
In the following sections, we will go through each of these steps in detail.
Risk Analysis
Risk is commonly defined as the probability of potential impacts affecting people,assets or the environment. Natural disasters may cause a variety of effects which areusually classified into social, economic, and environmental impacts as well asaccording to whether they are triggered directly by the event or occur over time asindirect or macroeconomic effects (Figure 3).
The standard approach for estimating natural disaster risk and potential impacts is tounderstand natural disaster risk as a function of hazard, exposure and vulnerability.
Hazard
Hazard analysis involves determining the type of hazards affecting a certain area witha specific intensity and recurrency period in order derive a stochastic representationof the hazard. In order to systematically represent weather, a climate downscalingmodel is a useful tool for generating scenarios future rainfall or temperature valuesconditioned on observed weather and climate change projections. As climate change isalready happening and is projected to effect low magnitude variability and extreme
| FIGURE 3 | Natural disaster risk and categories of potential disaster impacts

11
The C
ost-B
enefi
t Ana
lysis M
etho
dolog
y
weather-related events in terms of frequency and/or severity in many places, asmost prominently elaborated in the 4th assessment report of the IPCC (Solomon etal., 2007), its effect on hazards needs to be factored into the analysis. In order toderive a representation of regional or local future weather, information of globalclimate models has to be downscaled to the local conditions. This involvesconsiderable expertise and resources and requires substantial data. It is importantto recognize that the validity of probabalistic cost-benefit analyses depends heavilyon the accuracy and robustness of results from downscaling. If high levels ofuncertainty exist regarding the accuracy of future projections, then there is littlebasis for making probabilistic estimates of costs and benefits.
Exposure
The exposure of people, assets and the environment to a certain hazard needs to beidentified next. This involves assessing current and future socioeconomic, landuseand other trends. Accounting for changes in exposure is important, as reductions infuture damages and losses often may be compensated by the sheer increase inpeople and assets in harm's way.
Vulnerability
People's vulnerability to hazards of a specific intensity and recurrence period haveto be assessed as part of cost-benefit analysis. Vulnerability is a multidimensionalconcept encompassing a large number of factors that can be grouped into physical,economical, social and environmental factors (see GTZ, 2004). In order tooperationalize and estimate vulnerability for CBA purposes, it can be defined (andwe do so for the Risk to Resilience project) more narrowly as the degree of impactobserved on people and exposed elements as a function of the intensity of a hazard.
In addition to exposure and vulnerability, resilience -- the ability to "bounce" backto pre-disaster conditions -- is an important dimension of vulnerability. Resiliencedecreases vulnerability. The size and duration of indirect impacts strongly depends,for example, on resilience. In contrast to exposure and vulnerability (concepts thatfocus more on the immediate impacts of disasters), resilience has a longer timeframe and relates more to the secondary impacts of disasters. Appropriateorganizational structures for prevention, mitigation and response have a decisiveinfluence on resilience. Risk is the combination of hazard and vulnerability.Estimates of it can be used to identify the potential effects to be expected. Riskmanagement projects aim at reducing these effects. It is difficult to capture thenumerous factors that contribute to resilience (such as availability oforganizational structure and know-how to prevent and deal with disasters) inquantitative terms. As a result, resilience is often not addressed effectively. This is,again, a major reason for coupling quantitative techniques with more qualitativeassessment measures and processes. Discussions in shared learning dialogues, forexample, often highlight factors that contribute to resilience but are absent inofficial data sets or difficult to quantify.

12
From Risk to Resilience
Working Paper No. 1
Data Sources and Availability
Table 1 gives an overview of key data sources useful for estimating risk. Collectingdata on the elements of risk can be time-intensive and difficult. Particularly,information on the degree of damage due to a certain hazard is usually not readilyavailable. As a consequence, in some instances, estimates need to be based on pastimpacts.
Scientific publications and official statistics, post-disasterpublications, geological meteorological and water authorities,local governments. Disaster management authorities.For climate change: global circulation models, regionaldownscaling.
Statistical agencies, private firms. Disaster managementauthorities
Specialized engineering reports. Disaster managementauthorities
Official post- disaster publications. Standardized databases.Local, regional and national governments, industry andcommercial groups. Disaster management authorities
Hazard
Exposure
Vulnerability
Impacts of pastevents
Component Comment on data availabilityData source
Reliable weather and climate dataoften not available or incomplete.The need for climate downscalingand climate change informationadds considerable complexity
Often some data available
Usually not available, oftenapproximated by using informationfrom other sources or from pastevents. Need to do survey or useexpert assessment.
Normally some data available,normally on direct economic impactsas well as direct social (loss of life)
| TABLE 1 | Data sources for hazard, exposure, vulnerability and impacts information
In the Risk to Resilience project, most of the primary information required toevaluate hazards has been collected through the initial scoping activities andassociated searches of available databases. Exposure and vulnerability data havebeen taken from secondary data sources. Information on future climatic conditionswas required and necessitated a major investment in climate downscaling toestimate future rainfall patterns in the Uttar Pradesh case studies in India (see Riskto Resilience Working Paper No. 3). In addition, a survey was conducted for theflood and drought studies in Uttar Pradesh, leading to an extensive database onexposure and vulnerability of rural households. This information has beensupplemented and cross-checked through the shared learning dialogue processes.Despite this extensive data collection and generation effort, data gaps remained andsignificant assumptions were required to estimate costs and benefits.
Overview of Risk and Potential Impacts
The combination of hazard, exposure and vulnerability leads to risk and thepotential impacts a natural hazard may cause. Risk is commonly defined as theprobability of a certain event multiplied by the impacts. In most cases there are alarge number of potential impacts. In practice however, only a limited amount ofthese impacts can and usually are assessed. Table 2 presents the main indicators forwhich usually at least some data can be found.

13
The C
ost-B
enefi
t Ana
lysis M
etho
dolog
y
The list of indicators is structured around three broad categories: social, economicand environmental; whether the effects are direct or indirect; and whether they areoriginally indicated in monetary or non-monetary terms (Table 3). Options formonetizing non-monetary data will be discussed further below.
Social consequences may affect individuals, households or have a bearing at thesocietal level. Most relevant direct effects are the loss of life, people injured andaffected, loss of important memorabilia (e.g. pictures or other sentimental, non-replaceable items), damage to cultural and heritage sites (in addition to themonetary loss). Indirect social effects include: increases in diseases (such as choleraand malaria), increases in stress symptoms or increased incidence of depression,disruption in school attendance, disruptions to the social fabric, disruption ofliving environments and the loss of social contacts and relationships post-event.
Economic impacts are usually grouped into three categories: direct, indirect, andmacroeconomic (also called secondary) effects (ECLAC, 2003). These effects fall intostock and flow effects. Direct economic damages are mostly the immediate damages
Categories of impacts Characteristics
Direct
Indirect
Monetary
Non-monetary
Due to direct contact with disaster, immediate effect
Occur as a result of the direct impacts, medium-long term effect
Impacts that have a market value and will be measured in monetary terms
Non-market impacts, such as health or environmental impacts
| TABLE 3 | Categories and characteristics of disaster impacts
| TABLE 2 | Summary of quantifiable disaster impacts/benefits
Non–monetaryMonetaryDirect
Social
Household Number of casualtiesNumber of injuredNumber affected
Increase of diseasesStress symptom
EconomicPrivate Sector
Household Housing damaged ordestroyed
Loss of wages,reduced purchasing power
Increase in poverty
Public SectorEducationHealthWater and sewageElectricityTransportEmergency spending
Assets destroyed ordamaged:
building, roads,machinery, etc.
Loss of infrastructureservices
Economic SectorsAgricultureIndustryCommerceServices
Assets destroyed ordamaged:building,
machinery, crops,etc.
Losses Due to reducedproduction
Environmental Loss of natural habitats Effects of biodiversity
Total
Indirect Direct Indirect

14
From Risk to Resilience
Working Paper No. 1
or destruction to assets or "stocks", due to the event per se. A smaller portion of theselosses results from the loss of already produced goods. The direct stock damageshave indirect impacts on the "flow" of goods and services. Indirect economic lossesoccur as a consequence of physical destruction affecting households and firms. Mostimportant indirect economic impacts include:
• Diminished production/service due to interruption of economic activity,• Increased prices due to interruption of economic activity leading to reduction of
household income,• Increased costs as a consequence of destroyed roads, e.g. due to detours for
distributing goods or going to work,• Loss or reduction of wages due to business interruption.
Assessing the macroeconomic impacts involves estimating the aggregate impacts oneconomic variables like gross domestic product (GDP), consumption and inflationdue to the effects of disasters, as well as, due to the reallocation of governmentresources to relief and reconstruction efforts. As the macroeconomic effects reflectindirect effects as well as the relief and restoration effort, these effects cannot simplybe added to the direct and indirect effects without duplication. Such effects arealready partially accounted for by the effects already incorporated in the analysis(ECLAC, 2003).2 It should be kept in mind that the social and environmentalconsequences also have economic repercussions. The reverse is also true since loss ofbusiness and livelihoods can affect human health and well-being and localenvironmental sustainability.
Environmental impacts generally fall into two categories. The first category consists ofimpacts on the environment as a provider of assets that can be made use of (usevalues). Impacts on water for consumption or irrigation purposes or soil foragricultural production are examples of this. These impacts are or should be taken careof in the valuation of economic impacts. The second category relates to theenvironment as creating non-use or amenity values. Effects on biodiversity and naturalhabitats fall into this category where there is not a direct, measurable monetarybenefit, but ethical or other reasons exist for protecting these assets and services.
Natural disasters often also may have positive effects such as an increase of pasturearea for raising livestock, increased water availability or replenishment of aquifers.When planning preventive measures, these benefits can often be made use of andthus do not need to be subtracted. Furthermore, in the indirect effects on economicsectors such as agriculture (increase in livestock numbers), or in the constructionsector (reconstruction boom post-event) these positive effects already appear. Forthis reason, and as the adverse impacts of disasters generally by far overshadow thepositive effects, the positive effects are not listed separately in the following section.
2 There is some discussion in the literature concerning potential double-counting involved in adding direct andindirect impacts; this is due to the relation between direct impacts on assets (quantity at a single point in time)and indirect effects on flows (services/cash flows due to using the stocks over time). However, this argumentassumes that all direct and indirect impacts can be assessed and the cost concept used for valuing asset losses isthat of the book value (purchase value less depreciation), which are not realistic assumptions for disaster impactassessment. In applied impact assessments and CBAs deriving order of magnitude estimates and often usingreconstruction values generally direct and indirect impacts are added up (see ECLAC, 2003).

15
The C
ost-B
enefi
t Ana
lysis M
etho
dolog
y
SECTION 4
Assessing Risks
Risks – and benefits when reduced, transferred or avoided – that can be measured areincluded in quantitative cost-benefit analyses. Often, an attempt is made to monetizecosts or benefits that are not indicated in such a metric, such as loss of life,environmental impacts, etc. However, as is generally the case with CBA, some effectsand benefits will always be left out of the analysis due to estimation problems.
Generally, in assessing risk, revealed vs. expressed preference approaches can bedistinguished (Penning-Rowsell et al., 1992). In the revealed preference approach,available market prices for goods, such as those needed for reconstructing a damagedbuilding, are used. In practice, this involves adding up potential avoided impacts interms of reconstruction costs. Alternatively, in the expressed preference approach, thevalue of a non-marketed good, such as the value of flood protection, is directly elicitedby asking the potentially affected individuals or businesses. The revealed preferenceapproach is more common and followed in disaster risk management due to thegeneral availability of some data, while for the expressed preference method, specificsurveys would be required.
For the expressed preferences, there is a large collection of literature on themonetization of non-market impacts, particularly driven by the application of CBA inthe field of environmental economics. Methods can be broken down into indirect anddirect methods. Direct preference assessment is done by means of contingentvaluation where subjects are surveyed and their preferences determined (e.g.willingness to accept a change in the environment, willingness to pay for avoidingpremature death). One important application is the valuation of life (Value of aStatistical Life (VSL)) that is based on assessing the willingness to pay for avoidingpremature death. A major problem is the resulting differential in values betweendeveloped and less-developed countries as the willingness to pay is proportional toincome. The indirect method estimates the value attached to risk reduction based onactual market behaviour. The medical costs for treating a disease or the income lostdue to disease or death is a good example of this.

16
From Risk to Resilience
Working Paper No. 1
Representing Risk and Uncertainty
Disaster risk so far has been defined as the probability of potential impacts affectingpeople, assets or the environment, but at this point an important distinction shouldbe made between risk and uncertainty.
If the probability of events and impacts can be determined, one talks of risk("measured uncertainty"); if probabilities cannot be attached to such events, this is acase of uncertainty. A standard statistical concept for the representation of naturaldisaster risk is the loss-frequency curve, which indicates the exceedance probabilityof an event not exceeding a certain level of damages. Another important concept, isthe inverse of the exceedance probability, the recurrence period. The recurrenceperiod can be thought of as an event with a recurrence of 100 years will on averageonly occur every 100 years. It has to be kept in mind that this is a standardstatistical concept allowing calculation of events and its consequences in aprobabilistic manner. A 100 year event could also occur twice or more times in acentury, the probability of such occurrences however, being low. In order to avoidmisinterpretation, the exceedance probability is often a better concept than therecurrence period. As one example, Table 4 and Figure 4 list values calculated for thecase of drought risk in Uttar Pradesh.
In this case, damages due to the 10, 50, 100 and 200-year drought events were estimated.For example, the 100-year event, which is an event with an annual probability of 1%, was
estimated to lead to losses of about 1670 INRper household. The last column shows theproduct of probability times the damages; thesum of all these products is the expected annualloss.
Another important property of loss-frequency curves is the area under the curve.This area (the sum of all damages weighted byits probabilities) represents the expectedannual value of damages, i.e. the annualamount of damages that can be expected tooccur over a longer time horizon. Thisconcept helps in translating infrequent eventsand damage values into an annual number
| FIGURE 4 | Example of loss-frequency distribution
Recurrence (years) Annual probability
1050
100200
Damages(INR/household)
Risk=Probability x Damages
(INR/household)
10.0%2.0%1.0%0.5%
0675
1,6723,344
0.013.516.716.7
46.95Annual expected loss
| TABLE 4 | Risk as represented by the loss-frequency function for drought risk in Uttar Pradesh
17
The C
ost-B
enefi
t Ana
lysis M
etho
dolog
y
that can be used for planning purposes. Theoretically, values for a substantialnumber of points on the curve are required for accuracy. However, only a smallnumber of values were available in this example. This is often the case sinceinfrequent large magnitude events are the most common cause of disaster. As aresult, in disaster risk management events up to 200, sometimes 500-year returnperiods are considered. Thus, potential disaster impacts have to be understood asan approximation and uncertainty of these calculations has to be acknowledged.
Means vs. Variability
In an expected value analysis, risk (represented by the probability distribution) issummarized by the expected, average outcome. This means, however, losing aconsiderable amount of information. As indicated above, natural disasters arenot at all average or annual events, but characterized by their low-frequency,high-consequence nature. In contrast to a normal distribution, the mean/expected value does not well represent the relationship. For disaster events, it isalso desirable to account for the variability of potential outcomes. In theory,limiting the analysis to average values is only permissible if there is riskneutrality, i.e. risk in terms of the variability of outcomes (extremes) is notimportant and can be handled. This risk-neutrality assumption generally holdstrue for developed countries, but is less applicable to lower-income, hazard-pronecountries. Government decisions should be based on the opportunity costs tosociety of the resources invested in the project and on the loss of economic assets,functions and products. In view of the responsibility vested in the public sectorfor the administration of scarce resources, and considering issues such as fiscaldebt, trade balances, income distribution, and a wide range of other economic,social, and political concerns, governments should not act risk-neutrally (OAS,1991; Mechler, 2005).
An approach that is useful if variability matters and risk aversion is prevalent, isthe mean-variance (EV) method. As the term suggests, this method takes accountof the mean and variance (to account for variability) of a probability distribution.The EV method is often used in portfolio analysis in finance theory andapplications. The EV method in essence relies on the mean and variance wherebythe variance is used to measure volatility around the mean.3
3 The EV method is based on the Expected Utility (EU) framework, which is a standard method of dealing with riskin economics. The EV method basically relies on the mean and variance of the outcome variables and weights thevariance by a risk aversion parameter as follows:
Where Y* the CE, E(Y) expected/mean income, RP: risk premium, R risk aversion parameter, V(Y) variance ofincome, Y average income.
Thus, the method accounts for the average impacts of catastrophes as well as for the extremes and volatility. It alsoconsiders the ability to cope with disasters by including the risk aversion parameter. If there is (perceived) riskneutrality, the analysis can be reduced to calculating averages.
* )(*
2-E(Y)E(Y)Y
Y
YVRRP =−=
18
From Risk to Resilience
Working Paper No. 1
Uncertainty
Estimating extreme event risk and the benefits of risk reduction is fraught with asubstantial amount of uncertainty. As demonstrated by the Uttar Pradeshdrought case (Risk to Resilience Working Paper No. 5), as disasters by definitionare low-frequency, high consequence events. Uncertainties are inherent in
Hazard recurrence: estimates are often only based on a limited number of datapoints. As noted above, this is a particular challenge in the context of climatechange where the frequency and intensity of major weather events is likely tochange in fundamental ways.Incomplete damage assessments: data will not be available for all relevantdirect and indirect effects, particularly so for the non-monetary effects.Vulnerability: Information to construct vulnerability curves often does notexist.Exposure: the dynamics of population increase and urban expansion, increaseof welfare need to be accounted for.Benefits of risk management estimates: often difficult to accurately measurethe effects and benefits of risk management measures.Discounting: the discount rate used reduces benefits over the lifetime of aproject and thus has a very important impact on the result.Valuation issues: exchange rates, deflators and different cost concepts(replacement, market values) used.Additionally for climate change, uncertainties are due to estimating thechanges in frequency and intensity of natural hazards, especially when historicrecords are incomplete
When fitting probability distributions to a limited number of data points, lossesmay be overestimated or underestimated relative to the "true" loss probabilityrelationship. Of course, in practice the "true" relationship is never known. With anincreasing amount of data, the approximation to the underlying relationship mayimprove. However, as discussed above, often the number of data points that canbe derived is limited due to lack of underlying primary data or time and moneyconstraints. Thus, where possible uncertainties should be assessed, caution isessential when using estimates of risk to evaluate the benefits of risk reduction.
This is again another point that emphasizes the importance of linkingquantitative CB analyses with more qualitative assessments and stakeholderinputs through shared learning dialogues. Shared learning dialogues, by bringingtogether the perspectives of diverse community, expert and government groups,can be used to assess uncertainties. They can also be used to refine and boundassessments of recurrence periods, valuations, etc. As a result, they provideperhaps the best avenue of assessing many of the variables where quantitativedata are lacking or insufficient.
19
The C
ost-B
enefi
t Ana
lysis M
etho
dolog
y
SECTION 5
Identification of Risk ManagementMeasures and Associated Costs
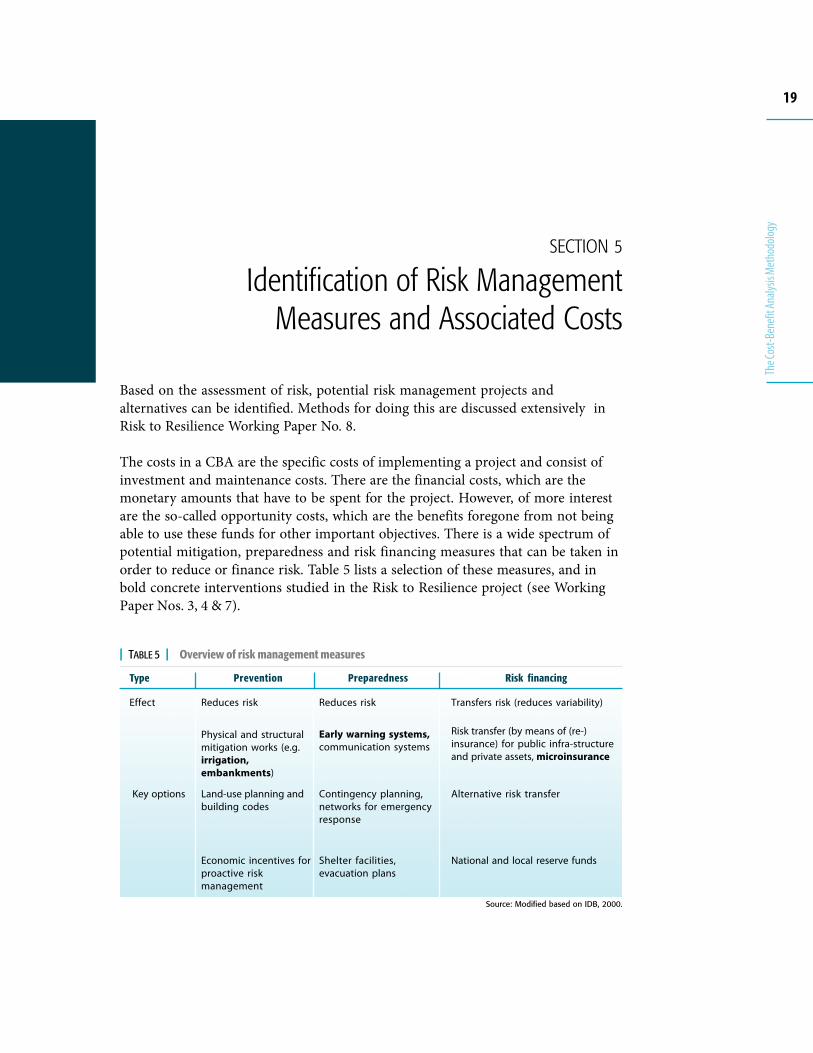
Based on the assessment of risk, potential risk management projects andalternatives can be identified. Methods for doing this are discussed extensively inRisk to Resilience Working Paper No. 8.
The costs in a CBA are the specific costs of implementing a project and consist ofinvestment and maintenance costs. There are the financial costs, which are themonetary amounts that have to be spent for the project. However, of more interestare the so-called opportunity costs, which are the benefits foregone from not beingable to use these funds for other important objectives. There is a wide spectrum ofpotential mitigation, preparedness and risk financing measures that can be taken inorder to reduce or finance risk. Table 5 lists a selection of these measures, and inbold concrete interventions studied in the Risk to Resilience project (see WorkingPaper Nos. 3, 4 & 7).
Type Prevention Preparedness Risk financing
Effect Reduces risk Transfers risk (reduces variability)Reduces risk
Physical and structuralmitigation works (e.g.irrigation,embankments)
Land-use planning andbuilding codes
Economic incentives forproactive riskmanagement
Early warning systems,communication systems
Contingency planning,networks for emergencyresponse
Shelter facilities,evacuation plans
Alternative risk transfer
Risk transfer (by means of (re-)insurance) for public infra-structureand private assets, microinsurance
National and local reserve funds
Key options
Source: Modified based on IDB, 2000.
| TABLE 5 | Overview of risk management measures

20
From Risk to Resilience
Working Paper No. 1
These measures reduce risk (prevention and preparedness) or transfer and spread iton a larger basis (risk financing). While prevention and preparedness reduce thelosses, insurance and other risk financing instruments lessen the variability of losses,but not directly reducing them, by spreading and pooling risks.4 By providingindemnification in exchange for a premium payment, insured victims benefit fromthe contributions of the many others that are not affected, and thus in the case of adisaster, they receive a contribution greater than their premium payment. However,over the long run, insured persons or governments can expect to pay significantlymore than their losses. This is due to the costs of insurance transactions and thecapital reserved by insurance companies for potential losses (or reinsurance), aswell as the financial return required for absorbing the risks (see also Section 6).
Key information on risk management measures required for quantitative cost-benefit analysis include: (i) the exact type of the option under consideration, (ii) itsplanned lifetime, (iii) the costs, such as investment costs and maintenance costs, (iv)planned funding sources, (v) possibly additional benefits and impacts. We derivedsuch information from interaction with stakeholders during the SLDs. Concerningthe costs of an option, usually there are major initial outlays for the investmenteffort, such as building an irrigation system, followed by smaller maintenanceexpenses occur over time, e.g. for maintaining the system. On the other hand, risktransfer measures usually demand a constant annual payment, e.g. an insurancepremium guaranteeing financial protection in case of an event. These costs normallycan be determined in a straightforward manner as market prices exist for cost itemssuch as labour, material and other inputs. Some uncertainty in these estimatesusually remains as prices for inputs and labour may be subject to fluctuations.Often, project appraisal documents make allowance for such possible fluctuationsby varying cost estimates by a certain percentage when appraising the costs.
4 Insurance and other risk financing mechanisms are based on the Law of large numbers, which states that with anincreasing number of observations the probability distribution can be estimated more precisely and thevariance around the mean decreases.

21
The C
ost-B
enefi
t Ana
lysis M
etho
dolog
y
SECTION 6
Analysis of the Benefits of Risk Management
In a conventional CBA of investment projects,benefits are the additional outcomes generated bythe project compared to the situation without theproject. In the DRM case, however, benefits are therisks that are reduced, avoided or transferred.5
Conceptually it would be ideal to assess the incomeand livelihood consequences (indirect risks) inrelation to the proportionate loss of assets andstructure (direct risks) of disasters for differentgroups. For example, a loss of 10,000 INR has adifferent significance for a poor labourer than to alarge-scale farmer. In the case of the labourer, thisloss would cause severe follow-on consequencessuch as malnutrition and deprivation, whereas thefarmer would be able to absorb this financial losswith few such indirect impacts. Normally, theindirect risks cannot be easily assessed, as thisinvolves conducting surveys, interviews andstatistical and economic analyses. As a result, mostanalysts (including in this study) resort to thedirect effects, which often in a development contextactually understate the "real" impacts.
In order to estimate benefits, the effect ofimplementing DRM activities on risks need to beassessed in relation to the loss-frequency functiondeveloped earlier. As illustrated in Figures 5a and5b, risk reduction activities generate benefits by
| FIGURE 5a | Mechanics of irrigation intervention theUttar Pradesh case
| FIGURE 5b | Mechanics of insurance intervention in theUttar Pradesh case
5 In CBA terminology, they are defined as the willingness-to-pay (WTP) to avoid/reduce risks. The WTP generallyreflects the preferences of economic agents (households,business, public sector).

22
From Risk to Resilience
Working Paper No. 1
shifting the loss frequency curve downward in the areas where the interventionreduces disaster impacts. Risks may be completely avoided, reduced, or transferred.As an illustrative example, we consider the Uttar Pradesh case of drought risks tofarmer livelihoods with irrigation and insurance interventions to reduce risk (seeRisk to Resilience Working Paper No. 5 for a complete discussion of the case study).The mechanics of these interventions differ importantly.
In the Uttar Pradesh drought case, irrigation (pumping groundwater and irrigatingdrought-affected wheat and rice fields) would help mitigate a rainfall deficit up to a10 year drought event. This is equivalent to receiving 30 mm less in June thanaverage (that is, 120 mm instead of 150 mm). Compared to the irrigation option,where basically a part of the loss-frequency curve is cut off (i.e. risks are reduced),insurance would guarantee a certain payout, if rainfall (or the lack thereof) falls intoa certain range. Here this range would be 20-40 mm rainfall, which is a 130-110 mmrainfall deficit compared to the normal June rainfall of 150 mm, is associated in theillustration with a 50 to 20 year event. As the claim payment after the event isreceived in exchange for a premium payment before the drought, risk is not reducedbut transferred.
Needless to say and as discussed above, certain DRM options may also createdisbenefits. Embankments, for example, can cause waterlogging and associatedincreases in health problems. These negative benefits need to be considered as welland factored in on the benefits side.6
6 They should not be computed on the costs side, in order not to confuse these disbenefits with the fixed andvariable costs of a government or donor sponsoring DRM interventions.

23
The C
ost-B
enefi
t Ana
lysis M
etho
dolog
y
SECTION 7
Calculation of Economic Efficiency
Estimating the economic efficiency of an intervention, the final step, is assessed bycomparing benefits and costs. Costs and benefits arising over time need to bediscounted to render current and future effects comparable. From an economicpoint of view, $1 today has more value than $1 in 10 years, thus future values needto be discounted by a discount rate representing the preference for the present overthe future. Furthermore, costs and benefits are compared under a commoneconomic efficiency decision criterion to assess whether benefits exceed costs.Basically, three decision criteria are of major importance in CBA:
• Net Present Value (NPV): Costs and benefits arising over time are discountedand the difference taken, which is the net discounted benefit in a given year. Thesum of the net benefits is the NPV. A fixed discount rate is used to represent theopportunity costs of using the public funds for the given project. If the NPV ispositive (benefits exceed costs), then a project is considered desirable.
• Benefit/Cost Ratio: The B/C Ratio is a variant of the NPV. The benefits aredivided by the costs. If the ratio is larger than 1, i.e. benefits exceed costs, aproject is considered to add value to society.
• Internal Rate of Return (IRR): Whereas the former two criteria use a fixeddiscount rate, this criterion calculates the interest rate internally, whichrepresents the return on investments in the given project. A project is rateddesirable if this IRR surpasses the average return of public capital determinedbeforehand (e.g. 12%).
In most circumstances, the three methods are equivalent. In the Risk to Resilienceproject, due to its intuitive appeal, we mostly focused on the B/C ratio.
The example below shows the CBA calculations for the case of micro crop insurancein Uttar Pradesh.7 In the first year of the project, the fixed technical assistance costs(for modelling the risks, training staff etc.) for setting up the scheme would dwarf
7 The assessment considered the case of setting up a novel microinsurance scheme for drought-affected farmerpotentially involving an insurance company, NGO, local or state government or a donor, and the insured. Thegovernment or donor would sponsor the technical assistance (fixed costs) and partially subsidize the premium(variable costs). Benefits relate to the reduction in farmer income losses and reduced relief expenditurespending by the government. Key parameters were (per household): 5,000 INR cost of technical assistance,premium of 3.0% of the insured value, 50.0% premium subsidy.

24
From Risk to Resilience
Working Paper No. 1
the benefits. Over time, benefits would arise as income losses are partially offset byinsurance payments (see Risk to Resilience Working Paper No. 5). Given the defaultdiscount rate of 12%, net benefits would amount to approximately 6,000 INR perindividual within the scheme over the 15-year time period considered. Yet, whendiscounting with a rate of 12%, the (discounted) NPV would amount to only 440INR. The B/C ratio is only marginally above 1, and the internal rate of return, aswell, does not significantly surpass the default rate of 12%.
The discount rate has a key influence on the economic efficiency calculations. Figure6 shows the net benefits for a 0%, 5%, and 12% discount rate. Not surprisingly, whena small or zero discount rate is used, the project seems more viable.
| FIGURE 6 | Net benefits of crop insurance option in the Uttar Pradesh drought case and discounting
Year
Costs:technical
assistance andpremiumsubsidy
Discountednet benefits
200820092010201120122013201420152016201720182019202020212022Sum
| TABLE 6 | Calculation of costs and benefits in terms of NPV, B/C ratio and IRR (in INR)
Benefits:increasedincome
households,reduced reliefexpenditure
Netbenefits
Discountedcosts
Discountedbenefits
5,194194194194194194195195196197198199200201203
7,946
880880879882886887900911923936953971993
1,0171,045
13,942
-4,314686686688692693706715727740755773793816842
5,996
5,194173154138123110
998879716457514642
6,489
880785701628563503456412373338307279255233214
6,926
-4,314612547490440393357324294267243222204187172437
1.0713.9%
NPVB/CIRR
Note: A 12% discount rate was used.

25
The C
ost-B
enefi
t Ana
lysis M
etho
dolog
y
SECTION 8
Types of CBA Assessments andRequirements
The type of assessment to be conducted depends upon the objectives of the respectiveCBA, as well as data at hand on the hazard, vulnerability and exposure and finally,impacts. In order to operationalize the assessment of hazard, vulnerability, risk andrisk reduction and considering data and resource limitations for conducting CBAs,two frameworks for quantitative analysis, forward-looking and backward-looking areavailable (Table 7).
Estimate hazard,vulnerability, thencombine with risk,combine with climatemodelling, e.g.regional to localclimate downscaling
Use past damagesas manifestations ofpast risk, thenupdate to current risk
Forward-lookingassessment - risk-based
Backward-lookingassessment - impact-based
More accurate, but time and data-intensive(up to several person years). More applicablefor small scale risk management measures,e.g. retrofitting a school/building againstseismic shocksInput to: Pre-project appraisal or fullproject appraisal
Leads to rougher estimates, but morerealistic and typical for developing countrycontext. More applicable for large scale riskmanagement measures like flood protectionfor river basin with various and differentexposed elements. Need experience withdamages in the past.Time effort: in range of several person-months.Input to: Evaluation (ex-post)Informational study
Type of assessment Data requirementsMethodology Costs and applicability
Locale and asset-specific data onhazards andvulnerability. Minimumof three data points,Global or regionalclimate circulationmodelling
Data on past events,information onchanges in hazard andvulnerability. Minimumof three data points(past disaster events)
| TABLE 7 | Types of assessments in context of CBA under risk and related case studies
In a more rigorous and resource-intensive forward-looking, risk-based approach, dataon hazard and vulnerability are combined and lead to estimates of risk and riskreduction. Ideally in a forward-looking risk assessment, risk can be estimated bycombining information on hazard and vulnerability. Often full-blown riskassessments are not feasible due to data, time and money constraints, particularlywhen the area at risk is large, is exposed to more than one hazard, or there are a largenumber of exposed assets with differential vulnerabilities.
In a more pragmatic backward-looking, impacts-based approach, past damages areoften used as the basis for coming to an understanding of current vulnerability,hazard and potential damages. In such cases, in a backward-looking assessment ofpast damages is used to come to a rough understanding of risk and potential damages.

26
From Risk to Resilience
Working Paper No. 1

27
The C
ost-B
enefi
t Ana
lysis M
etho
dolog
y
SECTION 9
Conclusions
We described the different steps, opportunities and key constraints for conducting aCBA of disaster risk management. This approach forms the backdrop for actuallyconducting CBA assessment in data-poor environments in India and Pakistan. Moredetail on how to actually do a CBA can be found in the Risk to Resilience WorkingPaper Nos. 4, 5, and 7. In addition, a more comprehensive methodology report willbe available through the Risk to Resilience project by the end of 2008.
We conclude with a number of key messages derived from the case study processwhich may be useful when using CBA for informing decisions on DRM.
Clarify objectives of conducting CBAs in DRM
Before engaging in a CBA assessment, it is necessary to clarify the objective,information needs and data situations among the different potential stakeholders,which may comprise representatives from local, regional and national planningagencies, NGOs working in development and disaster risk management, disaster riskmanager, officials concerned with public investments decisions, developmentcooperation staff and local communities. The type of envisaged product is closelylinked to its potential uses and users. A CBA may be conducted for merelyinformational purposes, as a pre-project appraisal, as a full-blown project appraisalor as an ex-post evaluation. Purposes, resource and time commitments and expertiserequired differ significantly for these products. The specific information preferenceswill differ between cases involving a development bank or a municipality, betweensmall-scale and large-scale investments, planning physical infrastructure or capacitybuilding measures, and between mainstreaming risk in CBA vs. CBA for disaster riskmanagement. At an very early stage, it is critical to achieve consensus among theinterested and involved parties on the scope and breadth of the CBA to beundertaken. In the Risk to Resilience project, we pursued this for our case studiesthrough a combination of scoping exercises, shared learning dialogues andqualitative assessment prior to any decision on undertaking a more comprehensiveCBA. Purposes, resource and time commitments and expertise required differsignificantly for these case and associated products as listed in Table 8.

28
From Risk to Resilience
Working Paper No. 1
Often, CBAs and risk assessments are based on past impacts in a backward lookinganalysis. A forward-looking analysis in terms of risk is more complex and resourceintensive, but leads to better results. Due to the higher level of complexity, it is rarelyused. Depending on the objectives that the specific CBA undertaken should serveand resources and expertise available, both approaches can be used. The specificapproach taken as well as assumptions employed should be clearly outlined.
Acknowledge complexities of estimating risk
Estimating risk and the costs and benefits of risk management is inherentlycomplex. Disaster events are in essence, probabilistic events. As a consequence,benefits due to risk management are probabilistic and arise only in the case of eventsoccurring. Benefits should be assessed in terms of probability times consequencesleading to an estimate of risk. However, the treatment of risk in CBA (and DRMgenerally) is often done on an ad-hoc basis and assessments focus on events in thepast rather than potential catastrophes in the future. This may result in anunderestimation of damages and an underinvestment in preventive measures.
Furthermore, the need to account for climate change when assessing future hazardintensity and frequency adds considerable complexity and resource demands, asclimate model downscaling is a key requirement. Often climate modelling does notproduce data in probabilistic format representing natural variability, and as a keyassumption average values, have to be used. In addition, at present substantialuncertainty exists regarding the accuracy of results from climate downscaling. As aresult, cost-benefit analyses utilizing downscaled information on future climaticconditions need to be recognized as scenarios rather than accurate projections.These specific challenges and characteristics of disaster risk management need to beproperly communicated and understood in order to properly interpret resultsderived in a CBA.
In addition to the above, numerous methodological challenges of CBA impact theanalysis. Putting values on non-market impacts such as health impacts andenvironmental aspects is generally difficult and may involve ethical issues such aswhether and how to monetize fatalities. A further challenge is to account for indirecteffects and their reduction or increase (e.g. changes in the prevalence of diseasespost-disaster, higher transport costs due to loss of infrastructure, increased costs
Provide a broad overview over costsand benefitsSingling out most effective measuresfor matters of more detailed evaluationin project appraisalDetailed evaluation of accepting,modifying or rejecting projectEvaluation of project after completion
Informational study
Preproject appraisal
Project appraisal
Evaluation (ex-post)
Lai Basin case (Pakistan), Nepal case
Uttar Pradesh flood case (India)
Uttar Pradesh drought case (India)
Uttar Pradesh flood case (India),Nepal case
+
+ +
+++
+ +
ProductResource and time
commitmentPurpose Case Study
| TABLE 8 | Level of complexities and CBAs conducted in the project

29
The C
ost-B
enefi
t Ana
lysis M
etho
dolog
y
due to business interruption). Indirect damages can be substantial and sometimeseven exceed direct impacts. Yet due to technical difficulties, other impacts such associal and indirect economic effects are rarely included and assessments focusmostly only on direct impacts, which leads to a partial picture of potential disasterimpacts to be avoided.
Process-Orientation
Given the complexities involved in estimating the costs and benefits of DRM,climate change and the history and current usage of CBA as a decision support tool,it seems that the role of CBA in DRM is strongly related to process rather thanoutcome. CBA is a useful tool for organizing, assessing and finally presenting thecost and benefits, pros and cons of interventions. It demands a coherentmethodological, transparent approach. Yet, given that data on extreme event risksare by definition scarce, and impacts often are very significant and subject to changeover time, CBA is probably not as suited to be used as a purely outcome-orientedtool, at least in a data-restricted environment. To put this in another way, theevaluative process involved in conducting a CBA is generally more important andmore reliable as a basis for decision making than the final benefit-cost ratioscalculated. This is particularly true for DRM, where process-orientation andinclusion of a host of stakeholders plays a critical role.
One tool to organize such processes is shared learning dialogues, which, bybringing together the perspectives of diverse community, expert and governmentgroups, can be used to assess uncertainties. They can also be used to refine andbound assessments of recurrence periods, valuations, etc. As a result, SLDs provideperhaps the best avenue of assessing many of the variables where quantitative dataare lacking or insufficient. Focusing on outcome only may defeat the purpose ofbetter mainstreaming DRM - essentially a crosscutting problem - into a host ofdevelopment-related activities where stakeholders with diverse backgrounds andobjectives interact, then decide and implement projects and policy.

30
From Risk to Resilience
Working Paper No. 1
References
Benson, C. and J. Twigg (2004). 'Measuring Mitigation': Methodologies for Assessing NaturalHazard Risks and the Net Benefits of Mitigation - A Scoping Study. ProventionConsortium: Geneva
Brent, R. J. (1998). Cost-Benefit Analysis for Developing Countries. Cheltenham, Edward Elgar.Burby, R., Ed. (1991). Sharing Environmental Risks. How to Control Governments' Losses in
Natural Disasters. Boulder, Colorado, Westview Press.Dasgupta, A. K. and D. W. Pearce (1978). Cost-Benefit Analysis: Theory and Practice. London,
Macmillan.ECLAC (2003). Handbook for Estimating the Socio-economic and Environmental Effects of
Disasters. ECLAC, Mexico City.Gowdy, J. (2007). Toward an experimental foundation for benefit-cost analysis. Ecological
Economics 63 (2007): 649-655Gramlich, E. M. (1981). Benefit-Cost Analysis of Government Programs. Englewood Cliffs,
Prentice-Hall.GTZ (2001). Disaster risk management. Working concept paper. Eschborn.GTZ (2004). Risk analysis - a basis for disaster risk management. Guidelines. Eschborn.IDB (2000). Facing the Challenge of Natural Disasters in Latin America and the Caribbean. An
IDB Action Plan. Washington DC, Inter-American Development Bank.Little, I. and J. Mirrlees (1990). Project Appraisal and Planning Twenty Years on. Proceedings of
the World Bank Annual Conference on Development Economics. S. Fischer.Washington DC: 351-382.
Kopp, R. J., et al. (1997). Cost-Benefit Analysis and Regulatory Reform: An Assessment of theScience and the Art. Discussion paper 97-19. Washington DC, Resources for the Future.
Mechler, R. (2005). Cost-Benefit Analysis of Natural Disaster Risk Management in Developingand Emerging Countries. Manual. Working paper, GTZ, Eschborn.
OAS (1991). Primer on Natural Hazard Management in Integrated Regional DevelopmentPlanning. Washington DC, Organization of American States.
Penning-Rowsell, E., C. Green, P. Thompson, A. Coker, S. Tunstall, C. Richards, D. Parker (1992).The Economics of Coastal Management - A Manual of Benefit Assessment Techniques(The Yellow Manual). London.
Solomon, S. et al. (eds). Climate Change (2007): The Physical Science Basis - Contribution ofWorking Group I to the Fourth Assessment Report of the IPCC (Cambridge Univ. Press).
31
The C
ost-B
enefi
t Ana
lysis M
etho
dolog
y
Annex I: Working Paper Series
TitleThe Cost-Benefit AnalysisMethodology
Pinning Down Vulnerability: FromNarratives to Numbers
Downscaling: Potential ClimateChange Impacts in the Rohini Basin,Nepal and India
Evaluating Costs and Benefits ofFlood Reduction Under ChangingClimatic Conditions:Case of the Rohini River Basin, India
Uttar Pradesh Drought Cost-BenefitAnalysis, India
Costs and Benefits of FloodMitigation in the Lower BagmatiBasin: Case of Nepal Tarai andNorth Bihar, India
Pakistan Case Study: Evaluating theCosts and Benefits of Disaster RiskReduction under Changing ClimaticConditions
Moving from Concepts to Practice: AProcess and Methodology Summaryfor Identifying Effective Avenues forRisk Management Under ChangingClimatic Conditions
Understanding the Costs andBenefits of Disaster Risk Reductionunder Changing Climatic Conditions
Lead AuthorsReinhard Mechler (IIASA)
Daanish Mustafa (KCL); SaraAhmed, Eva Saroch (ISET-India)
Sarah Opitz-Stapleton (ISET);Subhrendu Gangopadhyay(University of Colorado, Boulder)
Daniel Kull (IIASA); Praveen Singh,Shashikant Chopde (WII); Shiraz A.Wajih (GEAG)
Reinhard Mechler, StefanHochrainer, Daniel Kull (IIASA);Praveen Singh, Shashikant Chopde(WII); Shiraz A. Wajih (GEAG)
Ajaya Dixit, Anil Pokhrel (ISET-Nepal); Marcus Moench (ISET)
Fawad Khan (ISET-Pakistan);Daanish Mustafa (KCL); Daniel Kull(IIASA)
Marcus Moench (ISET); Sara Ahmed(ISET-India); Reinhard Mechler (IIASA);Daanish Mustafa (KCL); Ajaya Dixit(ISET-Nepal); Sarah Opitz-Stapleton(ISET); Fawad Khan (ISET-Pakistan);Daniel Kull (IIASA)
Marcus Moench (ISET)
FocusCBA methods
VCI methods
Climate downscaling methods
India floods
India drought
Nepal Tarai and North Bihar floods
Pakistan (urban) floods
Methodology summary
Summary report
WorkingPaperNumberWP 1
WP 2
WP 3
WP 4
WP 5
WP 6
WP 7
WP 8
WP 9

32
From Risk to Resilience
Working Paper No. 1
This paper provides insights from an evaluation of the costs and benefits of disasterrisk reduction and adaptation to climate change in South Asia. The report is basedon a set of work undertaken in the Nepal Tarai, Eastern Uttar Pradesh, andRawalpindi, Pakistan. The progamme as a whole is financed by DFID and has beenundertaken in conjunction with related activities supported by IDRC, NOAA andProVention. The support of all these organizations is gratefully acknowledged.Numerous organizations and individuals have contributed in a substantive way tothe successful completion of this report. The core group of partners undertakingfield work and analysis included: Reinhard Mechler, Daniel Kull, Stefan Hochrainer,Unmesh Patnaik and Joanne Bayer from IIASA in Austria; Sara Ahmed, ISETAssociate, Eva Saroch; Shashikant Chopde, Praveen Singh, Sunandan Tiwari,Mamta Borgoyary and Sharmistha Bose of Winrock International India; AjayaDixit and Anil Pokhrel from ISET-Nepal; Marcus Moench and Sarah Opitz-Stapleton from ISET; Syed Ayub Qutub from PIEDAR, Pakistan; Shiraz A. Wajih,Abhilash Srivastav and Gyaneshwar Singh of Gorakhpur Environmental ActionGroup in Gorakhpur, Uttar Pradesh, India; Madhukar Upadhya and Kanchan ManiDixit from Nepal Water Conservation Foundation in Kathmandu; DaanishMustafa from King's College London; Fawad Khan, ISET Associate and Atta urRehman Sheikh; Subhrendu Gangopadhyay of Environmental Studies Program,University of Colorado, Boulder. Shashikant Chopde and Sonam Bennett-Vasseuxfrom ISET made substantive editorial and other contributions to the project.Substantive inputs from field research were also contributed in India, Nepal andPakistan by numerous dedicated field staff and individuals in government and non-government organizations as well as the local communities that they interacted with.
Annex II: Acknowledgements


9 7 8 9 9 3 7 8 0 1 9 6 6