the correct measurement and interpretation of evaluation … · 2017-08-27 · the german version...
TRANSCRIPT

The German version of this contribution has been published in issue 7/76 of Chromatographia and animated discussion. The author and the editors present herewith the English version for wider discussion.
The Correct Measurement and Interpretation of Evaluation Factors in Chromatography: The Real Plate Number, the Separation Number, the Dosage quality, r Part 1 : Gas Chromatography
R. E, Kaiser Institute for Chromatography, P.O. Box 1308, D-6702 Bad DiJrkheim, W. Germany
Summary
"The correct evaluation of separation columns, capillary columns, their interconnections and the dosage technique is important in gas chromatography as well as in l iquid chromatographic methods.
The conventional, theoretical plate number or plate height and their corresponding effective values (effective plate number or effective plate height) represent the combined action of column quality, interconnections and dosage, rather than their individual contributions to the overall performance of the separation system. Since these chromatographic criteria are dependent on the nature of the sample and the methods, a directed improvement or selective evaluation is not possible. A new evaluation system and method of measurement with the following characteristics is proposed:
1. Substance independent, L e., independent of the chromatographic position.
2. Real evaluation of a separation column.
3. Individual, quantitative evaluation and measurement of factors which have a negative influence on the overall performance of a separation system, such as dosage, interconnections and detector.
4. A meaningful correlation between the basic factors, which determine the separation capability and the separation power.
The real plate number nreal the real plate height hreal the dosage and interconnection quality Qs the separation number TZreal the separation power number TZt
and:the independent optimization of these fact'ors, with respect to a maximum separation allow a correct, com- parative evaluation of entirely different chromatographic separation systems. Such an evaluation requires three to eight data pairs, consisting of (correctly measured) peak width and retention data and a statistical regression calculation or inter- and extrapolating by plotting. The measurements and calculations can be carried out within 5 minutes. Highly conclusive evaluation factors (which must be statistically secured by additional calculations)
are obtained. The basic evaluation procedures will be explained, and examples will be given for the method o f measurement, the calculation and plotting techniques. (programs for the Hewlett-Packard calculator HP-67 or 97 is provided.) Applications wil l be discussed for convention- ally packed columns, extremely short or long micropacked columns, and thin fi lm capillaries. Part 2 deals with adaptation of the method to l iquid column chromato- graphy, and part 3 discusses the application of the method to high performance and normal layer chromatography as well as a comparison of the methods.
It is often claimed, that the theoretical plate number is "'theoretically" dependent on k and that the air peak (in GC) cannot be used to evaluate the quafity of a chro- matogram. This is an interpretation error or a mis- understanding of the method of measurement and wil l be discussed in depth, thus the basis of the new method can be criticafly compared and examined with the conventional evaluation method. The derivations are designed in such a way, that newcomers in the field, wil l be able to apply th'e method.
The theoretical background of this paper is discussed in Chromatographia 1976 and 1977.
Measurement and evaluation of the real separation capability and the real separation power in isocratic elution chromatography.
Part 1 : Gas Chromatography
In the following, a measuring and evaluation technique will be described which is:
�9 Simple �9 Accessible by a few measurements �9 Reliable and conclusive method to evaluate three
basic criteria in chromatography:
1. How good is a separation system? 2. Is it utilized fully?
3. How good is it opt imized with respect to separation capabil i ty and separation power?
Chromatographia, Vol. 10, No. 6, June 1977 323

The new measuring and evaluation system can be applied to :
A) Gas chromatography (without any restrictions)
B) Liquid-elution chromatography (problems may arise in the determination of the substance-dependent hold-up volume, or hold-up time.)
C) Thin layer chromatography (here, mistakes are easily made if the specified measuring devices are not used.)
In the author's laboratory, the new measuring and evalua- tion method has lead to definite improvements of analytical procedures and (surprisingly) of instruments used in practical chromatography. Impregnation procedures, separation systems, dosage devices, interconnections and installation techniques could be improved. For the first time, by means of a few analytical data, it was possible to obtain conclusive information on the effectiveness of a certain method of operation (i. e., the use and utilization of a separation system by an operator) and on the optimi- zation of a given separation system, using statistically secured, substance independent conditions.
Now it is possible to optimize a gas chromatograph with respect to maximum separation capability or maximum separation power, where the combined action of separa- tion and dosage can be evaluated separately. The author feels, that the results are so convincing, that the con- ventional measuring and evaluation system which uses the theoretical and effective plate number and other derived terms can be disregarded. The new method eliminates the discrepancy between theory and practice, which was the reason (especially in capillary gas chro- matography) for the introduction of the term effective plate number.
A simple demonstratiorfwill show that the theoretical plate number, the theoretical plate height, and their corresponding "effective" values are substance-dependent only because the starting width of the peaks was not considered in the measurement, a fact, which was pointed out already in 1959 [ 1 ]. Therefore, the known depend-
ence of the plate number n and neff from the retention data, i. e., from the substance, is only a misunderstanding of the measuring technique and not the theory. Con- clusions, such as n or nef f depend on the test substance because of theoretical reasons are therefore simply wrong. Both numbers rather depend on the way the test sub- stance is dosed and the column is connected, that means on a factor completely independent of the separation system. Another drawback of the conventional evaluation numbers is the fact that they are obtained from one sub- stance, although they are aimed to evaluate the separation quality. However, a separation requires at least two sub- stances.
The term which replaces ntheoretica 1 and neffective is nreal- It is independent of the nature of the substance, of the dosage technique by which the substance was applied and connection details. The influence of the dosage technique and interconnection technique on the separation capa- bility can be determined separately and quantitatively as
Qs.
Qs is a factor whose numerical value is always lower than 1. Multiplied by 100, it expresses the degree of efficient utilization (in percentage) of a column or capillary, there- fore the term "utilization factor" could also be applied t o Q s. An examination of the possibilities to optimize Qs (Qs approaches 1 ; i. e., 100 % of the available separation capability is used') reveal quickly the factors which control it (e. g., Qs is strongly dependent on the particular gas flow.) Qs can assume values between 0.95 and 0.98. This has an tremendous influence on the operational method, tools, connecting and'installation technique.
The new method does not require any mathematical skill. The reader should be familiar with some of the rules of the Euclidean geometry (the law of similar triangles etc.). It is also helpful if the reader has some experience in the general evaluation of data.
More than one measurement should be the basis of any decision, average values and repeated measurements of the standard deviation are mandatory. Data, with a linear relation should be evaluated by means of linear regression, (the method of the least root mean square) instead of a ruler and pencil. Furthermore a mean standard deviation calculation of slope and interception point should always be applied to the regression line or better to say: this is a must. Linear regression can be carried out with programed pocket calculators, as part of a daily routine.
Although it is not necessary to maintain the concept of plate number.and plate height in isothermal, isocratic chromatography, because the dosed peak continuously broadens through material exchange between the mobile phase and stationary phase, as well as by diffusion in the phases, we will continue to use the term '~plate" (or plate number). Since this process can be associated with a numerical value, the expression "real plate number" (nreal) was chosen.
The quotient of column length L and real plate number is expressed as real plate height, hreal = L/nreal (mm), although the concept of plate height or height equivalent to a theoretical plate (HETP) might be inappropriate [2].
The term "real" was selected because nreal expresses and measures the real peak broadening, free from contributions of th e dosage and substance transfer, i. e., the actual peak width as a result of the separation itself. Since processes, which have a negative influence on the separation system can now be isolated, the number of plates is a realistic and therefore a real value. This is illustrated in Fig. 1, where the conventional plate number is compared to its real value.
It is obvious that the theoretical and effective plate number are substance-dependent variables. This is due to the fact, that the width of the starting peak - which has no relation to separation process - was included in the calculation. Fig. 1 also demonstrates that a quantitative evaluation of the width of the starting peak is always possible, and it is unimportant whether or not a starting peak actually exists in a chromatogram. It is logical that a substance cannot be eluted before the hold-up time tm. Therefore an evaluation of the peak width is meaningful
324 Chromatographia, Vol. 10, No. 6, June 1977

1.1
O
only at or behind the chromatographic posit ion t m . This can be done by extrapolat ion of 4 to 8 other peaks, which possess a measurable net retent ion time. Here it is insignificant whether the first peak actually elutes near tm or is broadened by "overloading" o f the column
.2
~:1~ n 2 #n3! n4 II
$3
bo ,5 4 neff1 ~ncff2~neff3 ~neff4
�9
.3 bo,5 nreatl = nr~ 2 = nr~t3 =nre.at4 ~ , - -
lO ~ t m t -
Fig. l
( t . t ) Peak width at half peak height versus gross retention time tins. The theoretical plate number n is different for each peak and is listed for peak 3 only. (1.2) same as(1.1), the effective plate number is different for each peak and is listed for peak 3 only. (1.3) same as (1.1), the real plate number is the same for each peak. It can be measured at any location in the chromatogram, after the completion of the regression plotting (straight line between peak width values 1-4 as shown) and determination of the starting peak width b e . In contrary to Fig. 1.1 and Fig. 1.2, the time axis is divided in multiples of the hold-up time tin, which is equivalent to a k-scale. At k = 30, e.g., 30 + 1 tm-units were passed. The determination of the bo-value is demonstrated even more explicitly in Fig. 2.
(solvent peak). Most impor tant is bo, the value of the starting peak width, extrapolated to k = 0 at exact ly tm.
T h e numerical value of bo can be obtained by plot t ing (as shown in Fig. 1) or by a regression calculation. After many discussions with colleagues, it became obvious, that the particular form in which the dynamic-chromatographic processes are presented in this article, may be unfamiliar to the reader or could be easily misunderstood. Therefore it seems to be helpful to explain the details in Fig. 1, which are the basis o f the new chromatographic evaluation, but on the other side, have the disadvantage to freeze certain experimental condit ions: e.g. , it can not be con- cluded from the figure, that the slope of the line - peak width versus retention time - is strongly dependent on the gas flow (in gas chromatography) and that the starting width bo is dynamical ly variable. At very low gas flows, bo is large, it decreases strongly with increasing gas flow and approaches a smallest value.
This behavior allows the following conclusions:
The starting peak width, which is important for further evaluations is a measure for the real width o f the sample applied via the dosage system (expressed as volume), for the interconnections and separation system. The starting width expresses also the time dependent broadening
V bo, s
tm I_
tms~-*, ~
i
b3
iS, ~ =
b5
t
ts3 ~ ts...~s tins3 ~ tin5 p b~ bs ; ba bs
but ts_...~3 _- tss ts4 ts~ b3-bo bs-bo I:~-bo b6-bo
Fig. 2
Determination and meaning of b o. If the average values of the peak widths are reduced by bo, the ratio of all net retention times to the - now corrected - b-values is constant and independent of their position on the time axis. This is the basis of the real plate number nreal.
Chromatographia, Vol. 10, No. 6, June 1977 325

4-
2-
I -
bo,s (ram)
. . . . . ( m i n ) 1 5 30 , 4,5
6 lb ~b ' ~o do k : ts: ' i m <7> <~.
Fig. 3
The evaluation of this capillary chromatogram is critical, because of the very small peaks (peak 1 has a haLf'height width of only 0.5 mm). The evaluation shows, that the linear relation between peak width at half peak height and retention time is still valid at k = 60, i. e., net retention time = 60 • hold-up time. Correct bo and blo-values depend much on an accurate plotting. The plotted interpolation line must correspond to the mathematically correct linear regression line, where the sum of the mean square deviations of the bo-values is a minimum (calculation is far better than the eyeball method).
(outside o f the separation system), caused by the volume and the flow characteristics of the detector. Naturally, these are time dependent values, and by no means a linear expansion. Therefore bo is not related to,the actual width o f the air peak, as it would be observed, when a certain volume of air is dosed. However, under the certain experimental conditions, it may happen, that the starting peak width bo and the air peak width are identical.
bo is not the result of one measurement with one single substance, it is determined from the broadening of all peaks by plotting or prefererttially by extrapolating to the "zeronet retention time", which is the abscissa- value at k = 0 (Fig. 1).
Therefore, the b.o-value is highly reliable. Its precision increases with the number o f peak width values (bo.s- values of all peaks with k > 0) which can be connected by a line. In case it is a straight line, the precision o f bo can be calculated and expressed as mean standard deviation (--- %0) for the intercept o f the straight line with the origin (a detailed discussion will follow.) Thus, the bo-value is the basis for the unambigious determina- tion o f other fundamental chromatographic evaluation factors. Fig. 1 represents genuine, experimental data which was obtained from a 3.2 m packed column at an extremely high gas flow (inlet pressure: 16 bar). A similar diagram is shown in Fig. 3, a 20 m long capillary was used, operated under standard conditions. The data was obtained
through measurements over an extremely wide range o f different pressure and flow conditions, which go far beyond the scope of a standard Chromatographic analysis. In all the cases (extreme and standard chromatographic conditions) a linear increase o f b0.s with respect to time was observed. Therefore the ratio o f net retention time
t
(or the ratio of k = ts/tm) to the peak width minus the starting peak width bo, is a constant (constant for a defined gas flow, at a certain temperature, on a particular column). This fact allows important conclusions, thus the axis-values in Fig. 1 - 3 will be explained in de.tail. x-Axis: two different units were selected: k-units or multiples o f tm (hold-up time) and the time units for tins respectively t s in minutes. The value tins represents the gross retention time, or the analysis time, which is the sum 0 f the retention time of the substance in the mobile phase and stationary phase. This gross value is the actually measured value. However, only the retention is important for the separation, i. e., the difference between gross retention time tms and the system dependent gas hold-up time t m . The latter can be characterized as the retention time in the mobile phase. In GC t m is approximately the same for all substances (this is not true in liquid chro- matography). Most useful is the ratio of net retention time to hold-up time which is usually adressed as k' (English literature) or k (German literature). It is calculated according to the equation: k = ts/t m .
326 Chromatographia, Vol. 10, No. 6, June 1977

The k-value is of fundamental importance in the evaluation of a chromatogram. However, errors are made easily in the determination. Incorrect t m-values, cause equally wrong k-values but the nreal-Value is not influenced, which is another advantage of the new evaluation factors. An incorrect value for k has a wide ranging effect on bo, which in turn has consequences for all the other derived chromatographic characteristics. It is possible to measure k correctly.
y-Axis: the peak width at half peak height is plotted at a scale, enlarged by a factor of 10-50. The data in Fig. 3 were obtained from a 20 m glass capillary column. The increase of the peak width is strongly linear over wide k-range.
In discussions and seminars, this fact was often questioned. However, systematic examination of very many chro- matograms from all areas of chromatography by means of linear regression (with the aid of pocket computers) resulted in quantitative data which confirmed this finding: in many experimental cases, the increase of the peak width is strongly linear with respect to the time.
A measure for the linear relation is the regression coef- ficient r 2 . If it assumes a value of 1.000, all measuring points are located on a straight line. A value of 0.9999 would indicate an extremely good linear relation between peak width and time. Unfortunatelly the application of linear regression requires a certain amount of calculation, which is time consuming, unless a pocket calculator is available that can produce the absolutely necessary values of r 2 , + S a and -+ %. Even if pocket computers are not available, linear regression is indispensable for the evalua- tion of e. g., calibration curves.
The increase of b0.s with respect to k (or ts) is linear if:
a) the column is not overloaded,
b) substances are selected with a symmetrical elution pattern,
c) the analysis is carried out isothermal at mediuha temperature,
i. e., at a temperature range near the boiling point of substances with a k-value of approximately 10. Some sub- stances display a significant broader width bo.s, than one might expect from their k-values. For example, chair or boat conformation of cyclohexane derivatives have a sub- stantial influence on the correct relation of peak width and the location of the peak in the chromatogram. This fact is important for a qualitative analysis and will be discussed in part 3.
Increasing polarity differences between sample and stat ionary phase (in GC), usually result in a non-linearity, i. e., a stronger variation of the data is observed in the linear regression. This will be discussed more detailed in part 3.
It is often questioned how the peak broadening should be measured: by means of b0. s (the width at half peak height) or at a different peak height?
In practice, b is always measured at half peak height. This is the most economical way and leads to correct values. If the peak shape would resemble a Gaussian curve (only
after a questionable correction of the base of the peak), the peak width would be calculated
at 88.2 % of the peak height (b = 1 o) (o, the standard deviation is one of the three basic characteristics of Gaussican curves ).
at 60.7 % of the peak height (b = 20)
instead at 50 % of the peak height (b = 2 .3540)X/~ ' ln2.0 o r
at 13.4 % of the peak height (b = 40).
Since the square of the width, measured at half peak height, is divided by 5.55 (8 In 2) all the requirements are fulfilled: those of the theory, practice and logic. The large number of data and the representation in Fig. 1 underline t h e significance of the first new evaluation factor, as part of a new class of gas chromatographic values.
A . T h e r e a l p l a t e n u m b e r nreal
( anyts )2 nteal = any corresponding bo.s - bo X 8 In 2
In view of the other evaluation factojrs, it seems appropriate to select the mean, interpolated value for the peak width of a substance which elutes at k = 10. Since the peak width is independent of ' the nature of the substance and its position in the chromatogram, we can formulate:
n r e a l = ( t s (k -- 10)~ 2 b l o - b o / "81n2
tsOo) can be replaced by the actual time value. The sub- stance at k = 10 is eluted with a net retention time t s = 10 X tin, because ts/t m = 10 and therefore tsOo) = 10 X tin. The final equation for the real number of plates is expressed as: (,0:m;
nreal = - - . . . . 8 1 n 2 or nreal = - - - 8 1 n 2 1 0 - - 0 (1)
aSbl0 = 1 0 - a + b o i n b o . s = a . k + b o . This expression implies that :
1. the t m-determination must be correct, because all the other evaluation factors depend on it.
2. the bto-ValUe is file result of a regression calculation or plotting; bo.s = a. k + bo ;
In terms of the measuring technique, the real number of plates is determined, completely independent of the substance, i. e., it is the result of a genuine measurement consisting of an
average value (root mean square) standard deviation (Sa, see below) number of measurements (= number of evaluated peaks).
Only under these conditions, is an unambiguous evalua- tion of the quality of a column or capillary possible. This should be understood as criticism on the conventional evaluation factors neffective and ntheoretica 1.
Furthermore, nreal contains another term, which can be calculated without difficulty: the mean value obtained from the straight line: bo. s = a X k + bo. This is another
Chromatographia, Vol. 10, No. 6, June 1977 327

example that the constant is substance independent, influenced only by the temperature, and the Pi/Po ratio as well as the inlet pressure Pi of the column.
Evaluation of the separation capability
nreat describes the quality of a column, independent of the substance and free of any negative influence by the connection and dosage technique. It will be demonstrated, that the separation capability, which is determined by the quality of the column, is diminished by the fact that the dosage requires a certain time, as well as by the installation technique, connections and detector volume.
The evaluation of a separation requires at least two sub- stances. The uncorrected and therefore real peak width will be the basis for the evaluation of the separation between the two substances. It would be advantageous to have some sort of regulation on the choice of the sub- stances used for the~evaluation of the separation.
I would like to propose the selection of a substance at k = 0 and at k = 10. The choice of such a section in the chromatogram may appear arbitrary. However, in part 3, the exact relation will be derived, which shows that peaks of all sections of the chromatogram can be used to measure the separation capability.
However, if one agrees to select the chromatographic range of k = 0 to k = 10 as evaluation basis, the following arguments are valid:
- any separation begins at k = 0
- all rapid separations are in the range k = 0 up to k = 10
- most of the routine GC is done in this range
- it represents a decimal system
- the selection of hypothetical substances at k = 0 and k = 10 implies that the separation capability is deter- mined in the same way as the number of plates: practically neutral, substance-independent and therefore generally applicable. The calculation uses the separation distance (10 tm-units) and the corresponding peak width (the peak width at k = 0 and k = 10).
The number of peaks, which can be accommodated within these 10 tin-units will provide a meaningful evaluation number. The number of base-to-base separated peaks will be called "separation number-real" (TZreal). This value represents the separation capability of a column (or capillary) in an accessible and unambiguous form.
B. The evaluation factor for the separation capability: the separation number TZlo is an approximation to
TZreal
In the first approximation, the separation number can be expressed as:
lO'tm TZlo = blo + bo - 1 (2)
The data, necessary for this calculation, are identical with those used for the determination of the real number of plates.
TZ~o corresponds to the number of peaks which at least can be completely separated between k = 0 and k = 10.
A complete separation means: a 4.7-sigma-separation for two adjacent peaks, with an 1.5 % overlapping at the base of the peaks. This degree of overlapping, does not have any influence on the correct determination of the position or the area of a peak, therefore it is appropriate for qualitative and quantitative chromatographic analyses. In a 4.7-sigma- separation, the peak maxima are separated by 4.7 times the distance of the half peak width at 60.7 % of the peak height.
The 4.7-sigma-separation corresponds to a resolution of 1.0, i. e., a baseline separation of two symmetrical peaks of equal size. If the column is overloaded or the main peak contains some minor components, which also need to be separated, a 4.7-sigma-separation is not sufficient. In these cases, the general expressions for all evaluation factors cannot be applied. It should be emphasized once more, that equation (2) is only an approximation, which yields a smaller number ofpeaks then actually could be accommodated effectively between k = 0 and k = 10. The exact relation can be expressed as:
10a + b o 10a + b o log bo log bo
TZreal = - 1 = V nreal t m + a
8 In 2 + 1 log tm ~ a log . ~ 1
TZlo approaches the exact value with increasing quality of the column. Therefore, TZ~o never assumes values higher than the actual number. Besides listing the number of completely separated peaks between k = 0 and k = 10, the separation number records also the necessary time for the separation. This allows a convenient evaluation of the separation power of a column or capillary; TZlo-peaks require a separation time of (10 + 1) • t m seconds or minutes.
1 ~> TZlo
C. Evaluation number for the separation power of a chromatographic system: the Separation power number TZt
The separation time for TZ lo-peaks is exactly (10 + 1)X t m the re fore:
TZIo TZre~ TZt = 11 tm' more precise: 11 tm (3)
TZt is measured in peaks per minute or second. However, there are certain objections against this value. In every chromatographic technique the separation power declines from second to second. Effects, which have a negative influence on the separation, increase with analysis time and counteract the separation power which is invariably determined by the choice of the stationary phase.
The measurement of the separation power is therefore only possible if time and chromatographic distances are defined. It is proposed here, to use a separation distance of 10 t m- units and a separation time of(10 + 1) • tm.
Such a definition is advantageous, not only for a com- parision of methods, but also for the optimization of a
328 Chromatographia, Vol. 10, No. 6, June 1977

chromatographic analysis with respect to the separation power. It is important tO know that an optimized separ- ation capability (maximum separation number TZIo) does not mean a maximum separation power (number of separated peak per time).
An optimum, determined by means of the above equations represents the technically possible maximum and is therefore real.
The adjustment of temperature and gas flow to a TZt- optimum (in isothermal and isobar gas chromatography) guarantees the maximum separation power which can be obtained from a system with a given column, installation method, dosage technique, interconnections and detector. If the separation power is insufficient, the instrumental conditions have to be changed, e. g., the dosage system and/or interconnection system or different conditions or a different column.
The influence of factors outside of the column, can b e measured quantitatively. The large contribution of these effects to the overall performance of a separation system is surprising. Therefore, a selective determination of these factors, which is the first step toward their elimination, is extremely valuable for the chromatographer. This is the key for the successful application of systems with a high separation power such as micro packed columns, short columns, thin film capillaries or thin layer capillaries.
In the following, these basic factors will be derived and combined with the earlier mentioned evaluation number.
D. Combination of the evaluation factors nreal and TZ m
The equations for both numbers are solved for 10 t m
1 . 10 t m = nx/~r~l 8X/rg]~- ~ (bin - bo)
10 t m = (TZm + l ) ' ( b l o + bo) .
thus:
1 ( b l o - bo) TZm + 1 = x/'nreal ~ "(blo + bo)
o r
b m - b o ./nreal TZio - b l o + b o l/vSln2 - 1 . (4)
nreal can also be formulated as L/hreal. This expresses the influence of column length (capillary length) and quality of the column packing (stationary phase coated on the capillary) on the separation.
However, the separation is also dependent on the value of
blo -bo This factor diminishes the separa- the expression b lo + bo "
ation capability, if it becomes smaller than 1.000. This is always the case when bo is larger than zero. It is obvious that bo cannot be zero, and it might be interesting to examine the separation capability when the bo-values and 1%, 5 %, 20 % or 50 % of blo. These values are summarized in Table 1, the strong influence of the ex-
blo - b o pression ~ is characterized as utilization factor Qs-
It accounts for all effects outside of the column, which have a negative influence on the separation.to Qs-
Table 1. The influence of Qs on the separation capability.
bo = 1%ofblo = 2%ofblo
5 % of bl0
10%ofblo 20%ofblo 50 % of b lo
Qs = 0.98 = 0.96 = 0.90
= 0.82 = 0.67 =0.33
decrease of separation capability = 2 %
4% 10%
18% 33% 66%
If equation (4) is rearranged, Qs can be formulated as the deficiency factor, (expressed in percentage) which diminishes the separation capability of a good column or capillary. Qs-values of 0.98 or higher (the system operates with 98 % of the possible separation capability) are preferable. However, the use of capillaries results often in Qs-values between 0.8 and 0.5, which is equivalent to a 20 -50 % loss of separation capability. Both Qs and bo should be understood as negative dynamic evaluation factors. It is important to know that the Qs optimum does not coincide with the maximum of separation capability, separation power and the real number of plates.
Qs can be improved, if the installation, dosage and transfer technique is improved. The Qs'value is not dependent on the quality of the column (although it is calculated from the b~o-value). For example, Qs can be increased if the sampling is done under non-isothermal conditions. This is the reason Grob's [3] dosage technique in capillary-gas chromatography - often misquoted as sPlitless injection - is so successful.
Qs is therefore an important evaluation factor used to improve instrumental conditions, if the full separation power of a column or capillary - measured as nreal or hreal - is to be obtained.
A final formulation of the previous discussed evaluation factors is given below.
nrea------! - 1 TZ1o = Qs" 81n2
TZio = Qs hreal'8 In 2 - 1
0.91 0.091 0.91 0.091 (5) TZt . . . . = - -
b lo + b0 tm 10 �9 a t m
1 (Qs.1/nreat_ T Z t = ~ V 81n2 1/
Tile correct calculation of tin, bo, blo or a is crucial for the application of these evaluation factors.
Furthermore it is necessary to know the length of the separation system L (in mm), the inlet pressure Pi or the mobile phase flow Fo, measured at the end of the column, tm, bo and blo or a are calculated from k and from the measured values of tins and bo.s. Errors in this measurement will strongly effect Qs and consequently TZlo or TZreal and TZt. In the following, the acquisition and processing of data will be discussed in detail.
Chromatographia, Vol. 10, No. 6, June 1977 329

Experimental p r o c e d u r e
�9 R e q u i r e m e n t s
1. The chromatographic analysis is carried out under isothermal and isobar conditions.
2. Chart speed, recorder and detector response are adjusted in such a way, that there is no alteration of the peak position and peak shape. The precision of the measure- ment is at least 0.5 seconds, 0.1 seconds can be achieved. It is desirable, that at least four different pe.ak widths are measured with a precision of 15 % tel. or better,
3. The column is not overloaded.
4. At least 5 - 7 symmetric peaks are obtained.
5. A minimum of 4 - 8 peaks are suitable for evaluation.
6. All requirements to measure or calculate the hold-up time tm are met.
The impression may exist that these requirements impose some restrictions on the application of the above discussed evaluation method. However, a meaningful and correct evaluation is only possible on the basis of correct data.
A recorder, with a response time of 250 milliseconds and a chart speed of 1 mm/s should be used for these measure- ments. Magnifying glasses are used for the correct deter- mination o f the peak width .(e. g. from the left side of the pen trace to the left side of the pen trace or vice versa).
A test mixture, which fulfills the above mentioned con- ditions 3-45 can be easily found.
The reliability o f this evaluation method, which allows optimum operation o f a separation system, justifies expenses such as a good separation column, a recorder with above mentioned characteristics and the analysis time.
�9 Ins truc t ions for m e a s u r e m e n t and ca l cu la t ion
- The exact position of the injection has to be marked on the chart paper; the chart speed is set to 60 mm/min. The motor is turned on, at the moment o f dosage. Both hands are needed, or the help of an assistant.
- After the chromatogram is obtained, list the data in form o f a table:
tmsl bo,s (1)
tins2 bo.s (2) tms3 bo.s (3)
tms8 bo.s(8)
(precision: 1%) tms (mm) bo. 5 (mm) 47.3 0.44 52.6 0.50 90.7 1.00!! 92.7 0.95
103 1.1 135.3 1.45 236 2.3 553 5.55
chart paper speed. 100 mm = 10 rain.
- Measure or calculate t m according to appendix 1 : Example, t m = 8.5 (calculation of tm with HP-65, HP-97 according to appendix 3)
- Calculate k 1 to k 8, using the equation:
k = (tins - tm)/tm. Example: k 8 = (553-8 .5) /8 .5 = 64.06
- Plot bo.s versus k according to Fig. 3 or carry out a linear regression calculation.
- Calculate or measure bo (for the calculation use program HP-97 in appendix 2), the measurement of bo is shown in Fig. 2, use a large scale for the bo.s-values.)
- Calculate or measure blo (same as above, Fig. 2 re- sp.ectively appendix 2), calculation o f a is dence and blo = 1 0 " a + b o .
- Express the length o f the column im millimeters, example: L = 20000 ram.
Example: from previous calculation we know: t m = 0.50 mm = 0.85 min. bo = 0.0975 mm, b 1o = 0.9477 mm
- Calculate nreal , hreal, TZlo, TZt, Qs
nreal = (8.5 �9 10 : (0.94776 -- 0.0975)) 2. 8 In 2 = 55 366
hreal = 20000 : 55 366 = 0.36 mm
TZIo = ( (8 .5 .10) : (0 .94776 + 0 . 0 9 7 5 ) ) - 1 = 80.32
TZt = 80.32 : 11 "8.5 "0.1 = 8.6 Peaks/hi
Qs = (0.94776 - 0.0975) : (0.94776 + 0.0975) = 0.813
Evaluat ion and con tro l o f the data
�9 1 n ~ - 1' Requirement: TZlo = Qs V 81n2
Control: 80.32 --- 0 .813. ~ 5 5 3 6 6 1 -
= 81.345 - 1 = 80.35
Qs = 0.813
TZ : 80.3
TZt : 8.6
Evaluat ion o f th e data
Only 81% of the available separation capability (5-5366 plates) are used. The examined separ- ation system consists o f a 0.33 mm glass-thin film capillary by H and G. Jaeggi, mobile phase: hydrogen, stationary phase: squalane, length: 20.0 m. With a plate height of hreal = 0.36 mm the examined capillary is excellent. This value is 91.7 %
7/= ~ g " 100 = 91.7 % of the theoretically
possible plate height.
peaks between k = 0 and k --'10. This result is very good, considering the high separation capability of over 55 000 real plates and the still acceptable dosage quality Qs = 0.81. Because o f the short hold-up time, the separ- ation power is remarkable.
An average value of 8.6 peaks per minute can be considered excellent.) Such an evaluation is possible only if enough data are available for a comparison especially when an attempt is made to fred the maxihaum separation capability and the different maximum of the separation power.
330 Chromatographia, Vol. 10, No. 6, June 1977

Reliability of the evaluation method
How reliable are the evaluation factors? This question can onty be answered by means of statistics.
The standard evaluation factors, if applied correctly, represent the mean standard deviation for the slope of the straight line, obtained from the bo.s and k-values. The mean standard deviation for bo and consequently the precision of Qs can be calculated. Now it is possible to determine whether it was correct to discard inconsistant data, e. g. tile peak width bo. s = 1.00 of the peak at tms = 90.7. Although the plot in Fig. 3 shows peak 3 much out of the line, the statistic calculation reveals that the deviation is not significant (a more detailed discussion is found in part 3).
Data for the linear regression
Initial data:
N~ I tms ] ts I k I
(according to appendix 2)
1 0.44 47.3 38.8 4.56 n-Decane 2 0.50 52.6 55.1 5,188 5-Nonanone 3 1.00! ! 90.7 82.2 9.671 2-Propylcyclohexanol 4 0.95 92.7 84.2 9.91 2-Ptopylcyelohexanol 5 1.1 103 94s 11:12 n-Undecane 6 1.45 135.3 126.8 14.92 Naphthalene 7 2.3 236 227.5 26.76 n-Dodecane 8 5.55 553 544.5 65.06 n-Tridecane
The' following data was obtained through linear regression:
with 3 without peak peak 3 �9
peak bo. s bo. 5 average
number measured
1 0.44 0.499 0.485 2 0.50 0.55 0.5386 3 1.00 0.932 0.919 4 0.95 0.95 0.94 5 1.1 1.05 1.04 6 1.45 1.38 1.37 7 2.3 2.38 2.37 8 5.55 5.54 5.54
regression [co efficient with without peak 3 peak 3
1.000 1.000 0.9998 0.9893 0.9999999 0.9925 0.9985 0,9952 0.9993 0.9899 0.992 0.9987 0.99899
If the peak 3 is included in the calculation, the b0 and bm values are 0.1121 and 0.9599, respectively, i. e., Qs = 0.813. Without peak 3: bo = 0.0975 and b~o = 0.9478. The mean standard deviation for the slope of the regression line (including peak 3) is s a = -+ 0.0021, which is +- 1.4 % of its value. The mean standard deviation for bo (without peak 3) is Sb0 = + 0.0332 which represents +- 29 % of its value. I f peak 3 is discarded from the calculation, Sa = -+ 0.022 (+- 1.4 % of its value) and %0 = -+ 0.0319 (+ 32 % of its value).
These statistical calculations demonstrate that more data is necessary, before any conclusion on peak 3 can be reached (e. g., the peak width o f peak 3 is significantly wrong) or compound 3 behaves like a run a way and may be excluded. However, according to the regression coefficient r 2 , the linearity is slightly better without peak 3. In any case, nreal is obtained relatively accurate
(+ 1.5 % of its value) where b0" is recorded with only -+ 30 % of its value. This fact is consistantly observed in linear regression: the slope can be measured accurate, however, the axis values are spread. The data, which was used in this particular case, is especially critical, because a peak width of approximately 3 mm has to be measured with a precision of 0.1 mm. The chart speed was too low, furthermore, this was an evaluation of a capillary column. An evaluation by means of neff would hardly be possible in such a case.
Comparision of the results with the separation number 100 (TZloo)
The separation number TZtoo lists the number of peaks which can be separated within a retention index range of 100 units. In contrast to TZto which can be determined only once in a separation system, TZtoo can be measured several times in a long chromatogram. TZtoo is characterized by a number, which refers to the carbon-atom range for which it was measured. The exact formula for TZtoo depends on the polarity of the separation system, as shown in the following equation:
a.k2 + bo log a.kl +bo
TZ100reat = /r-~ reaI -- 1
x/gTn-~n 2 + 1
log X/nreai 81n2 - 1
where k2, kl represents the k-data of the two substances to be separated. TZtoo, an approximation to the real TZ lOOreafformulae can be calculated easily, because the linear regression allows an accurate determination of the peak widths of n-alkanes. In the above example, the following peaks represent n-alkanes:
Peak 1 n-decane bo. s average : 0.485 5 n-undecane bo. s average : 1.04 7 n-dodecane bo. s average : 2.37 8 n-tridecane bo. s average : 5.54
At21 and the approximation formulae TZmo = b2 + bl - 1,
where At2t = tatkanet - talkane2 and b2, b ~ are the respective peak width of the alkanes 2 and 1 used.
The separation numbers have the following values:
103 - 47.3 TZloo between Clo and Clt : TZloo - 1.04 + 0.485
2 3 6 - 103 TZt0o between C n and Ct2 : TZtoo - 2.37 + 1.04
553 - 236 TZloo bet~veen C12 and C13 : TZioo = 5.54 + 2.37
Usually TZ~oo is smaller than half of TZ~o,
The separation number 100 requires n-alkanes as a test mixture (or other homologues, which results in somewhat different TZloo-Values) whereas TZlo is an universal number, because it is independent of the detector and
i =35 .5
1 = 38.0
1 =39.1
Chromatographia, Vol. 10, No. 6, June 1977 331
ID TZt / e
, .:.:#/'/ o ~ ~ o'7":---.. ....
" �9 " �9
neff.
�9 ~. b 0
' ' 4 ' * ' 8
�9 1.
2.
3.
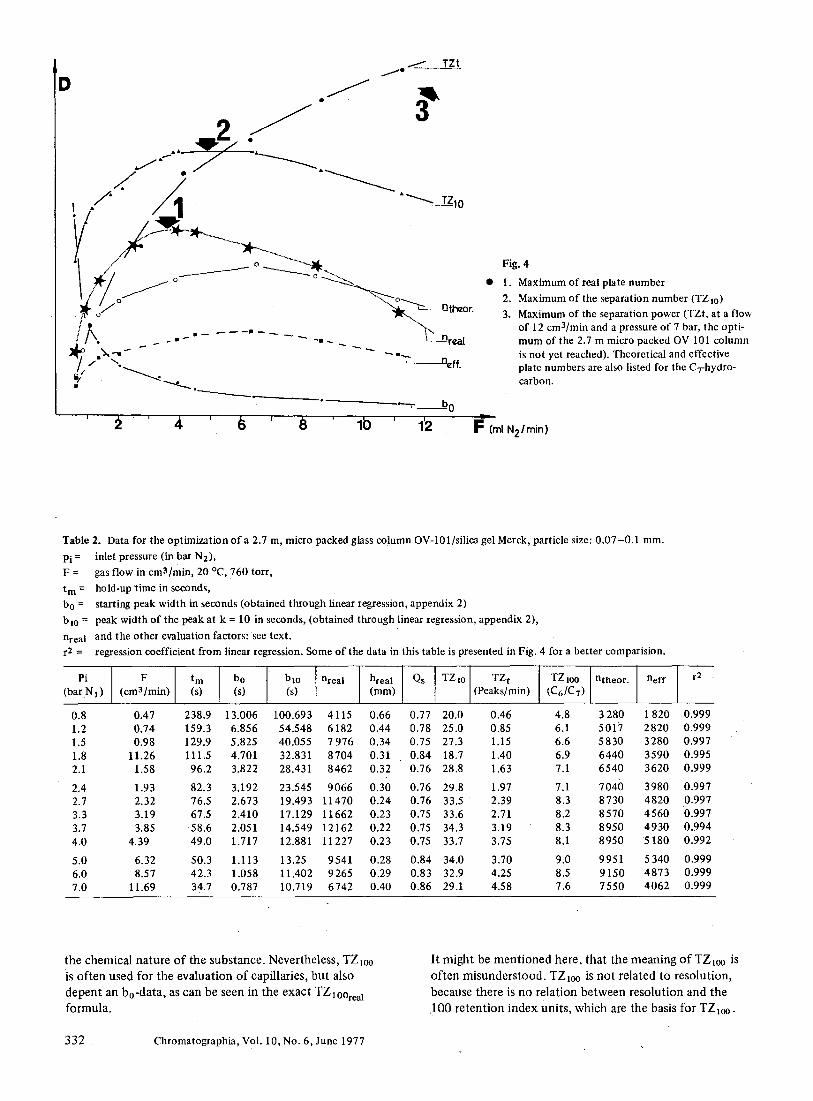
Fig. 4
Maximum of real plate number
Maximum of the separation number (TZ 1o) Maximum of the separation power (TZt, at a flow of 12 cm3/min and a pressure of 7 bar, the opti- mum of the 2.7 m micro packed OV 101 column is not yet reached). Theoretical and effective plate numbers are also listed for the CThydro- carbon.
l b ' 1'2 N21min)
Table 2. Data for the optimization of a 2.7 m, micro packed glass column OV-101/silica gel Merck, particle size: 0.07-0.1 mm.
Pi = inlet pressure (in bar N2) , F = gas flow in cma/min, 20 ~ 760 torr,
t m = hold-up time in seconds, b o = starting peak width in seconds (obtained through linear regression, appendix 2)
blo = peak width of the peak at k = 10 in seconds, (obtained through linear regression, appendix 2),
nreal and the other evaluation factors: see text. r 2 = regression coefficient from linear regression. Some of the data in this table is presented in Fig. 4 for a better comparision.
Pi F t m bo I blo nreai [ hreal Qs ] TZIo TZ t I TZloo Intheor. neff (barN 1 ) (cm3/min) (s) (s) (s) (ram) (Peaks/rain) (C6/C 7)
r 2
0.8 0.47 238.9 13.006 100.693 4115 0.66 0.77 20,0 0.46 4.8 3 280 1 820 0.999 1.2 0.74 159.3 6.856 54.548 6182 0.44 0.78 25.0 0.85 6.1 5017 2820 0.999 1.5 0.98 129.9 5.825 40.055 7976 0.34 0.75 27.3 1.15 6.6 5830 3280 0.997 1.8 11.26 111.5 4.701 32.831 8704 0.31 0.84 18.7 1.40 6.9 6440 3590 0.995 2.1 1.58 96.2 3.822 28.431 8462 0.32 0.76 28.8 1.63 7.1 6540 3620 0.999
2.4 1.93 82.3 3.192 23.545 9066 0.30 0.76 29.8 1.97 7.1 704() 3980 0.997 2.7 2.32 76.5 2.673 19.493 11470 0.24 0.76 33.5 2.39 8.3 8730 4820 0 .997 3.3 3.19 67.5 2.410 17.129 11662 0.23 0.75 33.6 2.71 8.2 8570 4560 0.997 3.7 3.85 58.6 2.051 14.549 12162 0.22 0.75 34,3 3.19 8.3 8950 4930 0.994 4.0 4.39 49.0 1.717 12.881 i I 227 0.23 0.75 33.7 3.75 8.1 8950 5 180 0.992
5.0 6.32 50.3 1.113 13.25 9541 0.28 0.84 34.0 3.70 9.0 9951 5340 0.999 6.0 8.57 42.3 1.058 11.402 9265 0.29 0.83 32.9 4.25 8.5 9150 4873 0.999 7.0 11.69 34.7 0.787 10.719 6742 0.40 0.86 29.1 4.58 7.6 7550 4062 0.999
the chemica l na ture o f the substance. Nevertheless , TZloo
is o f t en used for the evaluat ion o f capillaries, but also
depent an bo-data ; as can be seen in the exac t TZloorea
formula .
It might be mentioned here, that the meaning of TZloo is often misunderstood. TZloo is not related to resolution, because there is no relation between resolution and the 100 retention index Units, which are the basis for TZloo.
332 Chromatographia, Vol. 10, No. 6, June 1977

E. Optimization by means of the new evaluation method
The following conditions are used in the separation:
column: micro packed glass column, 2.7 m long inner diameter: 0.8 ram.
Stationary phase: Methyl.silicon oil OV-101, 4 % wt in CFCI3 according to the IfC-method: after preheating, filling and homo- genizing, the impregnation solvent (CFCI3, Bp = 23 ~ is removed instanteneously, using vacuum and a temperature of 40 ~ After drying, the column is packed under pressure and vacuum by means of an ultravibrator.
Installation method: Separation Cassette lfC.
Instrument: Becker-packard Typ 409, FiD
Test sample: mostly n-alkanes
Carrier gas: nitrogen
The optimization was carried out isothermally at 80 ~ by varying the gas pressure from 0.8-4.2 bar. In the following discussion, the data table will be supplemented by fiqures. Fig. 4 shows three distinct maxima:
1. The maximum of the realplate number, nreal respectively the minimum of the real plate height. Both are dependent on the column fdling, temperature and nature of the carrier gas. This maximum is different from the optimum value, obtained by the conventional evalu- ation method.
2. The maximum of the separation capability is different from the maximum of the real plate number.
3. The maximum of the separation power is completely different from maximum of 1 and 2. The curve in Fig. 4 does not even show the maximum.
The operation of a system at a maximum separation power depends on the particular separation problem (because of a decreased separation capability). However, a minimum of separation capability is always guaranteed by the given selectivity of a column.
Selectivity was not mentioned in this treatise, because only substance independent evaluation factors were discussed and selectivity is strongly dependent on the sample to be separated. A selective column, with good evaluation factors will always be preferred.
It might be interesting to note, that a 2.7 m packed column - optimized correctly - can yield more than 10 000 plates. So far, 16 000 plates/m could be obtained with a micro packed separation cassette (particle size: 0 .18-0.20 ram) at a separation number 100 TZ~oo = 24 for C11/C12.
Acknowledgement Acknowledgement
The author is obliged to many colleagues for rewarding discussions on the subject. Especially, he thanks, the participants of the lfC- course in 1976, Drs. Rijks, Cramers and coworkers (University of Eindhoven), Dr. L. Rohrschneider (Hiils) and Dr. M. Riedmann (Gr~Stzingen), who indicated the special problems of the t m- determination in HPLC as well as R. Rieder and Dr. J. Sev~ik who
are responsible for an experimentally sound basis for the new evaluation factors. The author is also obliged to ProL A. J. P. Martin, Prof. A. Zlatkis, Prof. W. E. Wentworth and eoworkers (especially R. C. Chang), who proposed the term "real" number of plates, when the new method was presented at the University of Houston, Texas.
References
Ill R. E. Kaiser, Gas-Chromatographie (1959), Monographie, Verlag Geest und Portig, Leipzig .1960. (bo in der Trenn- stufenzahl).
121 Many private conversations since 1959, speaches by ]. F. K. Huber, Vienna.
131 Grob, K., Grob, G., Chromatographia 5, 3 (1972) (direct sample injection).
Appendix 1:
Determination or calculation of the hold-up t ime trn
�9 Meaning: The hold-up time is of prime importance for the analysis speed, t m is part of all fundamental relations, it is the same for all substances, as long as the conditions are not changed, tm is never zero. tm is a statistically to be calculated means of the "'retention time" of substances with mobile phase.
�9 Equation: t m = t in s - ts
�9 Conditions: Isobaric, isothermal analysis.
�9 Experimental procedure: ,
1. Inject a substance which shoves no retention under the given conditions. GC-FID: CH4 on a "hot" column or N2 respectively H2 and an extremely high sensivity of the FiD, which is operated outside of its optimum. GC-ECD: CH2 C12 in N2 at temperature higher than 150 ~ e. g., analyses of pesticides on partition columns. GC-SID: COS in N2 at tempera- tures above 150 ~ on partition columns. LC.UV detector: injection of 02 in the mobile phase. At a high sensitivity a signal is produced which can be evaluated. As control, He and air may be injected. If air is separated into two peaks, then the second peak is Oz. tins of the N2-peak represents the hold- up time.
2. In GC, calculate t m according to:
1 tins3 - tm og tmsl _ tm i3 _ i1
- - - - " = const. , tins2 - t m 12 - I 1 log tms--'- ~ ~ t-'-m
t m is subtracted iteratively from the experimental value of the gross retention time, until the above equation is fulfilled. Three index-values and the three corresponding gross retention times are necessary. The calculation is carried out with a programable pocket calculator (for more information, see Chromatographia 12, pps. 696-698 (1974). Please note: the program contains an error. The command: running number 50 reads 84 R/S instead
Chromatographia, Vol. 10, No. 6, June 1977 333

of 24 RTN. A detailed description of the mathe- matical and experimental methods for the deter- mination of the hold.up time is discussed in Chro- matographia 2, p. 219 (1969).
�9 Application
1. The determination of t m precedes any qualitative evaluation in GC (under constant chromatographic conditions).
2. k is a universal, qualitative "address" in each chro- matographic technique and cannot be determined without tin.
3. t m is necessary for any correct data transfer:
LC _ _ . TLC TLC LC
Important:
Any system errors or random errors in the tin-determination will change the qualitative data. However, an evaluation based on the retention index in isothermal GC is less sensitive to a slightly incorrect tin. The measurements should be carried out with a precision of 0.1 seconds.
Appendix 2:
Linear regression with the aid o f pocket calculators
�9 Equations: see textbooks for statistical mathematics.
�9 Application: The regression coefficient, the mean standard deviation of the slope and axis values are mandatory for the evaluation. Calculators, which do not allow the hnmediate determination of r 2 (regression coefficient), s a and sbo should not be used. The following programs are described in detail. Repeated application will make the chromatographer more familiar with this highly informative mathematics.
This program needs more pouverful calculators as HP-65 or Texas Instrument SR-52.
This program allowes a very elegant solu- tion of the problem because of total re- cordings based on one single magnetic card programming.
Users interested in SR-52 or HP-65-pro- grams may consult the german version of this green pages in Chromatographia 9 (1976) 337.
HP 97 (= HP 67) program for linear regression and calculation o f B = r 2
nreal a
b0
_+ 8 B
+ S a
~r
TZr~I
Q$
TZ/treal
real plate number
slolSe according to a .k + bo = b0.s (seconds)
intercept according to a- k + bo = b0.s (seconds)
standard deviation o f bo
standard deviation of a
regression angle (angle between the two regression lines)
real separation number according to the accurate log-formula
= (bto - bo) : (blo + bo) (= 10 : 10a + 2bo)
= TZreai : 11 tm
The program calculates any b from any k
Procedure: switch the calculator ON, NORM, RUN
feed program, Enter tm in sec STORE 9 Enter t m in minutes STORE 2
press f a Enter b0.s I Press A (all data in seconds) Enter trns I Press D (all data in seconds)
Continue until N pairs of data have been entered. Press C, wait. The HP 97 prints the data according to the copy printed. When HP 67 is used all data are stored according to the copy of "REG", see "print out". Prior any next calculation press f a.
When used for linear regression only, please use this steps:
f a Enter Yl Press A Enter xt Press B Enter y~ PressA Enter x2 Press B
Enter YN Press A Enter XN Press B Press C Printout = r ~ = D
a
bo Sb0 Sa
~r
Any further details can be read in the calculators program copy.
The program allows to enter any further pair of data and to recalculate the regression data without "clear data", if the additional data group belongs to the total of the data to be handled by regression.
334 Chromatographia, Vol. 10, No. 6, June 1977

I FC-Program of HP-97
001 *LBLa 21 16 11 002 P ~ S 16-51 003 CLRG 16-53 004 CLX -51 005 P ~ S 16-51 006 DSP5 -63 05 007 RTN 24 008 *LBLA 21 11 009 ENT t -21 010 RTN 24 011 *LBLB 21 12 012 SF2 16 21 02 013 ~+ 56 014 STOI 35 46 015 RTN " 24 016 *LBLC 21 13 017 P-~S 16-51 018 RCL8 36 08 019 RCL4 36 04 020 RCL6 36 06 021 X -35 022 RCL9 36 09 023 + -24 024 - -45 025 ENT~ -21 026 RCL9 36 09 027 1 01 028 - -45 029 + -24 030 STOC 35 13 031 E N T t -21 032 ENT t -21 033 P~-S 16-51 034 S 16 54 035 X -35 036 + -24 037 X 2 53 038 STOD 35 14 039 PR TX .14 040 SPC 16-11 041 R CL I 36 46 042 1 01 043 - -45 044 ENTt -21 045 RCLI 36 46 046 2 02 047 - -45 048 + -24 O49 E N T t -21 050 1 01 051 RCLD 36 14 052 - -45 053 X -35 054 ~ 54 055 STOE 35 15 056 S 16 54
057 X 2
058 R CL C 059 + 060 1/X 061 ST01 062 PRTX 063 064 RCL 1 065 X 066 CHS 067 + 068 S TO0 069 PRTX 070 SPC 07"1 S 072 X 2
073 RCLI 074 1 075 076 X 077 E N T t 078 E N T t O79 x 080 X 2
081, X ~ Y 082 R 083 + O84 1/)( O85 RCL I 086 1/)( 087 + o88 ~/2
0 8 9 RCLE O90 X 091 X 092 S T 0 4 093 P R TX O94 S 095 X 2
096 RCLI 097 1 098 099 X 1oo # 2 101 1/X
102 RCLE 103 X 104 X lOB ST05 106 PRTX 107 S 108 X 2
109 X # Y 110 X 2
111 + 112 RCL C
53 113 + -24 169 36 13 114 1IX 52 170
-24 115 RCLD 36 14 171 52 116 + -24 172
35 01 117 E N T t -21 173 - 1 4 1 1 8 1 01 174
16 53 119 RCLD 36 14 175 36 01 120 - -45 176
-35 121 X .35 177 .22 122 TAN -1 16 43 178 -55 123 PRTX - 14 179
35 O0 124 F2? ~ 16 23 02 180 -14 125 RTN 24 181
16-11 126 SPC 16-11 182 16 54 127 GTOE 22 15 183
53 128 *LBLD 21 14 184 36 46 129 RCL9 36 09 185
01 130 - -45 186 -45 131 RCL9 36 09 187
�9 - 3 5 132 + -24 188 -21 133 ~, + 56 189 -21 134 STOI 35 46 190
16 53 135 RTN 24 191 53 136 *LBLE 21 15 192 -41 137 DSP2 -63 02 193 -31 138 2 02 194 -24 139 L N 32 195 52 140 8 08 196
36 46 141 X -35 197
52 142 STOA 35 11 198 -55 143 E N T t -21 199 54 144 RCL9 36 09 200
36 15 145 RCL I 36 01 201 -35 146 + -24 202 -35 147 X 2 53 203
35 04 148 X -35 204 - 14 149 STOB 35 12 205
16 54 150 PRTX -14 206 53 151 RCL 1 36 01 207
36 46 152 ENT t -21 208 01 153 RCL 1 36 Ol 209
-45 154 -62 210 -35 t55 2 02 211 54 156 RCLO 36 O0 212 52 157 X -35 213
36 15 158 + -55 214 -35 159 "- -24 215 -35 160 ST08 35 08 216
35 05 161 PRTX - 14 217 -14 162 RCL 1 36 01 218
16 54 163 1 01 219 53 164 0 O0 220 -41 165 X -35 221 53 166 RCLO 36 O0 222 -55 167 + -55 223
36 13 168 RCLO 36 O0 224
§ -24 LOG 1632
E N T t -21 RCLA 36 11
1/X 52 54
RCLB 36 12 54
X -35 1 01
+ -55 E N T t -21 ENT t -21
2 02 - -45 § .24
LOG 16 32 § -24
1 0 1
- -45 ST03 35 03 PRTX -14 E N T f -21 RCL2 36 02
1 01 1 01
X -35 § -24
PRTX -14 DSP5 -63 05
RTN 24 *LBLd 21 16 14 RCL9 36 09
- -45 RCL9 36 09
+ -24 RCL 1 36 01
X -35 RCLO 36 O0
+ -55 PRTX -14
R TN 24 *LBLe 21 16 15 DSP4 -63 04
SPC 16-11 RCL5 36 05 PRTX -14 RCL 1 36 01
+ -24 PR TX - 14 RCL 4 36 04 PR TX - 14 RCLO 36 O0
+ -24 PRTK - 14
RTN 24
Chromatographia, Vol. 10, No. 6, June 1977 335

17A.85000 30.00000
~82833
.95000 196. 00000
L 00000 21Z50000
1.30000 261. 00000
1.90000 348.00000
3. 2OO00 524.0000O
5.00000 879.00000
11.50000 1591.OO000
ST09 §
ST02
GSBa GSBA GSBD GSBA GSBO GSBA GSBD GSBA GSBD GSBA GSBD GSBA GSBD GSBA GSBD
1. Application for Chromatography
Switch ON/NORM/RUN
ENTER program from magnetic card Enter dead time (sec) STO 9 Divide by 60, STO 2 clear part of memorie s by pressing f a Enter peak width 1 (sec);'press A enter non adjusted retention time 1 (see); press D enter peak width 2, press A enter non adjusted rentention time 2, press D continue til last pair of data (minimum: three pairs of data) Press C
Printer of HP-97 prints ten data as a list of results (HP- 67 stores the data, see list RCL)
without pressing f a
any further pair of bo,s :- tms - data can be entered. After "press C" an new list of results is printed (HP-97) or stored (HP-67).
Check r 2, + Sbo, -+ Sa. Qualified results need acceptable high r2-data and acceptable low standard deviations for the slope and the bo-value. New sets of data need to clear memories by pressing f(a) and entering tm (sec) STO 9 tm (sec): 60, STO 2.
HP-97 print out:
l . r 2
2. slope a [sec]
3. bo [sec] 4. standard deviation %0
5. standard deviation s a
6. regression angle
7. number of real plates nreal
8. Qs 9. real separation number TZreal
according to the logarithmic formula
blo log g~o
TZreal = - 1 J nreal +
log - / nreal - 1 V 8In2
10. TZreal: 11 "t m
HP-67 RCL D
RCL 1
RCL 0
RCL 4
RCL 5
RCL B
RCL 8
RCL 3
stored in display
336 Chromatographia, Vol. 10, No. 6, June 1977

Data
1. ~99909 * * *
1.32739 * * *
0.63574 * * *
~06312 * * *
~01789 * * *
~02500 * * *
Z 9621&97 * * * R 0.91 * * *
202.22 ***
1~ ~ 15 * * *
0.0179 * * * 0.0135 * * * 0,0631 * * * 0.0953 * * *
PREG
0.6357 0 1.3274 1 5. 8283 2
202.2182 3 O. 0631 4 0.0179 5 0.0000 6 O. 0000 7 0.9126 8
174. 8500 9 5.5452 A
96216.9711 B 1 I. 2078 C O. 9991 D O. 0330 E 7. 0000 I
P ~ S PREG
O. 0000 0 0.0000 1 O. 0000 2 O. 0000 3
15.9711 4 87. 1005 5 25. 6500 6
183.3325 7 125. 7695 8
Z 0000 9 5. 5452 A
96216.9711 B 11.2078 C O. 9991 D O. 0330 E Z 0 0 0 0 I
HP-67 cannot print out the results, therefore recall commands have to be used as indicated in the list o f results
Data example:
tm = 174.85 (mm) paper speed = 30 ram/rain
data pairs
bo,s (mm)
0.95 1.0 1.3 1.9 3.2 5.8
11.5
results
r 2 =
a =
bo =
+ Sbo = + S a =
o( r --
n r e a l =
Qs =
TZreal = TZ/t =
tins (mm)
196.0 217.5 261.0 348 524 879
1591
0.99909
1.32739
0.63574 (ram)
0.06312 = 1.4 % of a
0.01789 = 9.9 % o f b o
0.205
96, 216.97
0.91
202.22 (peaks between k = 0 and k = 10)
3.15 (peaks/min in this range k = 0 til
k = 10)
2. Application for simple linear regression:
ON NORM RUN Enter program Press f(a)
enter Yl press A enter xt pressBB enter Y2 press A enter x~ press B
Continue til last pair (minimum: three pairs) Press C
Chromatographia, Vol. 10, No. 6, June 1977 337

1.00000 2. 00000 2. 00000 4, 00000 4. 00000 Z 9OO0O Data O. 99996
O. 50907 - O. 02536
0.01680 0,00321 O. 00092
- O. 02536 O, 50907 O. 00000 O. 00000 O. 01680 0.00321 O. 00000 0,00000 O. 00000
O. 00000 O. 00000
O. 00000 4. 58333 O. 99996 O. 00891 3. O00OO
GS6a GSBA GSBB GSBA GSBB GSBA GSBB
SkJl~.tt
PREG
0 1 2 3 4 5 6 7 8 9 A B C D E I
P ~ S PREG
O. 00000 0 O. 00000 1 O, 00000 2 O. 00000 3
13.90000 4 82,41OOO 5
Z 00000 6 21. 00000 7 41.60000 8
3. 00000 9 O. 00000 A O. 00000 B 4. 58333 C O. 99996 D 0.00891 E 3. 00000 I
P ~ S
HP-97 prints stores data to get results
r : RCL D a RCL 1 bo RCL 0
-+ Sb RCL 4 + Sa RCL 5
ar stored in display
any new pair o f data can be entered and calculation can be continued.
Befor a new set o f paired data press f(a)
Data example y x
1 2 2 4 4 7 ,9
results
y = ax+ bo y = (0.50907 + 0.00321) x - 0 . 0 2 5 3 6 + 0.0168 r 2 = 0.99996 ar = 0.00092 degree
bo 1 i r I I I
Y = (a-+So)" x§ ]
338 Chromatographia, Vol. 10, No. 6, June 1977