the contribution of non-timber forest products to the rural … · · 2017-08-04forest plays...
TRANSCRIPT
International Journal of Applied Agricultural Research
ISSN 0973-2683 Volume 12, Number 2 (2017) pp. 157-169
© Research India Publications
http://www.ripublication.com
The contribution of Non-Timber Forest Products to
the Rural Livelihood:The case of yayo district, illu
ababora zone, oromia regional state, western
Ethiopia.
Adanech Asfaw1 and Lema Etefa2
1Mettu University, College of Agriculture and Forestry, Forestry Department,
Ethiopia. E-mail [email protected] 2Mettu University,Faculty of Natural and Computational Science, Department of
Biology, Ethiopia. E-mail [email protected]
Abstract
Different studies in different parts of Ethiopia have shown that many rural
households depend on NTFP for both subsistence and cash income. However,
information on the contribution of forests in household income is not
extensively documented in some parts of the country. This study was, aimed to
generate information on the type and income contribution of non-timber forest
product for local livelihoods and the level of dependency on the Yayu Coffee
Forest Biosphere Reserve. A total of 105 households were interviewed during
formal questionnaire survey from four (4) Yayo forest adjacent kebeles. Focus
group discussions and key informant interviews were also done in four(4)
kebeles. The qualitative data was summarized and quantitative data analyzed
using descriptive statistics and multiple linear regressions using SPSS version
20. The results indicate that the people in the study area depend on different
income sources. The Non-Timber Forest Products are the main sources of
household income which contributing 44.7% to the total household income,
followed by crop income(34.32%). Forest Coffee contributes the largest
proportion of the total NTFPs income (74.9 %). In relative term income
contribution of NTFP to poor and medium households, were above half of
their total household income, 55.5% and 57.5% respectively, while for rich
house hold it contributing about 35% of the total HH income. Incontrust, in
absolute term contribution it is the rich household, which extracts NTFP
highly. This implies that high dependency of the different wealth categories on
the forest. Factors that significantly influence income from the forest include

158 Adanech Asfaw and Lema Etefa
the total land holding, HH wealth status and forest coffee land holding. Yayo
forest plays important role in the rural household livelihoods. Therefore a
forest management strategy that involves the local people participation in
forest management practices may contribute positively in rural livelihood
improvements and will reduce forest destruction.
Keywords: Non-Tinmber Forest Product, Rural Livelihoods, ,forest coffee,
income sources, Wealth status.
1. INTRODUCTION
1.1. Background Information
Non-Timber Forest Products (NTFPs1) are any product or service other than timber
that is produced in a forest (CIFOR, 2004). They include fruits, nuts, vegetables, fish
and, medicinal plants, resins, essences, and a range of barks and fibers such as
bamboo, rattans, and a host of other palms and grasses”. Non-timber forest products
(NTFPs) constitute an important source of livelihood for millions of people across the
world (CIFOR, 2004). Probably the majority of rural households and a large
proportion of urban households in developing countries, depend on NTFP to meet
some part of their nutritional, cooking and/or health needs (Byron and Arnold, 1999).
As stated by different researchers the majority of farming communities in Ethiopia are
forest dependant for their livelihood and subsistence use (Demel et al., 2010;
FDREPCC,2008;Gardei 2006; Getachew et al., 2007; Mohamed, 2007; Mulugeta, et
al, 2003). According to Gardei (2006), more than 65 percent of the households who
were involved in NTFP’s did earn more than one thousand Birr (about USD 100 a
year from the production of NTFP’s alone, while around half of the people use the
forest to generate cash income. The most important NTFPs that generate substantial
income to rural household and foreign currencies in Ethiopia are coffee, honey, and
natural gums and resins. Mulugeta, et al., (2003) also explained that the average
annual cash income generated per household from oleo-gum resin was estimated to be
US$ 80.00. One of the geographic areas in Ethiopia that is fully un-quantified is the
Yayo Coffee Forest Biosphere Reserve. Due to its diverse ecosystem and rich
biodiversity, the Biosphere has a rich products, but the role that these forest resources
play in the rural livelihoods is little documented (limited to the high value coffee
production). This study was aimed to generate information on the type and
contribution of non-timber forest product for local livelihoods and the level of
dependency on the Yayu Coffee Forest Biosphere Reserve resources. The information
generated is expected to contribute to the improved management of the forest by
incorporating the need of local people and to national economic statistics from
forestry.
1 NTFP is Non-Timber Forest Product

The contribution of Non-Timber Forest Products to the Rural Livelihood.. 159
2. METHOD AND MATERIALS
2.1. Study area description
2.1.1. Geographical location and Biophysical characteristics
The research was conducted at Yayo district on Yayo coffee forest biosphere reserve.
The Yayu coffee forest is one of the 58 national forest priority area in Ethiopia. It is
located about 560 km from Addis Ababa toward western, and 38km from Mettu town
toward east. It lies between 8°21’– 8°26’N latitude and 35°45’–36°37’E longitude
within an altitudinal range of 1200 to 2000 m.a.s.l (Fig. 1). The Yayo districts have
three climatic zones: These are highland; temperate and lowland. Such diverse
climatic conditions and habitats partly contributed to the occurrence of high plants
and animals species diversity. It is characterized by a uni-modal rainfall distribution
which extend from May to October and declines in November. The average annual
precipitation makes vary from 1,191.6mm to 1, 960.7mm with mean daily
temperature 230C ranging from 18.590c to 27.880c. The study area (Yayo district) is
divided into three conservation zones, Core zone, Buffer zone and transition zone
(Tadesse,2003). The Yayo National forest priority biosphere covers about 58,460
hectares. The dominant plant species in Yayo forest ecosystem are Albizia gummifera
(Hambabessa) and Cordia africana (Waddessa) (Tadesse,2003).
The total population of the woreda accounts 51,217 which 25,887 and 25,330 are
males and female population respectively. In general, the woreda has a total
household of 9917 who resides in the rural kebeles and one Kebele of Yayo town
(YWAO, 2013 report).
Figure 1 Study area map

160 Adanech Asfaw and Lema Etefa
2.2. Sampling technique and procedures
Multistage stratified sampling techniques were used to select the study population.
This has been done in the following procedure: First, one district namely Yayo district
was selected purposefully on the bases of socioeconomic characteristics and
involvement in forest collection. Next, from the selected district, a total of 4 forest
adjacent kebeles2(Waboo,Bondo,Geci,Wixete) based on their dependency on NTFP
were selected. From the selected kebeles 5% of the total households live in the
respective kebeles were taken as sample households with a total 105 sample
households. Two key informants as well as village leaders, kebeles leaders, DAs and
Woreda forestry experts were interviewed were selected from each village for
interview. The household selection was made randomly after wealth ranking.
2.3. Methods of Data Collection and Analysis
Various data collection tools were used to collect the required information. Formal
survey questioner to collect quantitative data from the selected households and focus
group discussions and interview were used to gather mainly qualitative information.
The qualitative data was qualitatively interpreted while ,the quantitative data was
analyzed by descriptive statistics and the econometric analysis. The analysis was
subjected to the Statistical Package for Social Sciences (SPSS) version 20.
3. RESULTS
3.1. Socio-economic character stics of sample household
The majority (89.5%) of the sample households were male headed whereas only
10.5% were female headed. The age of the respondents ranged from 21 - 82 years
with the mean age of 45.96 years. About 96.19% of the sample households were in
productive working age (under 65 years), while only 3.81 % of the households were
older than 65 years. Out of the sampled households widows made up 7.6%, divorced
2.9% and 88.6% married, while only 1% of the samples households were single.
Family size ranged between 1-11 persons, with a mean of 5.52 which is almost similar
with the Ethiopian national average family size. About 39% of the respondents were
illiterate, while 35.2%, 21% and 4.8% had a primary school, secondary school and
college level, respectively.
3.2. The main income sources and their contributions to the total household
income
The farming practice in the study area can be described as mixed farming system. The
people in the study area depend on crop production, forest product collection,
livestock husbandry, off/non-farm activities (petty trade and wage employment) and
2 Kebeles=is the local administrative unit(Pisant Asosation,PA)

The contribution of Non-Timber Forest Products to the Rural Livelihood.. 161
own farm woodlot for their livelihood. About 55.2% and 32.4 % of the sampled HHs
ranked crop production and NTFP as their first priority income source while 8.6% of
the sampled household own woodlot, 2.9% of the sampled household animal
husbandry and 1% of the sampled household off-farm activities take as their first
priority income sources.
The total household income is the sum total of income from the above five income
categories. The maximum total annual income of the sampled households in the study
area was 234220.00 ETB with mean and minimum income 36013.19 ETB and
3070.00 ETB, respectively. However much of the income goes to household
subsistence rather than cash saving. Non Timber Forest products, Crop production,
off/ non-farm activities, livestock and own woodlot trees contribute to the total
household income in the order of 44.7%, 34.32%, 11% and, 8.987% and 1%,
respectively (Figure 2).
Figure 2: The Major Sources of income and their mean contribution (ETB / year/ hh)
3.3. Types of Non-Timber Forest Product and their income contribution
3.3.1. Types of Non-Timber Forest Products
In the study area, forest coffee, fire wood, wide honey, wide spice and farm inputs
were identified as the first major types of forest products have been extracted from the
forest. Limited medicinal plant and forest grass are also reported. Finding from focus
group discussions indicate that the communities’ donot allowed to extract the forest
products like Timber, forage and forest grazing.
Of the sampled almost all (98.1%) households engaged in forest product collection as
their sources of income even though the forest product preference is vary among
households (Table 3). As stated by focus group discussion the most important forest
product which many households depend on, was fire wood. Nearly all households
(95.2) in the study area engaged in the forest for firewood collection, only about 4.8%

162 Adanech Asfaw and Lema Etefa
of households were not responded. This implies that many households in the study
area were depending on the forest for their household energy consumption. In this
study area no one has responded firewood collection for cash income earning.
Forest coffee is the very important and high value commercial forest product, which
of the NTFP that about 83.8% of the sampled household were engaged on. About
20% and 12.4% of the sampled households were engaged on Wide spice and wide
honey respectively. As stated on focus group discussion, in the study area the practice
of traditional medicinal plant and animal feed collection were common, but their
monetary value were undefined. Because of the undefined unit price of these
products, we couldn’t get their proportional income contribution to the total forest
income (Table 1).
Table 1:Types of NTFPs available in the study area
Types of forest product Frequency Percentage (%)
Fire wood 100 95.2
Forest Coffee 88 83.8
Wilde spice 21 20
Wide honey 13 12.4
Medicinal plant 0 0
Animal feed 0 0
Total household forest engagement 103 hh 98.1%
3.3.2. Non-Timber Forest Product Income contribution
In the study area Non-Timber Forest Products are the main sources of household
income contributing 44.7% to the total household income, followed by crop income.
The total income derived from the Non-Timber Forest Product by the sample
households varies from 0 to 62,838 ETB with a mean of 16086.94 ETB per annum.
The contribution of Non-Timber Forest Products to the Rural Livelihood.. 163
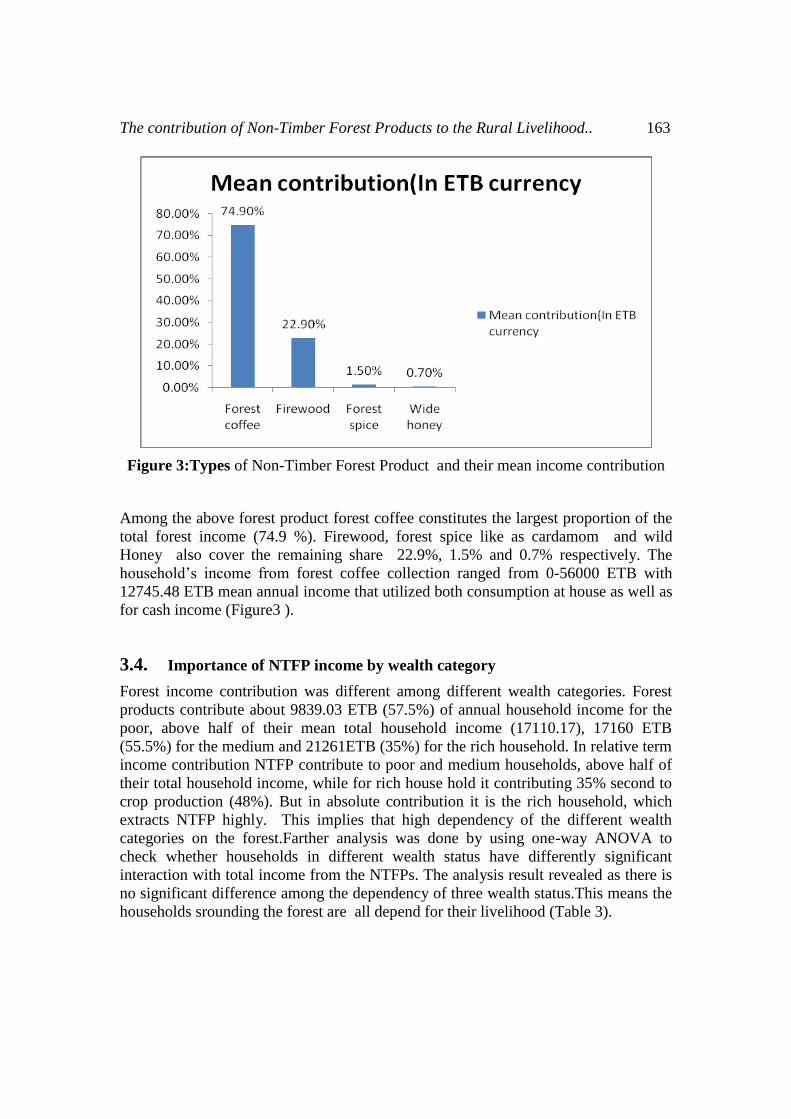
Figure 3:Types of Non-Timber Forest Product and their mean income contribution
Among the above forest product forest coffee constitutes the largest proportion of the
total forest income (74.9 %). Firewood, forest spice like as cardamom and wild
Honey also cover the remaining share 22.9%, 1.5% and 0.7% respectively. The
household’s income from forest coffee collection ranged from 0-56000 ETB with
12745.48 ETB mean annual income that utilized both consumption at house as well as
for cash income (Figure3 ).
3.4. Importance of NTFP income by wealth category
Forest income contribution was different among different wealth categories. Forest
products contribute about 9839.03 ETB (57.5%) of annual household income for the
poor, above half of their mean total household income (17110.17), 17160 ETB
(55.5%) for the medium and 21261ETB (35%) for the rich household. In relative term
income contribution NTFP contribute to poor and medium households, above half of
their total household income, while for rich house hold it contributing 35% second to
crop production (48%). But in absolute contribution it is the rich household, which
extracts NTFP highly. This implies that high dependency of the different wealth
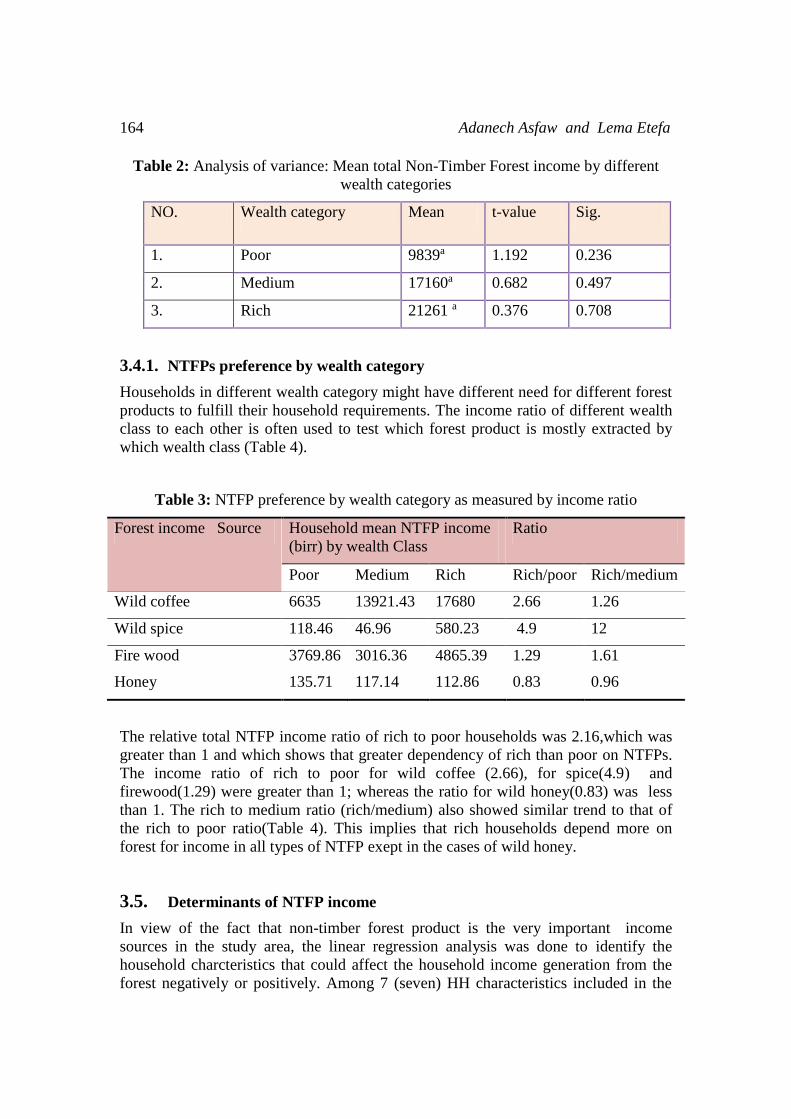
categories on the forest.Farther analysis was done by using one-way ANOVA to
check whether households in different wealth status have differently significant
interaction with total income from the NTFPs. The analysis result revealed as there is
no significant difference among the dependency of three wealth status.This means the
households srounding the forest are all depend for their livelihood (Table 3).
164 Adanech Asfaw and Lema Etefa
Table 2: Analysis of variance: Mean total Non-Timber Forest income by different
wealth categories
NO. Wealth category Mean t-value Sig.
1. Poor 9839a 1.192 0.236
2. Medium 17160a 0.682 0.497
3. Rich 21261 a 0.376 0.708
3.4.1. NTFPs preference by wealth category
Households in different wealth category might have different need for different forest
products to fulfill their household requirements. The income ratio of different wealth
class to each other is often used to test which forest product is mostly extracted by
which wealth class (Table 4).
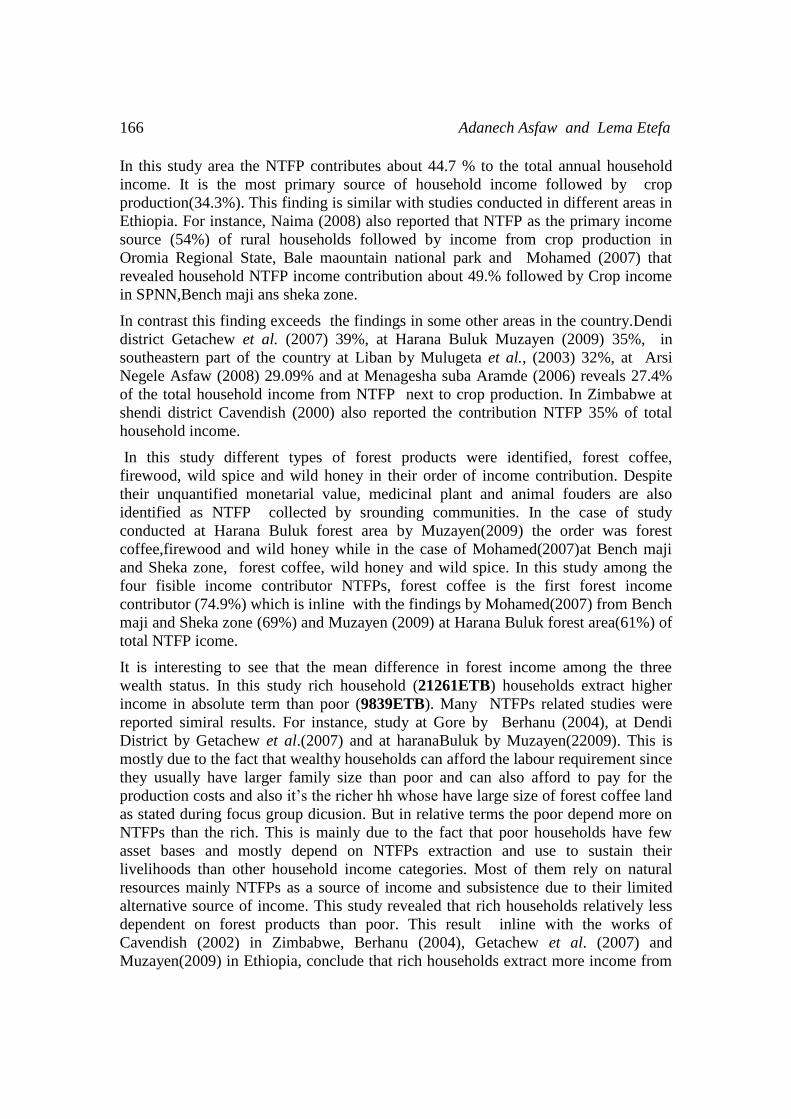
Table 3: NTFP preference by wealth category as measured by income ratio
Forest income Source Household mean NTFP income
(birr) by wealth Class
Ratio
Poor Medium Rich Rich/poor Rich/medium
Wild coffee 6635 13921.43 17680 2.66 1.26
Wild spice 118.46 46.96 580.23 4.9 12
Fire wood 3769.86 3016.36 4865.39 1.29 1.61
Honey 135.71 117.14 112.86 0.83 0.96
The relative total NTFP income ratio of rich to poor households was 2.16,which was
greater than 1 and which shows that greater dependency of rich than poor on NTFPs.
The income ratio of rich to poor for wild coffee (2.66), for spice(4.9) and
firewood(1.29) were greater than 1; whereas the ratio for wild honey(0.83) was less
than 1. The rich to medium ratio (rich/medium) also showed similar trend to that of
the rich to poor ratio(Table 4). This implies that rich households depend more on
forest for income in all types of NTFP exept in the cases of wild honey.
3.5. Determinants of NTFP income
In view of the fact that non-timber forest product is the very important income
sources in the study area, the linear regression analysis was done to identify the
household charcteristics that could affect the household income generation from the
forest negatively or positively. Among 7 (seven) HH characteristics included in the

The contribution of Non-Timber Forest Products to the Rural Livelihood.. 165
model as independent variables, four(4) of them were shows statistically significant
result. The total land holding in hectar(P<0.001) and HH wealth status(p<0.1) were
related with household total NTFP income positively and significantly(Table5). This
implies wealthy HHs and household that have large size of total land is more likely to
be a collector of forest products. This is may be because of the HH’s total land
holding is the sum total of forest coffee land holding as well as other land use
type(farmland,grazing land,homestead/woodlot) and because of that coffee land
holding is one of the criteria for wealth status classification in the syudy area. While,
income from garden coffee (p<0.05) and respondebts age were negatively and
significant related with NTFP income(Table5). This shown us the HHs that have lagre
garden coffee production potencial were less engaged in NTFP collection as well as
the older the hh age the less capability to extract NTFP and less dependent on income
from NTFPs. However other variables, like respodent sex, family size and
educational level were not shown significant diference with total NTFP
income(Table5).
Table 4:- Regression analysis results
Variables Coefficient p-value
1. Respondent sex -0.010 0.915
2. Respondent age -0.167 0.085*
3. Family size 0.021 0.826
4. Respondent's wealth status 0.190 0.078*
5. Total land holding in ha 0.539 0.000***
6. Respondent's educational level 0.042 0.655
7. Income from garden coffee -0.327 0.003***
Significant level: *p<0.1, **p< 0.05% and *** p<0.01
4. DISCUSSION
The local people in the study area depend on a number of income sources. Crop
production, animal husbandry, forest product, off/non-farm activities and own farm
trees are main household’s income sources. Several studies have observed the rural
people dependency on such portfolio of income source for livelihood. They combine
the income from forest product with income from other farm and off/non-farm
activities to improve their welfare. In the study area (Wabo, Bondo, Gechi and Witete
kebeles) NTFP is the most cruitial sources of household annual income and this study
supports the notion of high dependency of rural peopulations on the forest for their
livelihood .
166 Adanech Asfaw and Lema Etefa
In this study area the NTFP contributes about 44.7 % to the total annual household
income. It is the most primary source of household income followed by crop
production(34.3%). This finding is similar with studies conducted in different areas in
Ethiopia. For instance, Naima (2008) also reported that NTFP as the primary income
source (54%) of rural households followed by income from crop production in
Oromia Regional State, Bale maountain national park and Mohamed (2007) that
revealed household NTFP income contribution about 49.% followed by Crop income
in SPNN,Bench maji ans sheka zone.
In contrast this finding exceeds the findings in some other areas in the country.Dendi
district Getachew et al. (2007) 39%, at Harana Buluk Muzayen (2009) 35%, in
southeastern part of the country at Liban by Mulugeta et al., (2003) 32%, at Arsi
Negele Asfaw (2008) 29.09% and at Menagesha suba Aramde (2006) reveals 27.4%
of the total household income from NTFP next to crop production. In Zimbabwe at
shendi district Cavendish (2000) also reported the contribution NTFP 35% of total
household income.
In this study different types of forest products were identified, forest coffee,
firewood, wild spice and wild honey in their order of income contribution. Despite
their unquantified monetarial value, medicinal plant and animal fouders are also
identified as NTFP collected by srounding communities. In the case of study
conducted at Harana Buluk forest area by Muzayen(2009) the order was forest
coffee,firewood and wild honey while in the case of Mohamed(2007)at Bench maji
and Sheka zone, forest coffee, wild honey and wild spice. In this study among the
four fisible income contributor NTFPs, forest coffee is the first forest income
contributor (74.9%) which is inline with the findings by Mohamed(2007) from Bench
maji and Sheka zone (69%) and Muzayen (2009) at Harana Buluk forest area(61%) of
total NTFP icome.
It is interesting to see that the mean difference in forest income among the three
wealth status. In this study rich household (21261ETB) households extract higher
income in absolute term than poor (9839ETB). Many NTFPs related studies were
reported simiral results. For instance, study at Gore by Berhanu (2004), at Dendi
District by Getachew et al.(2007) and at haranaBuluk by Muzayen(22009). This is
mostly due to the fact that wealthy households can afford the labour requirement since
they usually have larger family size than poor and can also afford to pay for the
production costs and also it’s the richer hh whose have large size of forest coffee land
as stated during focus group dicusion. But in relative terms the poor depend more on
NTFPs than the rich. This is mainly due to the fact that poor households have few
asset bases and mostly depend on NTFPs extraction and use to sustain their
livelihoods than other household income categories. Most of them rely on natural
resources mainly NTFPs as a source of income and subsistence due to their limited
alternative source of income. This study revealed that rich households relatively less
dependent on forest products than poor. This result inline with the works of
Cavendish (2002) in Zimbabwe, Berhanu (2004), Getachew et al. (2007) and
Muzayen(2009) in Ethiopia, conclude that rich households extract more income from
The contribution of Non-Timber Forest Products to the Rural Livelihood.. 167
the forest in absolute terms, but less in the share in the total household income
comparing to poor.
In terms of determinants of total NTFP income, the total land holding in hectar and
HH wealth status were related with household total NTFP income positively and
significantly. The positive relation between NTFP and total land holding implies that
household that have large size of total land is more likely to be a collector of forest
products.This may be due to that total land holding is the sum total of forest coffee
land from which high coffe production is and other land use type.This study agrees
with the study at Benchi amji and Sheka zone by Mohamed(2007) and at Harena
buluk by Muzayen(2009) who stated that households with wild coffee land generate
more income from NTFP more than those households who don’t have wild forest
coffee land.
The positive sign between wealth status and total NTFP income shows the rich
households generated more income NTFP than the poor households,which supports
the statistical result. The reason for this could be that rich households have a better
potenaincials to extract forest products than poor.This similar with the statistical
findings of many researchrs in the country, such as,Getachew(2007), Birhanu (2004),
Asfaw (2008) and Naima(2008). While, the negative sign between the total income
from garden coffee and the total income from NTFP implies that less dependency of
the hhs those have high potencials of garden coffee production than the hhs those who
have no garden coffee land.
5. CONCLUSION AND RECOMMENDATION
5.1. Conclusion
The rural people in the study area depends on diverse livelihood activities including
crop production, forest products collection, livestock husbandry and off/ non-farm
activities and also they depend on the limited own farm tree. The contribution of the
Yayo forest to the adjacent rural household’s income is very important even though it
was not well recorded and given more attention. Therefore policy makers and
developmental initiatives that targeted to Yayo forest conservation and protection
should give more attention to the surrounding rural livelihood sustainability. Income
from the forest product collection supports rural people through regular consumption,
gap felling during seasons of grain shortfall as well as income specialization despite
of wealth status. In absolute terms the rich household categories extract more NTFPs
income than the poor households even though the poor household categories are more
dependent on NTFP extraction in relative term. Similarly household those who have
large size of total land in ha benefits more from NTFP than those have small land
holding. On the other hand HHs those who have large cultivated garden coffee
production are less dependent on the income from NTFPs than those who have no
garden coffee land. Therefore, dealing with the surrounding communities’ perceptions
toward the domestication system, thus integration of coffee with crop and livestock
production in the form of agro forestry system which is already initiated by some
168 Adanech Asfaw and Lema Etefa
HHs, could provide solution for both short term and long term livelihood
improvement while reducing pressure on the forest resources. Policies that aimed to
deprive the community of the right to use nearby forest, without providing any
alternative income souces, could affect the livelihoods of many rural community,
therefore a forest management strategy that involves local people participation in
forest management practices may contribute positively in rural livelihood
improvements and to reduce forest destruction.
5.2. Recommendation
Based on the findings of this study, we recommended the following points.
The polices that targeted the Yayo forest coffee biosphere should take in to
account NTFPs as a visible and potential income sources for forest adjacent
community.
Encouraging domestication, specially of wild coffee and spice, will improve
both the productivity and the quality of the produce.
Current honey production system is totally traditional which could not
generate better quality and quantity product of honey, therefore, it is
recommended to look into its improvement through better production system.
Adding value to commercialized NTFPs, specially of coffee processing, will
improve the households’ income and mitigate forest destruction through
improving livelihood of the people.
Enhancing the perceptions of rural communities, toward the comercializations
of traditional medicinal plants.
Further studies should required on Yayo Coffee forest biosphere current
Deforestation and Degradation status as well as other forest related problems.
To generate more conclusive information at national level on the income
contribution of forest resource to the rural dwellers, similar studies should be
conducted in other parts of the country where as such study was not
conducted.
REFERENCE
[1] Asfaw Tefera (2008). The contribution of forest resources to rural Livelihoods
in ashoka area of arsi negele district, west Arsi zone of oromia national
regional state, ethiopia.Hawasa University WCFN Ethiopia.
[2] Birhanu,D. (2004). Contribution of Non-Timber forest products to the rural
household economy: Gore district, Southwestern Ethiopia. MSc. Thesis.
SLU/W

The contribution of Non-Timber Forest Products to the Rural Livelihood.. 169
[3] Byron,N. and Arnold, J.E.M.(1999). What futures for the people of the
tropical forests World Development, 27(5): 789-805.
[4] Cavendish, W.(2000). Empirical regularities in the poverty-environment
relationship of rural households: evidence from Zimbabwe. World
development, 28(11):1979-2003.
[5] Center for International Forestary Research (CIFOR) (2004). Forests for
people and the environment. CIFOR Annual Report, 2004.
[6] Chikamai, B.N. and J. Kagombe, (2002). Country report for Kenya. In: Review
and synthesis on the state of knowledge of Boswellia spp. and
commercialisation of Frankincense in the drylands of Eastern Africa. KEFRI,
Nairobi.
[7] Getachew, M., Sjaastad, E. and Vedeld, P. (2007). Economic dependence of
forest resources: A case from Dendi District, Ethiopia. Forest Policy and
Economics, 9: 916- 927.
[8] Mohamed Adilo (2007). The contribution of non-timber forest products to
rural livelihood in southwest Ethiopia. MSc. Thesis, Wageningen University
and Research Center.
[9] Mulugeta, L., Tarekegn, A. and Olsson, M. (2003). Gum and resin resources
from some Acacia, Boswellia and Commiphora species and their economic
contribution in Liben, Southeastern Ethiopia. Arid Environment, 56: 146-166.
[10] Muzayen Sultan(2009). The role of Non Timber Forest Products to Rural
livelihoods and Forest Conservation: A Case Study at Harana Bulluk District
Oromia National Regional State, Ethiopia. MSc.Thesis Hawasa university
WCFN Ethiopia
[11] Neima Aliyi (2008). An analysis of socio-economic importance of Non-
Timber Forest Products for rural households: Case study from Bale Mountains
National Park,Ethiopia. MSc. Thesis Copenhagen University Copenhagen,
Denmark..
[12] TadeseW/Mariam(2003). Vegetation of the Yayu Forest in SW Ethiopia:
Impacts of human Use and Implications for in situ Conservation of wild
Coffea arabica L. Populations.Ecology and development Series 10.

170 Adanech Asfaw and Lema Etefa