the contribution of dynamic electromyography to gait … · section two chapter one the...
TRANSCRIPT

SECTION TWO
Chapter One
The Contribution of Dynamic Electromyography toGait Analysis
by Jacquelin Perry, M.D.
Dr. Perry is Director of the Pathokinesiology Lab at the Rancho Los Amigos Medical Center in Downey, California.
INTRODUCTION
The purpose of dynamic electromyography is toaccurately define the muscle action that controls jointmotion. While gross function of muscle groups can beinferred from motion and moment calculations, specific-ity of muscle function requires a more discriminatingtechnique.
The Functional ChallengeWalking relies on selective timing and intensity of
appropriate muscles at each joint to provide weight-bearing stability, shock absorption, and progression overthe supporting foot during stance and to advance thelimb in swing. Energy is conserved by activating onlythe muscles optimally aligned for each task and bysubstituting momentum and passive tissue tension fordirect muscle activity wherever possible.
Throughout this sequence of functions, the musclesperform in groups, as shown in Figure 1 (1) . While thedominant motions of the lower limb occur in the sagittalplane (i .e ., flexion and extension for the demands ofprogression), there also are significant actions in theother two planes (coronal and transverse) to enhancesingle limb balance and body rotations. Each muscle hasa unique three-dimensional (3D) effect determined byits alignment across the joint or joints it crosses . Inaddition, most muscles are members of two or more
HIP(hamstrings)
KNEE(vasti)
ANKLE / FOOT(plantar flexion)
IC
Figure I.Normal sequence of synergistic activity of the major extensormuscle groups during stance . Linear display of the EMG amplitudes(vertical scale) of the individual muscles identify their relativeintensity and timing . Hamstrings (biceps femoris, semimembranosus,semitendinosus) ; Vasti (intermedius, lateralis, medialis longus,medialis oblique) ; Plantar flexors (soleus, gastrocnemius, tibialisposterior [biphasicl) . IC (initial contact) indicates onset of stance.Note extensor muscles begin in late swing.
functional groups . This redundancy assures 3D balanceand serves to simplify the integration of adjacent jointaction. Relative intensity of action of a particular
TO
33

34
RRDS Gait Analysis in the Science of Rehabilitation
muscle is determined by which of its functions ismomentarily dominant. Hence, just understanding nor-mal function requires a detailed study of individualmuscle action . Such information alsocan identify theeffects of orthoses, muscle training regimens, etc.Dynamic electromyography offers the means of pre-cisely relating muscle action to the specific function.
The Influence of PathologyThe normal, complex walking pattern can be
disrupted in many ways . Muscles may be weakened bydisuse, pain, or direct injury . Fibrous tissue contracturemay limit passive mobility . Orthoses incidentally re-strict adjacent motion while purposefully protecting thearea of concern. Brain and spinal cord injury maydisrupt the primary motor control and feedback path-ways. Persons with spastic paralysis, stroke, or headtrauma, present the greatest diagnostic challenge asmuscle function is disrupted at many levels and theoverlay of spasticity often causes the clinical tests todiffer significantly from the muscle pattern used duringwalking . Even lower motor neuron lesions can presentunpredictable situations . Individuals preserve their abil-ity to walk by substituting, to the extent their selectivecontrol allows . Alternate motions and muscle actionsare used to overcome the limitations imposed bypathology . Such substitution capability varies markedlyamong individuals . Consequently, the person's walkingpattern is a mixture of primary functional loss andsubstitutive actions . The results are mixtures of inad-equate, excessive, inappropriately timed, or out-of-phasemuscle action . To best design retraining protocols,optimize orthotic assistance, or to plan an appropriatereconstructive surgical procedure, it is essential to knowmuscle function as it is occurring rather than assumed.This requires dynamic electromyography.
METHODS
Myoelectric Signal Anatomy
Electromyography (EMG) is a system that recordsthe electrical signals activating the muscle fibers . Fromsuch information, one can determine the timing andrelative intensity during both normal and abnormalfunction . Under specific circumstances, muscle forcealso can be calculated .
Figure 2.a) Muscle Fiber Structure: Each muscle fiber is a bundle ofmyofibrils (chains of contractile units called sarcomeres) . Interplayof the thin and thick filament within the sarcomere creates themuscle force . b) Muscle Fiber Myoelectric Signal : An electrical fieldis created by stimulation from the neuron activating the musclefiber's chemical receptors (shaded circles), which in turn, send anelectrical charge up and down each myofibril to activate the chain ofsarcomeres . Adapted from reference (2) . Used with permission.
Each muscle fiber consists of multiple long chains(myofibrils) of contractile units (2) called sarcomeres,which create the force of muscle action (Figure 2a) . Asthe local neuron chemically activates the muscle fiber atits myoneural junction, an electrical charge is sent upand down each myofibril (Figure 2b), stimulating thesarcomeres to contract (3) . This event creates anelectromagnetic field, which can be used to trackmuscle activity (4). By volume conduction, the localsignal spreads through the tissues making it technicallypossible to record the signal at the skin surface as wellas internally.
Neural control is simplified by having large groupsof muscle fibers controlled by a single motor cell bodylocated in the anterior horn of the spinal cord . This
a.MUSCLE FIBER
/
NEURON
MUSi
ELECTRICAL FIELD

35
Chapter One : EMG Dynamics
composite of cell body, connecting neuron, and themuscle fiber cluster is called a motor unit . Thegastrocnemius, for example, is composed of approxi-mately one million muscle fibers clustered in 600 motorunits (5) . Animal experimentation has shown that themuscle fibers of each motor unit are widely dispersedthrough the muscle . Only a few units are needed tocreate a weak effort throughout the whole muscle . In themultipennate soleus, for example, one motor unit isspread across 60 percent of the muscle's volume, asshown in Figure 3 (6). Theoretically, just two motorunits would be sufficient to traverse the whole muscle.In contrast, a motor unit in the unipennate tibialisanterior covers only 16 percent of the volume (7) . Now6 motor units would be needed . The practical interpreta-tion of this anatomical fact is that during walking andother physiological functions, muscle action can berecorded regardless of the location of the electrode overor within the muscle.
Interspersion of tendonous tissues, however, re-duces the concentration of muscle fibers ; thus, themiddle of the muscle belly is the site where the largestsignals are obtained . To be even more precise, maxi-mum signal occurs at the muscle's motor point (8) . Using the gastrocnemius as an example, 6 motor unitswould represent only 0 .1 percent muscular effort, whilea clinical strength grade of 2 (poor), which represents amuscle too weak to accept even the resistance ofgravity, averages 5 percent . Theoretically, this repre-sents 30 motor units, a minimum contraction situation.As more motor units are activated, the intensity of themuscular response increases and the EMG signalbecomes larger. Clinically, this is reflected as a greaterfunctional force.
Myoelectric Signal Qualities
The signal recorded during functional EMG isdescribed as random because it does not have aconsistent waveform. Instead, the individual spikes varyin amplitude and duration without an identifiablesequence . This inconsistency reflects the fact that everymuscular effort is a composite of multiple motor units,each activating multiple muscle fibers . In addition, eachfiber's response to stimulation is a brief twitch and,thus, repeated stimulation is required to generate auseful force . Hence, the EMG signal of muscle action is
Figure 3.Motor Unit Territory : The vertical shaded areas in the anterior andlateral projections show the distribution of the muscle fibers of onemotor unit within the rat soleus . The cross section identifies theindividual muscle fiber distribution (dots) for that motor unit.Adapted from reference (6) . Used with permission.
a train of randomly shaped action potentials. Inaddition, the raw recorded electronic signal is contami-nated by noise (i .e ., unwanted signals arising fromtissue motion and the environment, such as lights,neighboring motors, and so forth) . The unwantedelectronic noise is excluded by filtering and the use ofdifferential amplifiers, which reject common modesignals.
Waveforms are classified by their content ofdifferent sine wave frequencies Fourier analysis (4) . Insimplistic terms, sharply peaked waves have a highfrequency while broad waves have a low frequency . Thecomplex nature of myoelectric signals includes a very
36
RRDS Gait Analysis in the Science of Rehabilitation
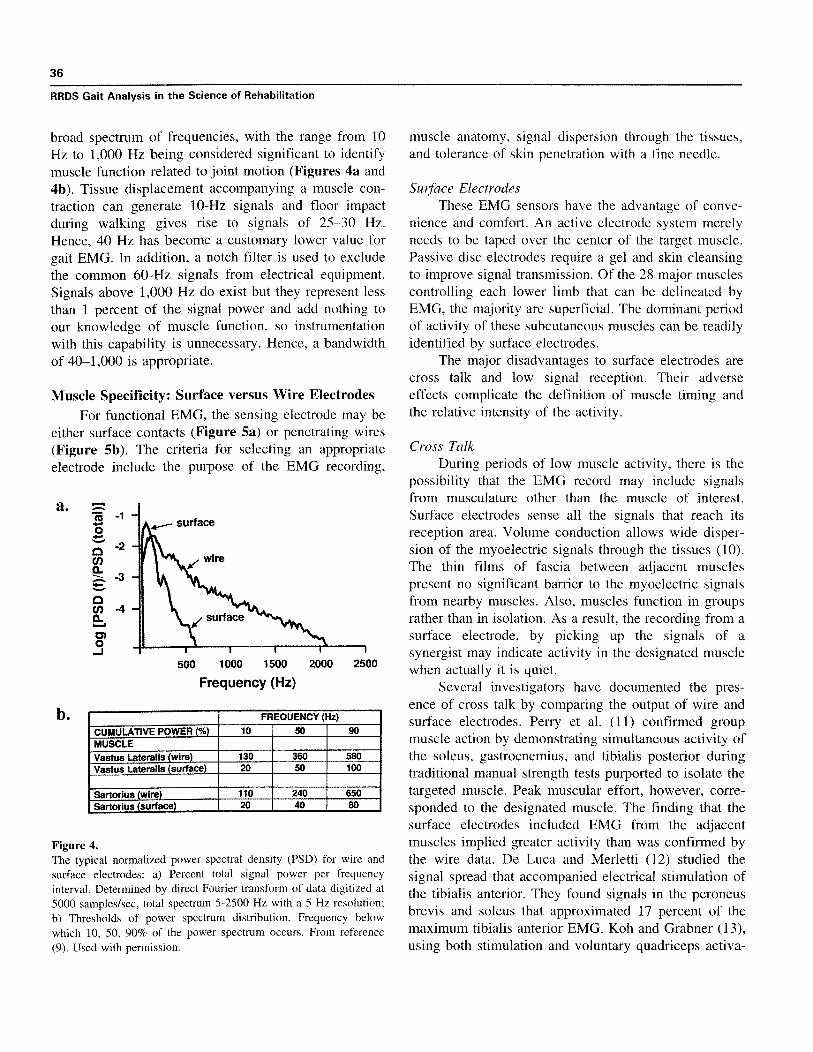
broad spectrum of frequencies, with the range from 10Hz to 1,000 Hz being considered significant to identifymuscle function related to joint motion (Figures 4a and4b) . Tissue displacement accompanying a muscle con-traction can generate 10-Hz signals and floor impactduring walking gives rise to signals of 25—30 Hz.Hence, 40 Hz has become a customary lower value forgait EMG. In addition, a notch filter is used to excludethe common 60-Hz signals from electrical equipment.Signals above 1,000 Hz do exist but they represent lessthan 1 percent of the signal power and add nothing toour knowledge of muscle function, so instrumentationwith this capability is unnecessary . Hence, a bandwidthof 40-1,000 is appropriate.
Muscle Specificity : Surface versus Wire ElectrodesFor functional EMG, the sensing electrode may be
either surface contacts (Figure 5a) or penetrating wires(Figure 5b) . The criteria for selecting an appropriateelectrode include the purpose of the EMG recording,
500
1000 1500
2000 2500
Frequency (Hz)
FREQUENCY (Hz)
CUMULATIVE POWER (%) 10 50 90MUSCLEVastus Lateralis (wire) 130 360 580Vastus Lateralis surface 20 50 100
Sartorius surface 20 40 80
Figure 4.The typical normalized power spectral density (PSD) for wire andsurface electrodes : a) Percent total signal power per frequencyinterval . Determined by direct Fourier transform of data digitized at5000 samples/sec, total spectrum 5-2500 Hz with a 5 Hz resolution;b) Thresholds of power spectrum distribution. Frequency belowwhich 10, 50, 90% of the power spectrum occurs . From reference(9) . Used with permission .
muscle anatomy, signal dispersion through the tissues,and tolerance of skin penetration with a fine needle.
Surface ElectrodesThese EMG sensors have the advantage of conve-
nience and comfort . An active electrode system merelyneeds to be taped over the center of the target muscle.Passive disc electrodes require a gel and skin cleansingto improve signal transmission . Of the 28 major musclescontrolling each lower limb that can be delineated byEMG, the majority are superficial . The dominant periodof activity of these subcutaneous muscles can be readilyidentified by surface electrodes.
The major disadvantages to surface electrodes arecross talk and low signal reception . Their adverseeffects complicate the definition of muscle timing andthe relative intensity of the activity.
Cross TalkDuring periods of low muscle activity, there is the
possibility that the EMG record may include signalsfrom musculature other than the muscle of interest.Surface electrodes sense all the signals that reach itsreception area. Volume conduction allows wide disper-sion of the myoelectric signals through the tissues (10).The thin films of fascia between adjacent musclespresent no significant barrier to the myoelectric signalsfrom nearby muscles . Also, muscles function in groupsrather than in isolation . As a result, the recording from asurface electrode, by picking up the signals of asynergist may indicate activity in the designated musclewhen actually it is quiet.
Several investigators have documented the pres-ence of cross talk by comparing the output of wire andsurface electrodes . Perry et al . (11) confirmed groupmuscle action by demonstrating simultaneous activity ofthe soleus, gastrocnemius, and tibialis posterior duringtraditional manual strength tests purported to isolate thetargeted muscle . Peak muscular effort, however, corre-sponded to the designated muscle . The finding that thesurface electrodes included EMG from the adjacentmuscles implied greater activity than was confirmed bythe wire data. De Luca and Merletti (12) studied thesignal spread that accompanied electrical stimulation ofthe tibialis anterior . They found signals in the peroneusbrevis and soleus that approximated 17 percent of themaximum tibialis anterior EMG . Koh and Grabner (13),using both stimulation and voluntary quadriceps activa-
a.
b.

37
Chapter One: EMG Dynamics
Figure 5a.Electrodes for DynamicEMG. Surface : (left) Apassive electrode paircontaining 2-mm diam-eter silver silver-chloridedisc centers . (Center andright) Examples of activeelectrodes with signalpreamplification circuitryimbedded in the electrodehousing . The elements ofthe center electrodes are1-cm by 0 .1-cm barsspaced 1 cm apart. Theright electrode elementsare 1-cm discs with aninterelectrode spacing of3 .5 cm.
Figure 5b.Intramuscular wire elec-trodes are a pair of 50-micron, nylon insulatednickel-chromium alloywires ' with the distal2-mm bare tips, placed ina 3.81 cm 25- or 30-gauge needle for intra-muscular insertion . Inset:Note, to allow singleneedle insertion, the ex-ternal barbs must differ inlength to avoid contactbetween the bared tips.
'California Fine-WireCompany, Grover Beach,CA 93433 .

38
RRDS Gait Analysis in the Science of Rehabilitation
a.
Figure 6.Cross talk : a) Surface electrode recording of antagonistic flexor ( )and extensor ( ) muscles during walking to identify cocontraction.Shaded area identifies occurrence of simultaneous EMG by bothelectrodes . Adapted from reference (14) . b) Wire electrode recordingof similar hamstrings ( ) and quadriceps ( ) action . Note thecontinuous baseline of EMG in the surface recording that is notpresent in the wire electrode data . This is a display of signal crosstalk from adjacent muscles . The taller shaded areas in bothrecordings represent true cocontraction of antagonist muscles.Adapted from reference (I) . Used with permission.
tion to study cross talk, found EMG signals in themedial and lateral hamstrings averaging 11 percent and17 percent of a maximum effort, respectively . Theyattributed the difference in these means to the greaterdistance of the medial electrode from the quadricepsmuscle mass . Hence, a significant level of cross talkfrom adjacent and even moderately remote muscles hasbeen confirmed for both the thigh and lower leg . Thiscomplicates the determination of onset and cessationtimes of muscles' action ; thereby confusing the preciseidentification of muscle phasing, which is a commonclinical objective.
At present, there is no established method forcircumventing these data complications . Research stud-ies have demonstrated that double differentiation canreduce the cross talk to half or less (12,14) . Thenecessary instrumentation, however, is just becomingavailable for use in the multiple muscle studies con-ducted clinically. Faced with this limitation, a possible
pragmatic approach might be to eliminate the lowintensity signals representing 17 percent of maximum orfrom 7 to 10 percent of a typical submaximal peakintensity . This could clarify some of the phasinginterpretations.
CocontractionThe interpretation of simultaneous EMG in an
agonist and antagonist may be confounded by thepresence of cross talk . As Koh and Grabiner concluded,low-to-moderate signals recorded with surface elec-trodes may be a cross talk artifact rather than cocontrac-tion (13,14) . This was demonstrated in a recent study ofcocontraction of antagonists in children (15) . Theauthors showed continuous EMG throughout the gaitcycle. Superimposed on an average 6.5 percent maxi-mum intensity baseline were regularly interspersedpeaks of 20 percent maximum (Figure 6) . Wireelectrode recording from the literature shows that thehamstrings and quadriceps normally overlap in theirfunctions only during limb loading (1) ; hence, truecocontraction was phasic not continuous.
Wire ElectrodesIntramuscular placement of the EMG sensors
circumvents the specificity limitations of surface elec-trodes . By having the electrode located within the targetmuscle, a much stronger signal is obtained and itsfrequency content is higher (Figure 7) . Both qualitiesserve to virtually eliminate the problem of cross talk.While myoelectric signals from neighboring musclesmay still spread through the tissues, their intensity isinsignificant due to their distance from the electrodes.
A second advantage of wire electrodes is theopportunity to use the same signal gain for all muscles.A gain of 1,000 with wire electrodes provides a strongsignal for all muscles . This allows the clinician tovisually estimate the relative intensity of one muscle'saction compared with the others . In contrast, the lowreception of surface electrodes (Figure 7) commonlyrequires increasing the gain many fold to obtain areadable signal and the cross talk signals would besimilarly magnified . Variability in soft tissue resistancealso often necessitates adjusting the gain for individualmuscles in order to obtain a readable signal . Thus, wireelectrodes allow precise differentiation in the activity ofadjacent muscles, making this technique preferable forsurgical decisions.
50
6 .5
0
b .
IC

39
Chapter One: EMG Dynamics
0
25
50
75
100
Muscle Effort (% Max)
I
I
I
25
50
75
100
Muscle Effort (% Max)
b. 100-
75 -
0
0 50
C.12w 25 -
wire
surface
Figure 7.a) Total signal power of wire and surface with different spacing between the paired electrodes . Wire 2 .5-cm spacing inserted with separate
needles . Wire 0 .1-cm spacing represents single needle insertion . Surface 2 .5- and 5 .0-cm spacing indicates distance between the centers of two
1-cm diameter discs . b) The Effect of Normalizing : For each electrode (wire and surface), the EMG recorded at each effort level (%Max) wasexpressed as a percent of the EMG obtained during the isometric maximum muscle test (MMT) . From reference (16) . Used with permission.
40
RRDS Gait Analysis in the Science of Rehabilitation
The disadvantage of wire electrodes is the need forskin penetration as the wire electrodes are inserted intothe muscle with a fine needle (gauge 25-30) . Unless thesubject has a bleeding tendency (which wouldcontraindicate wires), the only penalty is momentarydiscomfort . This is minimized by tensing the skin,knowing the desired location and making a rapidinsertion . Children as young as 4 years of age can besuccessfully tested with wire electrodes . Basmajian andStecko's technique of inserting both wires with a singleneedle has simplified electrode location (17) . A criticalfactor, however, is electrode fabrication . The end of thebarbs must be of different lengths so that their baredtips will not contact each other and short-out the signal(Figure 5b, inset).
For both electrode systems, it is essential that thelocation relative to the target muscle be accuratelydetermined . Following electrode application, activity ofthe target muscle is determined by palpable contractionand/or tension of its tendon during a low effort muscletest . Wire electrodes also allow precise localization bylight electrical stimulation through the electrodes . Elec-trodes must be moved until the desired muscle actioncoincides with the EMG.
EMG Signal TimingAs each muscle provides a specific function, the
basic information to be gained by dynamic electro-myography is phasing within the gait cycle . The fun-damental question is the time of onset and cessation ofeach muscle's activity relative to the limb motion . Asecond common concern is the time of peak effort . Tomake these determinations, some type of event markermust be included with the electromyographic recordingto permit phasing . A similarly timed record of limbfunction is also needed. By itself, the EMG trace is ameaningless sequence of action potentials.
Event MarkerThere are basically two methods of identifying the
onset of the gait cycle, the use of a footswitch system ora synchronizing indicator on the visible video, motion,or force recordings. Either approach allows one todesignate timing as percentage points within the gaitcycle . It is customary to begin with initial floor contactas 0 percent and end with next initial contact as 100percent. The functional significance is made clearerwhen the gait cycle is further divided into the functionalsubphases .
Footswitches offer the most versatile approach.While some normal gait studies use just a heel switch,this is seldom adequate as there is no indicatorseparating stance and swing . For pathological gait, aminimum of four switches on each foot is needed toaccommodate the various modes of floor contact (18).The critical sites are heel, medial and lateral forefoot,and great toe . With this system, the basic phases of gaitcan be determined . The initial double support periodidentifies initial contact and the loading response phase.Lifting the other foot (contralateral toe-off) identifiessingle stance . Mid and terminal stance are distinguishedas each being half of single stance . One can also relatethe EMG pattern to the duration each foot segment is incontact with the floor . Pathology can alter the heelcontact pattern in many ways with heel contact beingabsent, curtailed, or prolonged . While toe-off is theabsolute endpoint of stance, a pathological toe drag mayobscure the onset of swing . This not uncommonsituation, contradicts using "toe-off" as the start of agait cycle, which some investigators propose (19).
Timing InterpretationThe accuracy of defining the period of significant
muscle function by electromyography varies with thetechnique used . A gross estimate can be made from theraw EMG tracing. This immediately introduces thequestion of the minimum significant signal (i .e ., howsmall a signal has functional meaning) . Most muscleaction begins with small spikes representing preparatoryactivation of a few fibers prior to an EMG record,which progressively shows greater density and ampli-tude as the effort builds up to the dominant intensity . Atthe end of the action, there is a corresponding decre-ment . The slower the action, the more prominent arethese small onset and termination packets . They areabsent with ballistic movements . In addition, there maybe scattered small spikes between the dominant EMGpatterns . The inconsistency of these small spikes andamplitudes too small to represent more than tracefunction imply that they are inconsequential.
With experience, one can learn to subjectivelyfilter out these small spikes by eye . Kaufman found"good agreement" among experienced therapists ifthey averaged 10 cycles . Di Fabio(20) found thatcomputer designation with established criteria producedconsistent reproducibility of onset times, whereas visual
2 Personal communication, 1994 .
41
Chapter One: EMG Dynamics
analysis by three experienced therapists showed a 51percent intra-examiner variability and only a 23 percentconsistency among examiners . The Rancho computercriteria exclude spikes, which represent less than 5percent of the muscle's manual muscle test value, andsignal packets, which last less than 5 percent of the gaitcycle (21) . The purpose is to define meaningful musclefunction . A second variable is natural inconsistency intiming between strides . The onset and cessation timesfrom three gait cycles has proved to be representative ofaverage function.
Abnormal TimingFunctionally significant deviations from normal
timing may occur independently at either the onset orcessation of the EMG record, or both end points may beabnormal. These deviations have been classed aspremature, delayed, curtailed, prolonged, continuous,and out-of-phase activity.
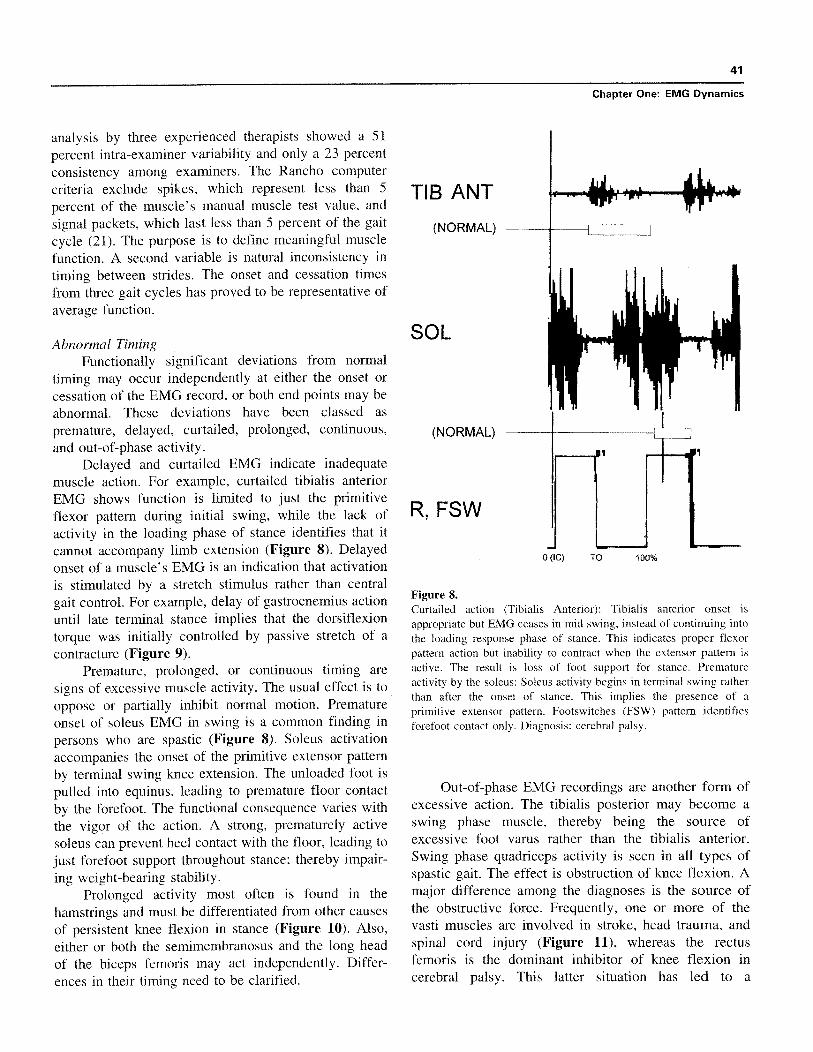
Delayed and curtailed EMG indicate inadequatemuscle action. For example, curtailed tibialis anteriorEMG shows function is limited to just the primitiveflexor pattern during initial swing, while the lack ofactivity in the loading phase of stance identifies that itcannot accompany limb extension (Figure 8) . Delayedonset of a muscle's EMG is an indication that activationis stimulated by a stretch stimulus rather than centralgait control . For example, delay of gastrocnemius actionuntil late terminal stance implies that the dorsiflexiontorque was initially controlled by passive stretch of acontracture (Figure 9).
Premature, prolonged, or continuous timing aresigns of excessive muscle activity . The usual effect is tooppose or partially inhibit normal motion. Prematureonset of soleus EMG in swing is a common finding inpersons who are spastic (Figure 8) . Soleus activationaccompanies the onset of the primitive extensor patternby terminal swing knee extension . The unloaded foot ispulled into equinus, leading to premature floor contactby the forefoot . The functional consequence varies withthe vigor of the action . A strong, prematurely activesoleus can prevent heel contact with the floor, leading tojust forefoot support throughout stance ; thereby impair-ing weight-bearing stability.
Prolonged activity most often is found in thehamstrings and must be differentiated from other causesof persistent knee flexion in stance (Figure 10) . Also,either or both the semimembranosus and the long headof the biceps femoris may act independently . Differ-ences in their timing need to be clarified .
Figure 8.Curtailed action (Tibialis Anterior) : Tibialis anterior onset isappropriate but EMG ceases in mid swing, instead of continuing intothe loading response phase of stance . This indicates proper flexorpattern action but inability to contract when the extensor pattern isactive . The result is loss of foot support for stance . Prematureactivity by the soleus : Soleus activity begins in terminal swing ratherthan after the onset of stance . This implies the presence of aprimitive extensor pattern . Footswitches (FSW) pattern identifiesforefoot contact only . Diagnosis : cerebral palsy.
Out-of-phase EMG recordings are another form ofexcessive action . The tibialis posterior may become aswing phase muscle, thereby being the source ofexcessive foot varus rather than the tibialis anterior.Swing phase quadriceps activity is seen in all types ofspastic gait . The effect is obstruction of knee flexion . Amajor difference among the diagnoses is the source ofthe obstructive force . Frequently, one or more of thevasti muscles are involved in stroke, head trauma, andspinal cord injury (Figure 11), whereas the rectusfemoris is the dominant inhibitor of knee flexion incerebral palsy. This latter situation has led to a

42
RRDS Gait Analysis in the Science of Rehabilitation
GAST
(NORMAL) --
R ANKLE
R, FSW
Figure 9.Delayed onset of gastrocnemius : Ankle goniometer (R Ankle) showsequinus (motion below baseline) at initial contact, which decreasesunder the stretching force of body weight progression.Gastrocnemius (GAST) EMG onset is delayed until 20% of the gaitcycle (normal onset is 5%) . This implies contracture tension is theearly plantar flexor force prior to stretch, stimulating muscle action.Footswitch (R,FSW) "staircase " identifies stance, baseline is swing.IC= initial contact; TO=toe-off. Diagnosis : post polio.
BFLH
(NORMAL) —
FTSW
Figure 10.Prolonged activity of the biceps femoris, long head (BFLH) untillate mid stance: The effect was persistent knee flexion in stancebeyond the loading response phase that followed initial floor contact(IC) . FTSW=footswitch . TO=toe-off. 0 to 100% identifies one gait
cycle. Diagnosis : Stroke hemiplegia .
0 (!C)
TO
100%
Figure 11.Out-of-Phase activity of the vastus medialis longus (VML) : Thecontinuous EMG identifies swing phase action as well as prolongedactivity in stance . Vastus lateralis (VL) displays a nearly normalEMG, identifying spastic muscles have individual sensitivities tostretch and primitive control . Rectus femoris (RF) action isprolonged . Both the VML and RF activity could impede swingphase knee flexion but the more dense EMG indicates that the VMLis the dominant inhibitor of knee flexion . R,FSW (right footswitch)designates stance (staircase) and swing gait phases . Subscripts(H,5,1) indicate foot area contacting the ground . Nearly continuousH (heel) contact implies calf muscle weakness . IC=initial contact):TO=toe-off. Diagnosis : Adult traumatic brain injury.
technique of using surface electrodes to identify whenthe rectus femoris is the cause of limited swing kneeflexion (22) . For all other diagnoses, intramuscularwires are needed to differentiate rectus femoris actionfrom out-of-phase vastus activity (23).
There are no criteria for the duration of a timingerror needed before motion is altered but usually theabnormal timing is quite gross. Superimposed on thetiming error is the effect of muscle intensity.
EMG IntensityMuscles increase their force by the activation of
additional muscle fibers or by increasing their firing
IC
TO
0 (IC)
TO
100%

43
Chapter One : EMG Dynamics
rate. Both responses create a more intense electro-myogram. Signal amplitude is increased as the simulta-neous action potentials add together, while asynchro-nous potentials form new spikes . Visual inspectionreveals an electromyogram with both amplitude anddensity increased. The level of EMG recorded dur-ing gait may or may not be similar to that occur-ring during the baseline muscle test . Normally, peakgait intensity is approximately a third of the maximumtest level . A gait record that exceeds the muscle testis an indication of poor voluntary control . In interpret-ing the raw clinical record, there are four signifi-cant levels of function : absent, inadequate (weak),appropriate (strong), and excessive . Absent gait EMGin a muscle with a notable muscle test value implies thateither it is shielded from stretch or being avoided as adetrimental force . Inadequate intensity implies mus-cle presence but inability to meet the functionaldemand. Excessive intensity, in the presence of a goodmuscle test record, is a sign of either obstructive forceor muscle overuse and potential fatigue (Figures 12aand 12b) . Visual comparisons of relative intensityamong muscles are very convenient with wire electroderecords, since the same amplification is used for allmuscles . With surface electrodes, however, obtaining areadable record generally requires the tester to individu-ally adjust the amplification of each muscle record toovercome the difference in the impedance of theoverlying skin and soft tissues . Hence, similar recordamplitudes can represent very different musculareffort .
Muscle intensity also can be quantified by either adescriptive scale or computer measurement . A custom-ary descriptive scale uses four intensity levels, withgrade four indicating maximum. Small changes, how-ever, are difficult to identify . Today, it is more commonto quantify the EMG by computer. This allows finegrading of the muscular effort and accurate discrimina-tion of small differences.
Computer Signal QuantificationThree steps are involved in providing a meaningful
numerical value for the muscles' EMG . The raw EMGis rectified, digitized, and normalized (Figure 13).Normalization permits the comparison of effort changesamong two or more muscles despite the inability toeither determine or control the number of muscle fibersthat an electrode samples .
TIB ANT --
FTSW
Figure 12a.The EMG of this tibialis anterior represents a sparse number ofenlarged motor units functioning at a higher than normal intensity(quantified as approximately 70% of its muscle test) . Excessiveaction also is evident by the persistence of the same intensitythroughout its function phase (swing and early stance) . Diagnosis:Post poliomyelitis muscle overuse.
TIB ANT
TO
lc
Figure 12b.Normal tibial anterior is EMG of a young adult : The quick, denseEMG packet provides vigorous dorsiflexion to lift the foot from itsplantar flexed position at the onset of swing (TO) . Tissue tone issufficient to support the foot in mid swing (EMG absent) . Secondburst reactivates dynamic dorsiflexion to support the foot in terminalswing and early stance.
NormalizationTo accommodate the need to use uncontrolled
EMG samples, all of the EMG values obtained for agiven muscle are compared to a normalizing base . Mostcommonly, this base is the EMG accompanying a

44
RRDS Gait Analysis in the Science of Rehabilitation
C
Figure 13.Computer quantification of EMG record : a) the raw analog data arecollected digitally by sampling the signal at 2500 Hz ; b) the signalsthen are rectified by transposing the negative values to positive ; andc) the data are normalized and summed over designated intervals(usually 1% of the gait cycle) to generate a linear envelope thatexpresses the data as percents of the maximum EMG reference.
maximum effort by that muscle. Hence, the individualtest values are expressed as a percentage of the basevalue (i .e ., %MVC).
To meet the time constraints of simultaneouslytesting six or eight muscles in a clinical setting, themanual muscle test maximum is the customary normal-izing base (%MMT) . The procedure consists of record-ing the EMG during the maximum effort test, calculat-ing the mean for the one second with the highest EMG,and then relating each functional EMG to that valueusing a common time interval, generally 0 .01 second or1 percent of the gait cycle.
An alternate approach uses each muscle's peakEMG in the gait cycle as the normalizing base and all
other phase values are related to it . This is convenientbut it does not allow one to compare relative intensityamong muscles, since the peak effort for each is 100percent . This most often is used in situations where poorpatient cooperation makes muscle testing difficult.
Electromechanical DelayThe time between the onset of the myoelectric
signal and the initiation of muscle tension is called theelectromechanical delay (EMD) . This interval is as-sumed to represent the propagation of the actionpotential along the muscle, the excitation-contractioncoupling process, and stretching of the muscle's serieselastic component by the contracting component (8).This delay is significant only if one wants to preciselyrelate EMG and motion in selected research studies . Ingeneral clinical practice, however, the difference intiming is inconsequential . As the following summaryidentifies, it also involves a very short time period(5,8,24–26).
The differences have been found to relate to threevariables : method of muscle activation, mode of record-ing the signals, and the method of identifying muscletension. Voluntary effort created the longest delays, andknee extension, which requires moving a larger massthan elbow flexion, was slower . Significantly fasterstimulation was attained with a reflex hammer or anelectrical current (Figure 14) . Among the methods ofidentifying the onset of muscle tension, the slowest wasa gross exercise unit, such as a Kin-Corn or goniometer(26) . A load cell force transducer in intimate contactwith the leg registered a quick response (8,27), but themost sensitive motion instrument was an accelerometer.Involved in these differences are both the inertia of thelimb and the lag within the mechanical testing system(8) . Different effort levels and comparisons of isometricand isotonic action showed only minor differences inthe electromechanical delay between onset times, butincreasingly higher target forces required proportionallygreater total time. The combination of tendon tapstimulation of knee extension measured with a forcetransducer registered an EMD of 25 ms and electricalstimulation shortened the delay to 20 ms . The shortestEMD (16 ms) was recorded by testing voluntary bicepsactivation of elbow flexion using an accelerometer formotion sensing and gross magnification of the recordfor easier reading of the data. It was calculated that thetransport time involved only 10 ms (24) . Returning to

45
Chapter One: EMG Dynamics
MVC
TR
soES
80 .0
120
80
40
0 .00 0.00
40.0
TIME (ms)
Figure 14.Electromechanical delay (EMD) : Onset timing of EMG and force during three modesof quadriceps (vastus lateralis) activation. Left . Voluntary knee extension (EMD=40ms) ; middle . Tendon reflex (EMD=25 ms) ; right . Electrical stimulation (EMD=19ms) . TE (EMG onset threshold, 0 .015 mV), TF (force onset threshold, 3 .6N) . NoteEMD reduced by promptness of muscle activation . Adapted from reference (8) . Usedwith permission.
the question of gait electromyography, the tendon tapresponse could be likened to eccentric activation duringwalking . A logical conclusion to draw from thesemultiple studies is that the average electromechanicaldelay during gait is no more than 40 ms and perhaps asshort as 25 ms or even 10 ms.
EMG ForceActivation of an increasing number of muscle
fibers results in a correspondingly greater force . TheEMG also increases. The result is a quasi-linearrelationship between force and EMG when the musculareffort is isometric but the precise relationship varieswith the mode of motor unit recruitment (28) . Tointerpret muscle force from an EMG of different effortlevels, however, the data have to be normalized as theratio (linear slope) between these two factors varieswith the muscle studied, electrode placement, and modeof signal recording, and because the number of themotor units sampled and their muscle fiber compositioncan neither be defined nor controlled (29,30).
Motion markedly distorts the isometric (I) relation-ship of EMG and force by changing the effectiveness ofthe muscle fibers, while the EMG continues to identifythe relative number of fibers included in the sample.Muscle force (F) is modified by joint position (P), modeof contraction (C), and speed of action (V). Theconceptual model may be represented as F=I(V+P+C).
Joint position alters two muscle factors : sarcomereeffectiveness and moment arm length. Each muscle
fiber is a chain of force units called sarcomeres ; withinwhich force production capability is determined by thenumber of bonds between its myosin and actin fila-ments . Maximum bonding occurs in the midrange of thesarcomere with force being reduced by either lengthen-ing or shortening of the sarcomere . The length of thesarcomere chain (i .e ., muscle fiber) is determined byjoint position . Recent in vivo studies of wrist extensorsarcomeres have shown that even synergistic muscles(extensor carpi radialis brevis and longus) have opti-mum sarcomere bonding at different joint positions.Effectiveness of the resulting muscle force in creatingmotion (moment) is further modified by its functionalleverage (moment arm), which also varies with jointposition . Optimum sarcomere bonding and moment armlengths commonly occur at different joint positions, asituation that seems to extend the functional effective-ness of the muscle . For example, quadriceps muscleforce is maximum at 60° of flexion (31), but the longestmoment arm for the patellar tendon is found at 15°flexion (31).
Muscles have three modes of contraction : isometric(no motion, the dynamic force equaling the passiveresistance), eccentric (active resistance to passivelengthening), and concentric (active shortening) . Thelatter two modes are forms of motion . In some muscles,such as the biceps brachii, the eccentric force canexceed isometric capability by 10 to 20 percent . For thequadriceps, isometric and eccentric appear to be similar(32). Eccentric holding by the actin-myosin bonds is

46
RRDS Gait Analysis in the Science of Rehabilitation
enhanced by titin, a third protein (33) . Concentriccontraction requires serial re-bonding of the actin andmyosin protein filaments as the muscle actively short-ens . This is less efficient, resulting in a force approxi-mately 20 percent less than isometric . Hence, for thesame EMG signal, the resulting force depends onwhether the effort is isometric, eccentric, or concentric;while the EMG representative of muscle fiber involve-ment remains unchanged (Figures 15a and 15b).
The velocity of motion influences the muscle forceof concentric effort but not eccentric activity . As actin –myosin bonding is rate dependent, sarcomere stability isreduced with fast shortening contractions, and muscleforce correspondingly decreases . During walking,sarcomere sensitivity to speed relates only to swingphase events . In stance, muscle action is primarilyisometric and eccentric ; thus, there is a reliable relation-ship between the normalized EMG and the muscleforces being employed.
EMG Relationship to MomentsDuring walking, the amount of effort a muscle
must exert at any instant in time is determined by thedestabilizing influence that falling body weight has onthe joint controlled by that muscle . Engineers define thisdestabilizing rotational force as a moment . The signifi-cant factors are the magnitude of the falling bodyweight force (measured as a ground reaction force) andthe perpendicular distance between that force line(vector) and the joint center (moment arm) . Stability ispreserved by an equal and opposite moment frommuscular action. This approach is an accurate represen-tation of normal muscle group function . Antagonisticcocontraction is minimal and there are no othersignificant destabilizing forces . At the knee, for ex-ample, the moment calculation is a good representationof quadriceps effort during weight acceptance as theperiod of hamstring activity at the onset of stance isbrief and of low intensity . At the same time, themechanics at the foot are contributing to the demandmoment . Hence, there are no hidden forces to imposesignificant deviations in the moment calculations.
A commonly unrecognized problem, however, isthe assignment of muscle action to passive events.Contrary to pure mechanics, the human body has anacute feedback system (proprioception), which allows
intelligent use of passive mobility . Examples are midstance hip extension and late stance hip abductioninduced by the fall of body weight following theswinging limb (34) . In these instances, passive momen-tum has been used instead of muscle agonists (35).Moment calculations have the added limitation ofidentifying only group muscle action . Delineation ofindividual muscle activity necessitates dynamic EMG.
Pathology can impose serious compromises to theprediction of muscle action with moments . In spasticdiseases, such as spastic paralysis or stroke, intensecocontraction may exist . Prolonged cocontraction by thehamstring muscles may require greater quadricepsintensity than is indicated by moment calculations.Faulty foot support by either prolonged heel only orforefoot floor contact also can impose unrecognizedinstability at the knee and hip, leading to additionalmuscle action not evidenced by the calculated moment.For example, persons with spastic paralysis who have acrouch gait as the result of prolonged hamstring muscleaction, preserve balance over their flexed knee byleaning forward . Associated limitations in ankledorsiflexion impose a toe stance . The resulting postureis accompanied by EMG recordings showing strongquadriceps and antagonistic hamstring activity . Simula-tion of this posture in nonimpaired subjects confirmedintense cocontraction of agonists and antagonists at boththe ankle and knee resulting from limb posture ratherthan spasticity (36).
SUMMARY
Dynamic electromyography enables the clinician orresearch investigator to define the timing and intensityof individual muscle function during gait and otherfunctional activities . Moment calculations identify theaction of controlling muscle groups during normalfunction, but may become inaccurate when pathologyalters the balance of passive and active forces . Wireelectrodes, by their placement within the designatedmuscle, provide a more precise definition of both timingand intensity of muscle action than do surface elec-trodes, but require needle penetration of the skin.Surface electrodes have the advantage of convenience .

47
Chapter One : EMG Dynamics
Figure 15.EMG – Force Relationship per Type of Muscle Contraction : Alltests were maximum knee extension and the data were calculatedover a 1-second time period . Quadriceps EMG is represented byvastus lateralis (VL) . a) Isometric maximum effort at 45° of kneeflexion : VL, raw EMG signal and mean intensity (millivolts), also100%. Torque, analog recording, and peak intensity (KGM, kilo-gram meters) . b) Concentric (left) and Eccentric effort (right).Direction of motion indicated by knee angle pattern . Test arc wasbetween 90° and 0° flexion . Rate was 90° per second . Mean EMGand % isometric were quantified for the 1-second effort in eachdirection . Torque was calculated as the peak value for 0.1 second.Expression of data as % isometric values showed motion modifiedconcentric force production (EMG 115%, Torque 72%) but not theeccentric effort (EMG 98%, torque 101%).
REFERENCES
1. Perry J. Gait analysis, normal and pathological function.Thorofare, NJ : Charles B . Slack ; 1992.
2. Lieber RL . Skeletal muscle structure & function . Baltimore:Williams & Wilkins ; 1992 . p . 22.
3. Goodgold J, Eberstein A . Electrodiagnosis of neuromusculardisease . Baltimore : Williams & Wilkins ; 1972 . p . 21–28.
4. Basmajian JV, Deluca CJ. Muscles alive : their functionsrevealed by electromyography . 5th Ed., Baltimore : Williams& Wilkins ; 1985 . p . 19–64.
5. Inman VT, Ralston Hi, Saunders JBdM, Feinstein B, WrightEW, Jr . Relation of human electromyogram to musculartension . Electromyogr Clin Neurophysiol 1952 ;4 :187–94.
6. Burke RE, Levine DN, Salcman M, Tsairis P . Motor units incat soleus muscle: physiological, histochemical and morpho-logical characteristics . J Physiol(Lond) 1974 ;238 :503–14.
7. Bodine-Fowler S, Garfinkel A, Roy RR . Spatial distributionof muscle fibers within the territory of a motor unit . MuscleNerve 1990 ;13 :1133-45.
8. Zhou S, Lawson GA, Morrison WE . Electromechanical delayin isometric muscle contractions evoked by voluntary, reflexand electrical stimulation . Eur J Appl Physiol 1995 ;70 :138–45.
9. Freeborn CW, Antonelli D, Perry J . Spectral analysis of EMGsignals . Annual Reports of Progress . Downey, CA : RanchoLos Amigos Rehabilitation Engineering Center; 1979 . p .35–7.
10. De Luca CJ . The use of surface electromyography inbiomechanics . J Appl Biomech 1997 ;13 :135–63.
11. Perry J, Easterday CS, Antonelli DJ . Surface versus intramus-cular electrodes for electromyography of superficial and deepmuscles . Phys Ther 1981 ;61 :7–15.
12. De Luca CJ, Merletti R . Surface myoelectric signal cross-talkamong muscles of the leg. Electroencephalogr ClinNeurophysiol 1988 ;69 :568–75.
13. Koh TJ, Grabiner MD . Cross talk in surface electromyogramsof human hamstring muscles . J Orthop Res 1992 ;10 :701–9.
14. Koh TJ, Grabiner MD . Evaluation of methods to minimizecross talk in surface electromyography . J Biomech 1993 ;26Suppl 1 :151–7.
a.
0
90J
zo 60¢ ui
wa
30z
0
mean = 355 my (100%) 147
22 .95
0
0 .46
1 .46
2TIME (SEC)
b.-410mv(115%)
J>0
aw0
W
I
23.08
2
001w
0
1
TIME (SEC)

48
RRDS Gait Analysis in the Science of Rehabilitation
15. Frost G, Dowling J, Dyson K, Bar-or O . Cocontraction inthree age groups of children during treadmill locomotion . JElectromyogr Kinesiol 1997 ;7 :179-86.
16. Perry J, Antonelli D . The dynamics of EMG, force, movementrelationships for knee extension . Annual Reports of Progress.Downey, CA : Rancho Los Amigos Rehabilitation EngineeringCenter; 1980 . p . 45-8.
17. Basmajian JV, Stecko G . The role of muscles in arch supportof the foot. J Bone Joint Surg 1963 ;45A :1184-90.
18.
Bontrager E . Footswitch stride analyzer . Bull Prosthet Res1981 ;18(1) :284-8.
19. DiVita P. The selection of a standard convention foranalyzing gait data based on the analysis of relevantbiomechanical factors. J Biomech 1994;27 :501-8.
20. DiFabio RP . Reliability of computerized surface electro-myography for determining the onset of muscle activity . PhysTher 1987 ;67(1) :43-8.
21. Perry J, Bontrager EL, Bogey RA, Gronley JK, Barnes LA.The Rancho EMG Analyzer : a computerized system for gaitanalysis . J Biomed Eng 1993 ;15 :487-96.
22. Ounpuu S, DeLuca PA, Bell KJ, Davis RB . Using surfaceelectrodes for the evaluation of the rectus femoris, vastusmedialis and vastus lateralis in children with cerebral palsy.Gait Posture 1997 ;5 :211-6.
23. Agarwal GC, Gottlieb GL . Mathematical modeling andsimulation of the postural control loop, Part II . Crit RevBiomed Eng 1984 ;11 :113-54.
24. Corcos DM, Gottlieb GL, Latash ML, Almeida GL, AgarwalGC. Electromechanical delay : an experimental artifact . JElectromyogr Kinesiol 1992 ;2:59-68.
25. Ralston HJ, Todd FN, Inman VT . Comparison of electricalactivity and duration of tension in the human rectus femorismuscle . Electromyogr Clin Neurophysiol 1976;16 :277-86.
26. Vos EJ, Harlaar J, Schenau GJVL Electromechanical delayduring knee extensor contractions . Med Sci Sports1998 ;23 :1187-93.
27. Viitasalo JT, Komi PV . Interrelationships between electro-myographic, mechanical, muscle structure and reflex timemeasurements in man . Acta Physiol Scand 1981 ;111 :97-103.
28. Solomonow M, Baratta R, Shoji H, D'Ambrosia R . TheEMG-force relationships of skeletal muscle ; dependence oncontraction rate, and motor units control strategy . Electro-myogr Clin Neurophysiol 1990 ;30:141-52.
29. Lawrence JH, De Luca CJ. Myoelectric signal versus forcerelationship in different human muscles . J Appl Physiol1983 ;54(6) :1653-9.
30. Perry J, Bekey GA . EMG-force relationships in skeletalmuscle . Crit Rev Biomed Eng 1981 ;7(1) :1-22.
31. Perry J, Antonelli D, Ford W. Analysis of knee-joint forcesduring flexed-knee stance. J Bone Joint Surg 1975;57A(7) :961-7.
32. Smidt GL. Biomechanical analysis of knee flexion andextension . J Biomech 1973 ;6 :79-92.
33. Horowits R, Podolsky RJ . The positional stability of thickfilaments in activated skeletal muscle depends on sarcomerelength : evidence for the role of titin filaments . J Cell Biol1987 ;105?217-23 .
34. Hardt DE . Determining muscle forces in the leg duringnormal human walking : an application and evaluation ofoptimization methods . J Biomed Eng 1978 ;100 :72-8.
35. Lyons K, Perry J, Gronley JK, Barnes L, Antonelli D . Timingand relative intensity of hip extensor and abductor muscleaction during level and stair ambulation : an EMG study . PhysTher 1983 ;63 :1597-605.
36. Thomas SS, Moore C, Kelp-Lenane C, Norris C . Simulatedgait patterns: the resulting effects on gait parameters, dynamicelectromyography, joint moments and physiological costindices . Gait Posture 1996 ;4:100-7.
JACQUELIN PERRY, M .D., D.Sc. (HON), is the world's leadingauthority on the biomechanics of human locomotion . She has been aBoard Certified Orthopaedic Surgeon since 1958 . She is a long-timemember of the American Academy of Orthopaedic Surgeons, as wellas of many medical societies . She served in the United States Armyas a physical therapist, from 1941 to 1945, after being certified inphysical therapy at Walter Reed Army General Hospital and is anactive member of the American Physical Therapy Association . Shehas been a member of the Department of Veterans Affairs,Rehabilitation Research and Development Service, Scientific Reviewand Evaluation Board, since 1982, reviewing research grant propos-als submitted to the VA.
Dr. Perry joined the Rancho Los Amigos Hospital staff as theChief of Orthopaedic Surgery of the Adult Poliomyelitis Service in1955 and has been the Chief of Pathokinesiology Service, Director,Quality Assurance Program since that time . Paralytic hand dysfunc-tion led her to initiate a dynamic electromyography program in 1961to study hand muscle phasing with intramuscular (wire) electrodes.The same year, vaccine eradication of acute polio allowed Dr . Perryto start a CVA Service . Inconsistencies between observed gaitdeficits and clinical findings led to the initiation of a gait laboratoryto define muscle function by EMG . A foot switch system wasdesigned for timing . Motion analysis by video observation was lateraugmented by kinematic and kinetic systems. Technical refinementsto allow clear delineation of adjacent muscle action and automatedEMG interpretation have been her major objectives.
Dr. Perry has over 300 publications, the most prominent beingher book Gait Analysis : Normal and Pathological Function. She hasreceived 27 formal honors for her work in orthopaedic surgery, gaitanalysis, and rehabilitation.
In 1998, Dr. Perry and her staff moved into the Jacquelin PerryNeuro-Trauma Institute and Rehabilitation Center (JPI), a newthree-story, state-of-the-art hospital . She was awarded the honorarydegree of Doctor of Science by the University of California and theHelen J . Hislop award for Outstanding Contributions to ProfessionalLiterature at the 1998 APTA Annual National Conference Honorsand Awards ceremony. Her current status is emeritus professor oforthopaedic surgery, emeritus professor of biokinesiology andphysical therapy, medical consultant for the Rancho Los AmigosPathokinesiology Service (which she established in 1968 for theprimary purpose of studying normal and pathological gait) andCentinela Hospital biomechanics laboratory, Chief of the Post-PolioService, and gait consultant to the Traumatic Brain Injury Service .