the contours of world development
TRANSCRIPT

27
The Contours of World Development
Chapter 1
The Contours of World Development
World economic performance was very much better in the second millennium of our era than inthe first. Between 1000 and 1998 population rose 22–fold and per capita income 13–fold. In theprevious millennium, population rose by a sixth and per capita GDP fell slightly.
The second millennium comprised two distinct epochs. From 1000 to 1820 the upward movementin per capita income was a slow crawl — for the world as a whole the rise was about 50 per cent.Growth was largely “extensive” in character. Most of it went to accommodate a fourfold increase inpopulation. Since 1820, world development has been much more dynamic, and more “intensive”.Per capita income rose faster than population; by 1998 it was 8.5 times as high as in 1820; populationrose 5.6–fold.
There was a wide disparity in the performance of different regions in both epochs. The mostdynamic was Group A: Western Europe, Western Offshoots (the United States, Canada, Australia andNew Zealand) and Japan. In 1000–1820, their average per capita income grew nearly four times asfast as the average for the rest of the world. The differential continued between 1820 and 1998 whenper capita income of the first group rose 19–fold and 5.4–fold for the second.
There are much wider income gaps today than at any other time in the past. Two thousand yearsago the average level for Groups A and B was similar. In the year 1000 the average for Group A waslower as a result of the economic collapse after the fall of the Roman Empire. By 1820, Group A hadforged ahead to a level about twice that in the rest of the world. In 1998 the gap was almost 7:1.Between the Western Offshoots and Africa (the richest and poorest regions) it is 19 to one.
Economic performance since 1820 within Group B has not been as closely clustered as in Group A.Per capita income has grown faster in Latin America than Eastern Europe and Asia, and nearly twice asfast as in Africa. Nevertheless, from a Western standpoint, performance in all these regions has beendisappointing.
There have been big changes in the weight of different regions. In the year 1000, Asia (exceptJapan) produced more than two thirds of world GDP, Western Europe less than 9 per cent. In 1820 theproportions were 56 and 24 per cent respectively. In 1998, the Asian share was about 30 per centcompared with 46 per cent for Western Europe and Western Offshoots combined.
28
The World Economy: A Millennial Perspective
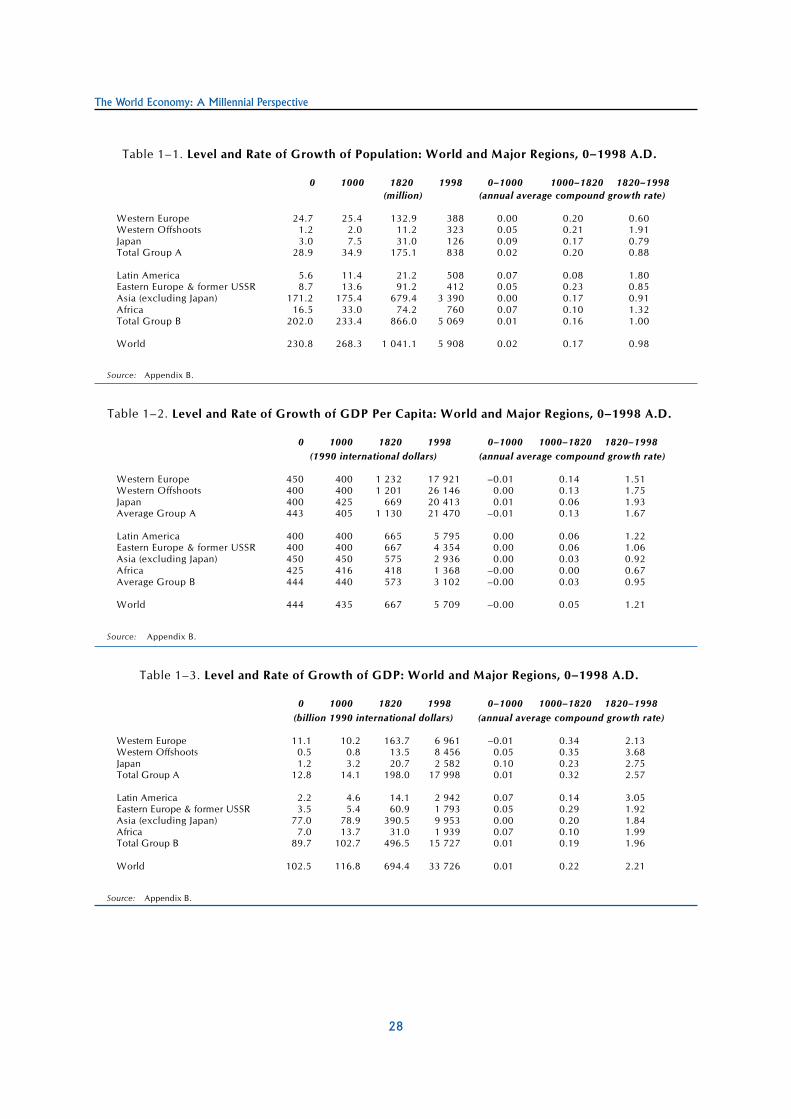
Table 1–1. Level and Rate of Growth of Population: World and Major Regions, 0–1998 A.D.
0 1000 1820 1998 0–1000 1000–1820 1820–1998(million) (annual average compound growth rate)
Western Europe 24.7 25.4 132.9 388 0.00 0.20 0.60Western Offshoots 1.2 2.0 11.2 323 0.05 0.21 1.91Japan 3.0 7.5 31.0 126 0.09 0.17 0.79Total Group A 28.9 34.9 175.1 838 0.02 0.20 0.88
Latin America 5.6 11.4 21.2 508 0.07 0.08 1.80Eastern Europe & former USSR 8.7 13.6 91.2 412 0.05 0.23 0.85Asia (excluding Japan) 171.2 175.4 679.4 3 390 0.00 0.17 0.91Africa 16.5 33.0 74.2 760 0.07 0.10 1.32Total Group B 202.0 233.4 866.0 5 069 0.01 0.16 1.00
World 230.8 268.3 1 041.1 5 908 0.02 0.17 0.98
Source: Appendix B.
Table 1–2. Level and Rate of Growth of GDP Per Capita: World and Major Regions, 0–1998 A.D.
0 1000 1820 1998 0–1000 1000–1820 1820–1998(1990 international dollars) (annual average compound growth rate)
Western Europe 450 400 1 232 17 921 –0.01 0.14 1.51Western Offshoots 400 400 1 201 26 146 0.00 0.13 1.75Japan 400 425 669 20 413 0.01 0.06 1.93Average Group A 443 405 1 130 21 470 –0.01 0.13 1.67
Latin America 400 400 665 5 795 0.00 0.06 1.22Eastern Europe & former USSR 400 400 667 4 354 0.00 0.06 1.06Asia (excluding Japan) 450 450 575 2 936 0.00 0.03 0.92Africa 425 416 418 1 368 –0.00 0.00 0.67Average Group B 444 440 573 3 102 –0.00 0.03 0.95
World 444 435 667 5 709 –0.00 0.05 1.21
Source: Appendix B.
Table 1–3. Level and Rate of Growth of GDP: World and Major Regions, 0–1998 A.D.
0 1000 1820 1998 0–1000 1000–1820 1820–1998(billion 1990 international dollars) (annual average compound growth rate)
Western Europe 11.1 10.2 163.7 6 961 –0.01 0.34 2.13Western Offshoots 0.5 0.8 13.5 8 456 0.05 0.35 3.68Japan 1.2 3.2 20.7 2 582 0.10 0.23 2.75Total Group A 12.8 14.1 198.0 17 998 0.01 0.32 2.57
Latin America 2.2 4.6 14.1 2 942 0.07 0.14 3.05Eastern Europe & former USSR 3.5 5.4 60.9 1 793 0.05 0.29 1.92Asia (excluding Japan) 77.0 78.9 390.5 9 953 0.00 0.20 1.84Africa 7.0 13.7 31.0 1 939 0.07 0.10 1.99Total Group B 89.7 102.7 496.5 15 727 0.01 0.19 1.96
World 102.5 116.8 694.4 33 726 0.01 0.22 2.21
Source: Appendix B.
29
The Contours of World Development
ITHE NATURE AND WELFARE IMPLICATIONS OF POPULATION CHANGE
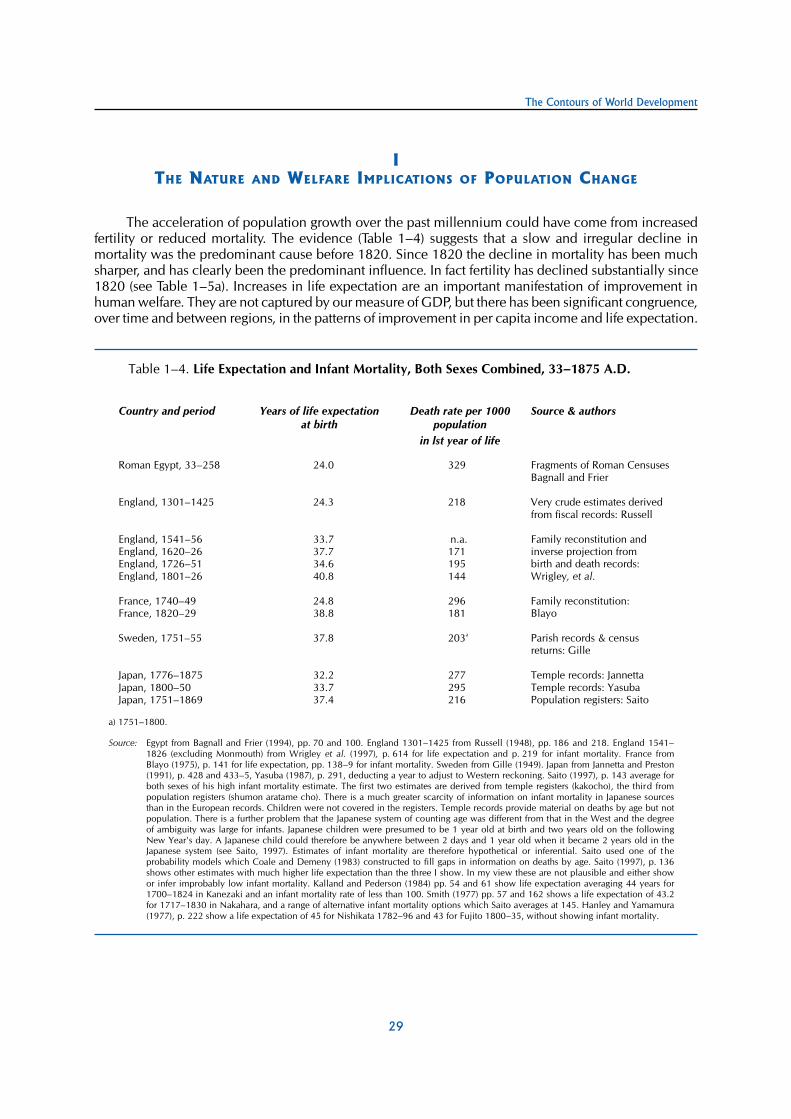
The acceleration of population growth over the past millennium could have come from increasedfertility or reduced mortality. The evidence (Table 1–4) suggests that a slow and irregular decline inmortality was the predominant cause before 1820. Since 1820 the decline in mortality has been muchsharper, and has clearly been the predominant influence. In fact fertility has declined substantially since1820 (see Table 1–5a). Increases in life expectation are an important manifestation of improvement inhuman welfare. They are not captured by our measure of GDP, but there has been significant congruence,over time and between regions, in the patterns of improvement in per capita income and life expectation.
Table 1–4. Life Expectation and Infant Mortality, Both Sexes Combined, 33–1875 A.D.
Country and period Years of life expectationat birth
Death rate per 1000population
in lst year of life
Source & authors
Roman Egypt, 33–258 24.0 329 Fragments of Roman Censuses BBagnall and Frier
England, 1301–1425 24.3 218 Very crude estimates derivedfrom fiscal records: Russell
England, 1541–56 33.7 n.a. Family reconstitution andEngland, 1620–26 37.7 171 inverse projection fromEngland, 1726–51 34.6 195 birth and death records:England, 1801–26 40.8 144 Wrigley, et al.
France, 1740–49 24.8 296 Family reconstitution:France, 1820–29 38.8 181 Blayo
Sweden, 1751–55 37.8 203a Parish records & censusreturns: Gille
Japan, 1776–1875 32.2 277 Temple records: JannettaJapan, 1800–50 33.7 295 Temple records: YasubaJapan, 1751–1869 37.4 216 Population registers: Saito
a) 1751–1800.
Source: Egypt from Bagnall and Frier (1994), pp. 70 and 100. England 1301–1425 from Russell (1948), pp. 186 and 218. England 1541–1826 (excluding Monmouth) from Wrigley et al. (1997), p. 614 for life expectation and p. 219 for infant mortality. France fromBlayo (1975), p. 141 for life expectation, pp. 138–9 for infant mortality. Sweden from Gille (1949). Japan from Jannetta and Preston(1991), p. 428 and 433–5, Yasuba (1987), p. 291, deducting a year to adjust to Western reckoning. Saito (1997), p. 143 average forboth sexes of his high infant mortality estimate. The first two estimates are derived from temple registers (kakocho), the third frompopulation registers (shumon aratame cho). There is a much greater scarcity of information on infant mortality in Japanese sourcesthan in the European records. Children were not covered in the registers. Temple records provide material on deaths by age but notpopulation. There is a further problem that the Japanese system of counting age was different from that in the West and the degreeof ambiguity was large for infants. Japanese children were presumed to be 1 year old at birth and two years old on the followingNew Year's day. A Japanese child could therefore be anywhere between 2 days and 1 year old when it became 2 years old in theJapanese system (see Saito, 1997). Estimates of infant mortality are therefore hypothetical or inferential. Saito used one of t heprobability models which Coale and Demeny (1983) constructed to fill gaps in information on deaths by age. Saito (1997), p. 136shows other estimates with much higher life expectation than the three I show. In my view these are not plausible and either showor infer improbably low infant mortality. Kalland and Pederson (1984) pp. 54 and 61 show life expectation averaging 44 years for1700–1824 in Kanezaki and an infant mortality rate of less than 100. Smith (1977) pp. 57 and 162 shows a life expectation of 43.2for 1717–1830 in Nakahara, and a range of alternative infant mortality options which Saito averages at 145. Hanley and Yamamura(1977), p. 222 show a life expectation of 45 for Nishikata 1782–96 and 43 for Fujito 1800–35, without showing infant mortality.

30
The World Economy: A Millennial Perspective
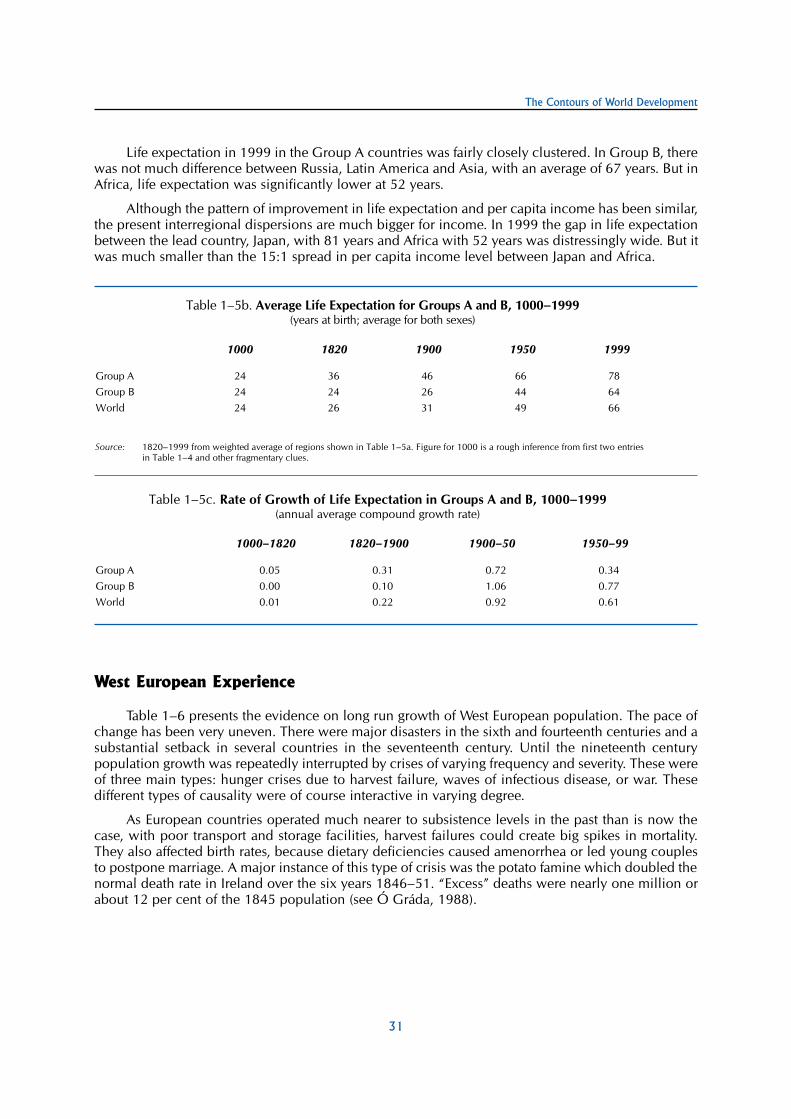
In the year 1000, average life expectation at the world level was probably about 24 years — nobetter than at the beginning of our era. By 1820, it rose to about 26 years (see Table 1–5b). The risewas biggest — from 24 to 36 years — in Group A, and since then has risen to 78 years. The increasewas ten times as fast from 1820 as in the previous eight centuries. In Group B countries, our verycrude estimate suggests that there was no improvement between 1000 and 1820. By 1998 it hadgrown dramatically to an average of 64 years.
Table 1–5a. Birth Rates and Life Expectation, 1820–1998/9
Births per 100 population Years of life expectation at birth(Average for both sexes)
1820 1900 1950 1998 1820 1900 1950 1999
France 3.19 2.19 2.05 1.26 37 47 65 78Germany 3.99 3.60 1.65 0.96 41 47 67 77Italy 3.90 3.30 1.94 0.93 30 43 66 78Netherlands 3.50 3.16 2.27 1.27 32 52 72 78Spain 4.00 3.39 2.00 0.92 28 35 62 78Sweden 3.40 2.69 1.64 1.01 39 56 70 79United Kingdom 4.02a 2.93 1.62 1.30 40a 50 69 77West European Average 3.74 3.08 1.83 1.00 36 46 67 78
United States 5.52 3.23 2.40 1.44 39 47 68 77
Japan 2.62b 3.24 2.81 0.95 34 44 61 81
Russia 4.13 4.80 2.65 0.88 28c 32 65 67
Brazil 5.43d 4.60 4.44 2.10 27e 36 45 67Mexico n.a. 4.69 4.56 2.70 n.a. 33 50 72Latin AmericaAverage n.a. n.a. 4.19 2.51 (27) (35) 51 69
China n.a. 4.12f 3.70 1.60 n.a. 24f 41 71India n.a. 4.58g 4.50h 2.80 21i 24g 32h 60AsianAveragej n.a. n.a. 4.28 2.30 (23) (24) 40 66
AfricanAverage n.a. n.a. 4.92 3.90 (23) (24) 38 52
World n.a. n.a. 3.74 2.30 26 31 49 66
a) 1821; b) 1811–29; c) 1880; d) 1818; e) 1872; f) 1929–31; g) 1891–1911; h) 1941–51; i) 1833; j) excluding Japan.
Source: Birth rates 1820 and 1900: European countries mostly from Maddison (1991a) p. 241; 1821 for England from Wrigley et al. (1997), p. 614;Brazil 1818, from Marcilio (1984), otherwise Brazil and Mexico from Maddison and Associates (1992); United States 1820 and 1900 fromHistorical Statistics of the United States, (1975), vol.1, p. 49; China 1929–31 from Barclay et al. (1976); India entries for 1900 and 1950from Mari Bhat (1989), p. 96; Japan 1816–20 (in Yokoucho) from Hayami (1973), p. 160, 1900 and 1950 from Japan Statistical Association(1987). 1950 generally from OECD (1979) and national sources. 1998 from OECD, Labour Force Statistics, Population et Sociétés, INED,Paris July–August 1999, and UN Population Division (1997).Life expectancy 1820: France from Blayo (1975); Germany from Knodel (1988), p. 59 (average of his alternative estimates); Italy derivedfrom Caselli (1991), p. 73; Spain derived from Livi Bacci and Reher (1993), p. 68; Sweden from Gille (1949), p. 43; the United Kingdomfrom Wrigley et al. (1997), p. 614; Russia (1874–84) from Ohlin (1955), p. 411; the United States from Historical Statistics of the UnitedStates (1975), vol. 1, p. 56 (refers to Massachusetts in 1850); Japan 1820 — average of three estimates in Table 1–4; Brazil 1872 and 1900from Merrick and Graham (1979), pp. 41, 42 and 57; China , 1929–31 from Barclay, Coale, Stoto and Trussell (1976, p. 621); India, 1833for Delhi from Visaria and Visaria (1983), p. 473, 1891–1911 and 1941–51 from Mari Bhat (1989), pp. 92, using an average of the threealternative measures shown. 1900 from Maddison (1995a), p. 27, except for the United Kingdom, from Wrigley et al. 1950 for most OECDcountries from OECD (1979), Mexico from Maddison and Associates (1992), China from Lee and Wang (forthcoming). India from MariBhat (1989). Japan from Japan Statistical Association (1987). Other countries and regions 1950 from UN Population Division (1997). 1999from Population et Sociétés. Regions 1820–1900 derived by weighting country estimates. World averages derived by weighting regionalaverages by regional population.
31
The Contours of World Development
Life expectation in 1999 in the Group A countries was fairly closely clustered. In Group B, therewas not much difference between Russia, Latin America and Asia, with an average of 67 years. But inAfrica, life expectation was significantly lower at 52 years.
Although the pattern of improvement in life expectation and per capita income has been similar,the present interregional dispersions are much bigger for income. In 1999 the gap in life expectationbetween the lead country, Japan, with 81 years and Africa with 52 years was distressingly wide. But itwas much smaller than the 15:1 spread in per capita income level between Japan and Africa.
Table 1–5b. Average Life Expectation for Groups A and B, 1000–1999(years at birth; average for both sexes)
1000 1820 1900 1950 1999
Group A 24 36 46 66 78
Group B 24 24 26 44 64
World 24 26 31 49 66
Source: 1820–1999 from weighted average of regions shown in Table 1–5a. Figure for 1000 is a rough inference from first two entriesin Table 1–4 and other fragmentary clues.
Table 1–5c. Rate of Growth of Life Expectation in Groups A and B, 1000–1999(annual average compound growth rate)
1000–1820 1820–1900 1900–50 1950–99
Group A 0.05 0.31 0.72 0.34
Group B 0.00 0.10 1.06 0.77
World 0.01 0.22 0.92 0.61
West European Experience
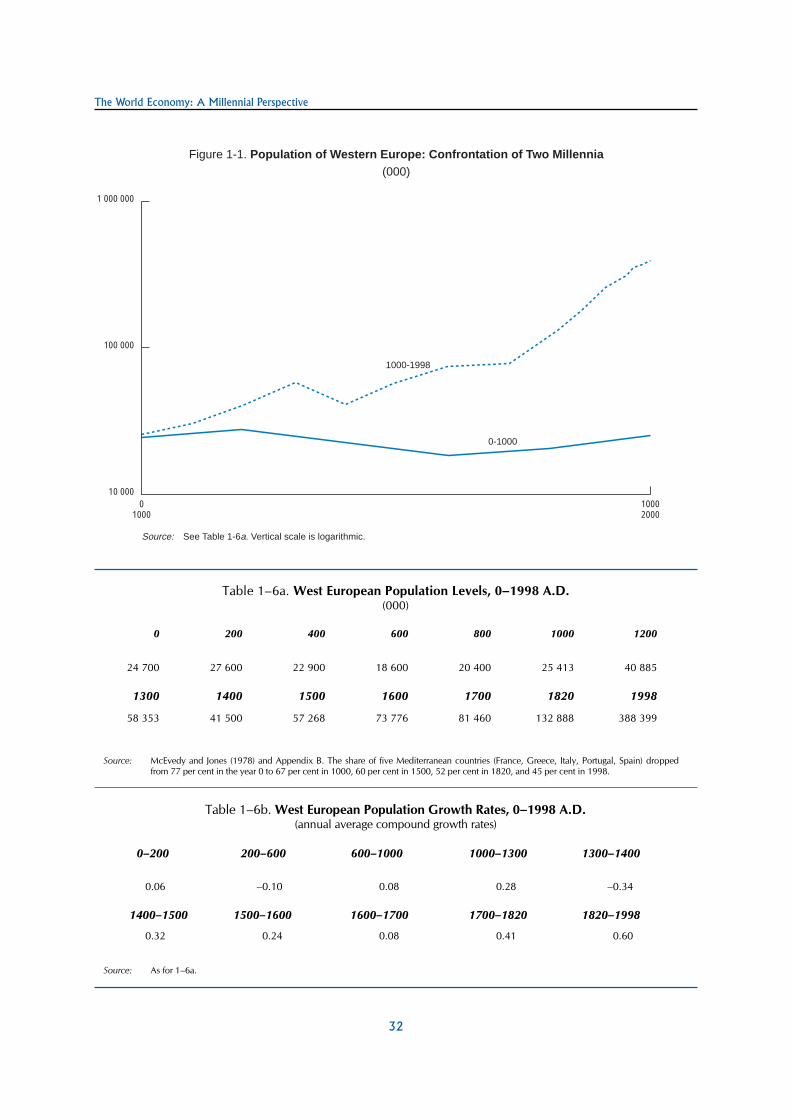
Table 1–6 presents the evidence on long run growth of West European population. The pace ofchange has been very uneven. There were major disasters in the sixth and fourteenth centuries and asubstantial setback in several countries in the seventeenth century. Until the nineteenth centurypopulation growth was repeatedly interrupted by crises of varying frequency and severity. These wereof three main types: hunger crises due to harvest failure, waves of infectious disease, or war. Thesedifferent types of causality were of course interactive in varying degree.
As European countries operated much nearer to subsistence levels in the past than is now thecase, with poor transport and storage facilities, harvest failures could create big spikes in mortality.They also affected birth rates, because dietary deficiencies caused amenorrhea or led young couplesto postpone marriage. A major instance of this type of crisis was the potato famine which doubled thenormal death rate in Ireland over the six years 1846–51. “Excess” deaths were nearly one million orabout 12 per cent of the 1845 population (see Ó Gráda, 1988).
32
The World Economy: A Millennial Perspective
1 000 000
01000
10002000
100 000
10 000
Figure 1-1. Population of Western Europe: Confrontation of Two Millennia(000)
1000-1998
Source: See Table 1-6a. Vertical scale is logarithmic.
0-1000
Table 1–6a. West European Population Levels, 0–1998 A.D.(000)
0 200 400 600 800 1000 1200
24 700 27 600 22 900 18 600 20 400 25 413 40 885
1300 1400 1500 1600 1700 1820 1998
58 353 41 500 57 268 73 776 81 460 132 888 388 399
Source: McEvedy and Jones (1978) and Appendix B. The share of five Mediterranean countries (France, Greece, Italy, Portugal, Spain) droppedfrom 77 per cent in the year 0 to 67 per cent in 1000, 60 per cent in 1500, 52 per cent in 1820, and 45 per cent in 1998.
Table 1–6b. West European Population Growth Rates, 0–1998 A.D.(annual average compound growth rates)
0–200 200–600 600–1000 1000–1300 1300–1400
0.06 –0.10 0.08 0.28 –0.34
1400–1500 1500–1600 1600–1700 1700–1820 1820–1998
0.32 0.24 0.08 0.41 0.60
Source: As for 1–6a.

33
The Contours of World Development
100 000
10 000
1 000
100
100 000
10 000
1 000
1001700 1750 1800 1850 1900 1950 2000
1700 1750 1800 1850 1900 1950 2000
United Kingdom
Figure 1-5. Comparative Levels of GDP Per Capita, China and the United Kingdom,1700-1998
Figure 1.6. Comparative Levels of GDP Per Capita, China and the United States,1700-1998
Source: Appendices A, B, C. Vertical scale is logarithmic.
China
United States
China

34
The World Economy: A Millennial Perspective
Recurrent episodes of infectious disease caused major surges in mortality. The worst was bubonicplague which wiped out a third of the European population in the sixth century and again in the fourteenth.The second plague lingered for centuries, finally dying out in England in 1665 and in France in 1720–21.John Graunt, the first scientific demographer, chronicled its impact in London for the years 1592, 1603,1625, 1630, 1636, and 1665, the worst year, when a total of 97 000 burials were recorded (about 16 percent of the population). Biraben (1972) estimated a total of 94 000 plague deaths in Provence in 1720–1(about 32 per cent of the population) due to the arrival of a ship in Marseilles which brought the diseasefrom Syria. The impact of this plague was limited by strict control of movement in and out of the region.The plague disappeared, but many other lethal diseases remained — cholera, diphtheria, dysentery, influenza,measles, smallpox, tuberculosis, typhus and typhoid. Their incidence receded temporarily after epidemicshad wiped out the least resistant. In some cases, like the plague, repeated exposure seems to have generatedresistance or immunity in the long term. In other cases, the bacterial and viral organisms responsible forinfection may have changed. The pattern and duration of acquired immunities varied for reasons not fullyunderstood, but the impact of epidemic disease declined sharply in Western Europe in the late nineteenthand in the twentieth century. However deaths surged again in the global influenza epidemic of 1918–19.The new threat from Aids seems to have been contained in Group A countries.
Until the twentieth century, a major countervailing force in the process of mortality reduction wasincreased urbanisation. Although city dwellers had higher incomes and better organised food markets thanrural areas, their mortality rates were distinctly higher. John Graunt discovered this for London in theseventeenth century where burials were substantially higher than christenings. Mortality rates were a gooddeal higher in London than in small towns like Romsey, Tiverton and Cranbrook whose experience he alsoinvestigated. London’s expansion was due to high net immigration, but the big city was a reservoir ofinfection, with poor sanitation, most lethal in its impact on infants and recent immigrants. Wrigley et al.(1997), p. 218, note that in the early eighteenth century London’s infant mortality rate was about twice ashigh as for the country as a whole. Hayami (1986a) notes the same phenomenon in Japan, citing evidencefor the capital city Edo for 1840–68. In the course of the twentieth century this differential has disappeared(see Preston and van der Walle, 1978, for the decline in the differential in nineteenth century France).
Over the long run, in the centuries before 1820, there was a slow increase in agriculturalproductivity and improvements in food availability. Hunger crises became less frequent or severe.Increased resistance to disease was also helped by rising living standards, substitution of wine, beerand tea for contaminated water, improvements in clothing and bedding. In the nineteenth and twentiethcenturies, better sanitation and public health facilities, improvements in medical knowledge and facilitiesgreatly reduced the incidence of premature death by infectious disease (see Fogel, 1986, for a causalanalysis of mortality decline). The most striking feature has been the reduction in infant mortality.Around 1820, it was probably between 150–200 per 1 000 population in Western Europe and about200 in Japan. In the 1990s, it was about seven in Western Europe and four per 1 000 in Japan. Theincrease in life expectation for the elderly in Western Europe, the Western Offshoots and Japan since1950 involved a big rise in health expenditure. Earlier decreases in mortality in the nineteenth andtwentieth centuries were much cheaper to obtain.
Figure 1–2 provides a fairly representative picture of European mortality and fertility experiencesince 1736 when such records first became available in Sweden. Vallin (1991) presents similar chartsfor English, French, Finnish and Norwegian mortality back to 1720. Until the latter half of the nineteenthcentury, the pattern in all these countries was more irregular than it has been since because crisis mortalityhas been greatly mitigated. Figure I–2 also shows the demographic transition which started in the mid–nineteenth century throughout most of Western Europe.
Birth rates have fallen more than death rates. In 1998, they were about a third of their 1820 level.As a consequence population growth is much slower and demographic structure has changed dramatically.In England, which is fairly typical of West European experience, nearly 39 per cent of 1821 populationwere below 15 years of age and less than 5 per cent were 65 or over. In 1998, 19 per cent were below15 and nearly 16 per cent 65 or over. The proportion aged 15–64 rose from 60 to 65 per cent.
35
The Contours of World Development
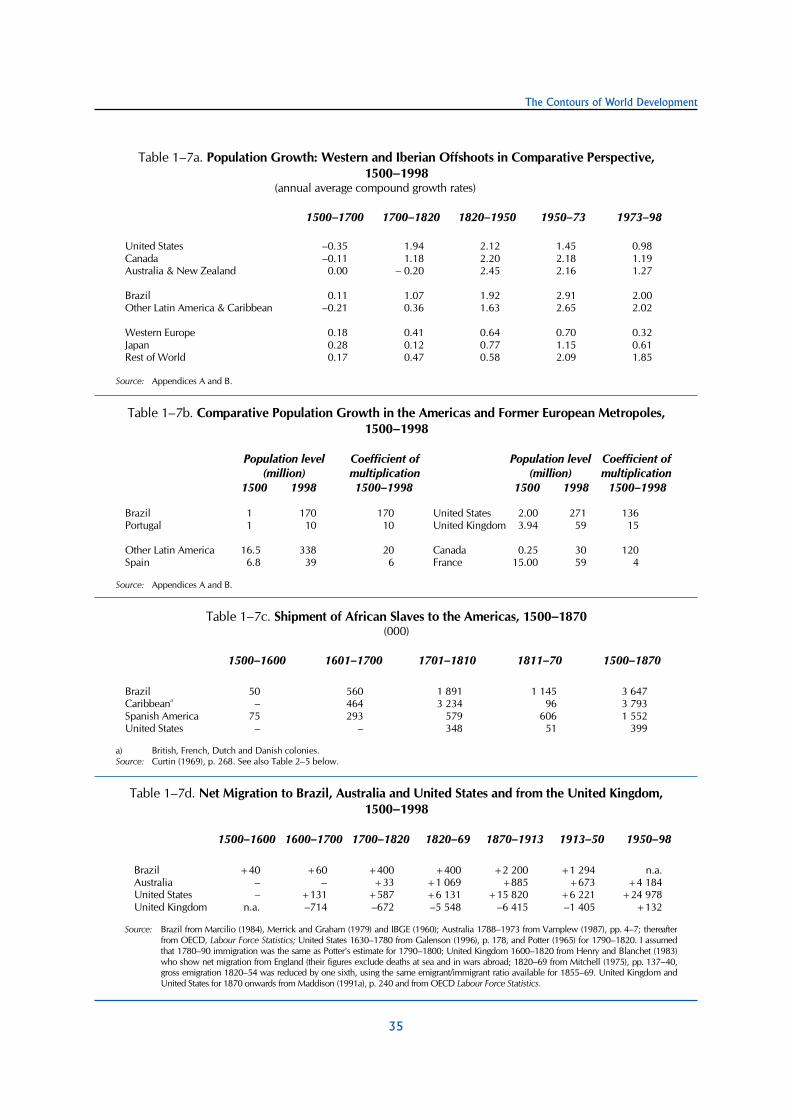
Table 1–7a. Population Growth: Western and Iberian Offshoots in Comparative Perspective,1500–1998
(annual average compound growth rates)
1500–1700 1700–1820 1820–1950 1950–73 1973–98
United States –0.35 1.94 2.12 1.45 0.98Canada –0.11 1.18 2.20 2.18 1.19Australia & New Zealand 0.00 – 0.20 2.45 2.16 1.27
Brazil 0.11 1.07 1.92 2.91 2.00Other Latin America & Caribbean –0.21 0.36 1.63 2.65 2.02
Western Europe 0.18 0.41 0.64 0.70 0.32Japan 0.28 0.12 0.77 1.15 0.61Rest of World 0.17 0.47 0.58 2.09 1.85
Source: Appendices A and B.
Table 1–7b. Comparative Population Growth in the Americas and Former European Metropoles,1500–1998
Population level(million)
Coefficient ofmultiplication
Population level(million)
Coefficient ofmultiplication
1500 1998 1500–1998 1500 1998 1500–1998
Brazil 1 170 170 United States 2.00 271 136Portugal 1 10 10 United Kingdom 3.94 59 15
Other Latin America 16.5 338 20 Canada 0.25 30 120Spain 6.8 39 6 France 15.00 59 4
Source: Appendices A and B.
Table 1–7c. Shipment of African Slaves to the Americas, 1500–1870(000)
1500–1600 1601–1700 1701–1810 1811–70 1500–1870
Brazil 50 560 1 891 1 145 3 647Caribbeana – 464 3 234 96 3 793Spanish America 75 293 579 606 1 552United States – – 348 51 399
a) British, French, Dutch and Danish colonies.Source: Curtin (1969), p. 268. See also Table 2–5 below.
Table 1–7d. Net Migration to Brazil, Australia and United States and from the United Kingdom,1500–1998
1500–1600 1600–1700 1700–1820 1820–69 1870–1913 1913–50 1950–98
Brazil +40 +60 +400 +400 +2 200 +1 294 n.a.Australia – – +33 +1 069 +885 +673 +4 184United States – +131 +587 +6 131 +15 820 +6 221 +24 978United Kingdom n.a. –714 –672 –5 548 –6 415 –1 405 +132
Source: Brazil from Marcilio (1984), Merrick and Graham (1979) and IBGE (1960); Australia 1788–1973 from Vamplew (1987), pp. 4–7; thereafterfrom OECD, Labour Force Statistics; United States 1630–1780 from Galenson (1996), p. 178, and Potter (1965) for 1790–1820. I assumedthat 1780–90 immigration was the same as Potter's estimate for 1790–1800; United Kingdom 1600–1820 from Henry and Blanchet (1983)who show net migration from England (their figures exclude deaths at sea and in wars abroad; 1820–69 from Mitchell (1975), pp. 137–40,gross emigration 1820–54 was reduced by one sixth, using the same emigrant/immigrant ratio available for 1855–69. United Kingdom andUnited States for 1870 onwards from Maddison (1991a), p. 240 and from OECD Labour Force Statistics.

36
The World Economy: A Millennial Perspective
1 000 000
01000
10002000
100 000
10 000
Figure 1-1. Population of Western Europe: Confrontation of Two Millennia(000)
1000-1998
Source: See Table 1-6a. Vertical scale is logarithmic.
0-1000

37
The Contours of World Development
The Americas and Australasia
The pattern of mortality, migration and population growth in the Americas and Australia waschanged drastically by the encounter with Western Europe. The relatively densely populated agrariancivilisations of Mexico and Peru were quickly destroyed by the sixteenth century Spanish conquestmainly because of the inadvertent introduction of European diseases (smallpox, measles, influenzaand typhus). Shortly thereafter the traffic in slaves introduced yellow fever and malaria. Theconsequences were devastating for the indigenous population. At least threequarters of them perished(see Appendix B). In Latin America as a whole, mortality was about twice as big proportionately asEurope’s loss from the Black Death.
In parts of the Americas where the population was mainly hunter–gatherers and less denselysettled (e.g. Brazil, and the areas that subsequently became Canada and the United States), the impactof disease mortality was somewhat smaller.
Western contact with Australia and other Pacific islands occurred towards the end of the eighteenthcentury. The impact of disease on mortality was similar to that in the Americas, and there was a more deliberatepolicy of exterminating the native population than in Spanish America (see Butlin, 1983 and 1993).
Although the initial impact of conquest and colonisation was massively destructive for theindigenous population, the long term economic potential of the Americas was greatly enhanced.Capacity to support a bigger population was augmented by the introduction of new crops and animals(see Crosby, 1972). The new crops were wheat, rice, sugar cane, vines, salad greens, olives, bananasand coffee. The new animals for food were cattle, pigs, chickens, sheep and goats. The introduction oftransport and traction animals — horses, oxen, asses and donkeys — along with wheeled vehicles andploughs (which replaced digging sticks) were another major addition to productive capacity. Therewas also a reciprocal transfer of New World crops to Europe, Asia and Africa — maize, potatoes, sweetpotatoes, manioc, chilis, tomatoes, groundnuts, pineapples, cocoa and tobacco — which enhancedthe world’s production potential and capacity to sustain population growth.
New economic horizons and acquisition of vast territories led to a large scale transfer of populationfrom Europe and Africa. Between 1500 and 1870 almost nine and a half million African slaves wereshipped to work in plantation agriculture (sugar, tobacco, coffee and cotton) in Brazil, the Caribbeanand the southern United States.
The migration of Spanish and Portuguese settlers to Latin America in the colonial period (before1820) was smaller than the movement of slaves. Portuguese emigration was probably about half amillion (Marcilio, 1984), and Spanish less than a million (Sanchez–Albornoz, 1984). Galenson (1996)estimates British migration to the Caribbean to have been about a quarter of a million from 1630 to1780. If we include French and Dutch migration, the net white migration to Latin America probablytotalled two million before 1820, compared with imports of 7.5 million slaves. However the lifeexpectation of slaves was a good deal lower. Merrick and Graham (1979, pp. 56–7) estimate 18 yearsfor male slaves in Brazil in 1872, compared with 27 years for the total population. Fertility of slaveswas also lower because of the precarious nature of their opportunities for family life. The proportionof females in the white immigrant population was low. Threequarters or more consisted of adultmales. Their fertility was quite high because of informal unions with the indigenous and blackpopulation. As a result there was a much greater ethnic mix in Latin America than in North America.
Since 1820, Latin American population has grown faster than that of Western Europe. The mainreason has been higher birth rates, as the decline in mortality came later and has been smaller. Migrationfrom Europe to Latin America accounted for a substantial part of the differential before 1913, but hasbeen less important since then.
In the area of the United States and Canada, European settlement started in the seventeenthcentury, and expanded rapidly in the eighteenth, when there was also a large import of slaves. Theindigenous population was killed off or pushed out of the areas of European settlement. In 1700,
38
The World Economy: A Millennial Perspective
threequarters of the population had been indigenous, by 1820 they were only 3 per cent (seeTable B–15). In the South, there was a heavy concentration on plantation agriculture, with slaves asthe main component of the labour force. In the North, white settlers predominated and were mainlyoccupied on family farms.
White life expectation in North America was similar to that in Western Europe. It was lower forslaves, but the differential was smaller than in Brazil. Merrick and Graham (1979, p. 57) show 35.5years for slaves in the 1850s and 40.4 for the US population as a whole. Fertility was high. In theUnited States, the birth rate was 5.5 per 1000 population in 1820, in Canada (Quebec) 5.7. This wasmuch higher than the United Kingdom (4.0) or France (3.2).
Since 1820 the US population has grown a good deal faster than that of Western Europe. Thedeath rate has been similar. The birth rate has remained higher but has declined proportionately asmuch as in Western Europe. Immigration to the United States has continued at a high level. Most ofthe immigrants came from Europe before the 1960s, so migration explains a good deal of the US/European growth differential.
Japan
From the seventh to the mid–nineteenth century, Japan tried to model its economy, society andinstitutions on those of China, but its demographic experience was very different:
a) over the long run, the major check to Japanese population expansion came from famines andhunger crises. Disease and war were much less important than in China (and Europe);
b) by the second half of the eighteenth century, and perhaps earlier, Japanese life expectation wassimilar to that in Western Europe, and much higher than in China.
Comparative Incidence of Hunger, Disease and War
Macfarlane (1997) provides a comparative survey of the long run forces affecting mortality inEngland and Japan; Jannetta (1986) a detailed study of Japanese experience with epidemic disease,and Saito (1996) an assessment of the comparative incidence of famine and disease in Japan over thelong term.
The major point which emerges from their work is that Japan was not affected by bubonicplague. The main reason was Japan’s isolation. Two hundred kilometres of stormy seas separated itfrom Korea. The nearest point in China was 750 kilometres away. This sea barrier, and official policy,imposed an effective cordon sanitaire. Travel into and out of Japan was very restricted. Foreignerstrading with Japan were more or less permanently quarantined in a small area near Nagasaki. Therewas no import of grain or other products likely to introduce pests. The two Mongol attempts to invadeJapan in 1274 and 1281 were unsuccessful. If they had succeeded Japan’s demographic history (andmuch else) would have been very different.
Freedom from the plague was the main reason why Japanese population growth was faster thanthat of Europe and China in the first millennium and a half of our era.
Smallpox was the most significant cause of Japanese epidemics. Mortality from other diseases— cholera, dysentery, malaria, measles, tuberculosis and typhoid fever was milder than in Europe,and epidemic typhus was absent. This situation was mainly due to hygienic habits, and very limitedcontact with animals. Japanese had an abundant supply of mountain streams and hot springs, and theShinto emphasis on physical purity led to daily bathing at home or in bathhouses. Japanese houseswere austere but kept spotlessly clean and well ventilated. Shoes were left at the entry, there was

39
The Contours of World Development
virtually no furniture or hangings except mosquito nets. Most water consumption was in the form oftea made with boiling water. The Japanese diet consisted of rice, fish, soyabeans, a considerablevariety of vegetables, bamboo shoots and giant radishes. Buddhist tradition meant that Japanese atevirtually no meat. They had no cows, pigs, sheep, goats or animal dung. Although human wastes wereused for manure, the few foreigners who visited Japan were greatly impressed by the immaculateprivies, and the sanitary treatment of sewage. In 1853, foreigners were able to force an entry intoJapan and greatly increased the range of foreign contacts. This resulted very quickly in a major choleraepidemic in 1858–60, and much greater exposure to influenza, tuberculosis, typhoid, typhus anddiphtheria (see Saito, 1996 and Honda, 1997). As a consequence the Japanese death rate rosesignificantly until the 1890s (see Ishii, 1937, pp. 124–5).
Saito (1996) has collated the historical records of famine and crop failure from the eighth to thetwentieth century for Japan. Although it is not possible to measure the intensity of these hunger crisesone can get an idea of changes in their frequency. From the eighth to the tenth centuries, there wasone every three years, in the eleventh to fifteenth centuries one every five years, in the sixteenth toeighteenth one every four years, in the nineteenth every nine years, and none in the twentieth century.
It is not possible to compare the importance of Japanese hunger crises with those in China orEurope. However, the nature of the Japanese and European diets was very different. Europeans hadsubstantial consumption of meat, milk and other animal products which were absent in Japan. Theyhad sufficient cereal production to make large quantities of ale and beer which the Japanese did nothave. Land scarcity was much greater in Japan, and Japanese had to work much more intensively thanEuropeans. The combination of greater austerity and greater physical strain may well have madeJapanese more vulnerable to hunger crises than Europeans, but the susceptibility was probably similarto that of Chinese.
A third major check to population comes from war. Here Japanese experience was very mildcompared with China, and probably milder than in Western Europe.
China suffered major losses from the Mongol invasion of North China in 1234. The Mongolsrazed many cities, inflicted great damage on agriculture, enserfed or enslaved part of the rural populationand displaced them by pastoralising cropland to make way for horses. Their later assault on SouthChina in 1279 was much less destructive, but Mongol horsemen brought bubonic plague in 1353.Total population loss from the encounter with the Mongols was around 30 million.
The transition from the Mongol to the Ming dynasty did not involve substantial mortality. Thenext big disaster was the replacement of the Ming by the Manchus. The Manchu takeover was rapid inNorth China in 1644, but the struggle with Ming loyalists in the South lasted till 1683. The savagery ofwar, combined with smallpox and famine, reduced population by more than 20 million. There wasalso significant migration from mainland China. In the struggle with Koxinga who operated fromTaiwan, the Manchus carried out a scorched earth policy on the opposite coasts of Kwangtung, Fukienand Chekiang provinces, burning crops and villages to a depth of about eight to 30 miles. There wassignificant move of population from this area to Taiwan, and a wave of “overseas” Chinese migrants toSoutheast Asia (see Purcell, 1965).
There were other major population losses in the Taiping and other anti–Manchu rebellions inthe 1850s and 1860s. As a result of these and associated famine and disease, Chinese populationdropped by more than 50 million from 1850 to 1870.
China also suffered significant losses from 1840 to 1945 from aggression by West Europeancountries, Japan and Russia and from its own civil war from 1937 to 1949.
Japan never suffered from foreign invasions, and the two main episodes of civil war in the latterhalf of the twelfth century when the first (Kamakura) shogunate was established, and from 1467 to1568, were much smaller in their impact than the wars China experienced.

40
The World Economy: A Millennial Perspective
Table 1–8a. Comparative Population Growth: Japan, China and Western Europe, 0–1998 A.D.(000)
Japan China Western Europe
0 3 000 59 600 24 7001000 7 500 59 000 25 4131300 10 500 100 000 58 3531400 12 700 72 000 41 5001500 15 400 103 000 57 2681600 18 500 160 000 73 7781700 27 500 138 000 81 4601820 31 000 381 000 132 8881850 32 000 412 000 164 4281870 34 437 358 000 187 5321998 126 469 1 242 700 388 399
Source: China from Appendix B and Maddison (1998a): Western Europe from Table 1–6a: Japan from Farris (1985), Honjo (1935), Taeuber(1958), with some interpolation.
Table 1–8b. Population Growth Rates: Japan, China and Western Europe, 0–1998 A.D.(annual average compound growth rate)
0–1500 1500–1700 1700–1850 1850–1998
Japan 0.11 0.28 0.10 0.93China 0.04 0.15 0.73 0.75Western Europe 0.06 0.18 0.47 0.58
Source: Derived from Table 1–8a.
Table 1–8c. Urbanisation Ratios: Japan, China and Western Europe, 1000–1890(per cent of population in towns of 10 000 inhabitants and more)
Japan China Western Europe
1000 n.a. 3.0 0.01500 2.9 3.8 6.11820 12.3 3.8 12.31890 16.0 4.4 31.0
Source: Appendix Table B–14, de Vries (1984), Perkins (1969) and Ishii (1937).
A Precocious Demographic Transition in Tokugawa Japan
After a century of rapid expansion, Japanese population growth slowed markedly from the earlyeighteenth to the mid–nineteenth century.
The slowdown reflected a precocious transition to lowered levels of mortality and fertility, and tolife expectation higher than the Asian norm. The transition was analogous in some respects to thatexperienced in West European countries from the mid–nineteenth to the twentieth century.
41
The Contours of World Development
Japanese demographic records for the eighteenth century have certain deficiencies, but they aremuch better than those for earlier centuries. In the past 40 years they have been subjected to meticulousscrutiny by a new generation of historical demographers inspired by the pioneering and prolific workof Akira Hayami. As a result the interpretation of this period has changed completely. The eighteenthcentury slowdown was once attributed to Malthusian immiseration but is now characterised as aperiod of rising welfare.
There is little doubt that population was stagnant from 1721 to 1846 when the best Tokugawastatistics were available, and there is reasonable evidence that it was expanding much faster in theseventeenth century. There are grounds for believing that birth rates were relatively low and lifeexpectation relatively high, but there is controversy about life expectation. The most credible estimatesrange from 32 to 37 years. The spread reflects uncertainty which arises from the absence of directevidence on infant mortality and the need for inferential procedures as explained in the notes toTable 1–4.
The traditional method of family limitation in Japan (as in China) was abortion and infanticide. Inthe eighteenth century, family size was further reduced by late marriage, and lower levels of maritalfertility. The change was induced by new institutional arrangements, rising per capita income andincreased per capita labour inputs.
Early in the seventeenth century, the Tokugawa regime compelled its military elite (daimyo) tomove their vassals (samurai) from the countryside to castle towns. The peasantry were no longerclosely controlled, and were much freer to capture gains in productivity for themselves. There werelarge rice levies to provide stipends for the samurai, but these were more or less fixed and the taxburden declined over time.
In the seventeenth century, there were large land reclamation and irrigation projects, improvedseeds, increased use of fertiliser. The proportion of land devoted to double cropped rice increasedsignificantly, there was a rapid expansion of new commercial crops (cotton, sericulture, oil seeds,sugar and tobacco) and industrial by–employments. These changes brought increased real income,but required more intensive labour, with a particularly heavy additional load for women (Saito, 1996).
In these circumstances, large families came to be regarded as a burden. By reducing dependency,per capita income could be raised or more easily sustained. Family restriction was also sociallyacceptable. Villages had a collective responsibility to provide the compulsory rice levy, so the welfareof the whole village community was safeguarded by lower dependency rates. The danger that thefamily line would die out was covered by the widespread practice of adopting adults (e.g. sons–in–law) who would take over the family name and ultimately the family assets. The Japanese inheritancesystem was more or less equivalent to primogeniture with reversion to a single heir, rather than thesystem of partible inheritance which prevailed in China.
Japanese death and birth rates increased somewhat in the last quarter of the nineteenth century.Some of the rise may have been more apparent than real because of a change in official attitudes andpractice. These changed from Tokugawa tolerance of abortion and infanticide to repression, and thesepractices were easier to detect because the new Meiji population registration system had much moreeffective coverage. However, Japanese family size and population growth continued to be fairly modestby subsequent standards elsewhere in Asia.

42
The World Economy: A Millennial Perspective
20 000
10 000
5 000
2 000
1 000
450
2000
1950
1900
1850
1800
1750
1700
1650
1600
1550
1500
1450
1400
1350
1300
1250
1200
1150
1100
1050
100095
0
900
850
800
750
700
650
600
550
500
450
400
West Europe
Figure 1-4. Comparative Levels of GDP Per Capita: China and West Europe,400-1998 A.D.
China
Source: Appendices A, B and C. Vertical scale is logarithmic.

43
The Contours of World Development
100 000
10 000
1 000
100
100 000
10 000
1 000
1001700 1750 1800 1850 1900 1950 2000
1700 1750 1800 1850 1900 1950 2000
United Kingdom
Figure 1-5. Comparative Levels of GDP Per Capita, China and the United Kingdom,1700-1998
Figure 1.6. Comparative Levels of GDP Per Capita, China and the United States,1700-1998
Source: Appendices A, B, C. Vertical scale is logarithmic.
China
United States
China

44
The World Economy: A Millennial Perspective
IIGDP PER CAPITA
Long–term estimates of world GDP are very recent. Research on real income growth by quantitativeeconomic historians has been heavily concentrated on Europe, and generally confined to the past twocenturies. Until recently what was known about earlier centuries was in large degree conjectural.
Maddison (1995a) contained detailed estimates for different parts of the world economy for1820 onwards, with a very crude provisional assessment for 1500 to 1820. Here I have made a muchmore careful scrutiny of the evidence for centuries before 1820 and incorporated the results of Maddison(1998a) on Chinese economic performance over two millennia. There is still a substantial degree ofconjecture, but Appendices A and B present my evidence and assumptions as transparently as possible, sothat critical readers can easily modify, adjust or augment my results where they find them open to question.
The level and movement of per capita GDP is the primary general purpose indicator of changesin well–being and production potential, but one should keep in mind that per capita consumption hasincreased less over the long run because of the increased share of product allocated to investment andgovernment. Labour productivity does not always move parallel to per capita income. The advancesachieved in Sung China (960–1279) and in Japan in the seventeenth and eighteenth centuries requiredsubstantial increases in per capita labour effort. In the twentieth century we find the oppositephenomenon. Labour input per person fell substantially in Western Europe and Western Offshoots(see Appendix E).
Table 1–3 summarises my findings for the past millennium. It shows clearly the exceptionalismof Western Europe’s very lengthy ascension, and origins of the great divergence between the West(Group A) and the rest of the world (Group B).
The major conclusions I draw from the long term quantitative evidence are as follows:
a) West European income was at a nadir around the year 1000. Its level was significantly lowerthan it had been in the first century. It was below that in China, India and other parts of East andWest Asia;
b) There was a turning point in the eleventh century when the economic ascension of WesternEurope began. It proceeded at a slow pace, but by 1820 real income had tripled. The locusand characteristics of economic leadership changed. The North Italian city states and, inparticular, Venice initiated the growth process and reopened Mediterranean trade. Portugaland Spain opened trade routes to the Americas and Asia, but were less dynamic than theNetherlands which became the economic leader around 1600, followed by the United Kingdomin the nineteenth century;
c) Western Europe overtook China (the leading Asian economy) in per capita performance in thefourteen century (see Figure 1–4). Thereafter China and most of the rest of Asia were more orless stagnant in per capita terms until the second half of the twentieth century. The stagnationwas initially due to indigenous institutions and policy, reinforced by colonial exploitation whichderived from Western hegemony and was most marked from the eighteenth century onwards;
d) West European appropriation of the natural resources of North America, introduction of Europeansettlers, technology and organisation added a substantial new dimension to Western economicascension from the eighteenth century onwards. Towards the end of the nineteenth century, theUnited States became the world economic leader;
e) Japan was an exception to the Asian norm. In the course of the seventeenth, eighteenth and thefirst half of the nineteenth century, it caught up with and overtook China in per capita income.The Meiji takeover in 1868 involved massive institutional change aimed at catching up with theWest. This was achieved in income terms in the 1980s, but not yet in productivity;

45
The Contours of World Development
f) The colonial takeover in Latin America had some analogy to that in North America, but Iberianinstitutions were less propitious to capitalist development than those in North America. LatinAmerica included a much larger indigenous population which was treated as an underclasswithout access to land or education. The social order was not greatly changed after independence.Over the long run the rise in per capita income was much smaller than in North America, butfaster than in Asia or Africa;
g) African per capita income was lower in 1820 than in the first century. Since then there has beenslower advance than in all other regions. The income level in 1998 was little better than that ofWestern Europe in 1820. Population growth is now faster than in any other region — eight timesas fast as in Western Europe;
h) The most dynamic growth performance has been concentrated on the past two centuries. Since1820 per capita income has risen 19–fold in Group A, and more than 5–fold in the rest of theworld — dwarfing any earlier advance and compressing it into a very short time span.
One may ask what is new in these findings. In the first place there is the quantification whichclarifies issues that qualitative analysis leaves fuzzy. It helps to separate stylised facts from the stylisedfantasies which are sometimes perceived to be reality. It is more readily contestable and likely to becontested. It sharpens scholarly discussion, and contributes to the dynamics of the research process.It is also useful to have a world picture because it helps to identify what is normal and what is exceptional.
My findings differ in some respects from earlier interpretations of the length and pace of WesternEurope’s economic ascension. There has been a general tendency to date it from 1500 when Europeansencountered America and first made a direct entry into the trading world of Asia. Max Weber attributedEurope’s advance to the rise of protestantism, and this thesis attracted attention because it was congruentwith the conventional wisdom about the beginning of the European ascension. I no longer believethat there was a sharp break in the pace of advance of per capita income around 1500.
Kuznets (1966, Chapter 1) suggested that “modern economic growth” is a distinctive economicepoch preceded by merchant capitalism in Western Europe “from the end of the fifteenth to thesecond half of the eighteenth century,” and an “antecedent epoch of feudal organisation.” In Kuznets(1973, pp. 139–41), he advanced what seemed to be a reasonable view about the rate of per capitaGDP growth in Western Europe in the merchant capitalist period. In Maddison (1995a), I acceptedKuznets’ hypothesis for his merchant capitalist period, but I now believe that growth was slower thenthan Kuznets suggested, and that the pace of advance between the eleventh and the fifteenth centuries wasnot much different. For this reason, it does not seem valid to distinguish between epochs of “feudalorganisation” and “merchant capitalism”. Instead I would characterise the whole period 1000–1820 as“protocapitalist”.
I also differ from Kuznets on the timing of the transition to what he called “modern economicgrowth” (which I call “capitalist development”). The evidence now available suggests that the transitiontook place around 1820 rather than in 1760. The revisionist work of Crafts (1983 and 1992) andothers has helped to break the old notion of a sudden take–off in the second half of the eighteenthcentury in England. Recent research on the Netherlands shows income to have been higher there thanin the United Kingdom at the end of the eighteenth century. Work in the past twenty years on thequantitative history of other West European countries provides further reason for postdating the transitionand modifying the old emphasis on British exceptionalism.
My analysis of US economic performance shows a rapid advance in the eighteenth century incontrast to the findings of Gallman (1972) and Mancall and Weiss (1999). The essential reason for thedifference is that I include rough estimates of the indigenous population and its GDP as well as theactivity of European settlers (I also did this for Australia, Canada and New Zealand).
My assessment of Japanese development differs from the conventional wisdom. I have quantifiedits economic performance in the Tokugawa period and compared it with China. Most analysts concentrateon comparisons between Japan and Western Europe in the Meiji period, and ignore the Asian context.

46
The World Economy: A Millennial Perspective
Table 1–9a. Growth of Per Capita GDP by Major Region, 1000–1998(annual average compound growth rate)
1000–1500 1500–1600 1600–1700 1700–1820 1820–1998
Western Europe 0.13 0.14 0.15 0.15 1.51Western Offshoots 0.00 0.00 0.17 0.78 1.75Japan 0.03 0.03 0.09 0.13 1.93Average Group A 0.11 0.13 0.12 0.18 1.67
Latin America 0.01 0.09 0.19 0.19 1.22Eastern Europe & former USSR 0.04 0.10 0.10 0.10 1.06Asia (excluding Japan) 0.05 0.01 –0.01 0.01 0.92Africa –0.01 0.00 0.00 0.04 0.67Average Group B 0.04 0.02 0.00 0.03 0.95
Table 1–9b. Level of Per Capita GDP, Groups A and B, 1000–1998(1990 international dollars)
1000 1500 1600 1700 1820 1998
Average Group A 405 704 805 907 1 130 21 470
Average Group B 440 535 548 551 573 3 102
Table 1–9c. Population of Groups A and B, 1000–1998(million)
1000 1500 1600 1700 1820 1998
Total Group A 35 76 95 110 175 838
Total Group B 233 362 461 493 866 5 069
Table 1–9d. GDP of Groups A and B, 1000–1998(billion 1990 international dollars)
1000 1500 1600 1700 1820 1998
Total Group A 14.1 53.2 76.1 100.0 198.0 17 998
Total Group B 102.7 194.0 252.9 271.8 496.5 15 727
Source for Tables 1–9a to 1–9d: Appendix B.
Gerschenkron (1965) and Rostow (1960 and 1963) both emphasised the idea that “take–offs” werestaggered throughout the nineteenth century in West European countries. Kuznets (1979, p. 131) endorsedthis view. In fact growth acceleration was more synchronous in Western Europe than they believed.
There are two schools of thought about the relative performance of Europe and Asia. Themainstream view was clearly expressed by Adam Smith in 1776. He was not a practitioner of politicalarithmetic but on the basis of the “price of labour” and other evidence, his ordinal ranking from thetop downwards was as follows for the 1770s:

47
The Contours of World Development
Netherlands
England
France
British North American colonies
Scotland
Spain
Spanish colonies in America
China
Bengal (depressed by the East India Company’s plundering)
This mainstream view is reflected in Landes (1969, p. 13–14) whose overall assessment, like thatof Smith, was similar to mine. “Western Europe was already rich before the Industrial Revolution— rich by comparison with other parts of the world of that day. This wealth was the product of centuriesof slow accumulation, based in turn on investment, the appropriation of extra–European resourcesand labour, and substantial technological progress, not only in the production of material goods, butin the organisation and financing of their exchange and distribution ... it seems clear that over thenear–millennium from the year 1000 to the eighteenth century, income per head rose appreciably— perhaps tripled.”
In Maddison (1983), I contrasted the Landes view with Bairoch’s (1981) assessment of relativeincome per head. He suggested that China was well ahead of Western Europe in 1800, Japan and therest of Asia only 5 per cent lower than Europe, Latin America well ahead of North America, and Africaabout two thirds of the West European level. This highly improbable scenario was never documentedin the case of Asia, Latin America or Africa. His figures for these areas were essentially guesstimates.Bairoch consistently took the position that the third world had been impoverished by the rich countries(see Bairoch, 1967), and he was, in fact, fabricating ammunition for this hypothesis (see the critique ofChesnais, 1987).
In spite of its shaky foundations, Bairoch’s assessment has been influential. Braudel (1985, vol. 3pp. 533–4) acknowledged “the great service Paul Bairoch has rendered to historians” and believed “itis virtually beyond question that Europe was less rich than the worlds it was exploiting, even after thefall of Napoleon”. Andre Gunder Frank (1998, pp. 171 and 284) cites Bairoch and suggests that “around1800 Europe and the United States, after long lagging behind, suddenly caught up and then overtookAsia economically and politically”. Pomeranz (2000) cites Bairoch more cautiously (p. 16) but hissinophilia drives him to the same conclusion. He suggests (p. 111), there is “little reason to think thatWest Europeans were more productive than their contemporaries in various other densely populatedregions of the Old World prior to 1750 or even 1800.”
Maddison (1983) contrasted the assessments of Landes and Bairoch and commented: “Theseremarkably different quantitative conclusions have very different analytical implications. If Bairoch isright, then much of the backwardness of the third world presumably has to be explained by colonialexploitation, and much less of Europe’s advantage can be due to scientific precocity, centuries of slowaccumulation, and organisational and financial prosperity.”
In view of the laborious efforts I have since made to accumulate quantitative evidence on thistopic, I now conclude that Bairoch and his epigoni are quite wrong. To reject them is not to deny therole of colonial exploitation, but this can be better understood by taking a more realistic view ofWestern strength and Asian weakness around 1800.
48
The World Economy: A Millennial Perspective
The major problem in growth analysis is to explain why such a large divergence developedbetween the advanced capitalist group and the rest of the world. There are, of course, some examplesof past convergence, e.g. Europe’s rise from its nadir to overtake China , the Japanese catch–up withChina in Tokugawa times, and subsequently with the advanced capitalist group. Western Europeachieved a very substantial degree of catch–up on the United States in the golden age after the secondworld war; resurgent Asia (China, India, the so–called tigers and others) have narrowed their degreeof backwardness substantially over the past quarter century.
In attempting to understand the causes of divergence and the possibilities for catch–up in differentparts of the world economy, there is no universal schema which covers the whole millennium. Theoperative forces have varied between place and period. Chapter 2 attempts to illuminate the changesin the character of economic leadership and backwardness which have occurred over the pastmillennium.