the construction and design of dichroic …downloads.bbc.co.uk/rd/pubs/reports/1957-13.pdf · the...
TRANSCRIPT

RESEARCH DEPARTMENT
THE CONSTRUCTION AND DESIGN OF DICHROIC MIRRORS
Report No. T-066
( 1957/13)
-K. Hacking, B.Sc. (W. Proctor Wilson)

This Report is the propert7 of the British Broadcasting Corporation and ma7 not be reproduced in an7 form without the written permission of the Corporation.
J j

Section
1
2
3
4
5
6
7
8
9
10
11
Report No. T-066
THE CONSTRUCTION AND DESIGN OF DICHROIC MIRRORS
Title
LIST OF SYMBOLS
SUMMARY .•.
INTRODUCTION
MANUFACTURE OF DICHROIC MIRRORS . 2.1. Physical Construction ... 2.2. Method of Depositing the Layers 2.3. Methods of Controlling Uniformity and Thickness
MIRROR REQUIREMENTS FOR COLOUR TELEVISION 3.1. Analysis 3.2. Synthesis •..•....
FACTORS DETERMINING THE OVERALL SPECTRAL RESPONSE 4.1. Refractive Index 4.2. Layer Thickness 4.3. Dispersion ... 4.4. Absorption •.• 4.5. Number and Order of Layers
METHODS OF COMPUTING THE SPECTRAL RESPONSE
Page
1
1
2 2
3
4
5 5
7
8
8
10 11 12 12
13 5.1. Single Layer on Glass. • 13 5.2. Mul tilayer Systems 14
5.2.1. Analytical Method 14 5.2.2. Method using Analogy with Electrical Network Theory 18
RESULTS FOR VARIOUS FILTER DESIGNS
ANALYSIS OF RESULTS ..
PRACTICAL LIMITATIONS . 8.1. Drift in Refractive Index 8.2. Thickness Uniformity .• 8.3. Hardness and Wear Resistance
MEASURED RESPONSE OF SOME COMMERCIAL MIRRORS
CONCLUSION
REFERENCES
APPENDIX I
APPENDIX II •
APPENDIX HI
...
19
22
24
24
25 25
25
26
27
29
31
33

p
LIST OF SYMBOLS
d = Boundary separation or geometrical layer thickness
K Absorption coefficient
n Refractive index
~} '" Integers
r Elementary amplitude reflection coefficient of single boundary
R Resultant amplitude reflection coefficient of multiboundary system
s Elementary amplitude transmission coefficient of single boundary
S Resultant amplitude transmission coefficient of multiboundary system
t Time
x Phase retardation
Z Impedance
a Angle of refraction
j3 Resultant phase angle (transmitted wave)
y Resultant phase angle (reflected wave)
e Angle of incidence
A Wavelength
Aa Design wavelength
w Angular frequency

May 195'7
SUMMARY
Report No. T-066
( 1957/13)
THE CONSTRUCTION AND DESIGN OF DICHROIC MIRRORS
The somewhat stringent optical performance of beam-splitting dichroic mirrors imposed by three-colour television can be satisfactorily achieved with present-day apparatus and techniques for preparing multilayer interference films.
A guide to the design and performance of such mirrors is afforded by considering the effects of the several physical parameters in idealized systems of layers. Exact formulae, based on rather ideal assumptions regarding the properties of the media involved, can be deduced for the reflection of multilayer coatings on glass in terms of the Fresnel coefficients at the boundaries and the optical thickness of layers. The graphical method of evaluating finally the complex reflection formulae is relatively easy, and has an advantage in enabling one to interpolate values by inspection of the vector diagrams. A novel, and possibly more direct, method of solution is obtained by using the analogy between thin film optics and electrical transmission lines for which the detailed methods of solution are well known.
A wide range of dichroic spectral responses with various rates of transition from reflection to transmission, shapes and bandwidths can be achieved, theoretically at least, by employing seven layers or less. The physical properties of the layers can prove to be a limiting factor, and for this reason the use of materials giving rise to multilayer coatings of greater permanence and wear resistance is now being studied.
1. INTRODUCTION
During the last two decades there has been an intensive study of the optical properties of thin films which has resulted in voluminous reports of theoretical possibilities and practical achievements. It is well known that among the important results of this work are to be found optical and electrical devices of great value to almost every branch of science, including electronics and telecommunications. The comparatively recent development of the interference filter and the "dichroic mirror" is no exception, and it has been made possible only by the simultaneous development of high vacuum techniques. The apparatus for the vacuum deposition of solids in a controlled and reliable manner is now no longer a laboratory novelty but a highly developed piece of equipment for both scientific research and industry. As a consequence some of the products of this equipment, such as mirrors and interference filters, have been lifted from the laboratory phase to that of a commercially available item coming into everyday usage. This is probably more true in the U.S.A., where the commercial demand for these specialized products has been greater than in this country. However, in spite of the advances made in vacuum deposition or coating equipment, the manufacture of dichroic mirrors remains an intricate and specialized procedure. As
i I il

p
2
a result, the more complex types of mirror are costly -- especially those which have
to conform to a close specification regarding spectral performance and uniformity.
This is true of the mirrors required for tricolour analysis in colour television.
As the name "dichroic" (meaning two-colour) implies, the normal function of
the mirror is to isolate or separate from an incident beam of light, containing a continuous spectral band of radiation, those within a selected wavelength interval without greatly modifying the remainder. In the plane mirror type of interference
filter a portion of the wave-band is reflected at the mirror surface while the
remainder of the incident radiations are transmitted through the mirror. The most
important feature of the dichroic mirror, and indeed of the all-dielectric interference
filter generally, is that the sum of the absolute energy contained in the reflected
and transmitted beams is nearly equal to the total energy of the incident beam; that
is to say, separation is 'achieved with only a small loss of energy. The combined use
of two dichroic mirrors, each of suitable design, enables white light to be divided optically into red, green and blue components with surprisingly high efficiency.
This report deals with the design of dichroic mirrors in relation to the
requirements of colour television. In addition, the methods used in computing the
spectral response and the results for various design combinations are discussed. The
report commences with a brief description of the physical construction and processes
involved in the preparation of the mirrors.
2. MANUFACTURE OF DICHROIC MIRRORS
2.1. Physical Construction
The mirrors are made by depositing one or more thin homogeneous layers of
transparent dielectric solids on to a transparent substrate (usually glass). The
materials chosen for the layers have widely differing refractive indices and are
usually arranged as shown in Fig. 1. The number of layers deposited range from one
to nine depending on design requirements. Often an odd number of layers is chosen
commencing with a high index material, but this arrangement is ~ot a fundamental necessity. At each boundary between high and low index media, shown as A and B
respectively in Fig. 1, reflection of light occurs and interference between the
reflected rays takes place. The amount of incident light reflected at a single
boundary is small (usually less than 10%) but, as will be seen later, the final
combination of these subsidiar~ reflected rays can give rise to reflection factors
approaching 100%.
Reflected ligh~ rays. A
Layers ot low-rctracti.e-indlX transparent ma~erial.
Layers of high-rctractive-index transparent material.
Glass substratc.
Fig. I - Typical layer arrangement used in the construction of dichroic mirrors
.~. ~- ---------------------------------------------------------------------------------------------------.....

3
The materials commonly used for the high index layers are zinc sulphide and titanium dioxide, having refractive indices of approximately 2'3 and 2'7 respectively, and magnesium fluoride and cryolite (sodium aluminium fluoride), with approximate indices of 1'4 and 1'3 respectively, for the low index layers.
The geometrical thickness of the layers rarely exceeds 5 X 10- 5 cm (500 ~)
and in most cases is about one fifth of this value. A more convenient parameter by which to specify layer thickness is the "optical thickness" defined as the product of the refractive index and the geometrical thickness. usual range of layer thickness is 100 m~to 500 m~.
In terms of this parameter the
2.2. Method of Depositing the Layers
As already mentioned in the introduction, 'the mirrors are made by the vacuum evaporation process*. The material forming the layers is vaporized and then condensed on the glass substrate in a vacuum chamber which has been evacuated to a very low order of pressure (of the order of 10- 4 mm of mercury).
Fig. 2 shows a simplified diagram of the basic arrangement inside the vacuum chamber. The glass substrate G is supported by a work holder K over the material to be evaporated contained in the source S. In one type of source, (often used for lens "blooming"), S is a thin strip of molybdenum foil with a recess at its centre to hold the material in the form of a powder. The ends of the strip are connected to heavy metal electrodes T1 and T2 sealed into the metal base of the chamber. The strip is heated by passing a large current through it from an external low voltage supply. The dome shaped chamber is sealed to the base by a rubber gasket. The chamber is pumped through a large aperture in the
K Vacuum chamber.
G
s
~ To· roughing" pump. I...,-~:::l.!....--.-j---
pump-
Fig. 2 - Schematic arrangement of vacuum evaporation chamber, showing simple
photo-electric apparatus for controlling layer thickness
base pI ate vi a the i sol ating valve V. A "rough" vacuum is first 0 bt ained in the chamber by a mechanical pump. The final low pressure required is then obtained by inserting a specially designed oil diffusion pump in series with the mechanical pump. To evaporate the material the source S is raised in temperature until the material has acquired a sufficient vapour pressure; the vaporized molecules then diffuse through the vacuum space and condense on the relatively cool glass substrate thus forming the required layer. Evaporation is stopped when the layer has reached the desired thickness, which normally takes from 30 seconds to 5 minutes depending on the vapour pressure and layer thickness. After one layer has been formed the next one of a different material is deposited, and this procedure can be repeated without releasing the vacuum.
*For details ot the early development of' this process see Strong l , and tor an extensive review of present-day techniques see Holland 2 .

-4
In modern vacuum evaporation equipment designed for multilayer work, provision is made for bringing a fresh source into the evaporation position by means of external controls. During deposition the work holder can be rotated using a vacuumsealed shaft drive; this is necessary in order to obtain a uniform deposit on mirrors of large area. Many arrangements for monitoring film thicknesses, controlling deposition rates, and observing chamber pressures have been devised.
2.3. Methods of Controlling Uniformity and Thickness
It is necessary, as will be seen later, for the optical thicknesses of the individual layers comprising the mirror to be controlled with some accuracy during their deposition in the vacuum chamber. Indeed, the importance of such control for multilayer mirrors is one of the main factors contributing to the cost and complexity of the manufacturing process.
Two methods of controlling the optical thickness are available, namely, visual and photo-electric. In the visual method the operator observes in the mirror being prepared the reflected image of a white light source. Alternatively, the image may be observed in a similar adjacent monitor glass. As the optical thickness varies, the colour of the reflected light changes and, by experience, the evaporation is stopped when the pre-determined colour is seen. A published paper by Banning 3 shows the results obtained by this method. Although this method is extensively used for single layer coatings as used for lens "blooming", and sometimes for two and three layer coatings, it has been abandoned in favour of photo-electric methods in the case 0 f multilayer combinations required to meet more rigid specifications.
A simple photo-electric arrangement is shown in Fig. 2. Light from a tungsten filament lamp E, is collimated by the lens Ll and directed on to the glass G, through a sealed window W1 in the vacuum chamber. The reflected beam emerges' through another similar window and the lens L2 condenses the light on to the cathode surface
of a photo-electric cell C. A spectrum ~ __ ---- Vacuum scaled drive. filter F, interposed in the light path,
........ __ -Vacuum chamber. serves to isolate a ,narrow band of wavelengths. Changes in the intensity
'"F====:;=====:::::Jo4--Ro1:a1:ing work holder. of the reflected light are indicated on a
Ba ... plate.
oi++usion pump.
Fig. 3 - Arrangement used for depositing layers 0 f un i fo rm th i ckn ess over large
plane areas
suitable output meter connected to the photocell. The cyclic variation in the intensity of the reflected light as the layer thickness increases is precisely related to the optical thickness of the layer.
Recent developments, such as those of Lindberg and Irland 4 and also Ring and Lissberger 5
, have improved the sensitivity and accuracy of photoelectric methods.
A further problem occurring in the manufacture of dichroic mirrprs of any appreciable surface area is that of
maintaining uniformity of layer thickness over the whole surface. approximately two inches square (5 cm x 5 cm) can be made singly difficulty by situating them centrally over the evaporation source.
5
Mirrors up to without great By making the
work holder spherical and positioning it with respect to the source, in a manner determined by the laws 6 governing the vapour distribution of the type of source involved, several small mirrors can be prepared simultaneously. As stated earlier, in order to obtain uniform deposits of large plane area it is necessary to rotate the work holder during deposition and in this case the source is offset from the central vertical axis of rotation as shown in Fig. 3. The maximum size of mirror is then limited mainly by the dimensions of the vacuum chamber.
3. MIRROR REQUIREMENTS FOR COLOUR TELEVISION
3.1. Analysis
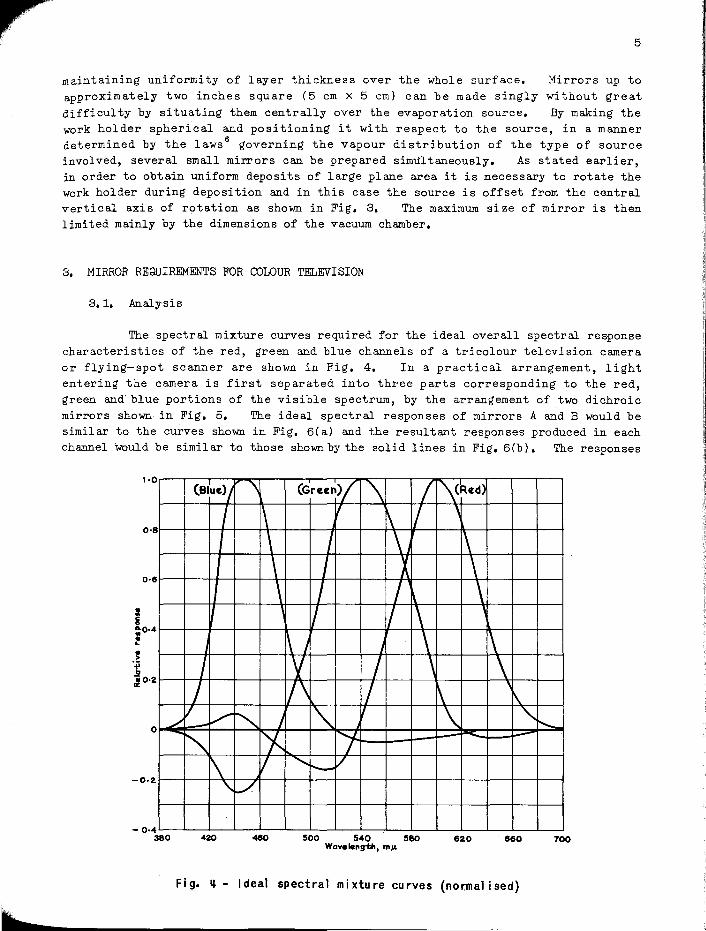
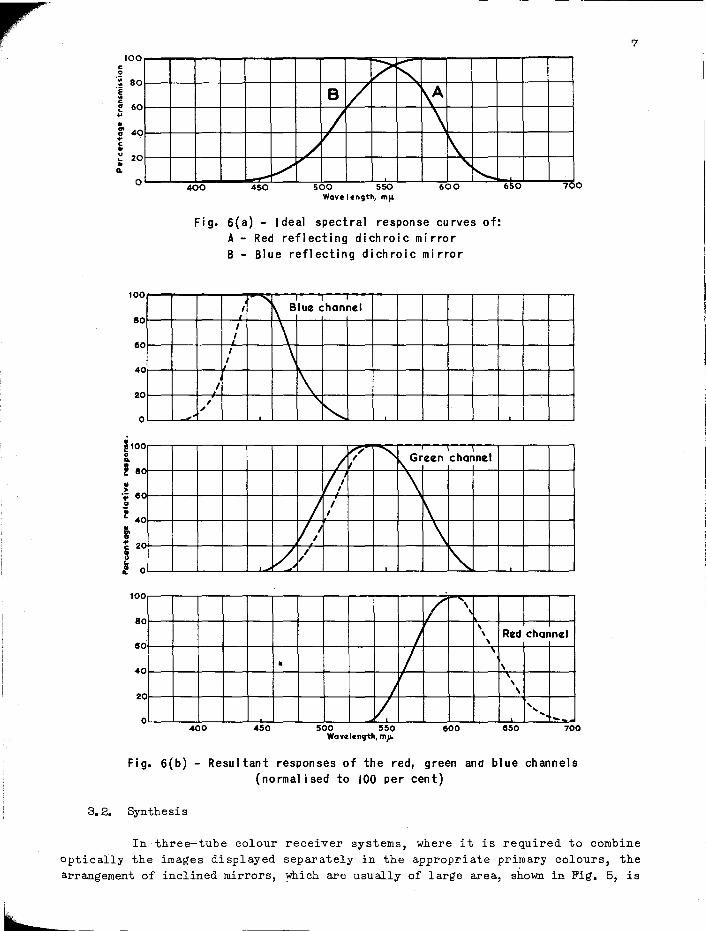
The spectral mixture curves required for the ideal overall spectral response characteristics of the red, green and blue channels of a tricolour television camera or flying-spot scanner are shown in Fig. 4. In a practical arrangement, light entering the camera is first separated into three parts corresponding to the red, green and blue portions of the visible spectrum, by the arrangement of two dichroic mirrors shown in Fig. 5. The ideal spectral responses of mirrors A and B would be similar to the curves shown in Fig. 6(a) and the resultant responses produced in each channel would be simil ar to those shown by the solid lines in Fig. 6 (b) • The responses
'·0
0·8
0·5
o
-0·2
-0·4 380
(Blue)/ '\ (Grun)/ '\ / ,\(Red)
I 1\ If \ 11
, \ I \ 1\ \ I X \ \ I / ~ \ ,
/ 1 i\ , !\ I I \ 1\
I Y / \ \ / 1/\ / \
, r\
V ./"" " / "- If \ ""-./ .........
'" I~ '-I. /
\ V """ ---- / , .../. 420 500 540 580 620 560 700
Wav.leng-th. mJL
Fig. q - Ideal spectral mixture curves (normal ised)

6
Blue compon«nt
Interference coating. Interference coating.
are then shaped by means of absorption-type optical filters in such a manner that the overall spectral responses of the channels approximate to the positive portions of the spectral mixture curves. The exact light transmission characteristics of the absorption filters can be calculated* when the spectral responses of , the television camera tubes, or the photocells and flying-spot source in the case of the film or slide scanner, together
Incid«nt colJimotccJ
light.
Red cam ponent.
Green componlnt.
Fig. 5 - Dichroic mi rror arrangement for analysi 5
with the dichroic mirror characteristics, are known. Assuming the mirrors to have the ideal responses of Fig. 6(a) typical transmission characteristics for the shaping filters would be as indicated by the dashed lines of Fig. 6(b).
There are four salient features of the required optical performance of the analysis mirrors which have direct bearing on their design. These are:
(a) The position on the wavelength scale at which transmission and reflection are equal.
(b) The rate of the·transition, which can be conveniently measured by the slope of the spectral response curve at the point of 50% response.
(c) The wavelength and magnitude of the transmission minimum.
(d) The wavelength and magnitude of the transmission maximum.
The optimum values of these features depend on the particular system for which the mirrors are required, and comprise the essential information needed from the design aspect. The permissible deviations from such a set of specified optimum values are not the same for each of the two mirrors. For instance, it will be seen, by referring again to the spectral mixture curves of Fig. 4, that mirror A, which isolates the red component by reflection and allows the green and blue components to be transmitted, needs to have its cross-over or point of 50% response correctly located because the red and green curves overlap in this neighbourhood. For the second mirror B, which isolates blue from green, the point of 50% response can lie within a greater wavelength range since the blue curve is farther displaced from the green curve.
Referring to features (c) and (d), it is obviously desirable that the magnitudes of the transmission maxima and minima approach 100% and 0% respectively. In practice this ideal cannot be C!.chieved.
By itself alone feature (b) is probably the most easily controlled from the design point of view, but when taken in conjunction with the other three important features (a), (c) and (d), its exactness is greatly limited and a compromise to produce the best overall result is necessary.
*For details of this calculation see B.B.C. Research Department Report X'o. T-027.
J
100 c:
.~ 80 ..
°e .. c:
" 60 .. .. to
'" 40 " .. c: to u .. ..
Q.
20
0
100
80
60
40
20
o
~100 o Go
~ 80
~ l' 80
" t 40
t of' 20 ~ .. :. 0
100
80
80
40
20
o
? ~ B / i\A
/ \ /" ~
V "-i'-.. -400 450 500 550 600 Wave I en9~h. m/L
Fig. 6(a) - Ideal spectral response curves of:
I ,
" ~.
400
A - Red reflecting dichroic mi rror B - Blue reflecting dichroic mirror
...... Blutl ~hannel I \ ,
\ I
I \ I
1\
'" I
V/ ,,' " r"\. Green channel
// \ / I 1\ I
V/ \ V, :/ '"
/ "'\
"' , I , ,
/ ,
• I
V 450 500 550 600
Wavlllcncrth. mp.
650 70 o
Red channel
, \ ,
' ... ... -850 700
Fig. 6(b) - Resultant responses of the red, green and blue channels (normal ised to 100 per cent)
3.2. Synthesis
7
In three-tube colour receiver systems, where it is required to combine optically the images displayed separately in the appropriate primary colours, the arrangement of inclined mirrors, which are usually of large area, shown in Fig. 5, is

--~----------------------8
used. The problem here is slightly different, since the mirrors need not be colour selective; in fact, better colour accuracy is achieved with neutral synthesis mirrors. An effective neutral beam splitting mirror can be constructed7 using only a single high refractive index interference layer, such as titanium dioxide on glass. If the layer has the correct optical thickness a sufficiently uniform spectral response is obtained with transmission and reflection factors of approximately 60% and 40% respectively, with negligible absorption~
For receiver systems where it is necessary to conserve as much of the light output of the three tubes as possible, mul tilayer dichroic mirrors may prove essential. There is some risk in using selective dichroic synthesis mirrors that an objectionable colour tilt and brightness gradation may mar the synthesized picture if the mirrors are required to reflect and transmit light rays incident over a wide range of angles. It is a fundamental characteristic of all multilayer interference filters, especially those constructed with low refractive index materials, that there is a displacement of the response curve with respect t® wavelength as the angle of incidence changes. The rate of displacement is small at small angles of incidence but becomes appreciable at angles near 45° (approximately 1'2 m~ per degree for a dichroic mirror having a peak reflection at 450 m~). This displacement effect would not be troublesome if the three primary emissions were nearly monochromatic. However, the bandwidth of the primary emissions cannot be neglected, and, moreover, two of the bands overlap. There is therefore no simple design of dichroic mirror which will completely overcome the changes of brightness and hue with change of angle variation while still retaining the high efficiency which makes the use of this type of mirror attractive, The optimum dichroic response for any particular case will be governed by the relative energy distribution of the three primary phosphor emissions which are to be combined, and by the angular spr~ad and intensity distribution of the light rays incident on the mirrors*.
4. FACTORS DETERMINING THE OVERALL SPECTRAL RESPONSE
4.1. Refractive Index
The optical behaviour of all interference filters and mirrors results from the fact that when an electro-magnetic wave is incident on the boundary between two media of differing refractive indices a fraction of the incident energy is reflected and reflected waves from two or more boundaries combine by interference to produce a resultant wave,
The fraction of the incident energy which is reflected at a single boundary can be deduced from electro-magnetic wave theory. Let us consider a monochromatic light wave incident normally on the boundary between two transparent media A and E, having absolute refractive indices nl and n2 respectively, as shown in Fig. 7(a). If the incident wave has unit amplitude the reflected wave can be shown to have an amplitude r, given by,
( 1)
*In spit.e or this, a pair of dichroic m.irrors have been used in an experimental threeprojection-tube display and the resulting errors have not been very obvious.
=

9 ,. 1"
,~
'" ,~
f f I I I
I I I A
B 5
\ \
~I \j
No~e:· The an91e ot incidence i •• hown+otorclarity.
(0) (b) Fig. 7 - Schematic representation of reflections at the boundaries between different
media
Since the energy is proportional to the square of the amplitude the reflected intensity is
(2)
The intensity of the ray entering medium B (i.e. the transmitted ray) of amplitude s is given by,
(3)
The expressions (2) and (3) are the well-known Fresnel intensity coefficients of reflection and transmission respectively at normal incidence. Equation (1) shows that the greater the difference between the refractive indices of A and B, the greater the amplitude of the reflected wave. Suppose now that the transmitted wave is further incident on a second boundary between B and a third medium C of refractive index ns, as in Fig. 7(b). The amplitude of the wave now reflected is r1s where,
It will be seen that this second reflected wave gives rise to a whole series of rays in the first medium A, all of progressively decreasing amplitude.
The Fresnel coefficients are no longer the simple expressions given above if the wave is incident at an angle e. It is then necessary to resolve the incident light wave into two components polarized respectively parallel to and perpendicular to the plane of incidence and to treat each component separately. Denoting the amplitude coefficients of reflection for the parallel and perpendicular planes of polarization by rp and rs respectively, the expressions are,
tan(e - a)
tan(e + a)
where e = angle of incidence,
and r s
a = angle of refraction of the transmitted wave.
sinCe-a) - sinCe + a)
Assuming the incident light wave to be unpolarized the intensity coefficient of reflection r2, is given by,

10
It is because of this complication that all the subsequent calculations of multilayer systems given in this report are for the special case of normal incidence for which rp = rs = r. This is justified by the fact that measurement shows the main effect of change of angle to be a displacement of the spectral response curve along the wavelength axis without much change of its shape at normal incidence.
4.2. Layer Thickness
Referring again to Fig. 7(b), the series of reflected waves in medium A have a definite phase relationship which is determined by two factors. These are, the phase change arising from the reflection at the boundary and that introduced by the optical path difference between successive waves. In the case where the separation of the boundaries is such that all the reflected waves in medium A differ in phase by integral multiples of 2TT radians the amplitude of the resultant wave is simply a direct summation of the amplitudes of the individual waves. This is the case of constructive interference which results in a greatly increased reflection coefficient. On the other hand if conditions are such that all the reflected waves differ in phase by odd integral multiples of TT radians with respect to the first reflected wave, destructive interference occurs and the result is a reduced reflection coefficient.
When reflection occurs at a boundary there is a phase change of TT radians if the wave is incident from the low index medium but no phase change occurs if the wave is incident from the high index medium. This can be seen from equation (1), since if n 1 < ri 2, r is negative, denoting a phase change equivalent to TT radians. Therefore, the occurrence of constructive or destructive interference depends on the relative magnitudes of the refractive indices of A, B and C.
The phase retardation x of a wave (incident normally) traversing medium B twice is given by:
where d
n
x 2nd
2TT ~
separation of the boundaries (i.e. layer thickness), refractive index at wavelength A,
(4)
It is clear from the above equation that the optical thickness (nd) is an impor.tant parameter in determining the wavelength at which a m,aximum or minimum resultant amplitude occurs,
Further, from (4), when x = (2P- l)TT, where P is an integer, nd = (2P- 1)A/4 so that a maximum or minimum resultant amplitude occurs wlten nd = A/4, 3A/4, 5 AI 4, etc., depending on the relative magnitudes of the refractive indices. The integer P denotes the order of the layer.
The general arrangement of layers for both neutral and dichroic mirrors is such as to promote constructive interference at one wavelength (often the design point) in the visible spectrum,
J

11
Equation (4) is a special case of the more general expression
2nd cos a :x 2TT x: (4a)
which indicates the major effect of changing the angle of incidence since the sine of this angle is proportional to that of the angle of refraction a. For a layer of given optical thickness the wavelength at which maximum interference occurs becomes shorter as the angle a increases.
Substi"tuting :x = (21) - l)Tr in equation (4a) and re-arranging, we obtain the series of wavelengths Ap giving rise to maximum or minimum resultant amplitudes in a layer of optical thickness, nd:
4ndcos a (21)- 1)
Differentiating this expression with respect to a we have
4nd sin a - (21)- 1)
Substituting for the optical thickness, nd, from equation (4b), we obtain
~A da p
-A tan a p
The rate of displacement of the wavelengths Ap, with change of angle of refraction, is therefore proportional to Ap and to the tangent of the angle of refraction.
4.3. Dispersion
Another factor which should be taken into account in a rigorous analysis of the response of multilayer systems is the change of refractive index with wavelength or dispersion of the layer materials. It is found in practice that the dispersion of the low index materials is small, but some of the high index materials, e.g. titanium dioxide and zinc sulphide, have appreciable dispersion. A recent experimental determination8 shows a variation in the refractive index of zinc sulphide of about 7% within the visible spectrum. The greater part of the variation occurs near the blue end of the spectrum, the refractive index decreasing as the wavelength increases. Dispersion influences the two fundamental parameters already discussed, namely the Fresnel reflection coefficients and the optical path difference, since both are functions of the refractive index. Neglecting dispersion, therefore, means that both the boundary reflection coefficients and the optical thickness of the layers are assumed to be independent of wavelength. In practice, however, for conventional mirrors there will be only one wavelength Aa at which the optical thickness of the layers will be an integral multiple of Aa/4.
In order to simplify greatly the formulae developed later in this report for the Teflection coefficients of five layer and seven layer mirrors, and to retain some generality in the spectral responses calculated, dispersion has been neglected.
11
11
I! I' I
p
12
4.4. Absorption
Fortunately there are some (but only a few) dielectric materials which can be deposited as thin layers by the vacuum evaporation process and which possess both suitable refractive indices and negligible absorption for visible radiation. However, in general, absorption is present and results in an exponential reduction of amplitude as a light wave penetrates the medium. If a wave of unit intensity is incident on the filter or mirror we have the general relationship,
where R S K
amplitude of the resultant reflected wave, amplitude of the resultant transmitted wave, absorption coefficient.
Neglecting K, therefore, means that the transmission curve of a mirror is the complement of the reflection curve. In practice, by careful preparation, dichroic mirrors consisting of seven first order layers can be made with a total absorption of less than 2%.
4.5. Number and Order of Layers
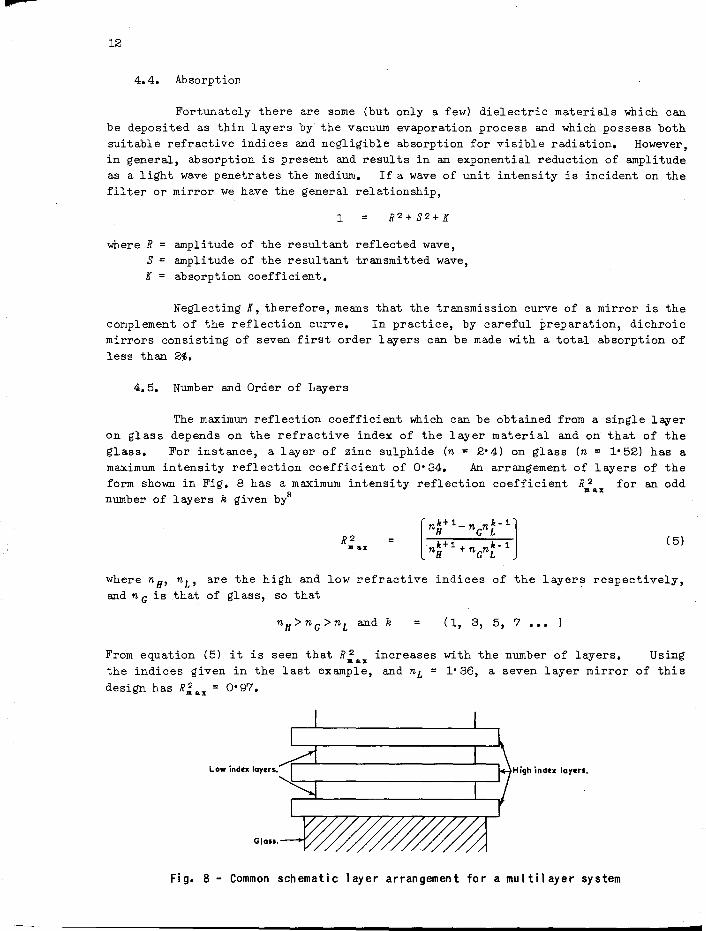
The maximum reflection coefficient which can be obtained from a single l~er on glass depends on the refractive index of the layer material and on that of the glass. For instance, a layer of zinc sulphide (n = 2' 4) on glass (n = l' 52) has a maximum intensity reflection coefficient of 0'34. An arrangement of layers of the form shown in Fig. 8 has a maximum intensity reflection coefficient R;ax for an odd number of layers k given byB
R2 m ax ( 5)
where nH' n L , are the high and low refractive indices of the layers respectively, and n G is that of glass, so that
n H > n G > n L and k (1, 3, 5, 7 •••
From equation (5) it is seen that R;ax increases with the number of layers. Using the indices given in the last example, and nL = 1'36, a seven layer mirror of this design has R; ax = 0' 97.
Lo .. index layers. High index layers.
Glass.
Fig. 8 - Common schematic layer arrangement for a multilayer system

13
Whereas the number of layers determines the maximum reflection (minimum transmission) obtainable, the order of interference of the layers controls the width of the reflected band of wavelengths. Increasing the order of the filter results in a narrower bandwidth. The general effects of the two variables can be seen from Fig. 9. These spectral response curves relate to mirrors composed of odd numbers of layers starting with a high index material, and having their transmission minima near the middle of the visible spectrum.
100
90
8 0
~ 7 0 :; ~ 6 c " L
0
-+' .. 5 .. 0
" .. ~ 4 f ..
0
IL 3 0
20
0 400
\ \ /. \
l~ \ \
450
17 loyers 2nd.ord.~ ,,~
' v, L " , " \ ~ / /
3 loyers \ Single layer .
~ .-/ I 1st. order. \ 1st. order. I
" \ I ./ '1 '-..... \ I / / N.. .J, V
\ ,
/ \ \ I
" ..... \ I ~ _7 loyers .... Ist.order . , .L -
500 550 500 650 700 Wavelength. m)L
Fi g. 9 - Transmi ssion as a function of wavel ength for experimental interference mi rrors, showing the general effect of the number and order of the layers;
after Banning 3
5. METHODS OF CDMPUTING THE SPECTRAL RESPONSE
5. 1. Singl e 1 ayer on Gl as s
In Fig. 10 an incident ray (assumed normally incident) is traced diagrammatically through the layer. It Was first shown by Airy (see Appendix I) that the resultant amplitude R and phase y of the reflected wave is given by
R exp jy ,,- +"-0 exp(-jx)
1+"-0"- exp(-jx) (6)
where ,,- and "-0 are the Fresnel amplitude coefficients at the boundaries A and B respectively, and x " 4TTnd/A...
R can be evaluated graphically by means of an Argand diagram. Al terna-
R
Glass
s Fig. 10 - Schematic ray di agram
illustrating method of computing spectral response of single layer on glass 'I
I " I.'

I .......... --------------------~ 14
tively one can derive a convenient expression for R2 by multiplying equation (6) by its complex conjugate in the usual manner. This then gives
1'02 + 1'2 + 21' 1'0 cos x
1 + l' 2 l' 2 + 2 l' l' cos X o 0
from which the reflection-versus-wavelength characteristic can be determined.
The intensity transmission coefficient 8 2 follows directly since
when absorption is neglected.
An approximate solution is obtained when the product l' 1'0 is small enough to be neglected in comparison to unity. In this case,
R exp j y ~ l' + 1'0 exp(-jx)
and the graphical method of evaluation is thus simplified.
5.2. Multilayer Systems
5.2.1. Analytical Method
Of the several analytical methods of solution ~vailable, the one adopted here for the calculation of dichroic mirrors is based on the treatment given by Rouard9
and Vasi~ek1o. Their method is an extension of the solution for a two layer system developed earlier by Crook 11• The starting point of the method is the solution for a single layer on glass given by equation (6). The first layer is then considered as a single hypothetical boundary having a complex amplitude reflection coefficient. The second layer is next taken into account and the resultant amplitude and phase of the reflected wave deduced, so reducing the first two layers again to a single hypqthetical boundary. Finally, as many layers as are being considered are successively reduced to that of a single boundary which is optically equivalent to the composite system.
This process is indicated in the diagram of Fig. 11. Here A, B and C are the first three boundaries of the system having Fresnel amplitude coefficients 1'0' 1'1
~d 1'2 respectively. Boundaries A and B (Fig. 11(a)) are first reduced to the single
Vl'3 o ____ -..:>1.._-::--___ _
C ____________ \~t~l'2~-------\IT',
B-------..:>I..-~-------A~
R J), F y 2' 2
R 1 iV, E- ---- - -- -- 'Y_'_ -- ------
Glass Glass
(a) (b)
Fig. 11 - Diagrams showing the stages in computing the spectral response of mul ti I ayer systems

hypothetical boundary E (shown dashed in Fig. 11(b)) with an amplitude reflection coefficient Ri exp j'1 1. Next all three boundaries A, B and C are reduced to the single boundary, F, having an amplitude reflection coefficient R2 exp j'12. The process is further illustrated in Fig. 12 for a system of k layers (L e. k + 1 boundaries) •
k+1 k k-1
3 2
15
,. k
'1'k_' '1'k_2
I I I I
I I
R j;Y2 1'2
'1', ~ h', ) z'1.
'1'0 R,IL
As a particular example of the method, consider the
Fig. 12 - Further schematic illustration of the step process used to obtain the reflection
coefficient of a system of k layers
solution of a dichroic mirror composed of seven layers of alternately high and low refractive index material on glass. The construction of the mirror is as shown in Fig. 13, and the constants of the layers are as indicated in the figure. Assuming that the layers R all have the same refractive index nH and the layers L,
the same refractive index n L , also that nL < nG < nH, then the Fresnel coefficients at all the boundaries except the first and last will be equal in magnitude. Therefore,
= -r, say,
and r 2
1-nH
Glass.
l+nH
Fig. 13 - Computational parameters for a seven layer mi rror
Considering the first layer the resultant amplitude and phase of the reflected wave is given by
Ri exp j'1 1
where Xi
-r + r 0 exp ( - j x d 1- r r 0 exp (-jx1)
Next taking into account the second layer
=
r + R 1 exp j '11 exp ( - j X 2 )
1 + r R 1 exp j '11 exp ( - j X 2 )
r + Ri exp j ('11- x 2)
1 + 1'" R 1 exp j ('11 - x 2)
and so, finally, we obtain for the whole system,
u .......... -------------------16
R7 exp jY7 l' 7 + Re exp j (Ye - x 7 )
1+ 1'7 Re exp j(Ye-X7) (7)
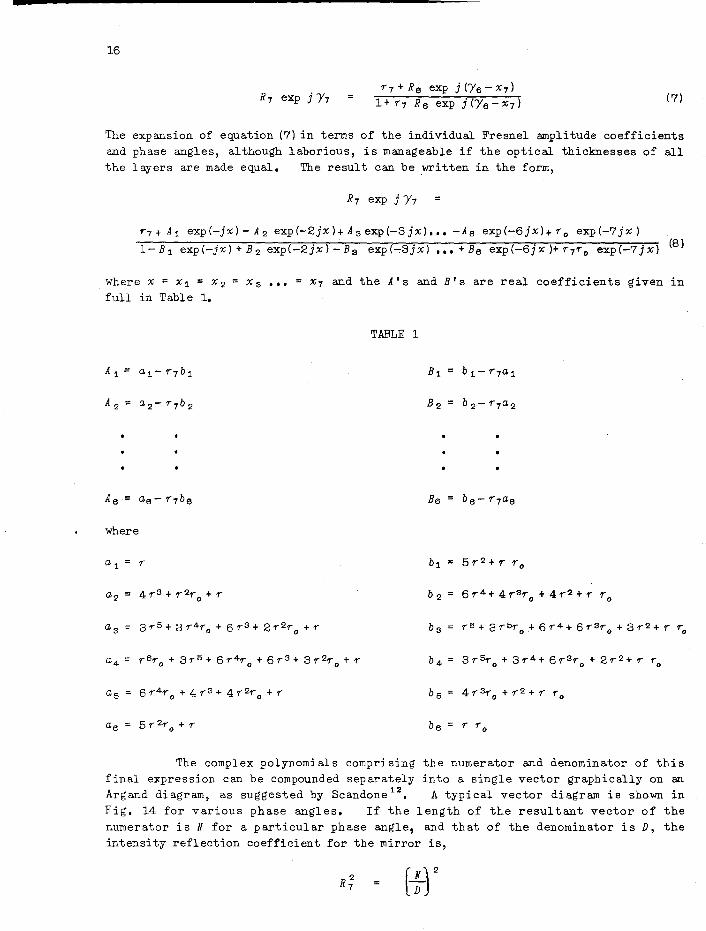
The expansion of equation (7) in terms of the individual Fresnel amplitude coefficients and phase angles, although laborious, is manageable if the optical thicknesses of all the layers are made equal. The result can be written in the form,
R7 exp jY7
f'"7+ Ai exp(-jx)-A 2 exp(-2jx)+A 3 exp(-3jx) ••• -Ae exp(-6jx)+ro exp(-7jx)
1-B i exp(-jx)+B 2 exp(-2jx)-B s exp(-3jx) ••• +Be exp(-6jx)+r7ro exp(-7jx) (8)
where x = Xi = x2 = X3 ••• = x7 and the A's and B's are real coefficients given in full in Table 1.
TABLE 1
Bi = b 1 - r7a i
where
be
The complex polynomials comprising the numerator and denominator of this final expression can be compounded separately into a single vector graphically on an Argand diagram, as suggested by Scandone 12
, A typical vector diagram is shown in Fig, 14 for various phase angles. If the length of the resultant vector of the numerator is N for a particular phase angle, and that of the denominator is D, the intensity reflection coefficient for the mirror is,

17
A slight modification of equation (8) enables the effect of varying the optical thickness X7 of the last layer to be studied when the first six layers are of equal optical thickness. In this case equation (8) takes the form,
{
al exp(-jx) } r7 +
-r7 b 1 exp (-j x 7)
••• + ro exp[-j(6X+X7)]
(9)
{b1 exp(-jx) } {b 2 exp(-2jx) }
1- -r7a l exp(-jx 7) + -r7a 2 exp[-j(x+X7)]
where x7 is the phase angle of the last layer. It will be seen that equation (9) reduces to equation (8)
when x7 = x. The graphical method of evaluation is similar to that for equation (8), and has the advantage that the effect of the last layer thickness can readily be seen from the vector diagrams.
It will be observed that varying the thickness of a layer makes the expression for the resultant amplitude rather cumbersome. To derive the spectral response of mirrors having one or more of their intermediate layers of 2nd or 3rd order a further method was developed. This consists of splitting the composite layer system into two halves, and deriving the resultant amplitude and phase of the reflected wave for each half separately as indicated in Fig. 15. Here the expressions for the upper and lower halves involve only three layers and are consequently easier to h andl e. Further, the intensity transmission
Note:-
Imaginary axis
x~layer phase re1:ardotion, ~ X
Fig. 11l- Typical vector diagram obtained when evaluating the numerator of the complex reflection
coefficient of a seven layer mirror •. A similar di agram is obtained for the denominator

a 18
coefficient of the mirror can be evaluated directly, for it can be shown (Appendix II) that,
(1-R2) (1-R2) a b
(10)
where 82
x
R b, Yb Rn, 'la
Intensity transmission coefficient, phase angle of middle layer, amplitude and Phase of lower half, amplitude and phase of upper half.
(Air)
A------~::: ~n, ~----,----I~ : : A(R) , a,Ya,
B _____ ~...I.:n_L __ ~~(R_b~,Y,-b.;;..) -'---,
Glass
Fi g. 15 - Di agram illustrating the method of computation when the total layer system
is considered as two three-layer systems separated by the middle layer
The denominator of equation (10i was evaluated graphically. The above method, although rather long, prove~ to be very flexible and was used to compute the majority of responses gjven in this report.
5.2.2. Method Using Analogy wi th Electrical Network Theory
A more direct method of evaluating the reflection·coefficients of certain multilayer optical systems is possible if use is made of the analogy between wave propagation in optical media and electrical transmission lines. In particular, the impedance concept in thin film optics was used
by Leurgans 13 to evaluate the reflection coefficients of dichroic mirrors of the type discussed here.
If a semi-infinite loss-free transmission line of characteristic impedance Zo is terminated in a load of impedance Z, it can be shown that the amplitude r of the ~eflected wave at the load terminal is given by,
1- Z Iz 1 + Z:IZ
The analogy can be seen immediately on comparing this equation with the expression for the Fresnel amplitude reflection coefficient, which is
fQr a light ray incident normally from medium (1) to medium (2).
Since the differential equations governing both transmission lines and the propagation of light are similar it can in fact be shown that a homogeneous nonabsorbing dielectric layer of refractive index n and optical thickness nd is equivalent

19
to a uniform transmission line of characteristic impedance Zo = l/n and length, nd.
Other associations can also be made but they are not relevant here.
Extending the analogy to a number of layers on glass it is seen that the system can be represented electrically by a connected series of uniform transmission lines terminated by a semi-infinite line (the glass substratel. Starting with the first line (the first high index l~yer) the input impedance is determined using the relationship,
where Z 1
Zo Z
[ (Z/Zo 1 + j tan(2Tf nd/A) J
Z 1 Zo 1 + j (Z/Zo )tan(27T ndA)
input impedance (first line plus load), characteristic impedance of the first line, impedance of load,
The ratio Zl/Zo is evaluated directly using the well-known Smith Chart in the normal manner.
The second line (first low index layer) is next taken into account and the ratio Z2/Zo evaluated using the previously determined input impedance Zl, as the new load impedance Z,
This procedure is repeated in a step-wise fashion until the input impedance Zi' of the whole system has been determined. The intensity reflection coefficient 0 2
is then given by R2 [l-Z.} [1-z.1* ~.~J
where the asterisk denotes the complex conjugate.
The above method has been used as a cross check on some of the graphically evaluated responses given in this report. The accuracy is probably sufficiently high for most purposes but the computational effort involved is not very greatly reduced, in spite of the directness of the method, when systems of five or more layers are being considered,
6, RESULTS FOR VARIOUS FILTER DESIGNS
The theoretical responses for a number of filter designs are shown in Figs. 16 to 21. The curves plotted are those of percentage transmission for normally incident light versus normalized reciprocal wavelength** (Ao/A), where Ao is the design wavelength, Except for some of the curves shown in Figs, 16 and 17***, all the response curves are symmetrical about the unity ordinate of the normalized reciprocal wavelength scale.
**This is, in erreet, also a normalized frequency scale.
***Due to the fractional change in the last layer optical thickness, some of the curves shown in FigSD 16 and 17 have their transmission minima (not shown) displaced relative to the design pOint (Ao/A = 1) and are slightly unsymmetrical.
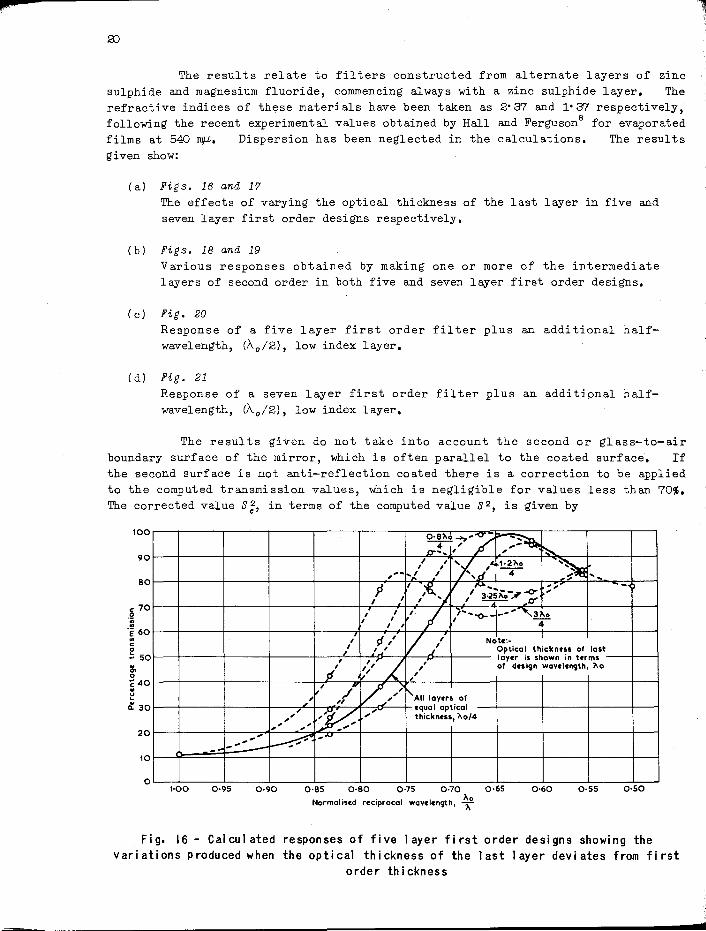
The results relate to filters constructed from alternate layers of zinc
sulphide and ma~nesium fluoride, commencin~ always with a zinc sulphide layer. The refractive indices of these materials have been taken as 2'37 and 1'37 respectively,
followin~ the recent experimental values obtained by Hall and Fer~uson8 for evaporated
films at 540~. Dispersion has been ne~lected in the calculations. The results
~iven show:
(a) Figs. 16 and 17
The effects of varyin~ the optical thickness of the last layer in five and
seven layer first order desi~ns respectively.
(b) Figs. 18 and 19
Various responses obtained by makin~ one or more of the intermediate
layers of second order in both five and seven l~er first order desi~ns.
(c) Fig. 20
Response of a five layer first order filter plus an additional halfwavelen~th, (/1'-0/2), low index layer.
(d) Fig. 21
Response of a seven layer first order filter plus an additipnal half
wavelen~th, (A o /2), low index layer.
The results ~iven do not take into account the second or ~lass-to-air
boundary surface of the mirror, which is often parallel to the coated surface. If
the second surface is not anti-reflection coated there is a correction to be applied
to the computed transmission values, which is ne~ligible for values less than 70%.
The corrected value Si, in terms of the computed value S2, is ~iven by
100
90
80
c: 70 o .;;;
.~ 60 .. c: o ~ 50
~ o (;40 .. ~ er 30
20
10
o 1·00
0.8"0~'~ 4' ,-
u-", ' , ~ I , X 41·2"0 ~ , ,
"sf' 1-4 -......
" ,,! I ,~ ...... ,
P I ' ;A'j I .,.....":~, " -I 3.25;;"7~ ,
I I -4- d , ,
'/ F'-o-l~"·3~0 , I I ,
I p, , 1./ Note:-I , '," Optical thickn ... of last
I , "r ~ , layer is shown in t~r ms
i " , of design wav.lcngth, "0 , .- ,
, ~.- /" ~,/ "All lay"s of " ,
" equal optical
" ~ " thicknus, "0/4
" " " .... ' ~
,~
" -------0·95 0·90 0·85 0·80 0·75 0·70 0·65 0·60 0·55 0·50
Normalised reciprocal wavelength, ~O
Fig. 16 - Calculated responses of five layer first order designs showing the variations produced when the optical thickness of the last layer deviates from first
order thickness
., 1

h
21
where r2 = intensity reflection coefficient of second surface, which, at a simple glass-to-air boundary, is given by the Fresnel coefficient.
100
90
80
c: 70 .2 .. .~ 60 .. c: o ~ 50 .. '" ~ 40 .. ~ rf 30
20
10
o 1·00
I o·e?-_
7'~ ~ ... -<>- ~3'25~ -4- ~;-:-~ , 4
/7"'/,,,' I I " >---~ , ':\..:'o.e~o
'..r'\.,,~ I
.. i " , , ~ ~b I I ,
'..0 ,(1-, , r I IJ 7"37..: "'"0- r.::.:--' c '~ 1
1·21.0 I , A 4 4
, I, j , 11i
I 1
I " / I Note:
1 " 1 Optical thickne •• 01 last _ I---, '1' laytr I. shown in ttrms
I I I 01 dnign wavelength, lI.o I I' I
,7'./ K,P , ~" \AII laye .. 01 ......... ': ...
equa I optical -I- ---- Lo--- th·,ck .... Ao/4
0·95 0·90
(1 st. order)
0·85 0·80 0·75 0·70 lIo Normalised reciprocal wavelength, T
0·65 0·60
Fig. 17 - Calculated responses of seven layer first order designs showing variations produced when the optical thickness of the last layer deviates from first order
thickness
100
90
eo
c: 70
° ';; . ~ 60 .. c: o ; 50
20
10
o 1·00
sf\. V>---A'<. ~ ~ "" VHi9h index
layers
All layers ---. ~ " /J if \
'" \ 2 nd·order.-
2 nd. order.
! ~I II ~ \ I I 1/ \ ,st.& 5thlay~~
2 nd. order • \ 7 17 7! \ / V !J
t7 '~ If / 3 rd. layer"'--
2nd. order."""'"
l//A ~ ~ V
0·95 0·90 0·e5 o·eo 0·75 0·70 0·65 AO
Normalised reciprocal wavelength, --,;:-
, b
7 JVP
0·60
Fig. 18 - Calculated responses of five layer first order designs showing the variations produced when the optical thickness of some of the layers is second order
i J i,

....... ------------------------22
7. ANALYSIS OF RESULTS
Fundamentally, each of the dichroic mirror designs has an overall spectral response consisting of major reflection bands positioned at wavelengths determined uniquely by the physical thickness of the individual layers. For example, in a first order mirror having all its layers of optical thickness ~o/4, the first major reflection band is near the wavelength ~o. No more reflection bands will occur at
100
90
80
c: 70 . ~ .. . ~ 60 .. c: o ~ SO .. '" ~ 40 .. u
~ 30
20
10
o 1·00
ji\ /"\ ...... -::::. ~ High Index-~ s> All layer.-'" 1 \ 1/ / "
layer.
\/ 2nd. order. ~\ j r'\. 2 nd. 0 rder.
V fj V LowlndCX~ ~ ,,/\ !J / ~
layers
v\\ 2 ne!. order .
I
/I I ~ I \J I IL / \ 4th. layer
1\2 nd. order.
t If / \. / I Ij
.......... V
I/~ / ~ ~
0·95 0·90 0·85 0·80 0·75 0·70 ?'o
Normalised reciprocal wavelength, T
/ \\ / \~ ./
\
0·65 0·60 0·55
Fig. 19 - Calculated responses of seven layer first order designs showing the variations produced when the optical thickness of some of the layers is second orAer
100
.. .,.
90
80
!l40
~ l. 30
20
to
o 1·00 0·95
f / "/
5 layer. 1st. order - 7L plus & low index layer 2
1/ I
/ / //
/ V ~
~
0·90 0·85 0·80 0·75 0·70 0·65
Normalised reciprocal wavelength, ~o
....... ~
r-... ~ r-....
Slayers ~ ,st. order.
0·60 0·55 0·50
Fi g. 20 - The effect of adding a ~tJ/2 low index layer to a five layer fi rst order mirror

23
wavelengths greater than Ao , but at lower wavelengths a second band appears at A1 = Ao/3 and a third at A2 = Ao/5. This assumes that the optical constants of the layer materials are independent of wavelength, which is certainly not true inpractice. Also, the materials are usually non-absorbing only over a small wavelength interval.
When Ao , or even A1 = Ao/3, is a wavelength in the visible range, only one (or part of one) major reflected band will appear in this range.
The transmission characteristic between major reflection bands is not, in gen~ral, uniform or of unit value, but possesses undesired secondary minima which can have considerable magnitude in some cases. of the response as the transmission band.
It is convenient to consider this region
The bandwidth (i.e., the width of the reflected band at half the maximum intensity) is only slightly modified by altering the number of layers, providing the order of the filter remains the same. For instance, for first order filters of three, five, seven or nine layers, the bandwidth has an approximately constant value corresponding to O' 53Ao , where Ao is the design wavelength. The main effect of increasing the number of layers, apart from increasing the maximum obtainable value of reflection coefficient, is to increase the rate of transition from transmission to reflection and vice versa. At the same time, the region of maximum reflection of the band becomes more uniform. This latter region of the response is seen to be always smooth in contrast to the undulating maximal response region of the transmission band.
Altering the order of any or all the layers results in a variation of the reflection bandwidth. The results (Figs. 16-19) suggest that the width of the reflection band is roughly inversely proportional to the total optical thickness of the filter for a given number of layers.
100
90
80
" 70 .2 .. '! 60 c:
" Z 50 .. '" ~ 40 .. ~
~ 30
20
10
o 1·00 0·90
--/T "V-~ ---I11 ~ d v 11 ~ ..,/'
7 layers 1st. order '--/ 1/ 17 layers
plus ';' low index la~r j / 1st. order.
/1 l' !
// V
./ ~
0·85 0·80 0-75 0·70 0·65 0·60 0·55 0·50
Normalised reciprocal wavelength, ~o
Fig. 21 - The effect of adding a Ao/2 low index layer to a seven layer first order mirror
......... --------------------24
Some general features of the computed results which are relevant to colour television (see Figs. 18 and 19) and also examples derived from the results, which show the method of application, are set out in Tables 2 and 3 of Appendix 111. Table 4 of this appendix gives the specification of mirrors, to meet typical requirements of a film or slide scanner.
The precise effect, especially in the maximal response region of the transmitted band, which results from a particular combination of layer orders and thicknesses is not easily predetermined, as will perhaps have been noticed from the wide variety of shapes occurring in the family of computed responses shown. However, some features are apparent. For instance, when the order of the low index layer is higher than that of the high index 1 ayer, the maximal response region of the transmitted band exhibits very severe spurious undulations. When the relative magnitudes of the orders are reversed, a more uniform transmission band is obtained.
Designs in which the middle layer only is of second order, result in response curves more typical of a narrow band 'transmission filter than a dichroic mirror. In this case there is one wavelength for which the filter behaves as two highly reflecting surfaces separated by a half-wavelength spacer. These are the interference conditions similar to the well known Fabry-Perot type interference filter. Here, however, no symmetry exists in the response, since the hypothetical boundaries have complex reflection coefficients changing rapidly with wavelength within the region of the transmitted pass-band.
Smaller changes of shape result when the optical thickness of the last layer is made slightly greater or less than an exact integral multiple of ~o/4 in a first order filter (Figs. 16 and 17). In addition, the minimum transmission point does not coincide with the design point (~o/~ = 1), which means, from a practical standpoint, a shift from the control wavelength used to monitor the layer thicknesses. Also, there is a slight drop in the value of the maximum reflection coefficient. The changes in shape are not very pronounced for minor departures from first order thickness (~o/4),
and the wavelength shift has been estimated by Heavens 14, for a 5~ change in the last
layer, to be 4' 5 mf-L ina first order five layer system having a reflection maximum at 600mf-L. Larger variations, particularly in the shape and level of the transmitted band, occur for similar departures from second order thickness (3~o/4).
An interesting modification of the simple first order five and seven layer designs is obtained by adding a "balancing" layer of low index material making six or eight layers respectively (Figs. ID and 21). The "balancing" layer is of optical thickness ~o/2 instead of the usual ~o/4. Under these conditions this layer makes negligible difference to the maximum reflection coefficient obtainable and there is no wavelength shift. It will be observed, however, that a remarkable degree of smoothing in the maximal response region of the transmitted band results, and also that the
smoothing is achieved without lowering the maximum level of the transmission factor. This "balancing" method may, therefore, prove to be a possible remedy for the unwanted secondary undulations normally occurring in dichroic mirror responses.
8. PRACTICAL LIMITATIONS
8.1. Drift in Refractive Index
The refractive index of low index materials, such as magnesium fluoride and cryolite, is found to drift (sometimes over a period of a week) from its initial value
25
at the time of deposition. It is not easy to allow for this change precisely since the initial value depends on the conditions under which the film is deposited. For instance, factors such as deposition rate, nature and pressure of the residual gas in the vacuum chamber, temperature of the glass substrate, as well as other variables, come into play. These factors cannot always be rigorously controlled.
The effect of this drift is to cause the spectral response curve to shift slightly along the wavelength axis in a similar manner to that produced by a small change in the angle of incidence. It is possibly the main practical limitation to the degree of control of layer thickness.
8.2. Thickness Uniformity
The attainment of equal response characteristics over every part of the mirror surface is not easy when the surface area is large, and even when it is small some practical difficulty is encountered. Usually, however, the effect of a slight departure from exact uniformity is not noticed if the mirrors are used in an out-offocus part of the optical system.
8.3. Hardness and Wear Resistance
A disturbing feature of filters and mirrors constructed with zinc sulphide as the high index material is that they are easily marred and scratched. Also, since zinc sulphide is slightly hygroscopic, to obtain the maximum life from the mirrors it is necessary to protect them from too humid an atmosphere. Often such filters are sealed by cementing a cover glass on the layer sandwich but this can give rise to objectionable reflections from the glass-to-air surface, as well as to a change in the spectral response.
Other materials of high index are known to be harder and chemically more stable than zinc sulphide. Titanium dioxide, for instance, is extremely hard and durable as a thin film on glass. Generally, however, the alternatives are either not directly suited to the evaporation process or they may have some degree of light absorption due to chemical decomposition during the process.
The hardness and wear resi'stance is generally improved when the materials are vacuum-deposited on a heated substrate.
9. MEASURED RESPONSE OF SOME OOMMERCIAL MIRRORS
It is of interest to compare the measured spectral responses typical of commercially available dichroic mirrors, suitable for the analysis mirrors of colour television equipment, with the family of calculated responses in order to estimate what particular design combinations have been used by the respective manufacturers.
In Fig, 22 the three responses shown have been transformed to transmissionversus-normalized reciprocal wavelength curves, and represent the "blue reflect" dichroics produced by different manufacturers. From the magnitUde of the transmission minima of filters (a) and (b) it is apparent that seven layers have been used in their construction. The marked similarity between the response of filter (b) and the

>
26
100
90
80
~
I1 \ ~ ~ L_ ....,g /tl" -/ I~ :> ~
c: 70 0
';;; .. 'E 60 .. c: g 50 .. '" 0 C 40 .. ~ ..
Cl. 30
20
to
0 1'00
/ / V r--
j /1 11 /
a V/c /b L v 11
/
--::::: -:7 10-- --
0·95 0·90
V 0'85 0·80 0·75 0·70 0·65
]0,0 Normalised reciprocal wavelength. 'X'"
0·60 0·55 0·50
Fig. 22 - Measured responses of some commercial dichroic mirrors, labelled types (a), (b) and (c) and plotted as percentage transmission versus normal ised reciprocal
wavel ength
calculated response, Fig. 17 (solid line curve), of a seven layer first order filter suggests that such a design has, in fact, been employed. Filter (a), however, although possessing the secondary dip in the response curve first order filters, has a narrower reflection bandwidth. more of the layers are of higher order, but of the range of possesses an equivalent overall response.
which is characteristic of This suggests that one or
combinations computed none
The response of filter (c) seems to indicate that five layers have been employed. The transmission maximum remains flat, however, at approximately 80~, and it is difficult to see how this has been achieved. It is likely that a practical formula has been found in which one or more layers (possibly the last) is not an exact odd integral multiple of A.o/ 4 resul ting in a considerable smoothing of the transmi ssion maximum at the expense of a high maximum peak value. Reference to Figs. 16 and 17 will give an indication of the extent to which the transmission maxima can be influenced by thi s method.
10. CONCLUSION
It is not always easy to design a dichroic filter to give a close fit with a specification derived from other considerations such as colorimetry and responses of commercially available photocells. The following points summarise some of the results of detail ed calculation.
1. The maximum intensity reflection coefficient (R;ax) of a filter composed of an odd number of layers, k, of alternately high and low refractive index (commencing with a high index layer) on a glass substrate is given by the expression,

R2 max n k+ 1 + n ..n k - 1
H G L
Thus, when the materials for the layers have been chosen, the maximum reflection depends,only on the number of layers.
2. The width of the reflection band (measured at the 50i level) is approximately independent of the number of layers but is dependent on the order of interference. mately O· 53 Ao: O· 17 Ao, where Ao
Thus, a first order filter has a bandwidth of approxia second order filter a bandwidth of approximately
is the design wavelength.
3. The transmission maxima are usually accompanied by subsidiary undulations (corresponding to imperfect termination of a transmission line). One method of smoothing these undulations is to ensure that the high index layers have" second order (Fig. 19). Another method is to use an additional low index "balancing" layer of half-wavelength thickness (Fig. 21).
4. The effect of altering the last layer of both a seven and a five layer filter to a non-integral value of optical thickness has been investigated (Figs. 16 and 17). This method does not appear to produce the flattening of the subsidiary undulations mentioned in 3 above.
5. It has been possible to explain the measured characteristics of some commercially produced dichroic mirrors (Fig. 22). One type, however, which has characteristics satisfactorily fulfilling colour television requirements, does not completely fit in with the design possibilities so far computed.
11. REFERENCES
1. Strong, J., Modern Physical Laboratory Practice, London and Glasgow: Blackie and Son, Ltd., 1940.
2. Holland, L., Vacuum Deposition of Thin Films, London: Chapman and Hall, 1956.
3. Banning, M., IIPractical Methods of Making and Using Mul tilayer Filters ", J. Opt. Soc. Am., Volume 37, p. 792, 1947.
4. Lindberg, V.L. and Irland, M.J., flDirect Monitor System for Multilayer Interference Filters", J. Opt. Soc. Am., Volume 45, p. 328, 1955.
5. Lissberger, P.H. and Ring, J., "Improved Methods for Producing Interference Fil ters fI, Optica Acta, Volume 2, p. 42, 1955.
6. Holland, L. and Steckelmacher, W., "The Distribution of Thin Films Condensed on Surfaces by the Vacuum Evaporation Method", Vacuum, Volume 2, No. 4, p. 346, 1952.

;2
28
7. Holland, L., Hacking, K. and Putner, T., "The Preparation of Titanium Dioxide Beam-Spli tters of Large Surface Area", letter to Vacuum, Volume
3, No. 2, p. 159, 1953.
8. Hall, J.F. and Ferguson, W.F.C., "Dispersion of Zinc Sulfide and Magnesium
Fluoride Films in the Visible Spectrum", J. Opt. Soc. Am., Volume 45,
p. 74, 1955.
9. Rouard, P., "Optical Properties of Very Thin Metallic Films ", Annales
de Physique, Volume 7, p. 291, March 1937.
10. Vasicek, A., "Multiple Thin Dielectric Films as Mirrors and Interference
Filters", Czechoslovak Journal of Physics, Volume 3, p. 206, 1953.
11. Crook, A. W., "The Reflection and Transmission of Light by any System of
Parallel Isotropic Films", J. Opt. Soc. Am., Volume 38, p. 954, 1948.
12. Scandone, F., "Transmi ssion and Reflection Theory in Systems of Multiple
Thin Films", J. Phys. Radium, Volume 11, p. 337, 1950.
13. Leurgans, P.G., "Impedance Concept in Thin Film Optics", J. Opt. Soc. Am., Volume 41, p. 714, 1951.
14. Heavens, O.S., "All-Dielectric High-Reflecting Layers", J. Opt. Soc. Am., Volume 44, p. 371, 1954.

29
APPENDIX I
Resultant Amplitude and Phase of Reflected Wave from a Single Layer on Glass
Let a monochromatic wave (Fig. 23) of unit amplitude and normal incidence be represented by exp j cv t and the resultant reflected wave by R exp j (cv t + y). Also, let x be the phase retardation introduced into each component wave on traversing the layer twice, thus
x
where d geometrical thickness of layer,
2nd 2rr' ~
~ wavelength of the monochromatic wave in vacuo, n = refractive index of layer at ~.
(I) (2) (3) (4) (5) Incid~n-t waye--~
,. A----,r--+--+---/;;------;t--+----,--r-- _\t._-7\---
d -1'
Glass
1'0 ~,..-;-7'"7"7'"""7!_"7"7""+7""'7'"7~~r-r-.rT:>""r::!-':::I- - -- - - -
Fig. 23 - Reflection from a single layer
From Fig. 23 the first reflected wave (1) is given by,
l' exp j cv t
where cv = 2rrc/~, c = velocity of light in vacuo, and l' = the Fresnel amplitude coefficient of reflection of the air-to-layer boundary A.
The second, third, etc., reflected waves are readily calculated. They are:
(2) l' (1- r2)exp j (cvt-x) o
( 3) -1' l' ~ ( 1- l' 2) exp j (cv t - 2 x )
and the pth wave is,
where p is an integer ~ 2, and 1'0 is the Fresnel amplitude coefficient of reflection of the layer-to-glass boundary B.
Pi 30
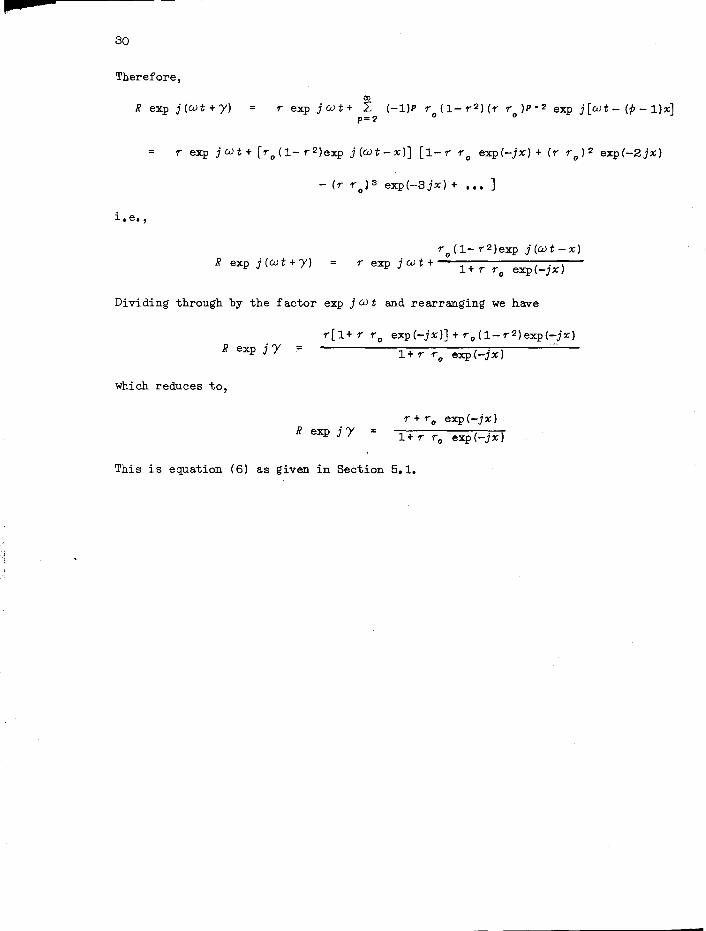
Therefore,
R exp j (w t + y)
i. e. ,
<Xl
". exp jwt+ L: (-l)P "'0(1-".2)(". "'0)P-2 exp j[wt-(P-1)x] p=2
- (". "'013 exp(-3jx) + ••• ]
R exp j (wt +y) "'0(1-".2)exp j(wt-x)
". exp j w t + --------:-(--:--:-) -1+". "'0 exp -jx
Dividing through by the factor exp j w t and rearranging we have
R exp j Y =
which reduces to,
".[1+"''''0 exp(-jx)]+"'0(1-".2)exp(-jx)
1+". "'0 exp(-jx)
R exp j y ". +"'0 exp(-jx)
1+". "'0 exp(-jx)
This is equation (6) as given in Section 5.1.
31
APPENDIX II
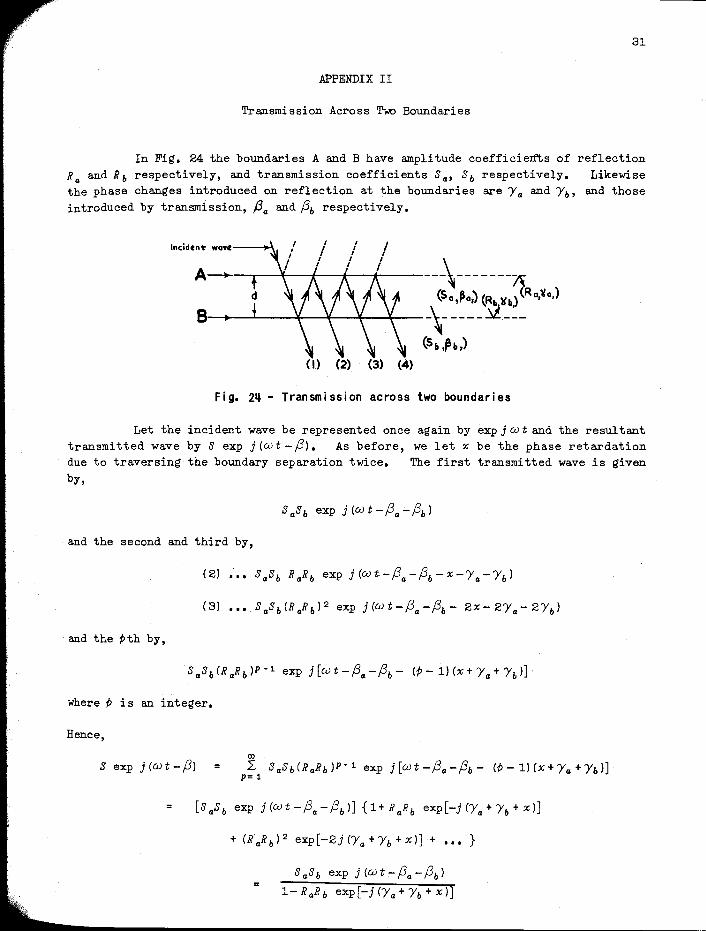
Transmission Across Two Boundaries
In Fig. 24 the boundaries A and B have amplitude coefficients of reflection Ra and Rb respectively, and transmission coefficients Sa' Sb respectively. Likewise the phase changes introduced on reflection at the boundaries are Y a and Yb, and those introduced by transmission, ~a and ~b respectively.
Incidln~ wavl--~.
A---r---+---t----i-+----\ --- ----A (Sa,~a,) (Rb ltb) (Ra,1/a,)
B, __ .....L...---+--+---1f~--\- ----~ ---(Sb .Pb,)
(2) (3) (4)
Fig. 2~ - Transmission across two boundaries
Let the incident wave be represented once again by exp j cv t and the resultant transmi tted wave by S exp j (cv t -~). As before, we let x be the phase retardation due to traversing the boundary separation twice. The first transmitted wave is given by,
and the second and third by,
and the pth by,
where p is an integer.
Hence,
S exp j(cvt-~) CD
L SaSb(RaRb)P-1 exp j[cvt-~a-~b- (P-1)(x+Ya+Yb)] P= 1
SaSb exp j(cvt-Pa-Pb)
1- B aB b exp[-j (Ya + Yb + x)]
S 7
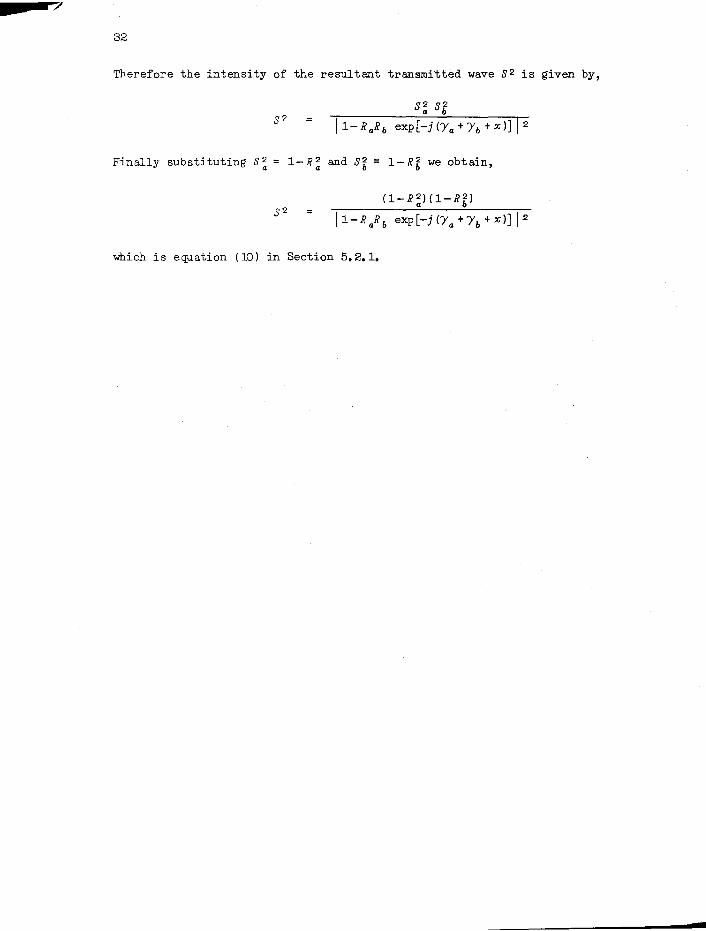
32
Therefore the intensity of the resultant transmitted wave 8 2 is given by,
Finally substituting 8~ = 1-R~ and 8~ = 1-R~ we obtain,
(1-R~) (l-R~)
which is equation (10) in Section 5.2.1.
-

33
APPENDIX III
A summary of the general features of first and second order five and seven layer filter designs is given in the following table.
TABLE 2
5 Layer Filter 7 Layer Filter
1st Order 2nd Order 1st Order 2nd Order
Wavelengths at which the first 0'73 Ao 0'89 Ao 0'77 Ao 0'91 Ao
transmission maxima occur, or or or or in terms of the design wavelength Ao l' 56 Ao 1'14 Ao 1'43 Ao 1'11 Ao
of Ao) BOO/A 1760/A 1440/A 3480/A
Slopes (in terms at 0 0 0 0
the points of 50% response: or or or or per cent change in transmission per unit wavelength ZdO/A 1260/A 560/A 2570/A
0 0 0 0
0'8 Ao 0'92 A 0
0'81 A 0
0'93 Ao Wavelengths of the points of 50% response, in t.erms or or or or of design wavelength Ao
1'33 A 1'09 A 1'3 A 1'08 A 0 0 0 0
As an example of the above results, a further table is drawn up (Table 3) in terms of wavelength for both red-reflect and blue-reflect dichroic filters, so that a direct comparison is possible with a typical set of the more important characteristics (Table 4) required for the analysis mirrors of a colour scanner.

pi 34
TABLE 3
Examples derived from Table 2.
A. Blue reflecting dichroic filter (peak reflection at 42) mf-L).
5 Layer Filter 7 Layer Filter
1st Order 2nd Order 1st Order 2nd Order
Wavelength position of first transmission maximum, mf-L 655 480 000 467
Slope at point of 50% response, 0°69 per cent change per mf-L 3-0 1°33 6°1
Wavelength position of point of 50% response, mf-L 560 458 550 455
B. Red reflecting dichroic filter (point of 50% response at 592 mf-L).
5 Layer Filter 7 Layer Filter
1st Order 2nd Order 1st Order 2nd Order
Wavelength position of first transmission maximum, mf-L 544 572 560 580
Slope at point of 50% response, per cent change per mf-L 1 0 1 2°74 1°95 5°5
Wavelength position of peak reflection, mf-L 740 640 721) 639
35
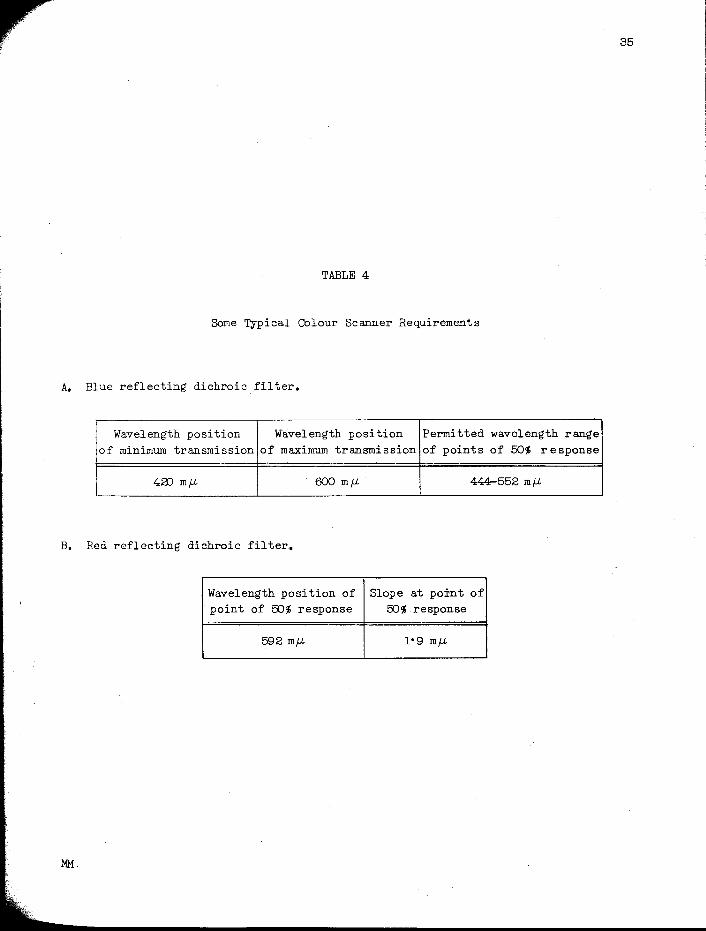
TABLE 4
Some TYpical Colour Scanner Requirements
A. Blue reflecting dichroic filter.
Wavelength position Wavelength position Permitted wavelength range of minimum transmission of maximum transmission of points of 50% response
42) mfL 600 mfL 444-552 m fL
B. Red reflecting dichroic filter.
Wavelength position of Slope at point of point of 50% response 50% response
592 mfL l' 9 mfL
MM.