the consequences of collagen degradation … · the consequences of collagen degradation on bone...
TRANSCRIPT

THE CONSEQUENCES OF COLLAGEN
DEGRADATION ON BONE MECHANICAL
PROPERTIES
by
Chrystia Wynnyckyj
A thesis submitted in conformity with the requirements
for the degree of Doctor of Philosophy
Graduate Department of Materials Science and Engineering
University of Toronto
© Copyright by Chrystia Wynnyckyj (2010)

ii
The consequences of collagen degradation on bone mechanical
properties
Doctor of Philosophy
Chrystia Wynnyckyj
Materials Science and Engineering
University of Toronto
2010
Abstract
The mechanisms underlying the effect of alterations in Type I collagen on bone mechanical
properties are not well defined. Clinical tools for evaluating fracture risk, such as dual energy
x-ray absorptiometry (DXA) and quantitative ultrasound (QUS) focus on bone mineral and
cannot detect changes in the collagen matrix. The mechanical response tissue analyzer
(MRTA) is a potential tool for evaluating fracture risk. Thus, the focus of this work was to
investigate the effects of collagen degradation on bone mechanical properties and examine
whether clinical tools can detect these changes.
Female and male emu tibiae were endocortically treated with 1 M potassium hydroxide
(KOH) solution for 1-14 days and then either mechanically tested in three-point bending,
fatigued to failure or fatigued to induce stiffness loss. Computed Tomography scans, DXA,
QUS, MRTA and three-point bend testing in the elastic region were performed on emu tibiae

iii
before and after either KOH treatment or fatigue to induce stiffness loss. Fracture surfaces
were examined to determine failure mechanisms. Bone mineral and bone collagen were
characterized using appropriate techniques. Bone mineral-collagen interface was investigated
using Raman spectroscopy and atomic force microscopy (AFM).
Endocortical KOH treatment does not affect bone mineral however, it causes in situ collagen
degradation, rather than removal and may be weakening the mineral-collagen interface.
These changes result in significantly compromised mechanical properties. Emu tibiae show
significant decreases in failure stress and increased failure strain and toughness, with
increasing KOH treatment time. The significant increase in toughness of KOH treated bones
is due to structural alterations that enhance the ability of the microstructure to dissipate
energy during the failure process, thereby slowing crack propagation, as shown by fracture
surface analysis. KOH treated samples exhibit a lower fatigue resistance compared to
untreated samples at high stresses only for both sexes. Partial fatigue testing results in similar
decreases in modulus for all groups and sexes. The MRTA detected these changes whereas
DXA and QUS did not. MRTA detects changes in bone mechanical properties induced by
changes in collagen quality and fatigue and could be a more effective tool for predicting
fracture risk.

iv
Acknowledgements
This thesis could not have been accomplished without the input from a great number of
people, whose contribution in assorted ways deserves special mention.
First and foremost, I would like to thank Dr. Marc Grynpas for his supervision and guidance
from the very early stages of this research. Above all, you provided me with encouragement
and support in various ways that were needed throughout the bumpy road of completing this
thesis. Your ideas and passion for science constantly inspired and enriched my growth as a
student and as a researcher. I would like to thank my committee members, Dr. Harvey
Goldberg, Dr. Robert Pilliar, Dr. Eli Sone and Dr. Zhirui Wang for their endless questions
and suggestions that guided and challenged my thinking, substantially improving the finished
product. Finally, thank you to my external examiner, Dr. Mitchell B. Schaffler, for reading
my thesis in record time and for the great discussion.
This thesis would not have been possible without the help of several individuals who in one
way or another contributed and extended their valuable technical assistance in the preparation
and completion of my research. My deepest gratitude is extended to Richard Cheung, Doug
Holmyard, Jackie Razik, Kerri Tupy and Gabriela Voiet. A special thank you to Dr. Mircea
Dumitriu for mineralization analysis but more importantly, for his unique sense of humour. I
must also acknowledge the support of Fanny Strumas, Maria Fryman and Jody Prentice from
the Materials Science Engineering department. I would like to thank current and past
members of the Grynpas and Kandel labs, particularly Sidney Omelon, Lisa Wise-Milestone,
Tanya Hunt and Kimberly Kyle for our numerous stimulating discussions, emotional support,
entertainment and general advice, which helped enrich this wonderful experience.
In addition to the assistance above, I received equally important assistance from family and
friends. My mother instilled in me, from an early age, the desire and skills to be the never-
ending student. A special thank you is due to my brother, Marco, for his support. Finally,
words fail to express my gratitude to my husband, Yurij, whose love, dedication,
understanding and patience made it possible for me to finish my thesis.

v
Table of Contents
Abstract.................................................................................................................................... ii Acknowledgements ................................................................................................................ iv Table of Contents .................................................................................................................... v List of Tables ........................................................................................................................... x List of Figures......................................................................................................................... xi List of Abbreviations ............................................................................................................ xv CHAPTER 1: INTRODUCTION.......................................................................................... 1 1.1 Rationale and Background........................................................................................... 2 1.1.1. Hierarchical structure of bone.............................................................................. 2 1.1.2. Bone composition.................................................................................................. 5 1.1.3. Bone mineral : Hydroxyapatite............................................................................. 5 1.1.4. Bone matrix : Collagen......................................................................................... 6 1.1.5. Noncollagenous proteins (NCPs) ......................................................................... 8 1.1.6. Mineral-collagen interface ................................................................................... 9 1.1.7. Bone mineralization ............................................................................................ 10 1.2 How to Affect Bone Collagen? ................................................................................... 12 1.3 Bone Mechanics........................................................................................................... 13 1.4 Fatigue.......................................................................................................................... 16 1.4.1 Bone fatigue ......................................................................................................... 17 1.4.2 Bone creep strain ................................................................................................. 20 1.5 Bone Toughening Mechanisms .................................................................................. 20 1.6 Tools for Fracture Risk Assessment.......................................................................... 21 1.6.1 Dual Energy X-ray Absorptiometry (DXA).......................................................... 22 1.6.2 Quantitative Ultrasound (QUS)........................................................................... 22 1.6.3 Mechanical Response Tissue Analyzer (MRTA) .................................................. 23 1.7 Animal Models - Emu................................................................................................. 26 1.8 Objectives..................................................................................................................... 26 1.9 Hypothesis.................................................................................................................... 27 1.10 References.................................................................................................................... 28 CHAPTER 2: EXPERIMENTAL APPROACH ............................................................... 37 2.1 Bone Samples............................................................................................................... 38 2.2 Potassium Hydroxide (KOH) Treatment.................................................................. 43 2.3 Statistical Analysis ...................................................................................................... 44 2.4 References.................................................................................................................... 45

vi
CHAPTER 3: INITIAL STUDY ......................................................................................... 46 3.1 Introduction................................................................................................................. 47 3.2 Experimental Details .................................................................................................. 49 3.2.1. Emu bone samples............................................................................................... 49 3.2.2. Bone composition................................................................................................ 50 3.2.3. KOH treatment.................................................................................................... 51 3.2.4. CT........................................................................................................................ 53 3.2.5. DXA..................................................................................................................... 53 3.2.6. QUS..................................................................................................................... 53 3.2.7. MRTA .................................................................................................................. 53 3.2.8. Mechanical testing .............................................................................................. 54 3.2.9. Statistical analysis .............................................................................................. 55 3.3 Results .......................................................................................................................... 55 3.3.1. Emu bone composition........................................................................................ 55 3.3.2. Sex differences in untreated and control bones .................................................. 56 3.3.3. Effect of KOH treatment on bone composition ................................................... 57 3.3.4. Effect of KOH treatment on BMD, SOS, EI ........................................................ 59 3.3.5. Effect of KOH treatment on structural and mechanical properties.................... 59 3.4 Discussion..................................................................................................................... 63 3.4.1. Emu bone composition........................................................................................ 63 3.4.2. KOH treatment and collagen degradation ......................................................... 63 3.4.3. Effect of KOH treatment on bone ductility and toughness ................................. 64 3.4.4. Composite material behaviour............................................................................ 65 3.4.5. Sex differences .................................................................................................... 67 3.4.6. Clinical tools....................................................................................................... 68 3.5 Conclusions.................................................................................................................. 69 3.6 Chapter Summary ...................................................................................................... 70 3.7 References.................................................................................................................... 71 CHAPTER 4: FATIGUE ..................................................................................................... 76 4.1 Introduction................................................................................................................. 77 4.2 Experimental Details .................................................................................................. 79 4.2.1. Emu bone samples and KOH treatment.............................................................. 79 4.2.2. Fatigue testing to failure..................................................................................... 80 4.2.3. Partial fatigue testing ......................................................................................... 83 4.2.4. CT........................................................................................................................ 83 4.2.5. DXA..................................................................................................................... 84 4.2.6. QUS..................................................................................................................... 84 4.2.7. MRTA .................................................................................................................. 84 4.2.8. Three-point bend testing ..................................................................................... 84 4.2.9. Microdamage ...................................................................................................... 85 4.2.10. Statistical analysis ............................................................................................ 86 4.3 Results .......................................................................................................................... 86 4.3.1. Effect of KOH treatment on fatigue properties................................................... 86
vii
4.3.2. Microdamage ...................................................................................................... 92 4.3.3. Effect of partial fatigue testing on BMD, SOS and EI ........................................ 92 4.4 Discussion..................................................................................................................... 94 4.4.1. Fatigue behaviour............................................................................................... 94 4.4.2. Microdamage ...................................................................................................... 97 4.4.3. Sex differences .................................................................................................... 98 4.4.4. Clinical tools....................................................................................................... 99 4.5 Conclusions................................................................................................................ 100 4.6 Chapter Summary .................................................................................................... 100 4.7 References.................................................................................................................. 101 CHAPTER 5: FRACTOGRAPHY ................................................................................... 105 5.1 Introduction............................................................................................................... 106 5.2 Experimental Details ................................................................................................ 107 5.2.1. Emu bone samples and KOH treatment............................................................ 107 5.2.2. Fractography analysis ...................................................................................... 109 5.2.3. Surface roughness measurements ..................................................................... 113 5.2.4. Statistical analysis ............................................................................................ 113 5.3 Results ........................................................................................................................ 114 5.3.1. Tensile versus compressive areas ..................................................................... 114 5.3.2. Degree of roughness ......................................................................................... 115 5.3.3. Regions of interests ........................................................................................... 117 5.3.4. Correlations ...................................................................................................... 121 5.4 Discussion................................................................................................................... 124 5.4.1. Tensile versus compressive areas ..................................................................... 125 5.4.2. Degree of roughness ......................................................................................... 126 5.4.3. Failure mechanisms .......................................................................................... 127 5.5 Conclusions................................................................................................................ 129 5.6 Chapter Summary .................................................................................................... 130 5.7 References.................................................................................................................. 131 CHAPTER 6: COLLAGEN DEGRADATION ............................................................... 134 6.1 Introduction............................................................................................................... 135 6.2 Experimental Details ................................................................................................ 137 6.2.1. Reagents............................................................................................................ 137 6.2.2. Emu bone samples and KOH treatment............................................................ 137 6.2.3. Powder X-ray diffaction.................................................................................... 138 6.2.4. Quantitative backscattered electron imaging ................................................... 140 6.2.5. Microhardness testing....................................................................................... 141 6.2.6. Bone powder preparation ................................................................................. 142 6.2.7. α-Chymotrypsin ................................................................................................ 142 6.2.8. DSC................................................................................................................... 143

viii
6.2.9. SDS-PAGE ........................................................................................................ 145 6.2.10. Polarized light microscopy ............................................................................. 145 6.2.11. Statistical analysis .......................................................................................... 146 6.3 Results ........................................................................................................................ 146 6.3.1. Powder X-ray diffraction .................................................................................. 147 6.3.2. Microhardness .................................................................................................. 147 6.3.3. Quantitative backscattered electron imaging ................................................... 147 6.3.4. α-Chymotrypsin ................................................................................................ 150 6.3.5. DSC................................................................................................................... 152 6.3.6. SDS-PAGE ........................................................................................................ 157 6.3.7. Polarized light microscopy ............................................................................... 161 6.4 Discussion................................................................................................................... 163 6.4.1. Mineral characterization .................................................................................. 163 6.4.2. Collagen degradation ....................................................................................... 164 6.4.3. Partial debonding of the collagen-mineral interface........................................ 167 6.4.4. Sex differences .................................................................................................. 168 6.5 Conclusions................................................................................................................ 169 6.6 Chapter Summary .................................................................................................... 170 6.7 References.................................................................................................................. 171 CHAPTER 7: INTERFACE .............................................................................................. 177 7.1 Introduction............................................................................................................... 178 7.2 Experimental Details ................................................................................................ 181 7.2.1. Emu bone samples and KOH treatment............................................................ 181 7.2.2. Raman spectroscopy data acquisition .............................................................. 181 7.2.3. Raman spectroscopy data analysis ................................................................... 182 7.2.4. Atomic force microscopy imaging .................................................................... 183 7.2.5. Secondary surface roughness measurements.................................................... 184 7.2.6. Statistical analysis ............................................................................................ 185 7.3 Results ........................................................................................................................ 185 7.3.1. Raman spectroscopy analysis ........................................................................... 185 7.3.2. Atomic force microscopy................................................................................... 190 7.4 Discussion................................................................................................................... 194 7.4.1. Raman spectroscopy ......................................................................................... 195 7.4.2. Atomic force microscopy................................................................................... 196 7.5 Conclusions................................................................................................................ 199 7.6 Acknowledgement ..................................................................................................... 199 7.7 Chapter Summary .................................................................................................... 200 7.8 References.................................................................................................................. 201 CHAPTER 8: CONCLUSIONS ........................................................................................ 205

ix
CHAPTER 9: FUTURE WORK ....................................................................................... 208 9.1 Introduction............................................................................................................... 209 9.2 Future Work.............................................................................................................. 209 9.2.1. Objective 1 - Initial study.................................................................................. 209 9.2.2. Objective 2 - Fatigue ........................................................................................ 210 9.2.3. Objective 4 - Collagen degradation.................................................................. 211 9.2.4. Objective 5 - Interface ...................................................................................... 212 9.3 References.................................................................................................................. 213 APPENDICES..................................................................................................................... 215 APPENDIX A: Untreated (0-day) versus Control (14-day filled with saline) results .. 215 A.1 Objective 1 - Initial study ........................................................................................ 216 A.2 Objective 2 - Fatigue ................................................................................................ 218 A.3 Objective 3 - Fractography ..................................................................................... 222 A.4 Objective 4 - Collagen degradation ........................................................................ 226 A.5 Objective 5 - Interface ............................................................................................. 228

x
List of Tables Table 2.1 Sample size of female and male emu bones 40 Table 2.2 Summary of techniques 41 Table 3.1 Collagen, mineral and fat content measurements for female and male
emu tibiae 56
Table 3.2 Average geometrical parameters, BMD, BMC and mechanical properties prior to KOH treatment
57
Table 3.3 Average geometrical parameter changes due to KOH treatment for female and male emu tibiae
60
Table 4.1 Sample size of female and male emu tibiae for fatigue testing 80 Table 4.2 BMD and geometrical parameters of emu tibiae after KOH treatment
but prior to fatigue to failure testing 88
Table 4.3 Initial secant modulus, creep strain at fracture and strain at fracture for fatigue to failure emu tibiae
88
Table 4.4 Strain levels during partial fatigue testing of emu tibiae 92 Table 4.5 Average geometrical parameter changes after KOH treatment and
partial fatigue testing of emu tibiae 94
Table 5.1 Percent area roughness and surface roughness (profiler) measurements
for female and male untreated and 14-day KOH treated bones 117
Table 5.2 Porosity parameters from tensile side of female and male emu tibiae fracture surfaces
119
Table 5.3 Correlations between bone fracture surface features and mechanical properties for female and male emu tibiae
122
Table 6.1 Emu bone mineral crystal length (002) and cross section (310)
estimated by XRD and microhardness testing results 147
Table 6.2 Quantitative BSE results for tibiae of female and male KOH treated bone
148
Table 6.3 Average female and male emu tibiae thermal characteristics from DSC 153 Table 7.1 Average female and male emu tibiae Raman spectroscopy parameters 187 Table 7.2 Quantitative grey level distribution and surface roughness results for
female and male emu tibiae 194

xi
List of Figures
Figure 1.1 The hierarchical organization of bone 4 Figure 1.2 The interior structure of a collagen molecule 6 Figure 1.3 The arrangement of collagen molecules within a fibril showing the gap
and overlap regions for mineral deposition 7
Figure 1.4 Organization and interaction of collagen and mineral at different structural levels of hierarchy
12
Figure 1.5 Ideal load-displacement curve 15 Figure 1.6 Ideal stress-strain curve 16 Figure 1.7 Schematic diagram of stress versus number of cycles to failure curve 17 Figure 1.8 Schematic diagram of the stages of fatigue in bone 19 Figure 1.9 Schematic diagram of bone toughening mechanisms: (a)
microcracking, (b) uncracked ligament bridging, (c) crack bridging by collagen fibers and (d) crack deflection by osteons
21
Figure 1.10 MRTA setup for an ulna measurement 24 Figure 2.1 Schematic of sample retrieval for analysis of the different techniques 40 Figure 2.2 Flowchart summary of experimental techniques 42 Figure 2.3 KOH treatment setup 43 Figure 3.1 Percent collagen weight removed versus KOH treatment time for
female and male emu tibiae 58
Figure 3.2 Percent bone weight loss versus KOH treatment time for female and male emu tibiae
58
Figure 3.3 Percent changes of bone quality measurements reported by the different measurements techniques as a function of KOH treatment time
59
Figure 3.4 Representative stress-strain curves for 0-14 day KOH treatment of (a) female and (b) male emu tibiae
61
Figure 3.5 Mechanical properties as a function of KOH treatment time for female and male emu tibiae: (a) elastic modulus, (b) failure stress, (c) failure strain and (d) toughness
62
Figure 4.1 Schematic diagram of hysteresis curves produced from a typical
fatigue test and resulting defined data 82
Figure 4.2 Schematic diagram of characteristic creep curve observed during fatigue testing showing the three characteristic stages
83
Figure 4.3 Percent bone weight loss versus KOH treatment time for female and male fatigue emu tibiae
89
Figure 4.4 Percent collagen removed versus KOH treatment time for female and male fatigue emu tibiae
89

xii
Figure 4.5 Peak stress versus log(N) curves for 0-14 day KOH treatment for (a) female and (b) male emu tibiae
90
Figure 4.6 Peak stress versus damage index rate curves for 0-14 day KOH treatment for (a) female and (b) male emu tibiae
91
Figure 4.7 Peak stress versus creep rate curves for 0-14 day KOH treatment for (a) female and (b) male emu tibiae
92
Figure 4.8 Percent changes of bone quality measurements after partial fatigue testing reported by the different measurement techniques as a function of KOH treatment time for (a) female and (b) male emu tibiae
93
Figure 4.9 Cumulative damage model showing the transition from creep to crack accumulation behaviour
96
Figure 5.1 Representative digital images of female and male, untreated and 14-
day KOH treated fracture surfaces 110
Figure 5.2 Representative tensile fracture surfaces of male 14-day KOH treated emu tibia
111
Figure 5.3 Representative compressive fracture surfaces of female 14-day KOH treated emu tibia
111
Figure 5.4 Schematic diagram of bone toughening mechanisms: (a) microcracking, (b) uncracked ligament bridging, (c) crack bridging by collagen fibers and (d) crack deflection by osteons
112
Figure 5.5 Representative stress-strain curves for untreated and 14-day KOH treated emu tibiae
114
Figure 5.6 Representative SEM images of untreated and 14-day KOH treated female and male tensile emu tibiae fracture surfaces
118
Figure 5.7 Representative SEM images of male compressive fracture surfaces of untreated and 14-day KOH treated emu tibiae
120
Figure 5.8 Representative SEM images of female compressive fracture surfaces of untreated and 14-day KOH treated emu tibiae
121
Figure 5.9 Regression of (a) elastic modulus, (b) failure stress, (c) failure strain and (d) toughness with respect to the relative roughness area on the tensile fracture surface of bone for female and male emu tibiae
123
Figure 5.10 Regression of (a) elastic modulus, (b) failure stress, (c) failure strain and (d) toughness with respect to the relative roughness area on the compressive fracture surface of bone for female and male emu tibiae
124
Figure 6.1 Schematic diagram of a typical DSC curve and the definitions of the
DSC parameters measured 144
Figure 6.2 BSE images of (a) untreated female, (b) untreated male, (c) 14-day female and (d) 14-day male emu tibiae
149
Figure 6.3 Percent digested collagen as a function of KOH treatment time for female and male emu tibiae
150

xiii
Figure 6.4 Regression of (a) elastic modulus, (b) failure stress, (c) failure strain and (d) toughness with respect to the percent digested collagen for female and male emu tibiae
151
Figure 6.5 Regression of (a) elastic modulus, (b) failure stress, (c) failure strain and (d) toughness with respect to the FWHMH (from DSC curves) for female and male emu tibiae
154
Figure 6.6 Regression of (a) elastic modulus, (b) failure stress, (c) failure strain and (d) toughness with respect to the Height (from DSC curves) for female and male emu tibiae
155
Figure 6.7 Regression of (a) elastic modulus, (b) failure stress, (c) failure strain and (d) toughness with respect to the Tonset (from DSC curves) for female and male emu tibiae
156
Figure 6.8 SDS-PAGE results: (a) analysis of proteins from select samples from each treatment group for female and male emu tibiae, (b) representative densitometric scans of proteins from (a), (c) plot of average relative peak intensity band area versus KOH treatment time for female and male emu tibiae from (a)
157
Figure 6.9 Average percent change in α-chain band intensity area for all samples as a function of KOH treatment time for female and male emu tibiae
159
Figure 6.10 Regression of (a) elastic modulus, (b) failure stress, (c) failure strain and (d) toughness with respect to the collagen peak area intensity (from SDS-PAGE) for female and male emu tibiae
160
Figure 6.11 Images of transcortical sections of demineralized 14-day KOH treated male and female emu tibiae viewed under non-polarized and polarized light
162
Figure 7.1 Typical Raman spectra of bone showing the calculation of degree of
mineralization, carbonate substitution and crystallinity 183
Figure 7.2 Typical Raman spectra scans taken from male untreated and 14-day KOH treated samples
186
Figure 7.3 Typical Raman spectra scans taken from female untreated and 14-day KOH treated samples
186
Figure 7.4 Changes in Raman peak widths (FWHMH) and Raman peak positions of (a) phosphate band and (b) carbonate band for female and male emu tibiae samples
188
Figure 7.5 Changes in Raman peak widths (FWHMH) and Raman peak positions of (a) amide III band, (b) C-H bending band and (c) amide I band for female and male emu tibiae samples
189
Figure 7.6 A 20 x 20 μm2 AFM tapping mode image of the endocortical surface of male cortical bone, showing (a) densely packed agglomerated spheroidal particles and (b) a higher resolution image from (a), of untreated male sample. Figure (c) represents a 14-day KOH treated image and (d) a higher resolution image from (c).
191

xiv
Figure 7.7 A 20 x 20 μm2 AFM tapping mode image of the endocortical surface of female cortical bone, showing (a) densely packed agglomerated spheroidal particles and (b) a higher resolution image from (a), of untreated female sample. Figure (c) represents a 14-day KOH treated image and (d) a higher resolution image from (c).
192

xv
List of Abbreviations αCT alpha chymotrypsin ΔH enthalpy of denaturation %CS percent area of compressive surfaces %TS percent area of tensile surfaces AFM atomic force microscopy B.Ar. bone cortical area BMC bone mineral content BMD bone mineral density BSP bone sialoprotein Cr.Le. microcrack mean length Cr.Dn. microcrack density Cr.S.Dn. surface microcrack density CT computed tomography CR creep rate DI damage index DSC differential scanning calorimetry DXA dual energy x-ray absorptiometry EDTA ethylenediaminetetraacetic acid EI cross-sectional bending stiffness FWHMH full width at half maximum height GuHCl guanidine hydrochloride HA hydroxyapatite KOH potassium hydroxide MRTA mechanical response tissue analyzer NaOH sodium hydroxide NCP noncollagenous protein OH-Pro hydroxyproline PI protease inhibitors PLM polarized light microscopy PMMA polymethylmethacrylate qBSE quantitative back scattered electron QUS quantitative ultrasound SAXS scanning small-angle x-ray scattering SDS sodium dodecyl sulfate SDS-PAGE sodium dodecyl sulfate polyacrylamide gel electrophoresis SEM scanning electron microscope S/N stress vs. number of cycles SOS speed of sound TEM transmission electron microscopy XRD x-ray diffraction

1
Chapter 1 Introduction 1.1. Rationale and Background
1.1.1. Hierarchical structure of bone 1.1.2. Bone composition 1.1.3. Bone mineral : Hydroxyapatite 1.1.4. Bone matrix : Collagen 1.1.5. Noncollagenous Proteins (NCPs) 1.1.6. Mineral-collagen interface 1.1.7. Bone mineralization
1.2. How to Affect Bone Collagen?
1.3. Bone Mechanics
1.4. Fatigue
1.4.1. Bone fatigue 1.4.2. Bone creep strain
1.5. Bone Toughening Mechanisms
1.6. Tools for Fracture Risk Assessment
1.6.1. Dual Energy X-ray Absorptiometry (DXA) 1.6.2. Quantitative Ultrasound (QUS) 1.6.3. Mechanical Response Tissue Analyzer (MRTA)
1.7. Animal Models – Emu
1.8. Objectives
1.9. Hypothesis
1.10. References

2
1.1. Rationale and Background
Bone is a complex composite material, consisting of mainly two phases: a mineral phase
embedded within a compliant organic matrix. The mineral phase largely contributes to the
overall strength and stiffness of bone [1,2]. It has also been shown that the organic phase
contributes to bone toughness and may also affect bone strength [3]. The mechanical
properties of bone depend on the characteristics of the mineral, collagen and the interaction
between the mineral and collagen [4-6]. Studies have been performed on the effects of
decreased bone quality due to changes in bonding between the mineral and organic phases
[5-8]. The individual contributions of the mineral and organic phases to the mechanical
properties of bone have been studied, with the mineral receiving the majority of research
interests. The mechanisms underlying the effect of alterations in Type I collagen on bone
mechanical properties are not well defined. When these major effects on bone properties are
considered, it is evident that the changes in the collagen network of bone warrant a
quantitative evaluation of varying degrees of collagen loss or degradation on bone
biomechanics.
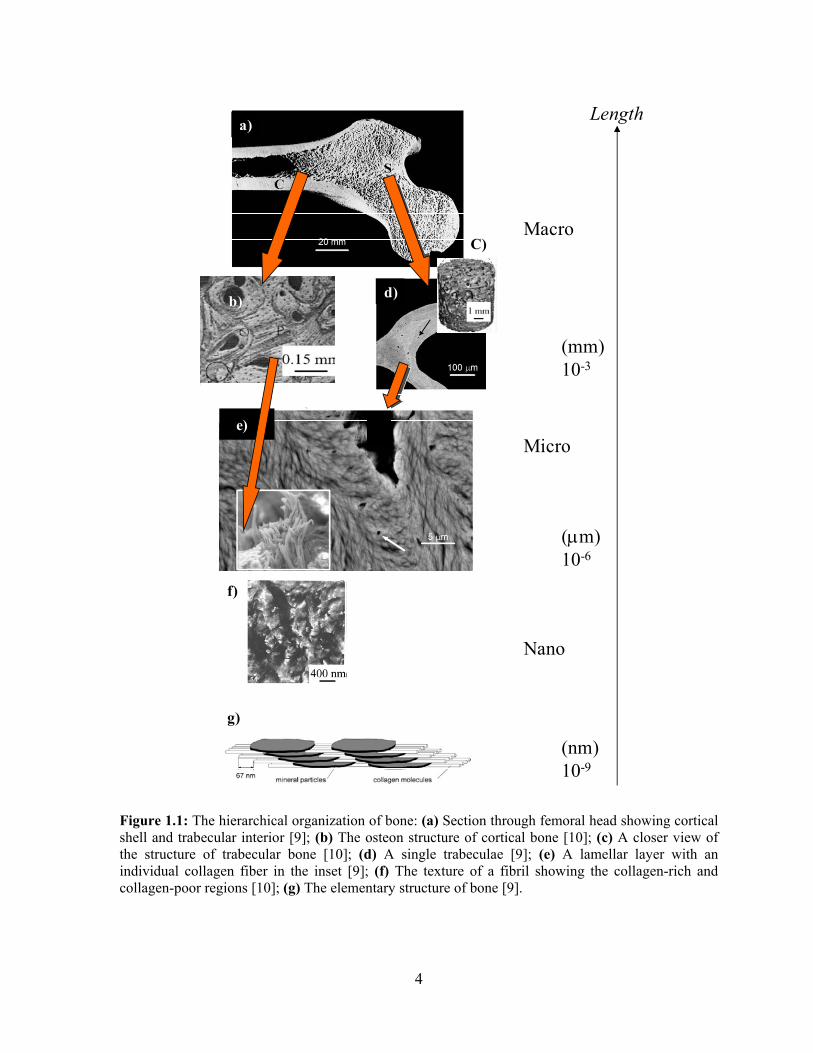
1.1.1. Hierarchical structure of bone
Bone has a complex hierarchical microstructure [2,9,10] that can be considered at many
dimensional scales (Figure 1.1). From a macroscopic point of view, bone tissue is
nonhomogeneous, porous and anisotropic and can be classified into two types: cortical and
trabecular bone. Trabecular bone has a porosity ranging from 50-95% and is found in the end
of long bones, in vertebrae and flat bones. The pores are interconnected and filled with
marrow while the bone matrix has the form of plates and struts called trabeculae (Figure 1.1
(d)). The individual trabeculae (struts) are connected at nodes. At the microscale, individual
trabeculae have a layered arrangement of lamellae (Figure 1.1 (e)). Therefore, each
trabeculae is itself a plywood-like composite that can resist failure due to bending. Cortical
bone is much denser with a porosity ranging between 5-10% and is found primarily in the
shaft of long bones and surrounding the trabecular bone forming the external shell of flat
bones [2].

3
Bone can also be either woven or lamellar. Woven bone is laid down rapidly during growth
or repair and the fibres are aligned at random and as a result, has low strength. In contrast,
lamellar bone has parallel fibres and is much stronger. Woven bone is replaced by lamellar
bone as growth continues [1].
At the microstructural length-scale, cortical bone is made up of a structure of Haversian
systems or osteons (Figure 1.1 (b)) formed by cylindrical lamellae surrounding a Haversian
canal [2]. Each osteon consists of a blood vessel surrounded by concentric layers of lamellae
and osteons are connected through a lamellar matrix. Osteons run parallel to the long axis of
the bone and act as reinforcing tubes in the lamellar matrix [2]. Therefore, this osteonic
structure assists in the axial support of the cortical bone.
The next hierarchical level focuses on the structure of the individual lamellae. Lamellae are
composed of collagen fibers in a mineral matrix [2]. The inset of Figure 1.1 (e) shows an
individual collagen fiber protruding from this matrix. Figure 1.1 (f) represents collagen-rich
and collagen-poor domains [10].
The single lamella structure is further broken down into collagen fiber assemblies of collagen
fibrils [2]. These fibrils themselves can again be broken down into what are generally
assumed the elementary components of bone: collagen molecules and mineral particles
(Figure 1.1 (g)) [9]. In this manner, bone is a composite of a hard and brittle mineral phase
(E=135 GPa, εf=0.1%) and a soft ductile collagen phase (E=1 GPa, εf=10%), which is
reflected in the compromised mechanical properties of bone (E=10-25 GPa, εf=1-1.5%) [11].
One could consider bone to be an interpenetrating organic-inorganic composite. The
hierarchical structure of bone must be considered when evaluating bone mechanically as the
different hierarchical, structural elements contribute distinct characteristics to mechanical
properties.
4
C)
a)
b) d)
e)
f)
g)
Length
Macro
(mm)10-3
Micro
(μm)10-6
Nano
(nm)10-9
Figure 1.1: The hierarchical organization of bone: (a) Section through femoral head showing cortical shell and trabecular interior [9]; (b) The osteon structure of cortical bone [10]; (c) A closer view of the structure of trabecular bone [10]; (d) A single trabeculae [9]; (e) A lamellar layer with an individual collagen fiber in the inset [9]; (f) The texture of a fibril showing the collagen-rich and collagen-poor regions [10]; (g) The elementary structure of bone [9].

5
1.1.2. Bone composition
In terms of composition, bone has two major phases: an organic and an inorganic phase. The
inorganic or mineral phase constitutes 60 – 70% of bone (by weight) and is poorly crystalline
hydroxyapatite (HA) crystals [Ca10(PO4)6(OH)2] with some carbonate, citrate, magnesium,
strontium and fluoride impurities [1]. The organic matrix of bone accounts for 25 – 35% of
the bone, and 90% of this phase is Type I collagen, with the remainder consisting of various
noncollagenous proteins [1].
The ratio of mineral and organic phases of bone is maintained through a dynamic process
known as bone remodeling or turnover, which is carried out by specialized bone cells. These
include osteoclasts, osteoblasts and osteocytes [1]. Osteoclasts resorb old bone through
production of hydrogen ions, which lowers the pH and consequently increases the solubility
of HA crystals. The organic matrix is then degraded via acidic proteolytic digestion [12].
Osteoblasts are bone forming cells. They line bone surfaces and produce matrix elements
including Type I collagen, osteocalcin, osteopontin, proteoglycans and regulating factors [1].
Osteocytes are osteoblasts that have been trapped within the mineralized matrix. They
maintain the bone by passing nutrients and wastes between the blood and tissue [1].
Together, osteoblasts, osteocytes and osteoclasts can create and reshape bone. If there is an
imbalance of cellular activity in bone, the bone quality will be compromised [1].
1.1.3. Bone mineral: Hydroxyapatite
Bone mineral is composed of poorly crystalline hydroxyapatite (HA). HA is calcium
phosphate [Ca10(PO4)6(OH)2] and recent studies using transmission electron microscopy
(TEM) and scanning small-angle X-ray scattering (SAXS) have shown that HA is plate-like
in shape. Fratzl et al. have determined the most probable size of the particle to be 15-200 nm
long, 10-80 nm wide and 2-5 nm thick [9]. However, their precise shape is unknown and is
still an ongoing debate: needles versus plates [9, 13]. The exact structure of bone mineral is
not well defined due to substitutions occurring into the lattice structure. For example, Na+,
K+, Fe2+, Zn2+, Sr2+and Mg2+ are capable of substituting for Ca2+ in the cationic calcium sites.
Anionic complexes (HPO42-, CO3
2-) can replace PO43- as well as OH- and F- can also
substitute OH- [14].

6
1.1.4. Bone matrix: Collagen
The organic matrix of bone consists mainly (~90%) of Type I collagen, a triple helix
molecule that is specifically arranged in several hierarchical levels to provide elasticity and
toughness to bone. The collagen molecule can be further dissected into three polypeptide
chains as shown in Figure 1.2. Each of the three polypeptide chains consists of approximately
1052 amino acids in length. Two of these chains are identical alpha-1 chains (α1(I)), while
the third is an alpha-2 chain (α2(I)). The 300 nm long and 1.5 nm thick helical structure of
the macromolecule has active sites that allow for inter- and intramolecular crosslinking [15].
The collagen molecule is stabilized by intramolecular hydrogen bonding that occurs between
hydroxyproline and other amino acid residues [15,16]. Hydroxyproline accounts for
approximately 10% of the protein by mass [17]. In fact, the primary sequence of amino acids
in collagen is a repeating Gly-X-Y unit, where X is most commonly proline and Y is most
often hydroxyproline [18,19]. Glycine is the smallest amino acid and is composed of the
smallest side group, a single hydrogen, which allows it to pack into the centre of the helix
[18,19]. Proline and hydroxyproline have very large planar side groups and due to steric
hindrance, must pack in a fairly specific fashion on the outside of the helix [18,19].
Figure 1.2: The interior structure of a collagen molecule [15].
The collagen is post-translationally modified to contain hydroxylysine, hydroxyproline and
glycosylated hydroxylysine [20]. In the extracellular matrix, the hydroxylysine residues are
involved in the formation of stable collagen crosslinks [20]. The initial crosslinks between
collagen molecules are nonstable, divalent, bipolar and reducible forms [1]. As the bone

7
matures, the crosslinks also mature into more stable nonreducible forms connecting more
than two chains [1]. Crosslinking is either enzymatically or non-enzymatically mediated [21].
The enzymatic process, mediated by lysyl oxidase, results in the trivalent collagen crosslinks
pyridinoline (PYD) and deoxypyridinoline (DPD). Non-enzymatic collagen crosslinking
(producing advanced glycation end products such as pentosidine) occurs via spontaneous
condensation of arginine, lysine and free sugars [21]. Enzymatic crosslinks are located at the
collagen overlap position, also known as the telopeptide regions [22]. Conversely, non-
enzymatic crosslinks appear to have no specific spatial arrangement [23]. Crosslinks consist
predominantly of C-C and C-N bonds within a single molecule [20] and therefore provide
local strong interactions between collagen molecules.
Tropocollagen is the subunit of collagen fibrils formed of three polypeptide strands. Each of
the three chains is twisted into a left-handed helix with approximately three amino acids per
turn [15]. The three helical α-chains are then coiled around each other into a right-handed
super-triple helix [15]. The collagen molecules are aligned such that there is a 40 nm
separation between adjacent ends, forming a collagen fibril. The collagen molecules making
up the fiber are aligned in a quarter-staggered pattern. This network of fibers provides the
framework onto which the mineral phase is deposited. The gaps between collagen fibers are
thought to be sites of mineralization initiation, making it vital to the proper formation of bone
[2,15]. Figure 1.3 shows the arrangement of collagen molecules in which the 40 nm space
between molecules is referred to as a gap region, while the 27 nm dimension refers to an
overlap region [15].
Figure 1.3: The arrangement of collagen molecules within a fibril showing the gap and overlap regions for mineral deposition [15].

8
The size of the gap region appears to constrain mineral growth. The commonly accepted
model of higher order aggregation suggests that five tropocollagen units align longitudinally
(overlapping by about one-quarter of the molecular length) into a microfibril [24].
The importance of collagen is clearly defined when considering various bone disorders.
Osteogenesis Imperfecta is a heritable disease resulting from mutations in the COL1A1 and
COL1A2 genes, which encode for the α1 and α2 chains of Type I collagen, respectively
[15,25]. Over 100 different mutations have been identified. A substitution of the glycine
residue in the α1 or α2 chain is an example. Other mutations include deletions, insertions and
duplications. As a result of these mutations, the collagen molecules are unable to form
normally, disrupting the packing of the molecules into fibrils, resulting in excessive
brittleness of bone [15,25]. The importance of the formation of crosslinks in the mechanical
functions of collagen is demonstrated in lathyrism, which inhibits lysyl oxidase activity, the
enzyme needed in crosslink formation [25]. Lathyrism results in severe abnormalities of
bones, joints and blood vessels due to decreased collagen fibril stability [25]. Finally,
dermatosparaxis is a disorder which is caused by a deficient activity of Type I procollagen N-
proteinase, the enzyme that excises the N-terminal propeptides in Type I procollagen. As a
consequence, there is accumulation of collagen that still contains the N- but not the C-
propeptide, resulting in extreme skin fragility [26].
1.1.5. Noncollagenous Proteins (NCPs)
There are over 200 types of noncollagenous proteins (NCPs) in bone, which account for
approximately 10% of the total organic bone matrix content [27]. The noncollagenous
fraction contains both specific bone proteins and serum proteins that are concentrated in bone
[28]. Osteopontin, osteocalcin, osteonectin and bone sialoprotein (BSP) are the most
abundant and widely investigated noncollagenous bone matrix proteins. They are primarily
anionic with negatively charged groups that bind readily to calcium on the surface of
hydroxyapatite [29]. Unfortunately, these acidic macromolecules are difficult to isolate from
the bone matrix and are therefore not well understood.
9
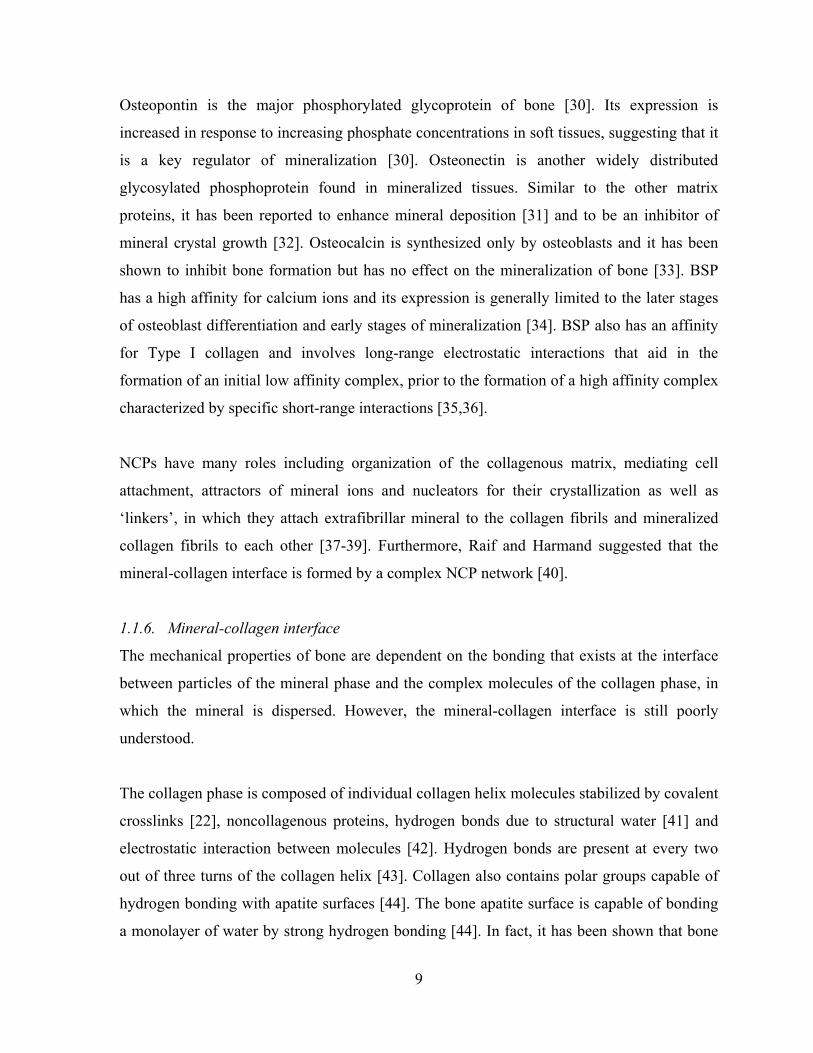
Osteopontin is the major phosphorylated glycoprotein of bone [30]. Its expression is
increased in response to increasing phosphate concentrations in soft tissues, suggesting that it
is a key regulator of mineralization [30]. Osteonectin is another widely distributed
glycosylated phosphoprotein found in mineralized tissues. Similar to the other matrix
proteins, it has been reported to enhance mineral deposition [31] and to be an inhibitor of
mineral crystal growth [32]. Osteocalcin is synthesized only by osteoblasts and it has been
shown to inhibit bone formation but has no effect on the mineralization of bone [33]. BSP
has a high affinity for calcium ions and its expression is generally limited to the later stages
of osteoblast differentiation and early stages of mineralization [34]. BSP also has an affinity
for Type I collagen and involves long-range electrostatic interactions that aid in the
formation of an initial low affinity complex, prior to the formation of a high affinity complex
characterized by specific short-range interactions [35,36].
NCPs have many roles including organization of the collagenous matrix, mediating cell
attachment, attractors of mineral ions and nucleators for their crystallization as well as
‘linkers’, in which they attach extrafibrillar mineral to the collagen fibrils and mineralized
collagen fibrils to each other [37-39]. Furthermore, Raif and Harmand suggested that the
mineral-collagen interface is formed by a complex NCP network [40].
1.1.6. Mineral-collagen interface
The mechanical properties of bone are dependent on the bonding that exists at the interface
between particles of the mineral phase and the complex molecules of the collagen phase, in
which the mineral is dispersed. However, the mineral-collagen interface is still poorly
understood.
The collagen phase is composed of individual collagen helix molecules stabilized by covalent
crosslinks [22], noncollagenous proteins, hydrogen bonds due to structural water [41] and
electrostatic interaction between molecules [42]. Hydrogen bonds are present at every two
out of three turns of the collagen helix [43]. Collagen also contains polar groups capable of
hydrogen bonding with apatite surfaces [44]. The bone apatite surface is capable of bonding
a monolayer of water by strong hydrogen bonding [44]. In fact, it has been shown that bone

10
apatite surfaces will bond polar groups more strongly than non-polar groups [44].
Furthermore, the number and orientation of the polar groups determine the strength of the
interaction adsorption on the apatite surfaces [44].
The strength of the individual bonds depends on the chemical composition of both the
mineral surface and the adjacent organic phase. A large number of bonding is available by
the extensive interface area which exists between the mineral and collagen. This interphase
bonding is due to adsorption forces between the phases [44]. It has been suggested that
interfacial bonding interactions between the mineral and the collagen are due, in part, to the
strong adsorption affinity of hydroxyapatite for organic material [45,46]. This adsorption
involves electrostatic (coulombic) interactions between the positively charged mineral
surface (calcium) and the negatively charged organic domains (carboxyl groups). Hydrogen
bonding networks, van der Walls interactions and hydrophobic bonding may also be present
at the mineral-collagen interface [45,46]. A recent study showed that the cohesion of the
mineral-collagen interface may be due to a layer of structural water [41]. Some evidence also
exists which indicates that direct covalent bonds are formed between HA and collagen [47].
However, the extent to which the adhesion between the phases is due to direct chemical
bonding, covalent or otherwise or to mechanical interlocking links between the phases is
unknown. Furthermore, as mentioned above, the noncollagenous proteins may act as an
interface phase which bonds the hydroxyapatite and collagen together [40].
1.1.7. Bone mineralization
Numerous findings and theories have been published in the literature with regard to the
mechanisms of mineralization. Mineralization has been hypothesized to occur by the
heterogeneous nucleation of calcium-phosphate nanocrystals at specific, highly ordered sites
within the collagen fibrils [48]. Chemical bonds or strong interactions between the collagen
fibrils and certain groups of the collagen matrix may create a special environment within the
fibrils that could also facilitate this nucleation [24]. Another theory involves matrix vesicles,
which are formed and released from the outer membranes of osteoblasts and related cells
[49]. It is believed that hydroxyapatite is first nucleated within the vesicle. As the crystallite
grows bigger, it breaks through the vesicle and is exposed to the extracellular fluid. However,

11
matrix vesicles are not the only site of mineral nucleation [50]. Numerous in vitro studies
have indicated that a wide variety of matrix proteins can nucleate and control growth or
agglomeration of these crystals [50]. Collagen does not seem to stimulate epitaxial growth of
hydroxyapatite and as a result, it has been considered that some of the noncollagenous
proteins might bind to the collagen fibrils to direct the nucleation event [51,52].
With regard to collagen-based mineralization, the process of bone mineral deposition begins
with the nucleation of HA crystals at multiple sites on the collagen fibrils [14,53]. A
schematic diagram illustrating the organization and interaction of collagen and mineral at
different structural levels of hierarchy is shown in Figure 1.4. Unmineralized single collagen
molecules are assembled into complex arrangements of crystal platelets, plates and lamellae
associated with collagen fibrils and fibers at macroscopic and anatomic levels [53]. Initially,
the empty gap zones between the collagen molecules are filled with water but this water is
later replaced with mineral [54]. Crystal platelets nucleate in the collagen gaps created by the
periodic (~67 nm) gap and overlap regions (Figure 1.4 (a)) [53]. This mechanism is based on
the model of collagen assembly proposed by Hodge and Petruska [55] and the manner of its
association with the hydroxyapatite mineral described by Weiner and Traub [13].
The mineral crystal platelets grow in length with a specific crystalline orientation: the c-axes
of the crystals are roughly parallel to the long axes of the collagen fibrils (Figure 1.4 (b))
[38,53,56,57]. As a result, the mineral crystals are aligned along the axis of the collagen
fibrils and reinforce the collagen matrix to provide a very strong and tough composite.
Noncollagenous proteins may bind selectively to different surfaces of the crystal, preventing
further growth and thereby determining its final size and shape [38]. Crystals then coalesce
into larger and thicker plates, maintaining their periodic deposition (~50-70 nm) and parallel
nature, as collagen macromolecules grow into microfibrils and fibrils (~20 nm in diameter)
(Figure 1.4 (c)) [53]. These crystal plates continue to grow at the level of collagen fibers (~80
nm in diameter) (Figure 1.4 (d)) [53]. Next, fibers combine, resulting in a series of parallel
plate aggregates (length of ~500 nm and thickness of ~80 nm), initially separated by ~50 nm
(Figure 1.4 (e)) [53]. However, this space decreases gradually as mineral deposition
continues in the tissue and expands to thicknesses of ~130 nm (Figure 1.4 (f)) [53]. The

12
periodic deposition (~50-70 nm) is still present, indicative of the basic collagen structure
underlying mineral formation [53]. Finally, these plate aggregates grow to be lamellar in
shape and comprise a portion of bone or mineralized tendon (Figure 1.4 (f)) [53].
Independent of the mineralization associated with the gap and overlap regions, there is
surface mineralization of the collagen structures in Figure 1.4 (b) to (f) [58].
Figure 1.4: Organization and interaction of collagen and mineral at different structural levels of hierarchy [53].
Mineralization is a two-stage process that is generally referred to as primary mineralization
and secondary mineralization. During primary mineralization, nucleation occurs in the gap
region after which the mineral grows into the overlap region. This primary mineralization
takes only a few days and accounts for 70% of the mineralization while the remaining 30% is
due to secondary mineralization, which involves further mineral growth and takes years [59].
1.2. How to Affect Bone Collagen?
Several studies have affected collagen and bone collagen using a variety of different
techniques including genetic mutations, heat denaturation, enzymatic digestion and caustic
solutions [60-75]. Naturally occurring mutations involving collagen genes are associated
with skeletal fragility in humans [60]. Specifically, the Mov13 strain carries a provirus that

13
prevents initiation of transcription of the α1(I) collagen gene [60,63] and has been used as a
model of Osteogenesis Imperfecta [60]. The collagen molecular structure has also been
altered in demineralized human cadaveric bone samples by heat induced unwinding and
enzymatic cleavage (pancreas elastase) [62]. Enzymatic digestion to denature the triple-
helical structure with the use of trypsin, cathepsin K and papain have also been used
however, a demineralization step is required to be effective [64].
The use of caustic solutions such as potassium hydroxide (KOH) and sodium hydroxide
(NaOH) as degradation agents have been reported [65-68], although to a lesser extent than
sodium hypochlorite (bleach) [69,70]. Most studies have employed a bleach concentration of
5.25%, although concentrations of 25% were used in some studies. It has been reported that
immersion of bone in commercial bleach solution results in removal of >97.5% of the
collagen from bone matrix [70]. However, most of the studies employing bleach to affect
bone collagen used bone masses on the order of a few hundred milligrams, which may have
caused rapid collagen degradation. The first deproteinization procedure of bone involved the
use of hydrazine and was proposed by Termine et al. [71]. However, this procedure has been
shown to be inefficient in eliminating the organic matrix of bone [72] and the temperature of
55 °C used in the procedure has been shown to alter bone mineral crystallinity [73]. The use
of hydrogen peroxide as a deproteinization agent for bone is not as widespread as in the case
of sodium hypochlorite and is not as effective [74]. Furthermore, it has been shown that both
the use of bleach and hydrogen peroxide as bone deproteinization agents are more effective if
the fat content is removed [74]. Treatment can also be performed using guanidine
hydrochloride, which results in removal of approximately 35% noncollagenous proteins and
small amounts of soluble collagens from bone through dissociative extraction [75]. The
proteins dissociated are either unprotected by or loosely associated with the bone matrix. The
remaining organic components consist of non-soluble collagens, mainly Type I collagen,
bone mineral and noncollagenous proteins bound to collagen and/or bone mineral [75].
1.3. Bone Mechanics
The integrity of collagen molecules is critical to the structural stability of the collagen
network and the collagen matrix plays an important role in bone fragility and fracture risk

14
[62,76]. Given its role in the structural integrity of bone, the paucity of literature devoted to
its effect on bone quality can only be attributed to the assumption that evaluating changes in
the mineral phase of bone is of more use in fracture prediction [77]. It is widely accepted that
bone strength and stiffness can be ascribed primarily to its mineral content. However,
collagen’s role in increasing bone toughness is gaining more prominence as the changes
brought on by osteoporosis and other disorders are known to affect the bone organic matrix
[76-78].
The mechanical testing of bone provides a number of parameters that provide measures of
the structural integrity of bone. Bone strength depends upon both macro- and
microarchitectural characteristics. The primary macroarchitectural components are bone
length, diameter and cortical thickness. Additionally, the cross-sectional shape and
distribution of bone mass within this cross-section are important [79]. At the
microarchitectural level, fiber and crystal alignment along with trabecular spacing,
connectivity, and alignment are the important components that determine bone strength
[80,81].
In normal loading conditions, bones are subjected to either bending, torsion, compression or
tension forces and often a combination [82]. Trabecular and cortical bone will have different
responses to different forces. For example, trabecular bone is stronger in compression than in
bending due to the structural arrangement of struts, which provide higher axial strength [82].
In mechanical testing, a bone is loaded at a specified rate until failure. The deformation of the
bone can be plotted as a function of load, which provides a failure deformation curve (Figure
1.5). From such a curve, we can derive information including failure load, failure
displacement, stiffness and energy to failure. These are subsequently combined with bone-
specific geometric parameters to obtain a stress-strain curve. This provides material
parameters including failure stress (strength), failure strain, normalized energy to failure
(toughness) and the elastic modulus (rigidity) [83] (Figure 1.6).
The ultimate load represents the maximum force applied to the specimen, while failure load
represents the force at which the specimen actually failed or fractured. For a given bone

15
sample, the ultimate and failure loads are often equivalent. The failure displacement
represents the maximum deformation achieved prior to fracture and is related to the ductility
of the specimen. The slope of the linear region of this curve is termed the extrinsic stiffness
or rigidity of the specimen. Stiffness represents elastic behaviour, meaning that the specimen
will return to its original shape if a load is applied and removed within this region. The
transition from the elastic region to the plastic region is noted by the yield point. Finally, the
area under the load-displacement curve up to the point of failure is termed the energy to
failure and represents the amount of energy required to cause failure.
To eliminate effects caused by geometric or size-dependent differences between specimens,
it is necessary to normalize the load-displacement curve. Following normalization, the
ultimate and failure load are represented by the ultimate and failure strength, respectively.
Failure displacement is represented by failure percent strain. The slope of the linear region is
termed the elastic or Young’s modulus and is a measure of the intrinsic stiffness of the
material. The yield point is defined as the intersection point between the stress-strain curve at
a line drawn parallel to the linear portion of the stress-strain curve and offset by 0.2% strain
[83]. Finally, the area under the stress-strain curve is termed “measure of toughness” or
simply “toughness”, which also represents the amount of energy required to cause failure per
unit volume of bone.
Figure 1.5: Ideal load-displacement curve.
Displacement (mm)
Loa
d (N
)
Stiffness (N/mm)
Yield Point
Failure Load (N)
Failure Displacement (mm)
Energy to Failure (mJ)
Ultimate Load (N)

16
Figure 1.6: Ideal stress-strain curve.
1.4. Fatigue
Fatigue is a common cause of failure in metals as well as other materials. It is the progressive
and permanent structural damage caused by repetitive loading at a load under the materials
yield strength. The material strength is decreased, allowing failure to occur at a lower stress
than normal [84]. Initially, there is some plastic deformation that occurs, followed by
microcrack formation, microcrack coalescence and final failure. Crack initiation is highly
dependent on surface defects and stress concentrators. A critical parameter in fatigue testing
is the fatigue life of the material, which is determined by creating a curve of stress vs.
number of cycles or S/N curve (Figure 1.7). This curve can be obtained by performing cyclic
tests until fracture of numerous samples at various stress levels. The stress level at which the
sample fractures is recorded and plotted against the log number of cycles it took to fracture.
For some materials, there exists a fatigue endurance limit, which is a stress level below
which no failure will occur. For these materials, a fatigue endurance limit can be defined as
the stress level at 106 cycles [11,85].
Percent Strain (%)
Stre
ss (M
Pa)
Elastic Modulus (MPa)
Ultimate Stress (MPa)
Failure Strength
(MPa)
Failure Percent Strain (%)
“Toughness” (J/mm3)
Yield Point

17
Number of Cycles to Failure (N)
Stre
ss (M
Pa)
Figure 1.7: Schematic diagram of stress versus number of cycles to failure curve.
1.4.1. Bone fatigue
Although any bone will fracture if exposed to excessive forces, fragility fractures result from
minor or negligible trauma. Cyclic loading, which compromises the mechanical integrity of
the bone, may also induce stress fractures [86]. Fatigue is the accumulated damage that
results from cyclic loading at physiological stresses and strains [87]. Bone fatigue induces a
reduction in stiffness that could lead to fragility and fracture [88]. It is well known that
loading of the bone introduces small amounts of microdamage, which triggers a balanced
remodeling cycle in healthy bone [89-91]. This remodeling allows bone to remove old,
damaged bone and replace it with new, healthy bone. It has been suggested that microdamage
to the bone triggers a positive feedback mechanism: microdamage in bone acts as a stimulus
for bone remodeling and remodeling repairs microdamage [92]. However, during fatigue
damage, the remodeling cycle is stimulated, but cannot repair all of the damage caused by
fatigue. Little is known about the difference between the balanced repair response and the
remodeling response to repair microdamage in bone, which can cause failure.
Bone adapts its mass, architecture and mechanical properties in response to mechanical
loading. While bone is protective against impact, bone is also susceptible to fatigue, a
Fatigue endurance limit
18
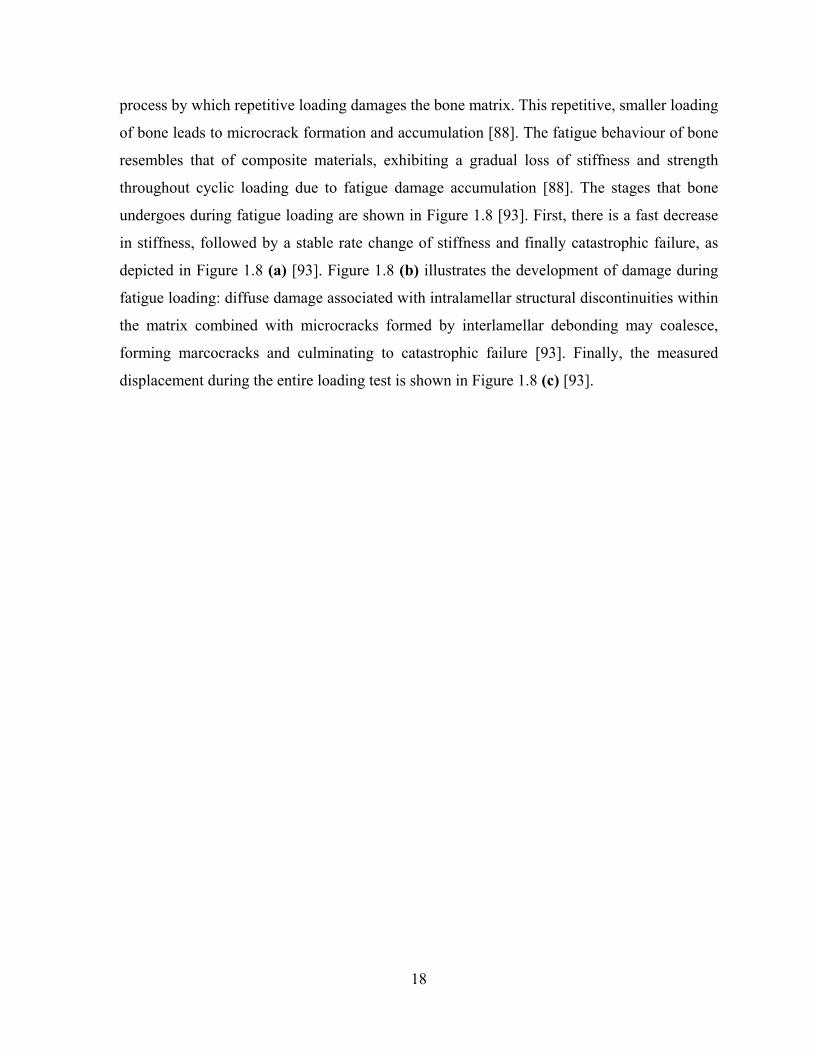
process by which repetitive loading damages the bone matrix. This repetitive, smaller loading
of bone leads to microcrack formation and accumulation [88]. The fatigue behaviour of bone
resembles that of composite materials, exhibiting a gradual loss of stiffness and strength
throughout cyclic loading due to fatigue damage accumulation [88]. The stages that bone
undergoes during fatigue loading are shown in Figure 1.8 [93]. First, there is a fast decrease
in stiffness, followed by a stable rate change of stiffness and finally catastrophic failure, as
depicted in Figure 1.8 (a) [93]. Figure 1.8 (b) illustrates the development of damage during
fatigue loading: diffuse damage associated with intralamellar structural discontinuities within
the matrix combined with microcracks formed by interlamellar debonding may coalesce,
forming marcocracks and culminating to catastrophic failure [93]. Finally, the measured
displacement during the entire loading test is shown in Figure 1.8 (c) [93].

19
Figure 1.8: Schematic diagram of the stages of fatigue in bone: (a) showing the stages of fatigue; (b) schematic of the damage to the bone; (c) change in the bone compliance [93].
The fatigue life is a function of crack initiation and crack propagation. Materials where
cracks are easily initiated but difficult to grow often show greater resistance to fatigue failure
as opposed to materials where crack initiation is slow, but propagation is quick [94]. Bone
can be compared to a composite material where discontinuities in the material may provide
stress concentrations. Stress concentrations are prime sights for crack initiation.
Discontinuities in osteonal bone appear in the form of fibers, lamellae and pores and may
provide stress concentration sites for crack initiation [95]. Microcracks seem to develop in
the interstitial regions of bone and stop at the osteonal boundary [96]. It has been suggested
that 80-90% of all microcracks in cortical bone are found in the interstitial bone between
osteons [97].
a)
b)
c)

20
1.4.2. Bone creep strain
Bone accumulates damage over time and eventually fails below its strength. When there is
time-evolving damage, creep rupture may occur. Creep is the gradual increase in material
strain over time at a constant stress [98]. Bones not only undergo cyclic loading but also
constant stress such as standing for a period of time. Therefore, cyclic loading cannot be
studied exclusively since there is an interaction between fatigue and creep. Creep is a known
characteristic of materials such as polymers [98]. In bone, collagen is abundant and displays
polymeric properties [93]. It has been suggested that the collagen component of bone is
responsible for its observed creep behaviour [99,100]. Since collagen plays a major role in
bone biomechanics [61,76,77], it is important to identify the role(s) that collagen may have in
fatigue fractures.
1.5. Bone Toughening Mechanisms
Bone has several crack-stopping (toughening) mechanisms, such as fiber bridging, crack
deflection and microcracks that deflect, slow or stop crack propagation and increase the
resistance to fracture and ultimately failure (Figure 1.9) [101-104]. Collagen fibrils can act as
a toughening mechanism, whereby intact fibers bridge a crack and oppose crack opening
[101,103]. Similarly, uncracked ligaments may serve to bridge opposing sides of a crack,
consequently blunting further crack propagation along the crack path, a phenomenon known
as ‘crack bridging’ [105,106]. Cement lines and interlamellar boundaries are believed to
provide weak interfaces capable of crack deflection, thereby prolonging the crack
propagation path and accordingly increasing bone toughness [101,107,108]. Finally, Nyman
and his group reviewed the crack tip shielding mechanism in which accumulation of damage
in front of the crack acts as a crack-stopping mechanism [15]. They suggest that when
microdamage coalesces, it forms a propagating crack (mother crack). This linear crack
accelerates but as it does this, microdamage (daughter cracks) forms at the tip in order to
absorb the increased energy. As a result, crack propagation decreases but this is only
temporary since the accumulation of microdamage eventually initiates the process again.
Therefore, microdamage from microcracking works through crack-tip shielding [101].

21
Microcracking Uncrackedligament bridging
Crack bridging Crack deflection
(a) (b)
(c) (d) Figure 1.9: Schematic diagram of bone toughening mechanisms: (a) microcracking; (b) uncracked ligament bridging; (c) crack bridging by collagen fibers and (d) crack deflection by osteons [109].
1.6. Tools for Fracture Risk Assessment
The nature of mechanical tests does not permit their use in vivo to assess bone quality, as a
result, surrogate methods of predicting the mechanical properties of bone have been
developed. Two of the most common methods of fracture prediction are Dual Energy X-ray
Absorptiometry (DXA) and Quantitative Ultrasound (QUS). Both DXA and QUS have
gained widespread use in clinical practice however, neither technique has demonstrated the
ability to adequately distinguish between fracture and non-fracture populations [110]. These
indirect measurements of fracture risk are only two of many contributors to bone strength and
fracture risk. Bone strength is derived from bone quantity, which consists of density and size
as well as bone quality, which consists of structure, material properties and bone turnover
[111]. Bone fragility depends not only on mineral content but also on matrix properties,
architecture and geometry [111] and therefore evaluating the mineral content of bone alone is
insufficient to predict changes in bone quality [86]. Consequently, an instrument known as
the Mechanical Response Tissue Analyzer (MRTA), which provides a direct measure of a
mechanical property of bone, is being explored as a new tool that may provide a more
effective means of fracture prediction.

22
1.6.1. Dual Energy X-ray Absorptiometry (DXA)
DXA provides a measure of the areal bone mineral density (BMD), reported in g/cm2 by
dividing the measured bone mineral content (BMC) of a specific region by the area of the
region. This differs from a volumetric density in that the region of interest is the two-
dimensional area projected by the object to be analyzed. The instrument itself consists of a
table or flat platform on which the object to be measured is placed, below which an x-ray
source generates an incident beam that passes through the object and is measured by
detectors above [110]. The beam is attenuated by passage through the object and it is this
degree of attenuation that provides the measure of bone mineral density. As is suggested by
the name, the incident beam consists of two energy levels (140 kVp and 70 kVp). Soft tissue
attenuates both energy levels equally, whereas bone mineral attenuates the lower energy
beam to a much greater extent. Thus, by subtracting the profile of the high energy beam from
the low energy beam, regions containing only soft tissue exhibit a nearly zero value.
However, regions containing bone mineral will yield a non-zero value from the subtraction of
the profiles, indicating the presence of bone [110,112].
DXA is currently the standard in bone quality assessment. While it does not directly measure
a mechanical property of bone, studies have shown that BMD values strongly correlate with
fracture risk [113]. However, fracture and non-fracture populations often have significant
overlap in BMD values and changes in fracture risk resulting from therapy are often not
reflected in DXA results [110]. Also, due to the fact that the BMD determined by DXA is an
areal measure, the thickness of bone is not considered, which can result in misleading values
when particularly large bones are measured [110]. The final major disadvantage to DXA
measurement is the requisite radiation dose needed for measurement. While this dose is
relatively small, it does restrict some patients from measurement [113,114].
1.6.2. Quantitative Ultrasound (QUS)
QUS is a more recent development in bone quality assessment. This instrument measures the
speed of sound (SOS) applied axially or transversely through the bone. SOS in bone is not a
mechanical parameter, but it is related to parameters that contribute to mechanical integrity

23
[110,115,116]. The velocity of sound (v) traveling through solid matter can be related to the
modulus of elasticity using the following equation:
E = ρv2
where E is the modulus of elasticity and ρ is the volumetric material density. This
relationship holds for sound traveling through bone:
E = ρ*SOS2
A hand-held probe containing two piezoelectric transducers is placed on the measurement
site and is put into acoustic contact with the site through ultrasound gel. A high frequency
(1.25 MHz) acoustic signal is generated at one transducer and is received at the opposing
transducer. Since the distance between the transducers is known and fixed, the SOS can be
computed. The signal is known to travel by the fastest possible means, which indicates that
the sound will travel through cortical bone as opposed to the overlying soft tissue or
trabecular bone. Proprietary software from the manufacturers of these instruments claims to
eliminate the effects of the surrounding tissues [110,112]. QUS data has been claimed to be a
predictor of bone strength however, in clinical practice, this device is more commonly used
as a pre-screening tool [110].
1.6.3. Mechanical Response Tissue Analyzer (MRTA)
The MRTA is a radiation-free, non-invasive instrument developed by NASA to investigate
the effects of space travel on astronaut bones [110,117]. Unlike DXA and QUS, it directly
measures a bone mechanical property, the cross-sectional bending stiffness (EI) of long
bones. EI is the product of the elastic modulus, E, and the areal cross sectional moment of
inertia, I [110,117]. This is done by placing the bone in a three-point bending configuration
and applying a low frequency (0 to 1600 Hz) vibration to the skin surface (which is
transmitted to the bone) using an electromagnetic shaker with an impedance head probe
(Figure 1.10). A transducer on the probe measures the force and acceleration response from
the bone, which are used to calculate EI. The cross-sectional bending stiffness of a long bone
with the load (F) applied to the midspan can be calculated using the following equation:

24
where k is the lateral stiffness of a beam in three-point bending, δmax is the maximum bending
displacement and L is the length of the long bone.
Probe Shaker
Impedance Head
Figure 1.10: MRTA setup for an ulna measurement [110].
More specifically, the basic components of the MRTA are the mechanical shaker, the
impedance head, the contact probe, the system control and measurement software and the
analysis software. The mechanical shaker, impedance head and contact probe are connected
in series with the shaker physically driving the impedance head-probe with a randomly
generated frequency from 0 to 1600 Hz, as specified by the controlling software. The
impedance head transmits the dynamic response of the bone (both force and acceleration
data) to the measurement software and the probe (<1 cm2) provides contact with the bone at
the mid-point of either the ulna or tibia. Once contact with the bone is established,
measurements can be taken where each measurement takes approximately five seconds.
Real-time data is converted with Fourier transforms to the frequency domain for analysis. A
software algorithm, developed by Gaitscan and NASA, uses the dynamic response to
calculate the lateral stiffness (k) to solve for EI [110,117].
orLEIFk ,483
max
==δ 48
3kLEI =

25
To evaluate the functional stiffness at the level of the bone and not just the material level,
Young’s modulus is coupled with the cross-sectional moment of inertia (I) to yield the cross-
sectional bending stiffness, EI [83]. The cross-sectional moment of inertia for a
homogeneous material clearly depends upon the simple geometry of the structure, but
heterogeneous materials such as bone are also influenced by the quantity, distribution and
orientation of bone mineral and collagen fibers around the bending axis [80]. The effective
stiffness of bone is also influenced by trabecular connectivity, alignment and number, as well
as the alignment of bone mineral and collagen fibers. These complex factors are difficult, if
even possible to quantify with non-invasive measures, so the ability to directly measure the
cross-sectional bending stiffness (EI) avoids this problem.
Two major issues can complicate MRTA assessment of bone quality. Firstly, the overlying
skin and soft tissue can partially absorb the applied vibration before it is transmitted to the
bone and the muscle also serves to dampen the response of bone to the vibration. These
effects must be accounted for in the software that evaluates the data received by the probe
[110]. Secondly, the mathematical model used in the calculation of EI, models the bone as a
uniform cylinder. Therefore, measurements with the MRTA are limited to the human ulna
and tibia. This assumption is often not valid for long bones that exhibit curvature.
Research has shown that EI of a long bone is predictive of the maximum strength of the bone
[117] thus, measurements of EI can be used to assess bone quality. Furthermore, previous
studies suggest that the determination of EI has the potential to effectively evaluate fracture
risk [117-119]. Studies have demonstrated the ability of the MRTA to detect EI differences
between various populations including exercise [120,121], disease states [122,123] and age
[124]. The effectiveness of the MRTA in predicting fractures has not as of yet, been
evaluated, but the fact that it provides a direct measure of the extrinsic stiffness of bone may
permit it to provide more accurate fracture prediction [110]. Establishing the MRTA as a
clinical tool to replace DXA or QUS is not the goal of this study, but the justification for its
inclusion in this study is its strength as a research tool.

26
1.7. Animal Models – Emu
Due to the difficulty in obtaining human samples at various stages of disease for analysis,
animal models are widespread in biomedical research. The biomechanical tests chosen often
dictate what animal model can be used [82]. In this investigation, the need for a bone sample
of suitable size for analysis by the MRTA restricted the available options for animal models.
Traditional models such as mice, rats, rabbits and dogs are too small to provide such bones
and so the emu (Dromaeus novaehollandie) was selected as a model. The emu is a large,
ostrich-like animal weighing approximately 50-60 kg once mature [125-127]. The tibia of the
emu is of particular interest as their size and approximate cylindrical shape are similar to
human long bones. Emu tibiae are also large enough to be assessed by the MRTA.
Furthermore, sexual dimorphism is apparent in emus where females are notably heavier and
larger compared to males [126]. Finally, even though female emus lay down eggs, it is the
male emus that carry out the 8-week incubation period [128]. These dimorphisms can be
used to evaluate differences between female and male bones. Emu tibiae may also be a
suitable model for human long leg bones as the bipedal nature of emus is analogous to human
locomotion. Lastly, emus are available from slaughterhouses and farms in Ontario due to the
demand for their meat. These factors together, promote the continued characterization of this
animal model for further study in bone research.
1.8. Objectives
The overall goal of this study is to evaluate the consequences of collagen degradation on the
mechanical and fatigue properties of female and male bone, using an emu model. This will
be achieved by endocortically treating emu tibiae with 1 M potassium hydroxide (KOH) for
various time periods. KOH was chosen as the degradation agent as it has been used
previously to affect collagen [68] as well as bone tissue [65-67] and does not require a
demineralization step. In addition, the need for a rapid and cost effective protocol on whole
emu bone samples that would alter bone collagen endocortically and still allow for
mechanical testing thereafter, further supported the use of KOH as a collagen degradation
agent. While this treatment is not physiological, it is a necessary step to understand the
mechanisms by which collagen degradation affects bone mechanical properties. This study
will also test the MRTA as a potential research tool for the assessment of bone quality of

27
both fatigued and treated bone. To accomplish this overall goal, the study can be divided into
five objectives:
1) To investigate the role of collagen on female and male emu bone mechanical
properties and to assess if DXA, QUS and MRTA can detect these changes.
2) To investigate the role of collagen on the fatigue resistance of female and male emu
bone and to assess if DXA, QUS and MRTA can detect these changes.
3) To determine the failure mechanisms of emu bone.
4) To determine the extent of collagen degradation and evaluation of bone mineral.
5) To investigate the mineral-organic matrix interface.
At the conclusion of each objective, journal articles were published or submitted for review
which outlined the experimental work and results of each objective. This thesis is a
culmination of these different journal articles, which highlight the main findings.
1.9. Hypothesis
We anticipate that KOH treated emu bones will have reduced mechanical properties and a
lower resistance to fatigue compared to untreated bones and that collagen degradation and/or
mineral-organic matrix interface alteration will be the underlying mechanisms. It is important
to also note that the endocortical KOH treatment will leave the specimens intact and will
result in an inner ring zone where collagen is significantly affected with less disruption as the
distance from the medullary canal increases. This will result in structurally heterogeneous
cross-sections. Thus, KOH treatment will create a gradient of degradation where the
mechanical properties on the inside will be different than the rest of the bone. Furthermore,
we hypothesize that the changes in mechanical and fatigue properties will be more
pronounced in male emu tibiae compared to female emu tibiae due to sexual dimorphism.
28
1.10. References
[1] Jee WSS. (2001) Integrated Bone Tissue Physiology. In: Cowin SC, editor. Bone Mechanics Handbook. CRC Press. Florida. pp. 1-68.
[2] Rho JY, Kuhn-Spearing L, Zioupos P. (1998) Mechanical properties and the hierarchical
structure of bone. Med.Eng.Phys. 20:92-102. [3] Currey JD, Brear K, Zioupos P. (1996) The effects of ageing and changes in mineral content
in degrading the toughness of human femora. J.Biomech. 29:257-260. [4] Li X, Agrawal M, Wang X. (2003) Age dependence of in situ thermostability of collagen in
human bone. Calcif.Tissue.Int. 72:513-518. [5] Bundy KJ. (1985) Determination of mineral-organic bonding effectiveness in bone--
theoretical considerations. Ann.Biomed.Eng. 13:119-35. [6] Walsh WR, Ohno M, Guzelsu N. (1994) Bone composite behaviour: effects of mineral-
organic bonding. J.Mater.Sci.Mater.Med. 5:72-9. [7] Kotha SP, Guzelsu N. (2000) The effects of interphase and bonding on the elastic modulus of
bone: changes with age-related osteoporosis. Med.Eng.Phys. 22:575-85. [8] Gupta HS, Fratzl P, Kerschnitzki M, Benecke G, Wagermaier W, Kirchner HO. (2007)
Evidence for an elementary process in bone plasticity with an activation enthalpy of 1 eV. J.R.Soc.Interface. 4:277-82.
[9] Fratzl P, Gupta HS, Paschalis EP, Roschger P. (2004) Structure and mechanical quality of the
collagen-mineral nano-composite in bone. J.Mater.Chem. 14:2115-2123. [10] Hellmich C, Barthelemy JF, Dormieux L. (2004) Mineral-collagen interactions in elasticity of
bone ultrastructure – a continuum micromechanics approach Eur.J.Mech.A.Solids. 23:783-810.
[11] Currey JD. (1984) The mechanical adaptation of bones. Princeton University Press. New
Jersey. pp. 80-85. [12] Kaplan FS, Hayes WC, Keaveny TM, Boskey A, Einhorn TA Iannotti JP. (1994) Form and
Function of Bone. In: Simon SR, editor. Orthopaedic Basic Science. American Academy of Orthopaedic Surgeons. pp. 127-184.
[13] Weiner S, Traub W. (1992) Bone structure: from angstroms to microns. Faseb.J. 6:879-885. [14] Boskey A. (2003) Bone mineral crystal size. Osteoporos.Int. 14:S16-S21. [15] Nyman JS, Reyes M, Wang X. (2005) Effect of ultrastructural changes on the toughness of
bone. Micron. 36:566-582. [16] Wang X, TeKoppele JM, Athanasiou KA. (2000) Effect of collagen denaturation on the
toughness of bone. Clin.Orthop.Relat.Res. 371:228-239.
29
[17] Woessner JF Jr. (1976) Determination of hydroxyproline in connective tissues. In: Hall D, editor. The methodology of connective tissue research. Joynson-Bruvvers Ltd. Oxford. pp. 227-233.
[18] Miller EJ. (1984) Chemistry of the collagens and their distribution. In: Piez K, Reddi A,
editors. Extracellular Matrix Biochemistry. Elsevier. New York. pp. 40-81. [19] Burjanadze TV, Veis A. (1997) A thermodynamic analysis of the contribution of
hydroxyproline to the structural stability of the collagen triple helix. Connect.Tissue.Res. 36:347-365.
[20] Knott L, Bailey AJ. (1998) Collagen cross-links in mineralizing tissues: a review of their
chemistry, function, and clinical relevance. Bone. 22:181-187. [21] Bailey AJ, Paul RG, Knott L. (1998) Mechanisms of maturation and ageing of collagen.
Mech.Age.Dev. 106:1-56. [22] Eyre DR, Wu JJ. (2005) Collagen cross-links. Top.Curr.Chem. 247:207-229. [23] Siegmund T, Allen MR, Burr DB. (2008) Failure of mineralized collagen fibrils: Modeling
the role of collagen cross-linking. J.Biomech. 41:1427-1435. [24] Glimcher MJ. (2006) Bone: Nature of the calcium phosphate crystals and cellular, structural,
and physical chemical mechanisms in their formation. Rev.Min.Geo. 64:223-282. [25] Viguet-Carrin S, Garnero P, Delmas PD. (2006) The role of collagen in bone strength.
Osteoporos.Int. 17:319-336. [26] Smith LT, Wertelecki W, Milstone LM, Petty EM, Seashore MR, Braverman IM, Jenkins
TG, Byers PH. (1992) Human dermatosparaxis: a form of Ehlers-Danlos syndrome that results from failure to remove the amino terminal propeptide of type I procollagen. Am.J.Hum.Genet. 51:235-244.
[27] Roach HI. (1994) Why does bone matrix contain non-collagenous proteins? The possible
roles of osteocalcin, osteonectin, osteopontin and bone sialoprotein in bone mineralisation and resorption. Cell.Biol.Int. 18:617-628.
[28] Triffitt JT, Own MO. (1977) Preliminary studies on the binding of plasma albumin to bone
tissue. Calcif.Tissue.Res. 23:303-305. [29] Boskey AL. (1992) Mineral-matrix interactions in bone and cartilage. Clin.Orthop.Relat.Res.
281:244-274. [30] Butler WT. (1989) The nature and significance of osteopontin. Connect.Tissue.Res. 23:123-
136. [31] Termine JD, Kleinman HK, Whitson SW, Conn KM, McGarvey ML, Martin GR. (1981)
Osteonectin, a bone-specific protein linking mineral to collagen. Cell. 26:99-105. [32] Romberg RW, Werness PG, Riggs BL, Mann KG. (1986) Inhibition of hydroxyapatite crystal
growth by bone-specific and other calcium-binding proteins. Biochem. 25:1176-1180.

30
[33] Ducy P, Desbois C, Boyce B, Pinero G, Story B, Dunstan C, Smith E, Bonadio J, Goldstein S, Gundberg C, Bradley A, Karsenty G. (1996) Increased bone formation in osteocalcin-deficient mice. Nature. 382:448-452.
[34] George A, Veis A. (2008) Phosphorylated proteins and control over apatite nucleation, crystal
growth, and inhibition. Chem.Rev. 108:4670-4693. [35] Fujisawa R, Nodasaka Y, Kuboki Y. (1995) Further characterization of interaction between
bone sialoprotein (BSP) and collagen. Calcif.Tissue.Int. 56:140-144. [36] Tye CE, Hunter GK, Goldberg HA. (2005) Identification of the type I collagen-binding
domain of bone sialoprotein and characterization of the mechanism of interaction. J.Biol.Chem. 280:13487-13492.
[37] Gundberg CM. (2003) Matrix proteins. Osteoporos.Int. 14:S37-S42. [38] Hunter GK, Goldberg HA. (1993) Nucleation of hydroxyapatite by bone sialoprotein.
Proc.Natl.Acad.Sci.USA. 90:8562-8565. [39] Goldberg HA, Hunter GK. (1995) The inhibitory activity of osteopontin on hydroxyapatite
formation in vitro. Ann.NY.Acad.Sci. 760:305-308. [40] Raif EM, Harmand MF. (1993) Molecular interface characterization in human bone matrix. I.
Biochemical and IR spectroscopic studies. Biomater. 14:978-984. [41] Wilson EE, Awonusi A, Morris MD, Kohn DH, Tecklenburg M, Beck LW. (2005) Highly
ordered interstitial water observed in bone by nuclear magnetic resonance. J.Bone.Min.Res. 20:625-634.
[42] Suzuki Y, Someki I, Asachi E, Irie S, Hattori S. (1999) Interaction of collagen molecules
from the aspect of fibril formation: acid-soluble, alkali-treated, and MMP1-digested fragments of Type I collagen. J.Biochem. 126:54-67.
[43] Steiner T. (2002) The hydrogen bond in the solid state. Angew.Chem.Int.Ed.Engl. 41:48-76. [44] Posner AS. (1985) The structure of bone apatite surfaces. J.Biomed.Mater.Res. 19:241-250. [45] Pearce EIF. (1981) Ion displacement following the adsorption of anionic macromolecules on
hydroxyapatite. Calcif.Tissue.Int. 33:395-402. [46] Walsh WR, Guzelsu N. (1994) Compressive properties of cortical bone: mineral-organic
interfacial bonding. Biomater. 15:137-145. [47] Posner AS. (1969) Crystal chemistry of bone mineral. Phys.Rev. 49:760-792. [48] Glimcher MJ. (1959) Molecular biology of mineralized tissues with particular references to
bone. Rev.Mod.Phys. 31:359-393. [49] Anderson HC. (1995) Molecular biology of matrix vesicles. Clin.Orthop.Relat.Res. 314:266-
280.0
31
[50] Boskey AL. (1996) Matrix proteins and mineralization: overview. Connect.Tissue.Res. 35:357-363.
[51] Traub W, Jodaikin A, Arad T, Veis A, Sabsay B. (1992) Dentin phosphophoryn binding to
collagen fibrils. Matrix. 12:197-201. [52] Glimcher MJ. (1984) Recent studies of the mineral phase in bone and its possible linkage to
the organic matrix by protein-bound phosphate bonds. Philos.Trans.R.Soc.Lon.(Biol). 304:479-506.
[53] Siperko LM, Landis WJ. (2001) Aspects of mineral structure in normally calcifying avian
tendon. J.Struct.Biol. 135:313-320. [54] Elliott SR, Robinson RA. (1957) The water content of bone. I. The mass of water, inorganic
crystals, organic matrix, and CO2 space components in a unit volume of the dog bone. J.Bone.Joint.Surg.Am. 39:167-188.
[55] Hodge AJ, Petruska JA. (1963) Recent studies with the electron microscope on ordered
aggregates of the tropocollagen molecule. In: Ramachandran GN, editor. Aspects of Protein Structure. Academic Press. London. pp. 289-300.
[56] Landis WJ, Song MF, Leith A, McEwen L, McEwen BF. (1993) Mineral and organic matrix
interaction in normally calcifying tendon visualized in three dimensions by high-voltage electron microscopic tomography and graphic image reconstruction. J.Struct.Biol. 110:39-54.
[57] Arsenault AL. (1988) Crystal-collagen relationships in calcified turkey leg tendons visualized
by selected-area dark field electron microscopy. Calcif.Tissue.Int. 43:202-212. [58] Landis WJ. Hodgens KJ, Song MJ, Arena J, Kiyonaga S, Marko M, Owen C, McEwen BF.
(1996b) Mineralization of collagen may occur on fibril surfaces: Evidence from conventional and high voltage electron microscopy and three-dimensional imaging. J.Struct.Biol. 117:24-35.
[59] Erikson EF, Axelrod DW, Melson F. (1994) Bone Histomorphometry. New York: Raven
Press. [60] Jepsen KJ, Goldstein SA, Kuhn JL, Schaffler MB, Bonadio J. (1996) Type-I collagen
mutation compromises the post-yield behavior of Mov13 long bone. J.Orthop.Res. 14:493-499.
[61] Oxlund H, Barckman M, Ortoft G, Andreassen TT. (1995) Reduced concentrations of
collagen cross-links are associated with reduced strength of bone. Bone. 17:365S-371S. [62] Wang X, Li X, Bank RA, Agrawal CM. (2002) Effects of collagen unwinding and cleavage
on the mechanical integrity of the collagen network in bone. Calcif.Tissue.Int. 71:186-192. [63] Lohler J, Timpl R, Jaenish R. (1984) Embryonic lethal mutation in mouse collagen I gene
causes rupture of blood vessels and is associated with erythropoietic and mesenchymal cell death. Cell. 38:597-607.

32
[64] Brady JD, Robins SP. (2001) Structural characterization of pyrrolic cross-links in collagen using a biotinylated ehrlich’s reagent. J.Biol.Chem. 276:18812-18818.
[65] Arsenault AL. (1990) Vascular canals in bovine cortical bone studied by corrosion casting.
Calcif.Tissue.Int. 47:320-325. [66] Lin TC, Su CY, Chang CS. (1997) Stereomorphologic observation of bone tissue response to
hydroxyapatite using SEM with the EDTA-KOH method. J.Bone.Miner.Res. 36:91-97. [67] Abe K, Hashizume H, Ushiki T. (1992) An EDTA-KOH method to expose bone cells for
scanning electron microscopy. J.Electron.Microsc.(Tokyo). 41:113-115. [68] Privalova LG, Konstantinova ML, Kulagin VN, Zaikov GY, Sorokin YY, Dreizenshtok GS.
(1980) Kinetic regularities of the degradation of collagen in dilute solutions of sulphuric acid and potassium hydroxide. Pol.Sci. 22:2583-2590.
[69] Carter DH, Scully AJ, Heaton DA, Young MP, Aaron JE. (2002) Effect of deproteination on
bone mineral morphology: implications for biomaterials and aging. Bone. 31:389-395. [70] Broz JJ, Simske SJ, Corley WD, Greenberg AR. (1997) Effects of deproteinization and
ashing on site-specific properties of cortical bone. J.Mater.Sci.Mater.Med. 8:395-401. [71] Termine JD, Eanes ED, Greenfie DJ, Nylen MU, Harper RA. (1973) Hydrazine-
deproteinated bone mineral: Physical and chemical properties. Calcif.Tissue.Res. 12:73-90. [72] Bertazzo S, Bertran CA. (2008) Effect of hydrazine deproteination on bone mineral phase: A
critical review. J.Inorg.Biochem. 102:137-145. [73] Kim HM, Rey C, Glimcher MJ. (1995) Isolation of calcium-phosphate crystals of bone by
non-aqueous methods at low temperature. J.Bone.Miner.Res. 10:1589-1601. [74] Johnson GS, Mucalo MR, Lorier MA. (2000) The processing and characterization of animal-
derived bone to yield materials with biomedical applications Part 1: Modifiable porous implants from bovine condyle cancellous bone and characterization of bone materials as a function of processing. J.Mat.Sci.Mat.Med. 11:427-441.
[75] Guzelsu N, Walsh WR. (1990) Streaming potential of intact wet bone. J.Biomech. 23673-
685. [76] Wang X, Shen X, Li X, Agrawal CM. (2002) Age-related changes in the collagen network
and toughness of bone. Bone. 31:1-7. [77] Zioupos P, Currey JD, Hamer AJ. (1999) The role of collagen in the declining mechanical
properties of aging human cortical bone. J.Biomed.Mater.Res. 45:108-116. [78] Turner CH. (2006) Bone strength: current concepts. Ann.NY.Acad.Sci. 1068:429-446. [79] Martin RB. (1991) Determinants of the mechanical properties of bones. J.Biomech. 24:79-88. [80] Martin RB, Ishida J. (1989) The relative effects of collagen fiber orientation, porosity,
density, and mineralization on bone strength J.Biomech. 22:419-26.

33
[81] Turner CH., Forwood MR, Rho JY, Yoshikawa T. (1994) Mechanical loading thresholds for lamellar and woven bone formation. J.Bone.Miner.Res. 9:87.
[82] Turner CH, Burr DB. (2001) Experimental Techniques for Bone Mechanics. In: Cowin SC,
editor. Bone Mechanics Handbook. CRC Press. Florida. pp. 1-35. [83] Turner CH, Burr DB. (1993) Basic biomechanical measurements of bone: a tutorial. Bone.
14:595-608. [84] Fine M, Chung Y. Fatigue Fracture in Metals. ASTM Handbook Vol. 19 Fatigue and
Fracture. [85] Hastings A, Gibson LJ, Moore TLA, Cheng DW, Guo XE. (2004) Endurance limit for bovine
trabecular bone. In: Proceedings of the 50th annual meeting of the Orthopaedic Research Society. 29:34. San Francisco. CA. March 7-10.
[86] Burr DB. (2002) The contribution of the organic matrix to bone's material properties. Bone.
31:8-11. [87] Burr DB, Forwood MR, Fyhrie DP, Martin RB, Schaffler MB, Turner CH. (1997) Bone
microdamage and skeletal fragility in osteoporotic and stress fractures. J.Bone.Miner.Res. 12:6-15.
[88] Lee T.C., O'Brien F.J., Taylor D. (2000) The nature of fatigue damage in bone. Int.J.Fat.
22:847-853. [89] Pattin CA, Caler WE, Carter DR. (1996) Cyclic mechanical property degradation during
fatigue loading of cortical bone. J.Biomech. 29:69-79. [90] Hsieh YF, Silva MJ. (2002) In vivo fatigue loading of the rat ulna induces both bone
formation and resorption and leads to time-related changes in bone mechanical properties and density. J.Orthop.Res. 20:764-771.
[91] Mori S, Burr DB. (1993) Increased intracortical remodeling following fatigue damage. Bone.
14:103-109. [92] Lee TC, Staines A, Taylor D. (2002) Bone adaptation to load: microdamage as a stimulus for
bone remodelling. J.Anat. 201:437-446. [93] Tami AE, Nasser P, Schaffler MB, Knothe Tate ML. (2003) Noninvasive fatigue fracture
model of the rat ulna. J.Orthop.Res. 21:1018-1024. [94] Schaffler MB, Choi K, Milgrom C. (1995) Aging and matrix microdamage accumulation in
human compact bone. Bone. 17:521-525. [95] Jepsen KJ, Davy DT, Krzypow DJ. (1999) The role of the lamellar interface during torsional
yielding of human cortical bone. J.Biomech. 32:303-310. [96] Schaffler MB, Choi K, Milgrom C. (1994a) Microcracks and aging in human femoral
compact bone. Proc.Orthopae.Res.Soc. 19:190.

34
[97] Park HC, Lakes RS. (1986) Cosserat micromechanics of human bone – strain redistribution by a hydration sensitive constituent. J.Biomech. 19:386-397.
[98] Callister WD. (2003) Materials Science and Engineering: An Introduction. John Wiley &
Sons, New York. [99] Bowman SM, Gibson LJ, Hayes WC, McMahon TA. (1999) Results from demineralized
bone creep tests suggest that collagen is responsible for the creep behavior of bone. J.Biomech.Eng. 121:253-258.
[100] Fois M, Lamure R, Fauran MJ, Lacabanne C. (1998) Viscoelastic properties of human bone.
J.Biomech. 31:2. [101] Nalla RK, Kinney JH, Ritchie RO. (2003) Mechanistic fracture criteria for the failure of
human cortical bone. Nat.Mater. 2:164-168. [102] Zioupos P, Currey JD, Mirza MS, Barton DC. (1995) Experimentally determined
microcracking around a circular hole in a flat plat of bone: comparison with predicted stresses. Philos.Trans.R.Soc.Lond.B.Biol.Sci. 347:383-396.
[103] Yeni YN, Norman TL. (2000) Fracture toughness of human femoral neck effect of
microstructure, composition and age. Bone. 26:499-504. [104] Yan , Mecholsky Jr. JJ, Clifton KB. (2007) How tough is bone? Application of elastic-plastic
fracture mechanisms to bone. Bone. 40:479-484. [105] Vashishth D, Behiri JC, Bonfield W. (1997) Crack growth resistance in cortical bone:
concept of microcrack toughening. J.Biomech. 30:763-769. [106] Vashishth D, Tanner KE, Bonfield W. (2000) Contribution, development and morphology of
microcracking in cortical bone during crack propagation. J.Biomech. 33:1169-1174. [107] Yeni YN, Norman TL. (2000) Calculation of porosity and osteonal cement line effects on the
effective fracture toughness of cortical bone in longitudinal crack growth. J.Biomed.Mater.Res. 51:504-509.
[108] Feng QL, Cui FZ, Pu G, Wang RZ, Li HD. (2000) Crystal orientation toughening
mechanisms and a mimic of nacre. Mat.Sci.Eng.C. 11:19-25. [109] Ritchie RO, Kinney JH, Kruzic JJ, Nalla RK. (2005) A fracture mechanics and mechanistic
approach to failure of cortical bone. Fat.Fract.Engng.Mater.Struct. 28:345-371. [110] Djokoto C, Tomlinson G, Waldman S, Grynpas M, Cheung AM. (2004) Relationship among
MRTA, DXA, and QUS. J.Clin.Densitom. 7:448-456. [111] Cefalu CA. (2004) Is bone mineral density predictive of fracture risk reduction?
Curr.Med.Res.Opin. 20:341-349. [112] Fogelman I, Blake GM. (2000) Different approaches to bone densitometry. J.Nucl.Med.
41:2015-25.

35
[113] Genton L, Hans D, Kyle UG, Pichard C. (2002) Dual energy x-ray absorptiometry and body composition: Differences between devices and comparison with reference methods. Nutrition. 18:66-70.
[114] Bonnick SL, Lewis LA. (2002) Bone densitometry for technologists. Human Press. New
Jersey. [115] Greenfield MA, Craven JD, Huddleston A. Kehrer ML, Wishko D, Stern R. (1981)
Measurement of the velocity of ultrasound in human cortical bone in vivo. Estimation of its potential value in the diagnosis of osteoporosis and metabolic bone disease. Radiology. 138:701-710.
[116] Hodgskinson R, Njeh CF, Currey JD Langton CM. (1997) The ability of ultrasound velocity
to predict the stiffness of cancellous bone in vitro. Bone. 21:183-190. [117] Roberts SG, Hutchinson TM, Arnaud SB, Kiratli BJ, Martin RB, Steele CR. (1996)
Noninvasive determination of bone mechanical properties using vibration response: a refined model and validation in vivo. J.Biomech. 29:91-98.
[118] Hutchinson TM, Bakulin AV, Rakhmanov AS, Martin RB, Steele CR, Arnaud SB. (2001)
Effects of chair restraint on the strength of the tibia in rhesus monkeys. J.Med.Primatol. 30:313-321.
[119] Norrdin RW, Simske SJ, Gaarde S, Schwardt JD, Thrall MA. (1995) Bone changes in
mucopolysaccharidosis VI in cats and the effects of bone marrow transplantation: mechanical testing of long bones. Bone. 17:485-489.
[120] Hutchinson TM, Steele CR, Snow-Harter R, Whalen RT, Marcus R, Arnaud SB. (1994)
Bending stiffnesss in the tibia of healthy men aged 26-51 years. Med.Sci.Sports. 26:S21. [121] Myburgh KH, Charette S, Zhou L, Steele CR, Arnaud S, Marcus R. (1993) Influence of
recreational activity and muscle strength on ulnar bending stiffness in men. Med.Sci.Sports.Exerc. 25:592-596.
[122] Kiebzak GM, Box JH, Box P. (1999) Decreased ulnar bending stiffness in osteoporotic
Caucasian women. J.Clin.Densitom. 2:143-152. [123] Smith SR, Burshell J, Lindberg J, Bober M, Davies MJ. (1994) Adaptation of bone in a
kindred with osteogenesis imperfect. J.Bone.Miner.Res. 9:S424. [124] McCabe F, Zhou LJ, Steele CR, Marcus R. (1991) Noninvasive assessment of ulnar bending
stiffness in women. J.Bone.Miner.Res. 6:53-59. [125] Conzemius MG, Brown TD, Zhang Y, Robinson RA. (2002) A new animal model of femoral
head osteonecrosis: one that progresses to human-like mechanical failure. J.Orthop.Res. 20:303-309.
[126] Maloney SK, Dawson TJ. (1993) Sexual dimorphism in basal metabolism and body
temperature of a large bird, the emu. Condor. 95:1034-1037.

36
[127] Reed KL, Brown TD. (2001) Elastic modulus and strength of emu cortical bone. Iowa.Orthop.J. 21:53-57.
[128] Davies SJJF. (2002) Ratites and Tinamous. Oxford University Press. New York.

37
Chapter 2 Experimental Approach 2.1. Bone Samples
2.2. Potassium Hydroxide (KOH) Treatment
2.3. Statistical Analysis
2.4. References
38
The following chapter outlines the experimental approach and various techniques used to
determine the consequences of collagen degradation on bone mechanical properties.
2.1. Bone Samples
Female and male emu leg bones were obtained from slaughterhouses and farms in Southern
Ontario, Canada. The animals were approximately 3-5 years of age and therefore skeletally
mature [1,2]. The tibiae were carefully separated from the femora and tarsometatarsi with a
scalpel. The shaft of each tibia was isolated by using a circular saw to remove the ends (15%
of the total bone length from the proximal end and 10% from the distal end), resulting in
bone samples 26 to 32 cm in length. The marrow and trabecular bone from the diaphysis of
the tibiae were removed by drilling longitudinally through the bone shaft, after which the
medullary canal was flushed with tap water. Finally, the skin and overlying tissue was
carefully removed with a scalpel.
The prepared bones were then individually wrapped in saline-soaked gauze and frozen at
-20°C for 6-10 months. Research has shown that freezer storage of well-hydrated bone
specimens does not adversely affect mechanical properties [3-5]. In addition, because certain
bones underwent more techniques than others, the number of freeze-thaw cycles may have
slightly varied among samples. Most samples underwent a maximum of three freeze-thaw
cycles. Furthermore, research has shown that the number of freeze-thaw cycles that a bone
experiences does not significantly affect its mechanical properties (after five freeze-thaw
cycles) [6]. Nevertheless, care was taken to minimize these freeze-thaw cycles and thaw the
samples only when necessary. Samples were allowed to thaw at room temperature for three
hours prior to analysis. Computed Tomography (CT) scans were taken at the mid-point of
each emu tibia with an Aquilion 64 CT scanner (Toshiba, Canada). External anterior-
posterior and medial-lateral diameters (mm), cortical thickness (mm), cross-sectional area
(mm2) and second moment of area in bending orientation (mm4) were then measured from
these binarized images using image analysis software (ImageJ 1.28u, National Institutes of
Health).

39
Bones were divided into four groups. The first group (female and male left tibiae) were used
for bone composition analysis and the second group (female and male left tibiae) were KOH
treated for 0, 1, 3, 7 or 14 days and used for Objective 1 (Initial Study). The third and fourth
groups (female and male right tibiae) were KOH treated at the same time points and then
either fatigued to failure or to 100,000 cycles to induce stiffness loss but not failure
(Objective 2 - Fatigue). Histological assessment was performed on basic fuchsin-stained
microdamage samples in the immediate area of the fatigue to failure fractured mid-span
regions. In all four main groups, two additional 14-day groups of ten female and ten male
bones were filled with saline instead of KOH to act as controls. Herein, the 0-day treated
groups will be referred to as untreated groups and the 14-day filled with saline groups will be
noted as control groups. CT scans were taken at the mid-point of each emu tibia before and
after any treatment (KOH, fatigue to induce stiffness loss) to determine any changes in
geometrical parameters.
Table 2.1 shows the sample sizes (n) for each group. One-centimeter wide sections were cut
from various sections in these bone samples for the techniques used in Objectives 3, 4 and 5.
The fracture surfaces were analyzed using digital images and scanning electron microscopy
(SEM) to study failure mechanisms (Objective 3 - Fractography). Bone samples were
evaluated using quantitative backscattered electron (qBSE) imaging, powder X-ray
diffraction (XRD) and microhardness testing in an attempt to help explain the effect of KOH
treatment on bone mineral (Objective 4 – Collagen Degradation). A selective digestion
technique (α-chymotrypsin), differential scanning calorimetry (DSC), sodium dodecyl sulfate
polyacrylamide gel electrophoresis (SDS-PAGE) and polarized light microscopy (PLM)
were utilized to determine the extent of collagen degradation due to KOH treatment
(Objective 4 – Collagen Degradation). Finally, Raman spectroscopy and atomic force
microscopy (AFM) were used in an attempt to characterize the effects of KOH on the bone
mineral-collagen interface (Objective 5 - Interface). Figure 2.1 represents a schematic of
sample retrieval for analysis of the different techniques (blue boxes represent techniques
focusing on bone mineral and red boxes are highlighting techniques used for bone collagen
evaluation). A flow chart of the experimental techniques performed are summarized in Table
2.2 and shown in Figure 2.2.
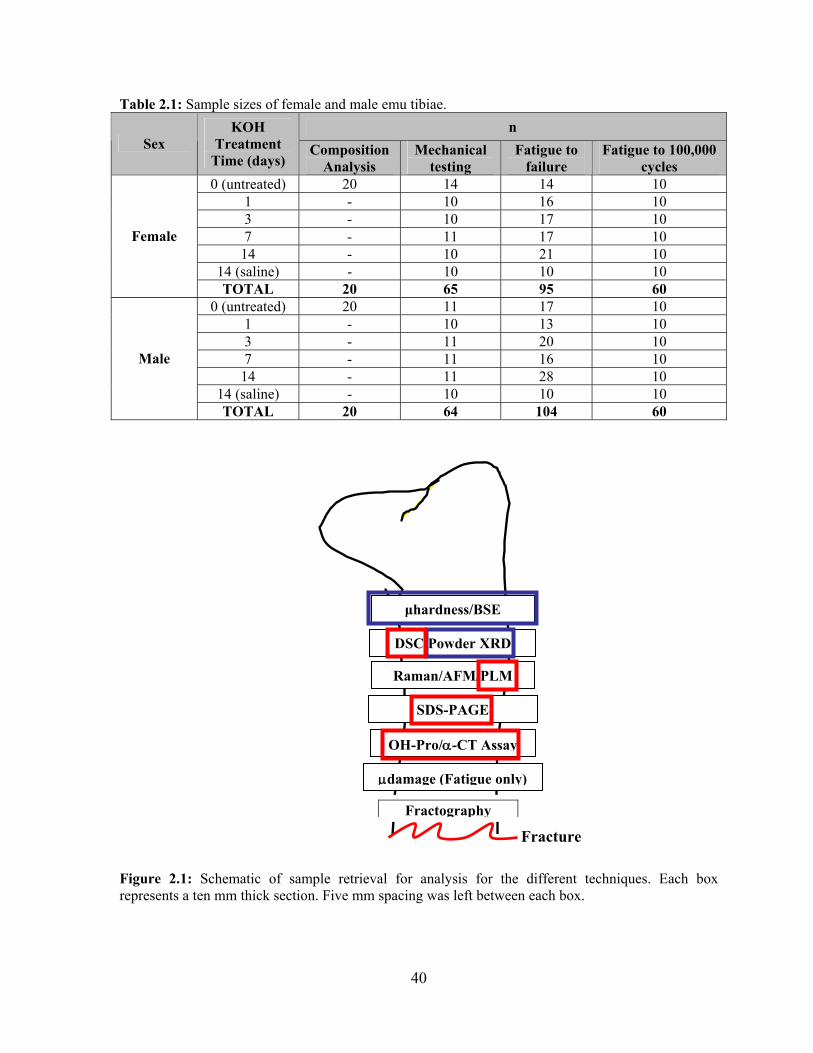
40
Table 2.1: Sample sizes of female and male emu tibiae. n
Sex KOH
Treatment Time (days)
Composition Analysis
Mechanical testing
Fatigue to failure
Fatigue to 100,000 cycles
0 (untreated) 20 14 14 10 1 - 10 16 10 3 - 10 17 10 7 - 11 17 10
14 - 10 21 10 14 (saline) - 10 10 10
Female
TOTAL 20 65 95 60 0 (untreated) 20 11 17 10
1 - 10 13 10 3 - 11 20 10 7 - 11 16 10
14 - 11 28 10 14 (saline) - 10 10 10
Male
TOTAL 20 64 104 60
Figure 2.1: Schematic of sample retrieval for analysis for the different techniques. Each box represents a ten mm thick section. Five mm spacing was left between each box.
Fracture
DSC/Powder XRD
Raman/AFM/PLM
SDS-PAGE
OH-Pro/α-CT Assay
μdamage (Fatigue only)
Fractography
μhardness/BSE

41
Table 2.2: Summary of techniques. Hierarchical level Characteristic Technique Macrostructure Bone density
Bone size and shape DXA, QUS, MRTA CT 3-point bending Fatigue testing
Microstructure Cortical microarchitecture BSE Microhardness Microdamage Fractography
Nanostructure Mineral type and crystal alignment Collagen structure and cross-linking Collagen-mineral interface
XRD Gel electrophoresis αCT, DSC, PLM AFM, Raman
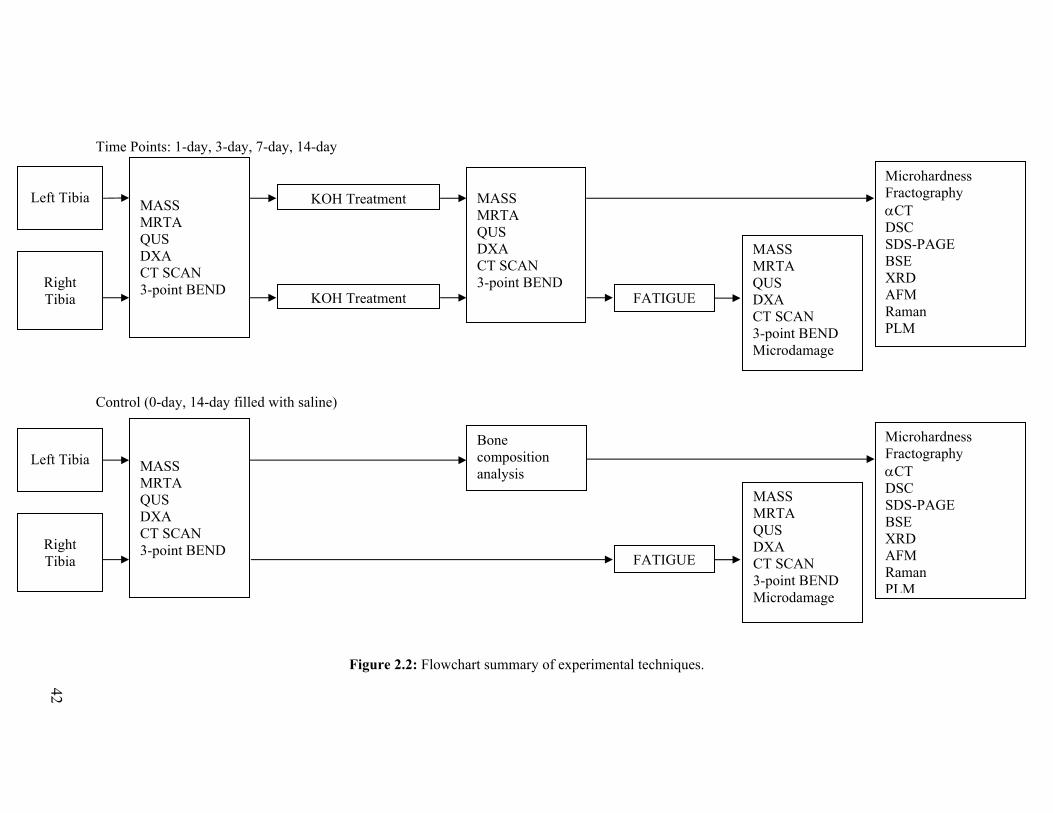
Time Points: 1-day, 3-day, 7-day, 14-day Control (0-day, 14-day filled with saline)
Figure 2.2: Flowchart summary of experimental techniques.
Left Tibia
Right Tibia
MASS MRTA QUS DXA CT SCAN 3-point BEND
KOH Treatment
KOH Treatment FATIGUE
MASS MRTA QUS DXA CT SCAN 3-point BEND
MASS MRTA QUS DXA CT SCAN 3-point BEND Microdamage
Microhardness Fractography αCT DSC SDS-PAGE BSE XRD AFM Raman PLM
Left Tibia
Right Tibia
MASS MRTA QUS DXA CT SCAN 3-point BEND
Bone composition analysis
FATIGUE
MASS MRTA QUS DXA CT SCAN 3-point BEND Microdamage
Microhardness Fractography αCT DSC SDS-PAGE BSE XRD AFM Raman PLM
42

43
2.2. Potassium Hydroxide (KOH) Treatment
Mature female and male emu tibiae were endocortically treated with 1 M potassium
hydroxide (KOH) for various time points. The use of KOH, which is known to denature and
digest proteins [7-10], does not require demineralization and consequently, it permits
treatment while retaining the bone mineral [9]. Therefore, this degradation method retains the
mineral phase and the geometric integrity of the bone. While the mechanism of action of
KOH is not well understood, it is likely to be similar to sodium hypochlorite. Sodium
hypochlorite extraction leaves the mineral phase largely unaffected [11]. The high pH of 14
of the 1 M KOH solution is likely to result in conformational changes to the collagen and
may also affect mineral-organic interactions [12].
The experimental setup for the KOH treatment involves first sealing the ends of the bone
segment with polymethylmethacrylate (PMMA). Two segments of clear tubing were placed
in one end of the bone prior to hardening of the PMMA, to allow for filling of the medullary
shaft with a known volume of KOH and to allow any trapped air to escape. Afterwards, the
clear tubing was removed and the ends sealed with PMMA. The bones were placed
horizontally and the periosteal surface wrapped in gauze that was kept moist with 0.9%
saline solution drip, as shown in Figure 2.3. The bones were rotated 180 ° around the axial
axis every 12 hours during KOH treatment, at room temperature. After the desired treatment
time, the KOH solution was reclaimed, its volume measured and the bones were rinsed in
running tap water for one hour.
Figure 2.3: KOH treatment setup.

44
2.3. Statistical Analysis
Statistical analysis was performed using SPSS (SPSS 16.0 for Windows, Chicago, IL) or
SigmaStat (SigmaStat 3.0; San Jose, CA) statistical analysis software packages. All data
(apart from regressions) are presented as mean ± standard error of the mean. A confidence
level of 95% (p=0.05) was considered statistically significant and a confidence level of 90%
(p=0.1) indicated a statistical trend.
Tests for normality and equality of variances were initially performed to determine whether
parametric or non-parametric t-tests should be used. Two-way analysis of variances
(ANOVA, general linear model) was performed to examine the effects of sex and KOH
treatment on all measured parameters. Two-way ANOVA was also used to determine
whether the two factors of measurement technique and KOH treatment time interact on the
respective technique output for both female and male emu tibiae samples. Post hoc pairwise
testing utilized the Fisher’s Least Significant Difference (LSD) test to detect significant
differences between the groups. To compare tibiae fatigue resistance, generalized linear
models were used when comparing regression lines fit to variables that varied by applied
stress or strain (analysis of covariance and multiple linear regressions). This included number
of cycles to failure (N), damage index (DI) rate and creep rate versus applied stress/strain and
specimen group (KOH treatment time, sex). Regressions were tested for homogeneity of
residual variances, differences in slope and differences in height. In addition, multiple
regression analyses were performed to evaluate correlations between certain parameters.

45
2.4. References
[1] Reed KL, Brown TD. (2001) Elastic modulus and strength of emu cortical bone. Iowa.Orthop.J. 21:53-57.
[2] Davies SJJF. (2002) Ratites and Tinamous. Oxford University Press. New York. [3] Turner CH, Burr DB. (1993) Basic biomechanical measurements of bone: a tutorial. Bone.
14:595-608. [4] Pelker R, Friedlaender G, Markham T, Panjabi M, Moen C. (1984) Effects of freezing and
freeze-drying on the biomechanical properties of rat bone. J.Orthop.Res. 1:405-411. [5] Borchers R, Gibson L, Burchardt H, Hayes W. (1995) Effects of selected thermal variables
on the mechanical properties of trabecular bone. Biomaterials.16:545-551. [6] Kang Q, An YH, Friedman RJ. (1997). Effects of multiple freezing-thawing cycles on
ultimate indentation load and stiffness of bovine cancellous bone. Am.J.Vet.Res. 58:1171-1173.
[7] Abe K, Hashizume H, Ushiki T. (1992) An EDTA-KOH method to expose bone cells for
scanning electron microscopy. J.Electron.Microsc.(Tokyo). 41:113-115. [8] Lin TC, Su CY, Chang CS. (1997) Stereomorphologic observation of bone tissue response to
hydroxyapatite using SEM with the EDTA-KOH method. J.Bone.Miner.Res. 36:91-97. [9] Privalova LG, Konstantinova ML, Kulagin VN, Zaikov GY, Sorokin YY, Dreizenshtok GS.
(1980) Kinetic regularities of the degradation of collagen in dilute solutions of sulphuric acid and potassium hydroxide. Pol.Sci. 22:2583-2590.
[10] Arsenault AL. (1990) Vascular canals in bovine cortical bone studied by corrosion casting.
Calcif.Tissue.Int. 47:320-325. [11] Broz JJ, Simske SJ, Corley WD, Greenberg AR. (1997) Effects of deproteinization and
ashing on site-specific properties of cortical bone. J.Mater.Sci.Mater.Med. 8:395-401. [12] Walsh WR, Labrador DP, Kim HD, Guzelsu N. (1994) The effect of in vitro fluoride ion
treatment on the ultrasonic properties of cortical bone. Ann.Biomed.Eng. 22:404-15.

46
Chapter 3 Initial Study
3.1. Introduction
3.2. Experimental Details
3.2.1. Emu bone samples 3.2.2. Bone composition 3.2.3. KOH treatment 3.2.4. CT 3.2.5. DXA 3.2.6. QUS 3.2.7. MRTA 3.2.8. Mechanical testing 3.2.9. Statistical analysis
3.3. Results
3.3.1. Emu bone composition 3.3.2. Sex differences in untreated and control bones 3.3.3. Effect of KOH treatment on bone composition 3.3.4. Effect of KOH treatment on BMD, SOS and EI
3.3.5. Effect of KOH treatment on structural and mechanical properties
3.4. Discussion
3.4.1. Emu bone composition 3.4.2. KOH treatment and collagen degradation 3.4.3. Effect of KOH treatment on bone ductility and toughness 3.4.4. Composite material behaviour 3.4.5. Sex differences 3.4.6. Clinical tools
3.5. Conclusions
3.6. Chapter Summary
3.7. References

47
The following chapter has been reprinted with the kind permission of Elsevier and was
published in Bone under, “A new tool to assess the mechanical properties of bone due to
collagen degradation,” 44 (2009) 840-848. This chapter outlines the initial work that was
done in testing the MRTA as a potential tool for the assessment of bone quality in
endocortically KOH treated emu tibiae to be used as a model for determining the
mechanisms by which bone collagen degradation affects bone mechanical properties.
3.1. Introduction
Bone is a composite material composed of highly substituted, poorly crystalline mineral
(apatite) and a hydrated organic matrix, consisting mainly (~90-95%) of Type I collagen. The
remaining 5-10% of the organic matrix components consists of various noncollagenous
proteins, proteoglycans and small molecules [1]. For the purpose of this study, the organic
matrix will be considered as collagen only. Historically, many investigators have sought to
understand the individual contributions of the mineral and organic phases to the mechanical
properties of bone. Research has commonly been focused on the mineral and it is accepted
that the non-organic component of bone is the primary contributor to its strength and stiffness
[1]. In contrast, the collagen of bone is generally considered to contribute to the toughness
(energy to fracture) of the tissue, mitigating the brittleness of the mineral. However, recent
work suggests that collagen also contributes to bone strength [2,3]. Moreover, denaturing the
collagen or ‘debonding’ the collagen from the mineral phase compromises the composite
structure and results in correspondingly significant decreases in the modulus of elasticity,
ultimate stress and toughness [4,5].
Clinically, bone mineral density (BMD) measurement is a widely used, non-invasive means
of identifying individuals considered to have a high risk of fracture. However, BMD
measures the bone mineral areal density only; this is only one of a number of measurable
contributors to bone strength and fracture risk. Bone strength is derived from both the
amount of bone tissue present (quantity), which is related to bone density and size, as well as
bone quality, which comprises the bone structure and material properties, both of which are
affected by bone remodeling [6]. From a clinical perspective, the BMD may not accurately
predict fracture risk, as it only assays one of the relevant parameters. For example, BMD

48
could only account for approximately 16% of the reduction in fracture risk in an alendronate
treatment study [7], suggesting that other factors were significant contributors to the efficacy
of the treatment. BMD alone is therefore insufficient to predict skeletal fragility. A clinical
tool that can incorporate a broader assessment of bone quality and therefore more accurately
predict fracture risk, would be extremely valuable in identifying at-risk patients.
The most common method of measuring BMD is with dual energy x-ray absorptiometry
(DXA), which uses differential attenuation of x-rays to quantify the mineral component of
bone. Quantitative ultrasound (QUS) is another clinical measure of bone density. As with
DXA, QUS provides an indirect measurement of fracture risk; in this case, using the speed of
sound (SOS) through bone to characterize the tissue [8]. Both DXA and QUS are in
widespread clinical use. However, neither technique has been demonstrated to adequately
distinguish between fracture and non-fracture populations [9]. This is unsurprising since, as
discussed above, bone fragility depends not only on mineral content but also on matrix
properties, architecture and geometry [6] and therefore evaluating the mineral content of
bone alone may be insufficient to predict changes in bone quality [3].
An alternative technology to assess bone quality is the Mechanical Response Tissue Analyzer
(MRTA). The MRTA is a radiation-free, non-invasive instrument developed by NASA to
investigate the effects of space travel on the mechanical properties of astronaut bones [9].
The MRTA measures the cross-sectional bending stiffness (EI) of long bones on the basis of
their response to low-frequency vibration. EI is the product of the elastic modulus, E, and the
areal cross-sectional moment of inertia, I [9]. Research has shown that the measured EI of a
long bone is predictive (R2>0.9) of the maximum strength of the bone [10] and thus in vivo
measurements of EI can be used to assess bone strength. Furthermore, previous studies
suggest that the measurement of EI has the potential to effectively evaluate fracture risk [10-
12]. Finally, studies have demonstrated the ability of the MRTA to measure EI differences
between various populations resulting from exercise [13,14], disease state [15,16] and age
[17].

49
MRTA measurements in humans are limited to the ulna and the tibia because the shafts of
these bones are relatively close to the skin. The tibia of the emu, Dromaius novaehollandiae,
was selected as a model for this study as its size and approximately cylindrical shape is
similar to human long bone and they are therefore suitable for assessment by the MRTA,
which was designed for humans. Furthermore, sexual dimorphism is apparent in emus, as
females are notably heavier and larger compared to males [18], providing a model system to
evaluate differences between female and male bones. Finally, emu tibiae may be a suitable
model for long human leg bones as the bipedal nature of emus is analogous to human
locomotion [19,20]; the emu model has previously been used as a model for femoral head
osteonecrosis [19].
The objectives of this study were two-fold: to investigate the ability of the MRTA to detect
changes in bone mechanical properties induced by changes in the collagen matrix of emu
bone and to evaluate any differences between female and male emu bone. This was achieved
through bone composition analysis, KOH treatment for various durations and finally,
validation of the MRTA and comparison with DXA and QUS in predicting these induced
changes on the mechanical properties of emu tibial bone.
3.2. Experimental Details
3.2.1. Emu bone samples
Leg bones from female and male emus were obtained from slaughterhouses and farms in
Southern Ontario, Canada. The animals were approximately 3-5 years of age and therefore
skeletally mature [20,21]. The tibiae were carefully separated from the femora and
tarsometatarsi with a scalpel. The shaft of each tibia was isolated by using a circular saw to
remove the ends (15% of the total bone length from the proximal end and 10% from the
distal end), resulting in bone samples 26 to 32 cm in length. The marrow and trabecular bone
from the diaphysis of the tibiae were removed by drilling longitudinally through the bone
shaft, after which the medullary canal was flushed with tap water. Finally, the skin and
overlying tissue were carefully removed with a scalpel. The prepared bones were then
individually wrapped in saline-soaked gauze and frozen at -20 °C until use.

50
All bone samples were allowed to thaw at room temperature for three hours prior to analysis.
Bones were divided into two groups: the first group (n=40) was used for bone composition
analysis and the second group (n=120) was used to evaluate the effects of different
degradation times on the measurements made by various bone analysis techniques. Within
these two groups, the bones were further subdivided into female and male groups.
3.2.2. Bone composition
The four major constituents of bone - water, fat, mineral and collagen - were quantified to
provide the overall composition of emu bone. One centimeter wide sections were cut from
the midshaft of each tibial shaft from female (n=20) and male (n=20) emu tibiae, using a
circular saw. One section from each shaft was used to quantify each component.
The water content of emu bone was determined by weighing the samples before and after
drying overnight in an oven at 105 °C. The percentage weight change was determined and
ascribed to the water content. All other measurements were expressed with respect to the ‘dry
weight’ of bone.
Fat was removed from the dry bone samples using 99.5% acetone (Fisher Scientific,
Pittsburgh, PA). Individual bone samples were placed in plastic cassettes and immersed in
acetone, while being agitated on a Vibromax Shaker (IKA Process Equipment, Wilmington,
NC). After 30 minutes, the acetone was exchanged for fresh acetone. This was repeated five
times, resulting in a three-hour extraction. The samples were then oven-dried for 30 minutes
at 105 °C, reweighed and the percentage weight change recorded and attributed to fat
content.
The mineral content in the emu bone was determined by weighing the dry samples before
and after ashing overnight in a furnace (Model F46120CM Barnstead, Thermolyne
Corporation, Dubuque, IA) at 800 °C. The percentage of weight remaining after ashing was
attributed to mineral content.

51
The average initial collagen content in the emu bone was then calculated from the weight
loss induced by ashing. Initial collagen content was also measured independently using the
hydroxyproline assay. This colourimetric assay is an established method of determining
collagen content in cartilage and soft tissue [22-24] as well as in bone [25]. Hydroxyproline
was quantified according to the assay described by Woessner [22], which involves four
stages: digestion of the collagen, hydrolysis of the peptides, colour development and
microplate absorbance measurement. The hydroxyproline assay was performed on dried,
defatted and demineralized bone specimens that were digested in papain (Sigma-Aldrich,
Milwaukee, WI) at 65 °C for 96 hours. After digestion, the bone samples were hydrolyzed in
6 N hydrochloric acid (Fisher Scientific, Pittsburgh, PA), incubated in a block heater at 110
°C for 18 hours and then neutralized using sodium hydroxide (Fisher Scientific, Pittsburgh,
PA). Next, the samples were prepared for colourimetric analysis with the addition of 0.05 N
chloramine-T (Sigma-Aldrich, Milwaukee, WI), 3.15 N perchloric acid (Fisher Scientific,
Pittsburgh, PA) and Ehrlich’s Reagent (Sigma-Aldrich, Milwaukee, WI). The colourimetric
reaction was quantified with a μ-Quant Microplate Spectrophotometer (BioTek Instruments,
Winooski, VT) at 560 nm. It was assumed that 10% of the protein in emu bone collagen is
hydroxyproline [22,26]. Absorbance values were plotted against the concentration of
standard hydroxyproline (0-5 μg) and the quantity of hydroxyproline in the bone samples
was determined from the standard curve.
3.2.3. KOH treatment
The endocortical lumens of whole emu tibiae were filled with 1 M potassium hydroxide
(KOH) (Fisher Scientific, Pittsburgh, PA) to degrade the protein [27]. The use of KOH as a
degradation agent does not require a demineralization step. Consequently, this degradation
method retains the mineral phase and the geometric integrity of the bone. In addition, this
endocortical treatment (from the inside of the bone) models the degradation of bone with age.
The effect of KOH treatment on the mechanical properties of bone was determined in 50
female and 50 male tibiae, with ten samples allocated to each of 0, 1, 3, 7 or 14-day
treatments. Two additional 14-day groups of ten female and ten male emu tibiae were filled
with saline instead of KOH to act as controls.
52
The experimental setup for KOH treatment began with sealing the ends of the bone segment
with polymethylmethacrylate (PMMA, SR Ivolen kit, Ivoclar Vivadent, Mississauga, ON).
Two segments of clear tubing were placed in one end of the bone prior to hardening of the
PMMA seal, to allow for filling of the medullary cavity with a known volume of 1 M KOH
and to allow air to escape. Afterwards, the clear tubing was removed and the ends sealed with
PMMA. The bones were held horizontally over a collection basin with the periosteal surface
wrapped in four layers of gauze that was periodically moistened with saline. The bones were
rotated 180 ° around the axial axis every 12 hours during KOH treatment at room
temperature. After the desired treatment period, the KOH solution was reclaimed and its
volume measured (to ensure that no leakage occurred during KOH treatment). The
endocortical surfaces of the bones were rinsed in running tap water for one hour.
The hydroxyproline content in the KOH solution was determined using the hydroxyproline
assay, as described above, to estimate the amount of collagen removed during KOH
treatment (presumed to migrate from the bone to the KOH solution). However, during the
hydrolysis stage of the hydroxyproline assay, the addition of acid was not required as the
solutions were sufficiently basic to permit alkali hydrolysis of the peptides by incubation for
18 hours at 110 °C. After hydrolysis, the hydrolyzate was neutralized using 37%
hydrochloric acid (Fisher Scientific, Pittsburgh, PA). The amount of hydroxyproline was
determined using a linear standard curve (0-5 μg of hydroxyproline). The calculated
concentrations (μg/mL) were then multiplied by the amount of KOH used (mL) and
normalized to specimen dry mass, assuming 30% collagen is present in dry bone [2].
Collagen content in the KOH treated bone specimens (two one cm thick sections of bone
from both sides of the fracture surface in the 24 cm region of interest) was also determined
with the hydroxyproline assay assuming that collagen is 10% hydroxyproline [22,26] by
mass and normalizing to specimen dry mass.
The emu tibiae properties were assessed using CT, DXA, QUS, MRTA and three-point
bending before and after KOH treatment.

53
3.2.4. CT
Computed Tomography (CT) scans were taken at the mid-point of each emu tibia with an
Aquilion 64 CT scanner (Toshiba, Canada). External anterior-posterior and medial-lateral
diameters (mm), cortical thickness (mm), cross-sectional area (mm2) and second moment of
area in bending orientation (mm4) were then measured from these binarized images using
image analysis software (ImageJ 1.28u, National Institutes of Health).
3.2.5. DXA
The bone mineral density (BMD) was measured by DXA on a Lunar Prodigy Advance
system (General Electric, Madison, WI) using the ‘L-Spine’ mode. The bones were scanned
in a clear acrylic container filled with water to mimic the effects of soft tissue [9]. The region
of interest for this scan was 24 cm and thus, a 24 cm region at the centre of each tibial
diaphysis was demarcated with a marker in order that the scanned section of the bone
specimens was consistent and reproducible.
3.2.6. QUS
Speed of sound (SOS) measurements were obtained with a Sunlight Omnisense QUS device
(Sunlight Medical Ltd., Tel-Aviv, Israel). As the apparatus is designed for in vivo testing and
these bone samples had been excised from the surrounding tissue, slices of extra-firm tofu
(6.5 cm x 4.5 cm x 0.5 cm; Sunrise Soya Foods) were used to mimic soft tissue [9].
Measurements were taken at the centre of the 24 cm region of interest, defined by the DXA
analysis, using a hand-held probe with ultrasound gel to acoustically couple the probe to the
bone. During the test, the probe was moved perpendicular to the bone axis in the manner
recommended by the manufacturer.
3.2.7. MRTA
The MRTA measures the cross-sectional bending stiffness (EI) of long bones by applying a
low frequency (0 to 1600 Hz) vibration to the skin surface, which is transmitted to the bone
using an electromagnetic shaker with an impedance head probe and tip. A transducer
connected to the probe measures the force and acceleration response from the bone. The bone
is modeled as a beam in three-point bending and the force and acceleration values are used to

54
calculate EI [9,10]. MRTA measurements were taken at the centre of the 24 cm region of
interest defined by the DXA analysis. As with QUS testing, the soft tissue was mimicked, in
this case by placing a 3 cm x 3 cm x 0.5 cm foam segment (Foam Craft Sheets) between the
probe and the bone [9]. The contact points used to support the bone in the three-point
bending configuration were aligned with the demarcation lines, 24 cm apart. Five replicates
of the EI measurements were taken for each specimen.
3.2.8. Mechanical testing
Female and male control, untreated and KOH treated emu tibiae were tested in three-point
bending using a servo-hydraulic materials testing machine (Model 8511, Instron, Canton,
MA). Each specimen was placed on the two lower support bars (24 cm apart) with the
anterior side of the bone facing up. The bone was secured in the three-point bending jig with
a 100 N preload and was then loaded to failure at a displacement rate of 0.04 mm/s. Force
and displacement data were collected at a rate of 0.1 data points per second using a
computerized system interfaced with the Instron (Fast-track 2 Software, Instron Corp.,
Canton, MA) until failure. The displacement was then calculated from the crosshead speed
and time data. A load-displacement curve was created for every specimen and was used to
determine the ultimate load (N), failure displacement (mm), post-yield displacement (mm),
energy to failure (mJ), plastic energy (mJ) and stiffness (N/mm).
Load-displacement data was normalized to eliminate differences caused by geometrical
variation and to evaluate intrinsic bone material properties. Computed tomography (CT)
scans were taken at the mid-point of each emu tibia with an Aquilion 64 CT scanner
(Toshiba, Canada). Stress (σ; MPa) and strain (ε; %) were then calculated using the following
equations [28]:
where F is the measured load (N), L is the span of the lower supports (24 cm), APφ is the
external diameter in the anterior-posterior direction (mm), Ixx is the moment of inertia about
the mediolateral axis (mm4) and D is the measured displacement (mm). Stress-strain curves
xx
AP
ILF
8φ
σ⋅⋅
= 10062 ∗=
LD APφ
ε

55
were created from the normalized data. From these curves, the elastic modulus (E; GPa),
ultimate stress (σuts; MPa), yield stress (σy; MPa), failure stress (σf; MPa), failure strain (εf,
%), post-yield strain (εpy, %), post-yield toughness (plastic energy) (Upy; mJ/mm3) and
toughness (U; mJ/mm3) were determined.
Prior to KOH treatment, all bones were tested non-destructively in the elastic region (to a
maximum of 1000 N) to determine the initial stiffness and elastic modulus. These values
were used to determine the percent change in modulus for the MRTA and three-point
bending techniques.
3.2.9. Statistical analysis
For comparisons between measurement techniques within the same time groups, Student’s t-
tests were used. Tests for normality and equality of variances were initially performed to
determine whether parametric or non-parametric t-tests should be used. Two-way analysis of
variance (ANOVA) was used to determine whether the two factors of measurement
technique and time interact on the respective technique output. Post hoc pairwise testing
utilized the Fisher’s Least Significant Difference (LSD) test. The effect of KOH treatment
time and sex on mechanical data was also analyzed using a two-way ANOVA. Two-way
ANOVA tests were conducted using SigmaStat statistical analysis software (SigmaStat 3.0,
San Jose, CA), while all other tests were conducted using SPSS (SPSS 16.0 for Windows,
Chicago, IL) statistical analysis software. All data are presented as mean ± standard error of
the mean. A confidence level of 95% (p=0.05) was considered statistically significant.
3.3. Results
All parameters measured for the control groups (14-day filled with saline) were similar to
those of the untreated groups (0-day) for both female and male emu tibiae (Appendix A).
3.3.1. Emu bone composition
There were no significant composition differences detected for water, fat, mineral and
collagen content measures between female and male emu tibiae. The water content was
found to be 14.4% ± 0.3% and 14.4% ± 0.5% for the female and male emu bone samples,

56
respectively. The overall dry weight composition of the emu tibiae samples is summarized in
Table 3.1.
Table 3.1: Collagen, mineral and fat content measurements for female and male emu tibiae. Female Male
Collagen Mineral Fat Collagen Mineral Fat
Average % dry mass 31.3 ± 1.8 68.1 ± 0.1 0.6 ± 0.1 29.8 ± 2.1 68.4 ± 0.3 0.5 ± 0.1
Total % dry mass 100.0 ± 1.8 98.7 ± 2.1
3.3.2. Sex differences in untreated and control bones
Table 3.2 summarizes the significant differences observed between untreated female and
male emu bones. The control bones were not different from untreated samples, allowing
pooling of data. CT analysis of all samples before KOH treatment showed significant
differences in geometrical properties between sexes. Females had significantly greater
moment of inertia (p=0.001), cortical area (p=0.001), thickness (p=0.05) and mediolateral
(ML) diameter (p=0.04) compared to male bones. Female emu bones also had significantly
higher mass (p=0.001), BMD (p=0.001) and BMC (p=0.001) values compared to male emu
bones. In terms of mechanical properties, female control (14-day filled with saline) and
untreated samples (0-day) had significantly higher ultimate stress (p=0.01) and failure stress
(p=0.001) compared to male emu tibiae. However, male bones (both untreated and control)
had significantly higher failure strain (p=0.03) and post-yield strain compared to female
(p=0.02) emu tibiae.
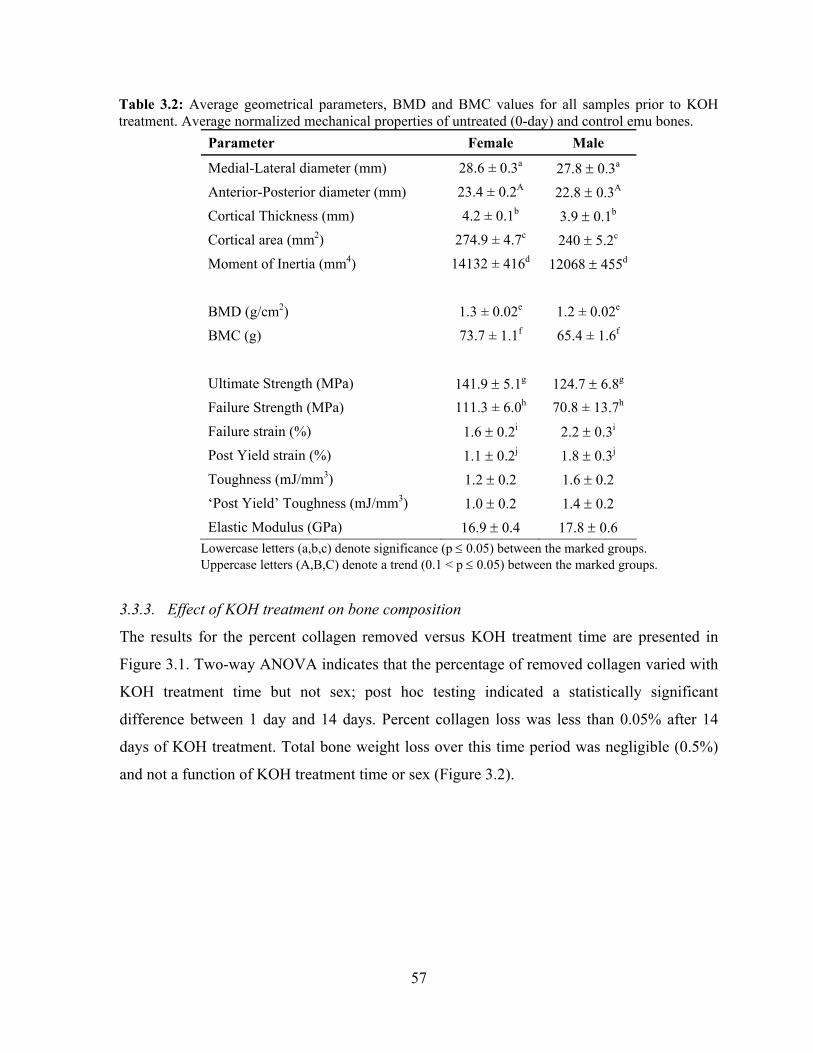
57
Table 3.2: Average geometrical parameters, BMD and BMC values for all samples prior to KOH treatment. Average normalized mechanical properties of untreated (0-day) and control emu bones.
Parameter Female Male
Medial-Lateral diameter (mm) 28.6 ± 0.3a 27.8 ± 0.3a
Anterior-Posterior diameter (mm) 23.4 ± 0.2A 22.8 ± 0.3A
Cortical Thickness (mm) 4.2 ± 0.1b 3.9 ± 0.1b
Cortical area (mm2) 274.9 ± 4.7c 240 ± 5.2c
Moment of Inertia (mm4) 14132 ± 416d 12068 ± 455d
BMD (g/cm2) 1.3 ± 0.02e 1.2 ± 0.02e
BMC (g) 73.7 ± 1.1f 65.4 ± 1.6f
Ultimate Strength (MPa) 141.9 ± 5.1g 124.7 ± 6.8g
Failure Strength (MPa) 111.3 ± 6.0h 70.8 ± 13.7h
Failure strain (%) 1.6 ± 0.2i 2.2 ± 0.3i
Post Yield strain (%) 1.1 ± 0.2j 1.8 ± 0.3j
Toughness (mJ/mm3) 1.2 ± 0.2 1.6 ± 0.2
‘Post Yield’ Toughness (mJ/mm3) 1.0 ± 0.2 1.4 ± 0.2
Elastic Modulus (GPa) 16.9 ± 0.4 17.8 ± 0.6
Lowercase letters (a,b,c) denote significance (p ≤ 0.05) between the marked groups. Uppercase letters (A,B,C) denote a trend (0.1 < p ≤ 0.05) between the marked groups.
3.3.3. Effect of KOH treatment on bone composition
The results for the percent collagen removed versus KOH treatment time are presented in
Figure 3.1. Two-way ANOVA indicates that the percentage of removed collagen varied with
KOH treatment time but not sex; post hoc testing indicated a statistically significant
difference between 1 day and 14 days. Percent collagen loss was less than 0.05% after 14
days of KOH treatment. Total bone weight loss over this time period was negligible (0.5%)
and not a function of KOH treatment time or sex (Figure 3.2).

58
KOH Treatment Time1 day 3 day 7 day 14 day
Perc
ent
colla
gen
loss
(%
)
0.00
0.02
0.04
0.06
0.08
0.10
MaleFemale
Figure 3.1: Percent collagen weight removed versus KOH treatment time for female and male emu tibiae. Significant differences were observed in the collagen weight removed with KOH treatment time but sex was not a factor in collagen removal. Maximum percent collagen removed was negligible (0.05%).
KOH Treatment Time
1 day 3 day 7 day 14 day
Perc
ent
bone
mas
s ch
ange
(%
)
0.0
0.2
0.4
0.6
0.8
1.0 MaleFemale
Figure 3.2: Percent bone weight loss versus KOH treatment time for female and male emu tibiae. No differences were observed in the bone weight loss with KOH treatment time or sex.

59
3.3.4. Effect of KOH treatment on BMD, SOS and EI
The effect of KOH treatment on bone quality was assessed by DXA (BMD), QUS (SOS),
MRTA (EI) and three-point bending before and after KOH treatment at all time points for
both female (Figure 3.3 (a)) and male (Figure 3.3 (b)) emu tibiae. No differences in BMD or
SOS, as measured by DXA and QUS, respectively, resulted from KOH treatment; the
measured values varied by less than 2% between KOH treatment times. However, there were
significant changes in the modulus of elasticity between all time points, except between 3
and 7 days, as determined by three-point bending and by MRTA for both female and male
emu tibiae. No differences were seen between percent changes in modulus of elasticity as
measured by three-point bending and the MRTA for both sexes. There were no differences
between sexes.
Figure 3.3: Percent changes of bone quality measurements reported by the different measurement techniques as a function of KOH treatment time for (a) female and (b) male emu tibiae. No differences were seen between sexes. Significant changes in modulus of elasticity were observed between all time points (except between 3 and 7 days), as determined by three-point bending and MRTA for both female and male emu tibiae. DXA and QUS measurements did not detect any changes caused by KOH treatment.
3.3.5. Effect of KOH treatment on structural and mechanical properties
CT analysis showed no changes in geometrical properties such as moment of inertia, cortical
area, thickness and anterior-posterior (AP) or medial-lateral (ML) diameter with KOH
treatment time or between sexes (Table 3.3). On the other hand, three-point bending tests
demonstrated significant variations between the different time points for both sexes. All
a) Females
KOH Treatment (days)
Per
cen
t C
han
ge (
%)
b) Males
KOH Treatment (days)
Per
cen
t C
han
ge (
%)
0 1 3 7 14-30
-25
-20
-15
-10
-5
0
% Change Modulus (3-point)% Change Modulus (MRTA)% Change BMD (DXA)% Change SOS (QUS)
0 1 3 7 14-30
-25
-20
-15
-10
-5
0
% Change Modulus (3-point)% Change Modulus (MRTA)% Change BMD (DXA)% Change SOS (QUS)

60
normalized parameters followed the same trends as un-normalized parameters, confirming
that there are significant differences in mechanical integrity with KOH treatment at the bone
material level. Representative stress-strain curves for different KOH treatment times for
female (Figure 3.4 (a)) and male (Figure 3.4 (b)) emu tibiae reveal changes with KOH
treatment time and significant differences between sexes.
Table 3.3: Average geometrical parameter changes after KOH treatment for female and male emu tibiae.
KOH treatment time in days Parameter
Sex
1 3 7 14
Female 0.9 ± 0.5 0.3 ± 0.3 0.5 ± 0.3 0.3 ± 0.4 Change in medial-lateral diameter (%) Male 0.4 ± 0.4 0.4 ± 0.4 0.3 ± 0.3 0.2 ± 0.3
Female 0.3 ± 0.2 0.2 ± 0.2 0.8 ± 0.6 0.8 ± 0.6 Change in anterior-posterior diameter (%) Male 0.2 ± 0.3 0.5 ± 0.5 0.4 ± 0.3 0.8 ± 0.7
Female 0.2 ± 0.5 0.4 ± 0.6 0.6 ± 0.3 0.4 ± 0.6 Change in cortical thickness (%) Male 0.7 ± 0.8 0.6 ± 0.7 0.8 ± 0.2 0.2 ± 0.4
Female 0.2 ± 0.2 0.2 ± 0.4 0.2 ± 0.6 0.8 ± 0.6 Change in cortical area (%) Male 0.7 ± 0.6 0.5 ± 0.9 0.9 ± 0.6 0.9 ± 0.3
Female 0.2 ± 0.2 0.2 ± 0.3 0.3 ± 0.7 0.6 ± 0.2 Change in moment of inertia (%) Male 0.6 ± 0.4 0.7 ± 0.4 0.4 ± 0.6 0.6 ± 0.4

61
Figure 3.4: Representative stress-strain curves for 0-14 day KOH treatment of (a) female and (b) male emu tibiae. Significant differences were seen with KOH treatment time for both sexes. Significant differences were seen in the plastic region between female and male emu tibiae with KOH treatment time.
The average ultimate stress and yield stress decreased significantly with KOH treatment for
female and male emu tibiae. Moreover, the elastic modulus significantly decreased at the 14-
day KOH treatment time point compared to the untreated (0-day) samples for female and
male bones. A significant increase in failure strain was seen with KOH treatment time due to
a significant increase in the post-yield strain for both female and male bones. This increased
post-yield strain contributed to a significant increase in toughness over the time period of the
experiment. No relationship between the mechanical properties in the elastic region and
KOH treatment time was observed (Figure 3.5 (a)). Male bones failed at lower stresses
(Figure 3.5 (b)), exhibited larger failure strains (Figure 3.5 (c)) and absorbed more energy
(Figure 3.5 (d)) compared to female bones.
a) Females
Strain (%)
Stre
ss (
MP
a)b) Males
Strain (%)
Stre
ss (
MP
a)
0 1 2 3 40
20
40
60
80
100
120
140
160
180 0 day1 day3 day7 day14 day
0 1 2 3 40
20
40
60
80
100
120
140
160
1800 day1 day3 day7 day14 day
a) Females
Strain (%)
Stre
ss (
MP
a)b) Males
Strain (%)
Stre
ss (
MP
a)
0 1 2 3 40
20
40
60
80
100
120
140
160
180 0 day1 day3 day7 day14 day
0 1 2 3 40
20
40
60
80
100
120
140
160
1800 day1 day3 day7 day14 day
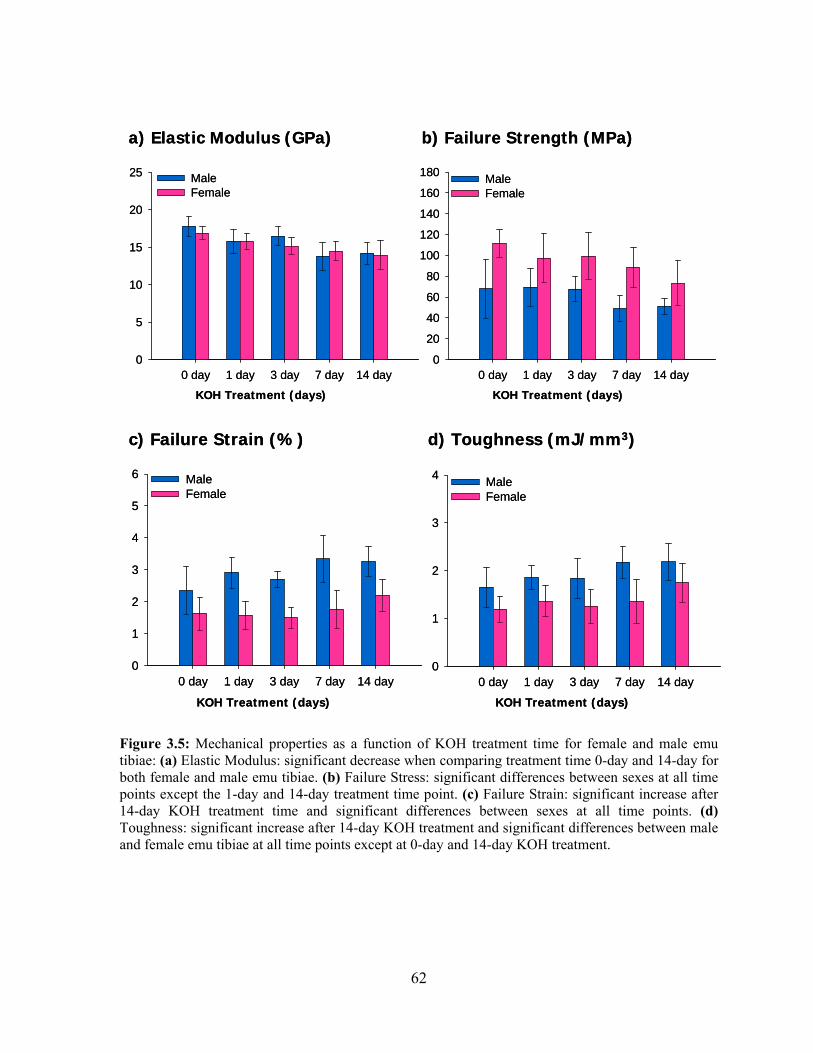
62
Figure 3.5: Mechanical properties as a function of KOH treatment time for female and male emu tibiae: (a) Elastic Modulus: significant decrease when comparing treatment time 0-day and 14-day for both female and male emu tibiae. (b) Failure Stress: significant differences between sexes at all time points except the 1-day and 14-day treatment time point. (c) Failure Strain: significant increase after 14-day KOH treatment time and significant differences between sexes at all time points. (d) Toughness: significant increase after 14-day KOH treatment and significant differences between male and female emu tibiae at all time points except at 0-day and 14-day KOH treatment.
a) Elastic Modulus (GPa) b) Failure Strength (MPa)
0 day 1 day 3 day 7 day 14 day0
20
40
60
80
100
120
140
160
180 MaleFemale
KOH Treatment (days) KOH Treatment (days)
0 day 1 day 3 day 7 day 14 day0
5
10
15
20
25 MaleFemale
a) Elastic Modulus (GPa) b) Failure Strength (MPa)
0 day 1 day 3 day 7 day 14 day0
20
40
60
80
100
120
140
160
180 MaleFemale
KOH Treatment (days) KOH Treatment (days)
0 day 1 day 3 day 7 day 14 day0
5
10
15
20
25 MaleFemale
c) Failure Strain (%) d) Toughness (mJ/mm3)
KOH Treatment (days) KOH Treatment (days)
0 day 1 day 3 day 7 day 14 day0
1
2
3
4
5
6 MaleFemale
0 day 1 day 3 day 7 day 14 day0
1
2
3
4 MaleFemale
c) Failure Strain (%) d) Toughness (mJ/mm3)
KOH Treatment (days) KOH Treatment (days)
0 day 1 day 3 day 7 day 14 day0
1
2
3
4
5
6 MaleFemale
0 day 1 day 3 day 7 day 14 day0
1
2
3
4 MaleFemale

63
3.4. Discussion
In this experiment, female and male emu tibiae were treated with 1 M potassium hydroxide
(KOH) solutions for various lengths of time. DXA, QUS, MRTA and three-point bending
measurements were performed on the tibiae before and after KOH treatment. KOH treatment
did not change the geometry or mineral content of the bone samples and only a minimal
amount of collagen was extracted. However, the mechanical properties of the bone were
significantly compromised, which suggests that the mechanical contribution of the collagen
was impaired. These mechanical changes were observed with MRTA but not with either of
the other two non-invasive assessment techniques.
3.4.1. Emu bone composition
The mean weight fractions obtained for each of the main constituents of emu bone (mineral,
collagen and fat) accounted for 100.0% ± 1.8 (female) and 98.7% ± 2.1 (male) of the
measured dry weight. The 68:31 ratio of mineral to organic matrix obtained for the emu
tibiae is similar to the 65:35 ratio reported for human bone [3,29]. Moreover, previous
studies indicate that avian (chick) bone at two years of age contains approximately 67% of
the non-defatted dry weight as mineral (determined by ash weight measurement) [29].
3.4.2. KOH treatment and collagen degradation
KOH solution has been used previously as a bone degradation agent [30,31], although it is
used less frequently than sodium hypochlorite (bleach) [32,33]. Several authors have used an
EDTA-KOH method to remove the bone matrix to expose bone cells for scanning electron
microscopy [27,31,34-35], decalcifying the tissue with EDTA followed by digestion of
collagen fibers with KOH. Ushiki and Ide determined that the length of KOH treatment was
critical and that a short treatment time resulted in incomplete digestion of the collagen [34].
Immersion in commercial (5.25%) sodium hypochlorite solution results in removal of
>97.5% of the collagen from small blocks of bone (3.6 mm x 3.6 mm x 40 mm) over 21 days
[33]. Note that in our study, only about 0.05% of the collagen was actually extracted, based
on the hydroxyproline assay of the KOH solution. This may be due to either a difference in
the mechanism of action or simply because the bleach-treated samples had a much higher

64
surface-area-to-volume ratio. Sodium hypochlorite extraction leaves the mineral phase
largely unaffected [32-33,36]; similarly, we did not observe changes to the bone mineral as a
result of KOH treatment.
While the KOH treatment did not appear to remove a significant amount of collagen, the
collagen may have been degraded in situ, as an increase in pH may alter secondary and
tertiary structures of the proteins [37]. Degradation of the collagen would explain the
negative effects on the mechanical properties of bone in the absence of substantial changes to
the geometry or the composition of the samples. The endocortical degradation treatment may
have resulted in an inner zone where collagen was significantly degraded, with less
disruption as the distance from the medullary canal increased. This would result in
structurally heterogeneous cross-sections. The increasingly compromised mechanical
properties observed with increased KOH treatment time may therefore be related to an
increasing volume of the degradation zone, rather than a difference in the type or magnitude
of the damage to the collagen. Broz et al. observed an analogous heterogeneous structure
after immersion of bovine bone blocks in sodium hypochlorite, with the outer anorganic
layers displaying severely brittle behaviour when compared to the block interior [33]. The
authors determined that the bleach deproteinization occurred primarily along the bone-fluid
interface and to a much lesser extent within the specimen cross-section.
The exact changes that occur in the collagen as a result of KOH treatment are not well
understood. A minimal amount of collagen was observed to be solubilized. However, the
presence of crosslinks and the intimate apposition of collagen and mineral in bone may
prevent solubilization, even if the polypeptide chains are significantly damaged by alkaline
hydrolysis. In addition, the high pH is likely to result in conformational changes to the
collagen. Possible mechanisms for the altered mechanical properties are discussed below.
3.4.3. Effect of KOH treatment on bone ductility and toughness
Collagen is the component of bone that is associated with ductility and toughness. It has been
shown that a decrease in collagen content result in decreases in toughness [2,3]. In addition,
if the collagen is altered, the toughness may also be affected. Wang et al. [5] denatured the

65
collagen in human cadaver bone using heat and observed substantial decreases in ultimate
strength, elastic modulus, failure strain and toughness. In a transgenic mouse model of
Osteogenesis Imperfecta, a collagen mutation was shown to be associated with reduced post-
yield deformation of bone and consequently reduced toughness in cortical bone [38]. In
addition, a reduction in crosslink density (in rats treated with an inhibitor of collagen cross-
linking) was associated with decreased bone strength and modulus [39]. Finally, the collagen
network tends to become weaker with age, leading to decreased bone toughness [4,39]. This
weaker organic network is influenced by the amount and type of collagen crosslinks, which
vary in maturity and valency [4].
However, in this study, the KOH treated bones behaved in a more ductile manner with
increased KOH treatment time, with increasing strains at fracture and correspondingly
increased toughness. This suggests that the mechanism of action of KOH may differ from
those discussed above. We hypothesize that the observed changes in mechanical properties
(reduced modulus and strength, increased ductility and toughness) may result from partial
debonding between the mineral and organic matrix and/or in situ collagen degradation.
3.4.4. Composite material behaviour
Bone can be considered as a polymeric matrix/mineral-filled composite where the mineral
component affects the stiffness and strength of the bone while the quality of the collagen
phase influences bone toughness [40]. The mechanical properties of any composite material
are influenced by the shape, size, orientation, mechanical properties and volume fraction of
the constituents [41,42]. Interfacial bonding interactions between the constituents of a
composite also play an important role in its mechanical properties [43]. Bundy was the first
to suggest that the quality of bone decreases due to changes in bonding between the bone
mineral and the organic phase [44,45]. Since then, several authors have tested and published
data that support this hypothesis [37,46-59].
Changes to bone mechanical properties that are similar to those observed here (lower elastic
modulus, yield and ultimate stress and higher ultimate strain and toughness) were shown to
result from in vitro immersion of bone specimens in concentrated fluoride or phosphate ion

66
solutions for several days [46-50]. The authors attributed these alterations to compromised
interfacial bonding between the bone mineral and collagen as a result of the ability of the free
F- and PO43- ions to compete with the negative domains of organic constituents for the
binding sites on the bone mineral surface. This competition may break or partially debond
the links between the mineral and matrix.
Kotha and Guzelsu developed a simple shear lag model to analyze the stress transfer between
the mineral and organic components of bone in order to investigate the mineral-collagen
interface [51]. They focused on the bone mineral-organic tissue interactions by investigating
the effect of interphase mechanical properties and bonding on the mechanical properties of
bone. Their model showed that a composite with lower bonding would have decreased elastic
modulus, yield and ultimate stresses while the ultimate strain is increased [51]. They
concluded that bone with less bonding between the mineral and the organic phase would
become more ductile. This is very similar to our observations and suggests a mechanism for
the significant alteration of mechanical properties in the absence of geometric or
compositional changes.
Adsorption of the organic matrix to bone mineral may also depend upon electrostatic bonds
[52]. Gupta et al. recently showed that the plastic deformation in bone is characterized by a
very small activation enthalpy that is lower than the energy required to break typical covalent
bonds but much higher than the energy of hydrogen bonds [53]. Based on these values, the
authors postulated that the plastic (post-yield) deformation in bone might be associated with
the disruption of electrostatic or ‘sacrificial’ bonds within or between molecules in the
extrafibrillar matrix of bone [53]. These ‘sacrificial’ bonds have also been postulated to be
partially responsible for the toughness of bone [54,55]. These sacrificial bonds may be the
reason for the observed increase in toughness.
The pH of the bone may also affect mineral-organic interactions [56,57]. At high pH, the
surface charges of the mineral and organic components become negative, which establishes a
different and electrostatically unfavourable condition for mineral-collagen interactions,
leading to reduction in interfacial bonding [58]. This change in mineral-collagen interactions

67
caused by alkalinity may have taken place within the emu bones given that the 1 M KOH
solution had a pH of 14 for the duration of the treatment.
Therefore, we hypothesize that the interface between the mineral and collagen matrix may be
partially compromised by the KOH solution. It is well-known that the interface in composite
materials plays a major role in governing specific properties such as compressive and shear
behaviour, fracture modes and toughness, as well as stress transfer from externally applied
loads to the reinforcement phase [41,59]. The observed changes in the mechanical properties
of endocortically treated whole emu bone with increased KOH treatment time is consistent
with composite material theory, which predicts material failure primarily at the interface
between the matrix (collagen) and reinforcing phase (mineral) [41].
3.4.5. Sex differences
The mechanical properties of the untreated (0-day) and control specimens (14-day filled with
saline) are similar to results reported in the literature. Reed and Brown [20] measured the
elastic modulus and strength of emu cortical bone (femur, unknown gender) in four-point
bending. They reported that the elastic modulus was 13.1 ± 3.9 GPa, the yield stress was
113.1 ± 29.2 MPa and the ultimate strength was 146.9 ± 32.2 MPa. In this study, the elastic
modulus, yield stress and ultimate strength of the female untreated (0-day) samples were
determined to be 16.9 ± 0.4 GPa, 78.8 ± 4.1 MPa and 141.9 ± 5.1 MPa, respectively
(calculated from three-point bending tests). For the male emu bones, the elastic modulus was
17.8 ± 0.6 GPa, the yield stress was 77.9 ± 4.4 MPa and the ultimate strength was 124.7 ± 6.8
MPa. While both female and male results are comparable with the data obtained by Reed and
Brown [20], significant differences were observed between female and male untreated (0-
day) samples. Female emu tibiae had significantly higher cross-sectional geometry, mass,
BMD and BMC values as well as ultimate stress and failure stress compared to male emu
tibiae. However, male emu tibiae had significantly higher failure strain and post-yield strain
compared to female emu tibiae. As such, male emu tibiae behave in a more ductile manner
than female emu tibiae. This is consistent with the larger size of female emus relative to
males [18]. Furthermore, the brittle behaviour of female emu bones is supported by the
significantly higher BMD and BMC values.

68
There were significant differences observed in the plastic deformation regions between KOH
treated female and male bones. More specifically, male bones had significantly decreased
failure stress and increased failure strain and toughness with increasing KOH treatment times
compared to female bones. In other words, the male emu bones were able to resist
deformation longer and absorb more energy before fracturing. This was an unexpected result,
given that female emu bones are larger and heavier than their male counterparts [18].
However, structural differences may be responsible for the increased post-yield behaviour in
male emu tibiae compared to female emu tibiae where the collagen and/or interface between
the mineral and collagen in female bones may be easier to alter.
Fracture prevalence and incidence are known to differ between the sexes. The resistance of
bone to fracture depends on both its structural characteristics (connectivity and architecture)
and its material characteristics (mineralization and composition) [60]. Seeman has shown that
at any adult age, a lower proportion of men have fractures than women [61]. Panagiotopoulos
et al. recently conducted a cadaveric biomechanical study investigating the impact load
application on strips of bone in relation to age and sex [62]. They found significant
differences in fracture energy absorption (toughness) between the young male and female
groups, whereas the values observed for the older male groups did not significantly differ
from the female groups [62]. Sex affected the fracture energy absorption in the young, with
young males having a higher value. This is in agreement with our results, where the male
emu tibiae had increased failure strain and toughness with increased KOH treatment time
compared to female bones. Panagiotopoulos et al. attributed their results to the fact that bone
strength is not directly dependent on bone density and mass but also on bone microstructure
[62]. Structural differences between the female and male emu tibiae may be responsible for
the significant differences observed in mechanical properties in the plastic deformation
region however, the quality of neither the organic phase nor the bonding between the mineral
and organic phases were addressed in this study and may also be factors.
3.4.6. Clinical tools
Ex vivo mechanical testing of bone samples provides direct measures of the mechanical
properties of bone, which are normally inferred from non-invasive clinical measurements. In

69
this study, KOH treatment of bone altered the properties of the collagen, leading to impaired
mechanical properties as measured by three-point bending tests. This is consistent with other
studies [3-5,63]. These changes were not observed using DXA or QUS. As the composition
of the bone was largely unaltered, the BMD (as measured by DXA) would be unaffected.
The relative insensitivity of DXA to bone quality, rather than just mineral content, suggests
that it may be limited as a clinical tool to predict fracture risk. Similarly, no changes were
observed in the SOS, as measured by QUS. This may be due to a similar insensitivity to bone
quality. With this particular technique however, it may also be an artifact of the specific
treatment protocol used here. It has been shown that QUS measurements depend on the
thickness and density of cortical bone but is more strongly influenced by the density of the
cortex near the periosteal surface than by the endocortex [64]. As the bones were degraded
from the medullary canal towards the periosteum, the acoustic signal may not have
penetrated deeply enough to detect the changes in degraded bone properties [9]. In contrast to
both DXA and QUS, the change in modulus measured by MRTA closely paralleled that
measured by mechanical testing. This is likely due to the ability of the MRTA to provide a
direct measure of the cross-sectional bending stiffness (EI), which is a mechanical property
of long bones [9,10]. This suggests that the MRTA should be further investigated for its use
as a clinical tool. It is a non-invasive test that may more effectively integrate factors that
contribute to bone quality – geometry, mineral content and the amount and characteristics of
the organic component of bone.
3.5. Conclusions
The deleterious effect of KOH treatment on the mechanical properties of bone is apparent
from our findings and those of preceding investigations [27,30-31]. As only a negligible
amount of collagen was removed during this treatment, it is proposed that the observed
impairment of mechanical properties results from in situ collagen degradation and/or
interfacial debonding. Unfortunately, conventional fracture risk screening tools (DXA and
QUS) could not detect this reduction in mechanical integrity. However, this study
demonstrated that the MRTA is capable of detecting the changes in bone mechanical
properties induced by changes in collagen quality and could therefore be a more effective
clinical tool for predicting fracture risk.

70
3.6. Chapter Summary
Through the use of a unique animal model, female and male emu whole tibiae were
endocortically treated with 1 M KOH solution for 1-14 days, resulting in negligible collagen
loss (0.05%), bone mass loss (0.5%), no differences in geometrical parameters and bone
mineral content, but significant changes in mechanical properties. Specifically, KOH treated
samples showed significant decreases in modulus and failure stress and increases in failure
strain and toughness. These changes were more significant in male bones compared to female
bones. The MRTA detected these changes whereas DXA and QUS did not.
The significant changes in bone mechanical properties in this unique emu model resulted in
KOH treated bones behaving in a more ductile manner. This result is a contradiction to
previous studies. Previous studies that have affected collagen have shown a more brittle-like
behaviour [2-5]. As a result, it is hypothesized that the significant changes in bone
mechanical properties may be due to in situ collagen degradation rather than collagen
removal and/or partial debonding between the mineral and organic matrix.

71
3.7. References
[1] Boskey A. (2001) Bone Mineralization. In: Cowin SC, editor. Bone Mechanics Handbook. CRC Press. Boca Raton. Florida. pp. 1-33.
[2] Kaplan FS, Hayes WC, Keaveny TM, Boskey A, Einhorn TA, Iannotti JP. (1994) Form and
Function of Bone. In: Simon SR, editor. Orthopaedic Basic Science. American Academy of Orthopaedic Surgeons. Rosemont. Illinois. pp. 129-138.
[3] Burr DB. (2002) The contribution of the organic matrix to bone's material properties. Bone.
31:8-11. [4] Wang X, Shen X, Li X, Agrawal CM. (2002) Age-related changes in the collagen network
and toughness of bone. Bone. 31:1-7. [5] Wang X, Li X, Bank RA, Agrawal CM. (2002) Effects of collagen unwinding and cleavage
on the mechanical integrity of the collagen network in bone. Calcif.Tissue.Int. 71:186-192. [6] Cefalu CA. (2004) Is bone mineral density predictive of fracture risk reduction?
Curr.Med.Res.Opin. 20:341-349. [7] Cummings SR, Karpf DB, Harris F, Genant HK, Ensrud K, LaCroix AZ, Black DM. (2002)
Improvement in spine bone density and reduction in risk of vertebral fractures during treatment with antiresorptive drugs. Am.J.Med. 112:281-289.
[8] Genant HK, Engelke K, Fuerst T Gluer CC, Grampp S, Harris ST, Jerqas M, Lang T, Lu Y,
Majumdar S, Mathur A, Takada M. (1996) Noninvasive assessment of bone mineral and structure: state of the art. J.Bone.Miner.Res. 11:707-730.
[9] Djokoto C, Tomlinson G, Waldman S, Grynpas M, Cheung AM. (2004) Relationship among
MRTA, DXA, and QUS. J.Clin.Densitom. 7:448-456. [10] Roberts SG, Hutchinson TM, Arnaud SB, Kiratli BJ, Martin RB, Steele CR. (1996)
Noninvasive determination of bone mechanical properties using vibration response: a refined model and validation in vivo. J.Biomech. 29:91-98.
[11] Norrdin RW, Simske SJ, Gaarde S, Schwardt JD, Thrall MA. (1995) Bone changes in
mucopolysaccharidosis VI in cats and the effects of bone marrow transplantation: mechanical testing of long bones. Bone. 17:485-489.
[12] Hutchinson TM, Bakulin AV, Rakhmanov AS, Martin RB, Steele CR, Arnaud SB. (2001)
Effects of chair restraint on the strength of the tibia in rhesus monkeys. J.Med.Primatol. 30:313-321.
[13] Myburgh KH, Charette S, Zhou L, Steele CR, Arnaud S, Marcus R. (1993) Influence of
recreational activity and muscle strength on ulnar bending stiffness in men. Med.Sci.Sports.Exerc. 25:592-596.
[14] Hutchinson TM, Steele CR, Snow-Harter R, Whalen RT, Marcus R, Arnaud SB. (1994)
Bending stiffnesss in the tibia of healthy men aged 26-51 years. Med.Sci.Sports.Exerc. 26:S21.

72
[15] Smith SR, Burshell J, Lindberg J, Bober M, Davies MJ. (1994) Adaptation of bone in a kindred with osteogenesis imperfecta. J.Bone.Miner.Res. 9:S424.
[16] Kiebzak GM, Box JH, Box P. (1999) Decreased ulnar bending stiffness in osteoporotic
Caucasian women. J.Clin.Densitom. 2:143-152. [17] McCabe F, Zhou LJ, Steele CR, Marcus R. (1991) Noninvasive assessment of ulnar bending
stiffness in women. J.Bone.Miner.Res. 6:53-59. [18] Maloney SK, Dawson TJ. (1993) Sexual dimorphism in basal metabolism and body
temperature of a large bird, the emu. Condor. 95:1034-1037. [19] Conzemius MG, Brown TD, Zhang Y, Robinson RA. (2002) A new animal model of femoral
head osteonecrosis: one that progresses to human-like mechanical failure. J.Orthop.Res. 20:303-309.
[20] Reed KL, Brown TD. (2001) Elastic modulus and strength of emu cortical bone.
Iowa.Orthop.J. 21:53-57. [21] Davies SJJF. (2002) Ratites and Tinamous. Oxford University Press. New York. [22] Woessner JF Jr. (1976) Determination of hydroxyproline in connective tissues. In: Hall D,
editor. The methodology of connective tissue research. Joynson-Bruvvers Ltd. Oxford. pp. 227-233.
[23] Walsh BJ, Thornton SC, Penny R, Breit SN. (1992) Microplate reader-based quantitation of
collagens. Anal.Biochem. 203:187-190. [24] Vachon AM, Keeley FW, McIlwraith CW, Chapman P. (1990) Biochemical analysis of
normal articular cartilage in horses. Am.J.Vet.Res. 51:1905-1911. [25] Sinha RK, Shah SA, Hume EL, Tuan RS. (2002) The effect of a 5-day space flight on the
immature rat spine. Spine.J. 2:239-243. [26] Nyman JS, Reyes M, Wang X. (2005) Effect of ultrastructural changes on the toughness of
bone. Micron. 36:566-582. [27] Abe K, Hashizume H, Ushiki T. (1992) An EDTA-KOH method to expose bone cells for
scanning electron microscopy. J.Electron.Microsc.(Tokyo). 41:113-115. [28] Turner CH, Burr DB. (1993) Basic biomechanical measurements of bone: a tutorial.
Bone.14:595-608. [29] Jee WSS. (2001) Integrated Bone Tissue Physiology. In: Cowin SC, editor. Bone Mechanics
Handbook. CRC Press. Boca Raton. Florida. pp. 1-68. [30] Arsenault AL. (1990) Vascular canals in bovine cortical bone studied by corrosion casting.
Calcif.Tissue Int. 47:320-325. [31] Lin TC, Su CY, Chang CS. (1997) Stereomorphologic observation of bone tissue response to
hydroxyapatite using SEM with the EDTA-KOH method. J.Bone.Miner.Res. 36:91-97.

73
[32] Carter DH, Scully AJ, Heaton DA, Young MP, Aaron JE. (2002) Effect of deproteination on bone mineral morphology: implications for biomaterials and aging. Bone. 31:389-395.
[33] Broz JJ, Simske SJ, Corley WD, Greenberg AR. (1997) Effects of deproteinization and
ashing on site-specific properties of cortical bone. J.Mater.Sci.Mater.Med. 8:395-401. [34] Ushiki T, Chizuka I. (1987) Scanning electron microscopic studies of the myelinated nerve
fibres of the mouse sciatic nerve with special reference to the Schwann cell cytoplasmic network external to the myelin sheath. J.Neurocytol. 16:737-747.
[35] Miller BG, Woods RI, Bohlen HG, Evan AP. (1982) A new morphological procedure for
viewing microvessels: a scanning electron microscopic study of the vasculature of small intestine. Anat.Rec. 203:493-503.
[36] Johnson GS, Mucalo MR, Lorier MA. (2000) The processing and characterization of animal-
derived bone to yield materials with biomedical applications: Part 1: modifiable porous implants from bovine condyle cancellous bone and characterization of bone materials as a function of processing. J.Mater.Sci.Mater.Med. 11:427-441.
[37] Moreno EC, Kresak M, Hay DI. (1984) Adsorption of molecules of biological interest onto
hydroxyapatite. Calcif.Tissue.Int. 36:48-59. [38] Jepsen KJ, Goldstein SA, Kuhn JL, Schaffler MB, Bonadio J. (1996) Type-I collagen
mutation compromises the post-yield behavior of Mov13 long bone. J.Orthop.Res. 14:493-499.
[39] Oxlund H, Barckman M, Ortoft G, Andreassen TT. (1995) Reduced concentrations of
collagen cross-links are associated with reduced strength of bone. Bone. 17:365S-371S. [40] Turner CH. (2006) Bone strength: current concepts. Ann.N.Y.Acad.Sci. 1068:429-446. [41] Jones RM. (1999) Mechanics of composite materials. Taylor & Francis. Philadelphia. [42] Piekarski K. (1973) Analysis of bone as a composite material. Int.J.Eng.Sci. 11:557-565. [43] Monette L, Anderson MP, Grest GS. (1993) Effect of interphase modulus and cohesive
energy on the critical aspect ratio in short-fibre composites. J.Mater.Sci. 28:79-99. [44] Bundy KJ. (1985) Determination of mineral-organic bonding effectiveness in bone--
theoretical considerations. Ann.Biomed.Eng. 13:119-135. [45] Bundy KJ. (1989) Composite Material Models for Bone. In: Cowin SC, editor. Bone
Mechanics. CRC Press. Boca Raton. Florida. pp. 197-208. [46] Walsh WR, Guzelsu N. (1993) The role of ions and mineral-organic interfacial bonding on
the compressive properties of cortical bone. Biomed.Mater.Eng. 3:75-84. [47] Walsh WR, Guzelsu N. (1994) Compressive properties of cortical bone: mineral-organic
interfacial bonding. Biomater. 15:137-145.
74
[48] Walsh WR, Ohno M, Guzelsu N. (1994) Bone composite behaviour: effects of mineral-organic bonding. J.Mater.Sci.Mater.Med. 5:72-79.
[49] Kotha SP, Walsh WR, Pan Y, Guzelsu N. (1998) Varying the mechanical properties of bone
tissue by changing the amount of its structurally effective bone mineral content. Biomed.Mater.Eng. 8:321-334.
[50] DePaula CA, Abjornson C, Pan Y, Kotha SP, Koike K, Guzelsu N. (2002) Changing the
structurally effective mineral content of bone with in vitro fluoride treatment. J.Biomech. 35:355-361.
[51] Kotha SP, Guzelsu N. (2000) The effects of interphase and bonding on the elastic modulus of
bone: changes with age-related osteoporosis. Med.Eng.Phys. 22:575-585. [52] Pearce EI. (1981) Ion displacement following the adsorption of anionic macromolecules on
hydroxyapatite. Calcif.Tissue.Int. 33:395-402. [53] Gupta HS, Fratzl P, Kerschnitzki M, Benecke G, Wagermaier W, Kirchner HO. (2007)
Evidence for an elementary process in bone plasticity with an activation enthalpy of 1 eV. J.R.Soc.Interface. 4:277-282.
[54] Thompson JB, Kindt JH, Drake B, Hansma HG, Morse DE, Hansma PK. (2001) Bone
indentation recovery time correlates with bond reforming time. Nature. 414:773-776. [55] Fantner GE, Hassenkam T, Kindt JH, Weaver JC, Birkedal H, Pechenik L, Cutroni JA,
Cidade GA, Stucky GD, Morse DE, Hansma PK. (2005) Sacrificial bonds and hidden length dissipate energy as mineralized fibrils separate during bone fracture. Nat.Mater. 4:612-616.
[56] Boskey AL. (1992) Mineral-matrix interactions in bone and cartilage. Clin.Orthop.Relat.Res.
244-274. [57] Tye CE, Hunter GK, Goldberg HA. (2005) Identification of the type I collagen-binding
domain of bone sialoprotein and characterization of the mechanism of interaction. J.Biol.Chem. 280:13487-13492.
[58] Walsh WR, Labrador DP, Kim HD, Guzelsu N. (1994) The effect of in vitro fluoride ion
treatment on the ultrasonic properties of cortical bone. Ann.Biomed.Eng. 22:404-415. [59] Weiner S, Wagner D. (1998) The material bone: structure-mechanical function relations.
Annu.Rev.Mater.Sci. 28:271-298. [60] Seeman E, Delmas PD. (2006) Bone quality--the material and structural basis of bone
strength and fragility. N.Engl.J.Med. 354:2250-2261. [61] Seeman E. (2001) Unresolved issues in osteoporosis in men. Rev.Endocr.Metab.Disord. 2:45-
64. [62] Panagiotopoulos E, Kostopoulos V, Tsantzalis S, Fortis AP, Doulalas A. (2005) Impact
energy absorption by specimens from the upper end of the human femur. Injury. 36:613-617.

75
[63] Zioupos P, Currey JD, Hamer AJ. (1999) The role of collagen in the declining mechanical properties of aging human cortical bone. J.Biomed.Mater.Res. 45:108-116.
[64] Prevrhal S, Fuerst T, Fan B, Njeh C, Hans D, Uffmann M, Srivastav S, Genant HK. (2001)
Quantitative ultrasound of the tibia depends on both cortical density and thickness. Osteoporos.Int. 12:28-34.

76
Chapter 4 Fatigue
4.1. Introduction
4.2. Experimental Details
4.2.1. Emu bone samples and KOH treatment 4.2.2. Fatigue testing to failure 4.2.3. Partial fatigue testing 4.2.4. CT 4.2.5. DXA 4.2.6. QUS 4.2.7. MRTA 4.2.8. Three-point bend testing 4.2.9. Microdamage 4.2.10. Statistical analysis
4.3. Results
4.3.1. Effect of KOH treatment on fatigue properties 4.3.2. Microdamage 4.3.3. Effect of partial fatigue testing on BMD, SOS and EI
4.4. Discussion
4.4.1. Fatigue behaviour 4.4.2. Microdamage 4.4.3. Sex differences 4.4.4. Clinical tools
4.5. Conclusions
4.6. Chapter Summary
4.7. References
77
The following chapter has been reprinted with the kind permission of Wiley InterScience and
is currently in press in the Journal of Orthopaedic Research under, “Changes in bone fatigue
resistance due to collagen degradation”. This chapter is a continuation of the work done in
Chapter 3. In this chapter, we further tested the MRTA as a potential tool for the assessment
of bone quality in endocortically treated emu tibiae to be used as a model for determining the
mechanisms by which KOH treatment affects bone fatigue properties.
4.1. Introduction
Bone adapts its mass, architecture and mechanical properties in response to mechanical
loading. While bone is protective against impact, bone is also susceptible to fatigue, a
process by which repetitive loading damages the bone matrix. This repetitive, smaller
loading of bone leads to microcrack formation and accumulation [1]. The fatigue behaviour
of bone resembles that of composite materials, exhibiting a gradual loss of stiffness and
strength throughout cyclic loading due to fatigue damage accumulation [1]. It is well known
that loading of bone introduces small amounts of microdamage which triggers an adaptive
balanced remodeling cycle in healthy bone [2-4]. It has been suggested that bone
microdamage triggers a positive feedback mechanism: microdamage in bone acts as a
stimulus for bone remodeling and remodeling repairs microdamage [5]. However, during
fatigue damage, the remodeling cycle is stimulated, but cannot repair all of the damage
caused by fatigue. Bone accumulates damage over time and eventually fails below its
theoretical strength. When there is time-evolving damage, bone may also experience creep
rupture [1]. Creep is the gradual increase in material strain developed over time when a
material is exposed to a constant stress. Cyclic creep involves the application of a static
force, resulting in permanent (plastic) damage. Creep is a known characteristic of materials
such as polymers [6]. In bone, collagen is abundant and displays polymeric properties [7]. It
has been suggested that the collagen component of bone is responsible for its observed creep
behaviour [8,9]. Since collagen plays a major role in bone biomechanics [10-12], it is
important to identify the role(s) that collagen may have in fatigue fractures.
There is a great deal of interest in developing technologies capable of measuring bone
mechanical properties, such as stiffness, that predict the risk of sustaining a fragility fracture.

78
Current technologies such as dual energy x-ray absorptiometry (DXA) and quantitative
ultrasound (QUS) only measure bone mineral density, a surrogate measure of fracture risk.
Bone fragility depends not only on its mineral content, but also on its matrix properties,
architecture and geometry [13]. Therefore, evaluating the mineral content of bone alone is
insufficient to predict changes in bone quality [14]. An alternative technology for predicting
changes in bone quality is the mechanical response tissue analyzer (MRTA).
The MRTA is a radiation-free, non-invasive instrument that directly measures a bone
mechanical property, the cross-sectional bending stiffness (EI), of long bones. EI is the
product of the elastic modulus, E, and the areal cross sectional moment of inertia, I. Research
has shown that EI of a long bone is predictive of the maximum strength of the bone [15]
thus, measurements of EI can be used to assess bone quality. Furthermore, previous studies
suggest that the determination of EI has the potential to effectively evaluate fracture risk [15-
18].
To study the contribution of collagen to the mechanical properties of bone and the ability of
the MRTA to detect changes in the collagen matrix, we developed a model using the emu
tibiae. In this model, bone collagen was chemically modified with 1 M potassium hydroxide
(KOH) while maintaining the mineral content of bone unaltered [19]. While the KOH
treatment is not physiological, it helps to understand the mechanisms by which collagen
degradation affects bone mechanical properties. The emu tibia was chosen due to its size and
approximate cylindrical shape, making it ideal for devices designed to accommodate human
long bones.
To further determine the contribution of collagen on the mechanical properties of bone, we
investigated the effects of KOH treatment on the fatigue resistance of female and male emu
bone, as controlled cyclic loading of bone is known to significantly reduce bone stiffness and
cause damage [4]. The objectives of this study were two-fold: to investigate changes in
fatigue properties of bone due to collagen modification by endocortical KOH treatment and
to investigate the ability of the MRTA, DXA and QUS to detect changes in bone fatigue
resistance of untreated and KOH treated bone.

79
4.2. Experimental Details
4.2.1. Emu bone samples and KOH treatment
Emu bone tibiae samples were prepared and treated as described previously [19]. Briefly,
skeletally mature (3-5 years of age) whole female and male emu tibiae were carefully
separated from the femora and tarsometatarsi with a scalpel. A circular saw was then used to
remove the ends (15% of the total bone length from the proximal end and 10% from the
distal end) of each tibiae. The marrow and trabecular bone from the diaphysis of the tibiae
were removed by drilling longitudinally through the bone shaft, after which the medullary
canal was flushed with tap water [19]. Finally, the skin and overlying tissue were carefully
removed with a scalpel. The bones were individually wrapped in saline-soaked gauze and
frozen at -20 °C until use. All bone samples were allowed to thaw at room temperature for
three hours prior to analysis.
Bones were divided into two groups: the first group (female and male right tibiae) was KOH
treated for 0, 1, 3, 7 or 14 days and then fatigued to failure. The second group (female and
male right tibiae) was KOH treated at the same time points and then partially fatigued. Partial
fatigue testing refers to specimens fatigued to induce stiffness loss without fracture
(described below). Partial fatigue was undertaken to evaluate the effects of stiffness loss on
the measurements made by the MRTA, DXA and QUS bone analysis techniques. In each
group, two additional 14-day groups of female and male bones were filled with saline instead
of KOH to serve as controls. Table 4.1 shows the sample size (n) for each group.
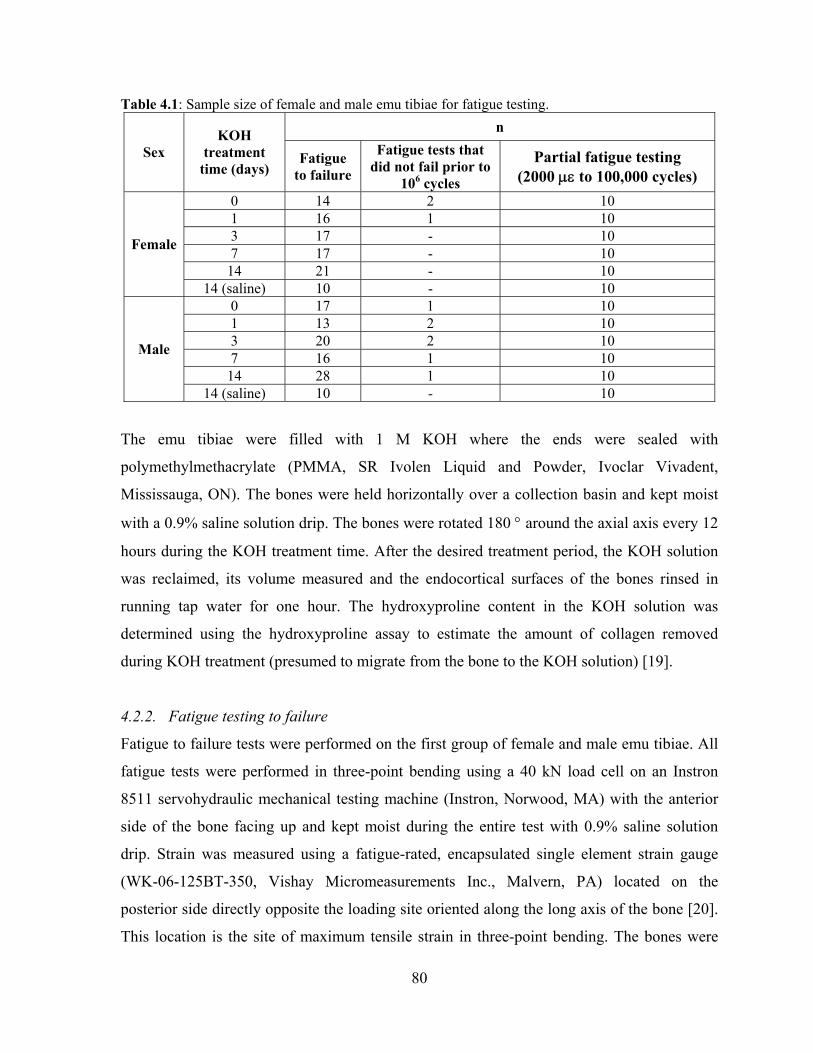
80
Table 4.1: Sample size of female and male emu tibiae for fatigue testing. n
Sex KOH
treatment time (days)
Fatigue to failure
Fatigue tests that did not fail prior to
106 cycles
Partial fatigue testing (2000 με to 100,000 cycles)
0 14 2 10 1 16 1 10 3 17 - 10 7 17 - 10
14 21 - 10
Female
14 (saline) 10 - 10 0 17 1 10 1 13 2 10 3 20 2 10 7 16 1 10
14 28 1 10
Male
14 (saline) 10 - 10
The emu tibiae were filled with 1 M KOH where the ends were sealed with
polymethylmethacrylate (PMMA, SR Ivolen Liquid and Powder, Ivoclar Vivadent,
Mississauga, ON). The bones were held horizontally over a collection basin and kept moist
with a 0.9% saline solution drip. The bones were rotated 180 ° around the axial axis every 12
hours during the KOH treatment time. After the desired treatment period, the KOH solution
was reclaimed, its volume measured and the endocortical surfaces of the bones rinsed in
running tap water for one hour. The hydroxyproline content in the KOH solution was
determined using the hydroxyproline assay to estimate the amount of collagen removed
during KOH treatment (presumed to migrate from the bone to the KOH solution) [19].
4.2.2. Fatigue testing to failure
Fatigue to failure tests were performed on the first group of female and male emu tibiae. All
fatigue tests were performed in three-point bending using a 40 kN load cell on an Instron
8511 servohydraulic mechanical testing machine (Instron, Norwood, MA) with the anterior
side of the bone facing up and kept moist during the entire test with 0.9% saline solution
drip. Strain was measured using a fatigue-rated, encapsulated single element strain gauge
(WK-06-125BT-350, Vishay Micromeasurements Inc., Malvern, PA) located on the
posterior side directly opposite the loading site oriented along the long axis of the bone [20].
This location is the site of maximum tensile strain in three-point bending. The bones were

81
secured in the jig with a 100 N pre-load and fatigued at a frequency of 2 Hz (physiological
frequency) [21] under load control, corresponding to a set of initial strains ranging from 1500
microstrain to 6000 microstrain peak-to-peak [22]. Time, load, displacement and strain were
acquired using an HBM Spider 8 data acquisition system (HBM, Darmstadt, Germany) at
100 Hz. Data files were exported to ASCII files for subsequent analysis using custom written
LabVIEW code (version 5.0.1, National Instruments, Austin, TX) and Excel 2000
(Microsoft, WA) spreadsheets [20].
The custom-written LabVIEW code sampled the fatigue data files in the time domain every
ith cycle based on the length of the test (i=1 for <5,000 cycles, i=18 for 5,000-10,000 cycles,
i=36 for 10,000-100,000 cycles, i=72 for >100,000 cycles) and provided the following data:
the cycle number (i), time (t), minimum strain (εmin), maximum strain (εmax), minimum stress
(σmin), maximum stress (σmax), secant modulus (E), damage index (DI) and creep strain
(εcreep). The number of cycles to failure (N) was recorded at the end of each test [20].
Data were normalized to eliminate differences caused by geometrical variation. Computed
Tomography (CT) scans were taken at the mid-point of each emu tibia with an Aquilion 64
CT scanner (Toshiba, Canada). Cortical thickness (mm), cross-sectional area (mm2), distance
from the neutral axis to the furthest point in tension (mm) and second moment of area in
bending orientation (mm4) were then measured from these binarized images using image
analysis software (ImageJ 1.28u, National Institutes of Health). Stress (σ; MPa) was
calculated using the following equation [23]:
where F is the measured load (N), L is the span of the lower supports (24 cm), c is the
distance from the neutral axis to the furthest point in tension adjacent to the strain gauge
(mm) and Ixx is the second moment of area about the neutral axis in the bending orientation
(mm4).
xxIcLFσ
4⋅⋅
=
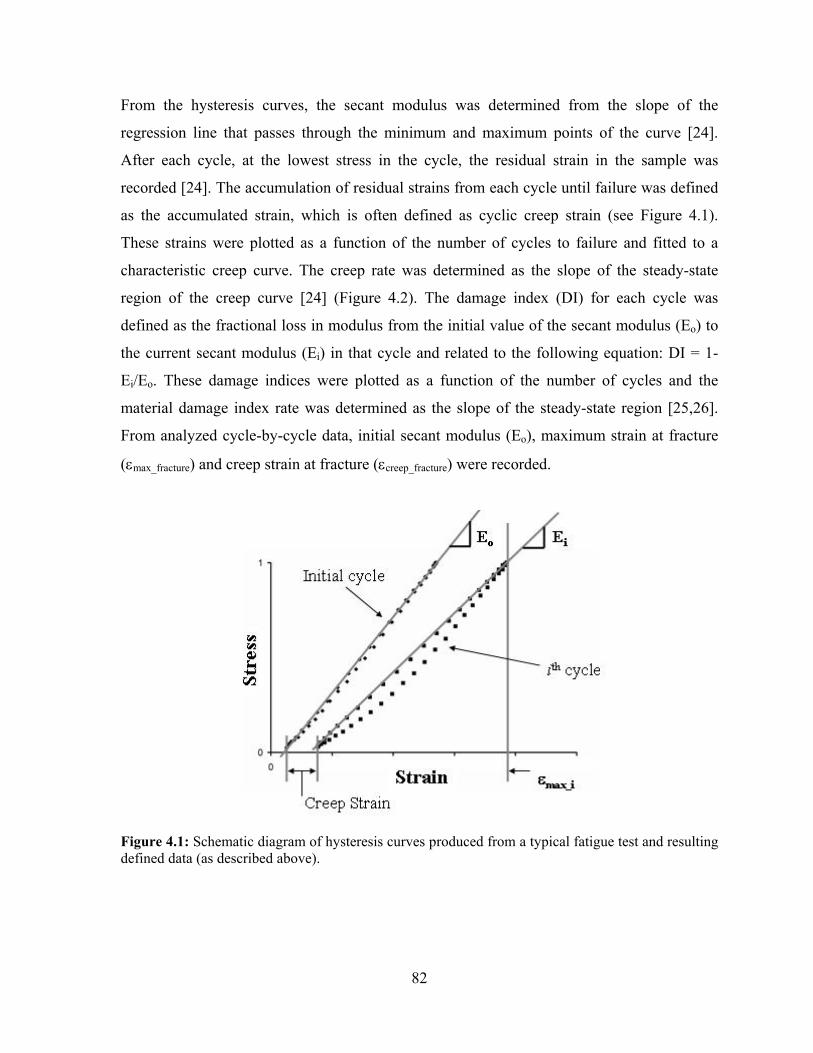
82
From the hysteresis curves, the secant modulus was determined from the slope of the
regression line that passes through the minimum and maximum points of the curve [24].
After each cycle, at the lowest stress in the cycle, the residual strain in the sample was
recorded [24]. The accumulation of residual strains from each cycle until failure was defined
as the accumulated strain, which is often defined as cyclic creep strain (see Figure 4.1).
These strains were plotted as a function of the number of cycles to failure and fitted to a
characteristic creep curve. The creep rate was determined as the slope of the steady-state
region of the creep curve [24] (Figure 4.2). The damage index (DI) for each cycle was
defined as the fractional loss in modulus from the initial value of the secant modulus (Eo) to
the current secant modulus (Ei) in that cycle and related to the following equation: DI = 1-
Ei/Eo. These damage indices were plotted as a function of the number of cycles and the
material damage index rate was determined as the slope of the steady-state region [25,26].
From analyzed cycle-by-cycle data, initial secant modulus (Eo), maximum strain at fracture
(εmax_fracture) and creep strain at fracture (εcreep_fracture) were recorded.
Figure 4.1: Schematic diagram of hysteresis curves produced from a typical fatigue test and resulting defined data (as described above).

83
Figure 4.2: Schematic diagram of characteristic creep curve observed during fatigue testing showing the three characteristic stages: an initial fast strain rise (Stage I), a steady-state region (Stage II) and a final fast increase to failure (Stage III). The creep rate data reported in this study is the steady-state creep rate in Stage II.
4.2.3. Partial fatigue testing
Based on the data collected from fatigue to failure testing, the second group of emu tibiae
(control, untreated and KOH treated) was fatigued at a lower strain (2000 με) to a set number
of cycles (100,000) to induce a reduction in stiffness but not fracture. This strain level was
selected to avoid permanent crushing at the loading and support points on the bones.
Therefore, after the desired treatment period (control (14-day filled with saline), untreated (0-
day), 1, 3, 7 or 14 day KOH treatment), this second group of emu tibiae were then assessed
using CT, DXA, QUS, MRTA and three-point bending. Next, the emu tibiae were subjected
to partial fatigue testing and subsequently re-assessed using CT, DXA, QUS, MRTA and
three-point bending.
4.2.4. CT
Computed Tomography (CT) scans were taken at the mid-point of each emu tibia with an
Aquilion 64 CT scanner (Toshiba, Canada). External anterior-posterior and medial-lateral
diameters (mm), cortical thickness (mm), cross-sectional area (mm2), distance from the
neutral axis to the furthest point in tension (mm) and second moment of area in bending
Slope = creep rateC
reep
Str
ain
Time or Number of Cycles
εcreep_fracture
Stage II Stage III
Stage I
Slope = creep rateC
reep
Str
ain
Time or Number of Cycles
Slope = creep rateC
reep
Str
ain
Time or Number of Cycles
εcreep_fracture
Stage II Stage III
Stage I

84
orientation (mm4) were then measured from these binarized images using image analysis
software (ImageJ 1.28u, National Institutes of Health).
4.2.5. DXA
The bone mineral density (BMD) was measured by DXA on a Lunar Prodigy Advance
system (General Electric, Madison, WI) using the ‘L-Spine’ mode. The region of interest for
this scan was 24 cm and thus, a 24 cm region at the centre of each tibial diaphysis was
demarcated with a permanent marker in order to ensure that the scanned section of the bone
specimens was consistent and reproducible.
4.2.6. QUS
Speed of sound (SOS) measurements were obtained with a Sunlight Omnisense QUS device
(Sunlight Medical Ltd., Tel-Aviv, Israel). Measurements were taken at the centre of the 24
cm region of interest, defined by the DXA analysis, using a hand-held probe with ultrasound
gel to acoustically couple the probe to the bone.
4.2.7. MRTA
The MRTA measures the cross-sectional bending stiffness (EI) of long bones by applying a
low frequency (0 to 1600 Hz) vibration to the skin surface, which is transmitted to the bone
using an electromagnetic shaker with an impedance head probe and tip. A transducer
connected to the probe measures the force and acceleration response from the bone. The
bone is modeled as a beam in three-point bending and the force and acceleration values are
used to calculate EI [15,19]. MRTA measurements were taken at the centre of the 24 cm
region of interest defined by the DXA analysis. Five replicates of the EI measurements were
taken for each specimen.
4.2.8. Three-point bend testing
All bones assigned to partial fatigue testing were tested non-destructively in the elastic
region to determine the elastic modulus. The bones were secured in the three-point bending
jig with a 100 N pre-load and then loaded at a displacement rate of 0.04 mm/s to a maximum
of 1000 N, avoiding permanent damage [19]. After static testing, the specimens were tested

85
in cyclic three-point bending at a frequency of 2 Hz under load control at a strain of 2000 με
to 100,000 cycles to induce stiffness loss. After partial fatigue testing, static pre-yield three-
point bending tests were conducted again, as described above. These values were used to
determine the percent change in modulus as measured by the MRTA and three-point bending
techniques.
4.2.9. Microdamage
For each bone fatigued to failure at 2000 microstrain and 4000 microstrain in each group, ten
mm thick cross-sections of bone were cut and subsequently divided into four sections:
anterior, posterior, medial and lateral. Sections were taken as close as possible to the fracture
surface without including any part of the fractured material. Samples were stained following
a modified version of Burr and Stafford’s [27] amendment of the basic fuchsin method of
Frost [28]. This technique stains pre-existing microcracks in bone prior to histological
embedding and sectioning, allowing them to be differentiated from any damage introduced
during subsequent tissue processing. Initial experiments attempting to infiltrate samples in
1% basic fuchsin (J.T. Baker, Phillipsburg, NJ, USA, Cat. #B660-03) in 70% to 100%
ethanol proved unsuccessful. As such, bone samples were dehydrated in ascending
concentrations of acetone that was incorporated with 1% basic fuchsin and subsequently
infiltrated in ascending ratios of unpolymerized Spurr resin and acetone. The bones were
then embedded in blocks of Spurr resin that was polymerized in a 60 °C oven for 48 hours.
From these blocks, two 100 μm thick cross-sections were cut using a low-speed diamond-
wire saw (DDK Diamond Wire Histo-Saw Model 3241, Wilmington, DE). Sections were
mounted on glass slides for microscopic analyses using a Zeiss microscope attached to a
video camera (Retiga 1300) on a Bioquant image analysis system (Bioquant Nova Prime,
version 6.50.10). Magnification was set to 125X. Microcracks were defined as linear
structures with basic fuchsin staining around the cracks [29]. The following
histomorphometric variables were quantified [26]: microcrack mean length (Cr.Le, μm),
bone cortical area (B.Ar, mm2), microcrack density (Cr.Dn, #/mm2) and surface microcrack
density (Cr.S.Dn, μm/mm2).

86
4.2.10. Statistical analysis
Statistical analysis was performed using SPSS (SPSS 16.0 for Windows, Chicago, IL)
statistical analysis software. All data (apart from regressions) are presented as mean ±
standard error of the mean. A confidence level of 95% (p=0.05) was considered statistically
significant for differences and regressions.
Tests for normality and equality of variances were initially performed to determine whether
parametric or non-parametric t-tests should be used. Two-way analysis of variance
(ANOVA, general linear model) was performed to determine whether the two factors of
measurement technique and KOH treatment time interact. The effect of KOH treatment and
sex on geometrical parameters, bone mineral density and microdamage parameters was also
analyzed using two-way ANOVA. Multiple comparisons were made using appropriate post-
hoc tests to detect significant differences between groups. Post hoc pairwise testing utilized
the Fisher’s Least Significant Difference (LSD) test. Generalized linear models were used
when comparing regression lines fit to variables that varied by applied stress or strain
(analysis of covariance and multiple linear regressions). This includes number of cycles to
failure (N), damage index (DI) rate and creep rate versus applied stress/strain and specimen
group (KOH treatment time, sex). Regressions were tested for homogeneity of residual
variances, differences in slope and differences in height.
4.3. Results
Significant differences were found in the fatigue parameters measured in this study between
the untreated groups and the KOH treated groups, but not between sexes. All parameters
measured for the control group (14-day filled with saline) were similar to those of the
untreated (0-day) time point (Appendix A) for both female and male emu bones.
4.3.1. Effect of KOH treatment on fatigue properties
A certain number of bone samples did not fail before the arbitrary yet practical 106 cycle cut-
off value (see Table 4.1). Furthermore, certain fatigue tests were not successful due to strain
gauge debonding or short-circuiting due to saline penetration at some point during the tests.
87
For these tests, the number of cycles to failure versus applied stress data was reliable,
whereas the other parameters were eliminated from further analysis.
Table 4.2 summarizes the significant differences observed between female and male emu
bones prior to fatigue testing. Female emu tibiae had significantly higher BMD (p<0.001)
values compared to male emu tibiae for all groups. CT analysis of all samples at the mid-
diaphysial loading site before fatigue testing showed significant differences in geometrical
properties between sexes. Female emu tibiae had significantly greater thickness (p<0.001),
cortical area (p<0.001) and moment of inertia (p<0.001) compared to male emu tibiae. There
were no differences in these values between KOH treatment groups. Contrary to the BMD
data, there were no differences in initial secant modulus detected between the different
groups and between sexes (Table 4.3). Creep strain and maximum strain at failure also did
not vary between the groups (Table 4.3). KOH treatment resulted in negligible bone mass
loss (Figure 4.3) and collagen loss (Figure 4.4), similar results seen in Chapter 3 – Initial
Study.

Table 4.2: BMD and geometrical parameters of emu tibiae after KOH treatment but prior to fatigue to failure testing. KOH treatment time in days
Parameter
Sex 0 1 3 7 14
Female 1.32 ± 0.03 1.34 ± 0.03 1.30 ± 0.03 1.32 ± 0.03 1.31 ± 0.02 BMD (g/cm2) Male 1.20 ± 0.04a 1.20 ± 0.03a 1.20 ± 0.02a 1.22 ± 0.03a 1.20 ± 0.02a
Female 4.55 ± 0.14 4.72 ± 0.17 4.67 ± 0.10 4.62 ± 0.11 4.57 ± 0.10 Thickness (mm) Male 3.91 ± 0.14a 3.84 ± 0.15a 4.10 ± 0.12a 4.16 ± 0.11a 4.05 ± 0.10a
Female 292 ± 11 301 ± 13 302 ± 8 288 ± 8 288 ± 7 Cortical Area (mm2) Male 251 ± 10a 240 ± 11a 248 ± 9a 245 ± 8a 246 ± 8a
Female 15234 ± 729 14770 ± 851 13732 ± 524 14504 ± 534 14988 ± 524 Moment of Inertia (mm4) Male 11805 ± 685a 11699 ± 755a 11393 ± 631a 12255 ± 554a 12249 ± 524a
Female 11.4 ± 0.3 10.9 ± 0.3 11.0 ± 0.2 10.9 ± 0.2 11.3 ± 0.2 Distance from neutral axis (mm) Male 11.0 ± 0.2 11.0 ± 0.3 10.9 ± 0.2 10.8 ± 0.2 10.6 ± 0.2
ap ≤ 0.05 versus female
Table 4.3: Initial secant modulus, creep strain at fracture and maximum strain at fracture for fatigue to failure emu tibiae. KOH treatment time in days
Parameter
Sex 0 1 3 7 14
Female 24947 ± 1110 27687 ± 946 23460 ± 728 24674 ± 713 24115 ± 1002 Eo (MPa) Male 27821 ± 1139 25311 ± 1155 25708 ± 1221 25116 ± 1159 26412 ± 683
Female 3340 ± 793 3349 ± 562 3470 ± 1183 3927 ± 1592 4109 ± 1115 εcreep_fracture (με) Male 3394 ± 800 3181 ± 868 3736 ± 1114 3518 ± 1024 3690 ± 856
Female 7983 ± 1059 6200 ± 1221 6697 ± 1467 7407 ± 1877 7442 ± 1504 εmax_fracture
(με) Male 6457 ± 814 6378 ± 893 6791 ± 1454 6003 ± 1199 6275 ± 1140
88

89
KOH Treatment Time
1 day 3 day 7 day 14 day
Perc
ent
bone
mas
s ch
ange
(%
)
0.0
0.2
0.4
0.6
0.8
1.0 MaleFemale
Figure 4.3: Percent bone weight loss versus KOH treatment time for female and male fatigue emu tibiae. No differences were observed in the bone weight loss with KOH treatment time or between sexes.
KOH Treatment Time1 day 3 day 7 day 14 day
Perc
ent
colla
gen
loss
(%
)
0.00
0.02
0.04
0.06
0.08
0.10
MaleFemale
Figure 4.4: Percent collagen removed versus KOH treatment time for female and male fatigue emu tibiae. Significant differences were observed in the collagen removed with KOH treatment time but sex was not a factor in collagen removal. Maximum percent collagen removed was negligible (0.05%).

90
In terms of fatigue properties, there was an inverse relationship between stress and number of
cycles to failure for all KOH treatment groups. The number of fatigue cycles to failure decreased
with increasing initial stress for both sexes. The 14-day KOH treated specimens needed
significantly fewer cycles to fail at high stresses (>60 MPa) for both sexes. However, the number
of cycles to failure at low stresses (<60 MPa) was not affected by KOH treatment (Figure 4.5).
The regression slopes were only significantly different between untreated (0-day) and 14-day
KOH treatment groups for female (p=0.024) and male (p=0.019) emu tibiae. No differences were
found in slopes between sexes at all KOH treatment time points. The covariate, stress, was
significantly related to the number of cycles to failure (p<0.001) for both female and male emu
tibiae. There was a significant effect of KOH treatment on number of cycles to failure after
controlling for the effect of stress for both female (p<0.001) and male (p<0.001) emu tibiae. The
regression curves obtained from damage data were found to be statistically significant (p<0.001)
when comparing the untreated (0-day) group to the 14-day KOH treatment group for female and
male bones. No differences were found in fatigue life between sexes at all KOH treatment time
points.
Figure 4.5: Peak stress versus log(N) curves for 0-14 day KOH treatment for (a) female and (b) male emu tibiae. Both female and male 14-day KOH treated samples have a lower resistance to fatigue compared to the other groups at high stresses only (>60 MPa). The number of cycles to failure at lower stresses is not affected by KOH treatment. No differences were seen between sexes. All tests were subjected to a constant minimum stress of 5 MPa.
1 10 100 1000 10000 100000 1000000
50
100
150
2000-day1-day3-day7-day14-day
R2=0.80, p<0.001R2=0.97, p<0.001R2=0.74, p<0.001R2=0.77, p<0.001R2=0.72, p<0.001
R2=0.86, p<0.001R2=0.92, p<0.001R2=0.85, p<0.001R2=0.90, p<0.001R2=0.76, p<0.001
a) Females
Cycles to failure (N)
Pea
k S
tres
s (M
Pa)
b) Males
Cycles to failure (N)
Pea
k S
tres
s (M
Pa)
1 10 100 1000 10000 100000 10000000
50
100
150
2000-day1-day3-day7-day14-day

91
The creep strain and damage index due to fatigue loading exhibited the three characteristic
phases: an initial rapid strain increase, a steady state region and a final rapid increase to failure
(as shown in Figure 4.2). For both sexes, the damage and creep rates showed a positive
correlation with the stress range: high initial stresses resulted in high damage and creep rates
while low initial stresses resulted in low damage index and creep rates. Figure 4.6 and Figure 4.7
show the changes of damage index rate and creep rate as a function of stress, respectively. The
covariate, stress, was significantly related to the damage index rates (p<0.001 for both sexes) as
well as creep rates (p=0.002 for female and p=0.001 for male emu tibiae). Female and male 14-
day KOH treated samples exhibited accelerated damage index and creep rates at high stresses
only (>60 MPa). At low stresses (<60 MPa), female and male emu tibiae damage index and
creep rates were similar for both sexes. Comparison between groups revealed that 14-day KOH
treatment significantly accelerated the damage index rate and creep rate compared to untreated
(0-day) groups for both sexes at high stresses. There was a significant effect of KOH treatment
on damage rate after controlling for the effect of stress for female (p<0.001) and male (p=0.003)
emu tibiae. Similarly, KOH treatment significantly affected the creep rate for female (p<0.001)
and male (p=0.001) bones. No differences were found in damage index and creep rates between
sexes at all KOH treatment time points.
Figure 4.6: Peak stress versus damage index rate curves for 0-14 day KOH treatment for (a) female and (b) male emu tibiae. KOH treatment caused accelerated damage index rates at high stresses only (>60 MPa). The damage index rate at lower stresses is not affected by KOH treatment. No differences were seen between sexes. All tests were subjected to a constant minimum stress of 5 MPa.
R2=0.78, p<0.001R2=0.71, p<0.001R2=0.98, p<0.001R2=0.83, p<0.001R2=0.86, p<0.001
a) Females
Damage index rate (1/sec)
Pea
k S
tres
s (M
Pa)
b) Males
Damage index rate (1/sec)
Pea
k S
tres
s (M
Pa)
R2=0.85, p<0.001R2=0.90, p<0.001R2=0.83, p<0.001R2=0.75, p<0.001R2=0.65, p<0.001
10-910-810-710-610-510-410-310-210-11000
50
100
150
2000-day1-day3-day7-day14-day
10-910-810-710-610-510-410-310-210-11000
50
100
150
2000-day1-day3-day7-day14-day
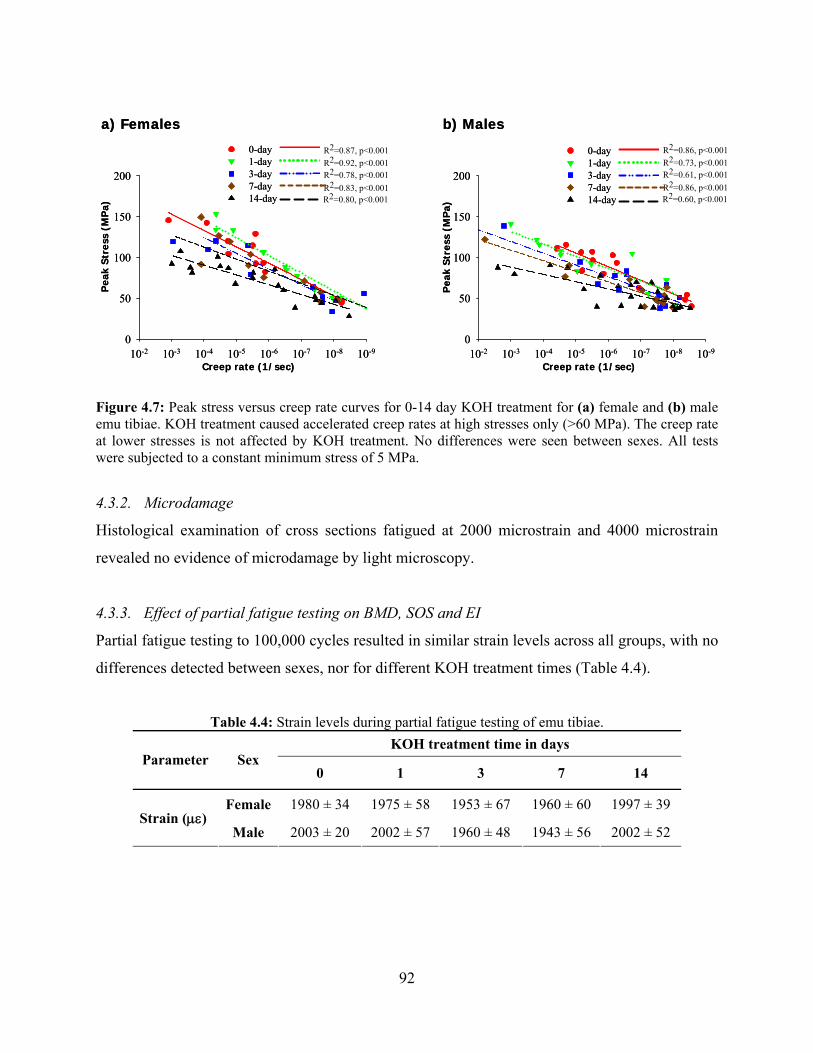
92
Figure 4.7: Peak stress versus creep rate curves for 0-14 day KOH treatment for (a) female and (b) male emu tibiae. KOH treatment caused accelerated creep rates at high stresses only (>60 MPa). The creep rate at lower stresses is not affected by KOH treatment. No differences were seen between sexes. All tests were subjected to a constant minimum stress of 5 MPa.
4.3.2. Microdamage
Histological examination of cross sections fatigued at 2000 microstrain and 4000 microstrain
revealed no evidence of microdamage by light microscopy.
4.3.3. Effect of partial fatigue testing on BMD, SOS and EI
Partial fatigue testing to 100,000 cycles resulted in similar strain levels across all groups, with no
differences detected between sexes, nor for different KOH treatment times (Table 4.4).
Table 4.4: Strain levels during partial fatigue testing of emu tibiae. KOH treatment time in days
Parameter
Sex 0 1 3 7 14
Female 1980 ± 34 1975 ± 58 1953 ± 67 1960 ± 60 1997 ± 39
Strain (με) Male 2003 ± 20 2002 ± 57 1960 ± 48 1943 ± 56 2002 ± 52
R2=0.92, p<0.001R2=0.78, p<0.001R2=0.83, p<0.001R2=0.80, p<0.001
R2=0.87, p<0.001R2=0.73, p<0.001R2=0.61, p<0.001R2=0.86, p<0.001R2=0.60, p<0.001
R2=0.86, p<0.001
a) Females
Creep rate (1/sec)
Pea
k St
ress
(M
Pa)
b) Males
Creep rate (1/sec)
Pea
k S
tres
s (M
Pa)
10-910-810-710-610-510-410-310-20
50
100
150
200
0-day1-day3-day7-day14-day
10-910-810-710-610-510-410-310-20
50
100
150
200
0-day1-day3-day7-day14-day

93
The effect of KOH treatment and bone fatigue was assessed by DXA (BMD), QUS (SOS),
MRTA (EI) and three-point bending before and after partial fatigue testing (2000 με; 100,000
cycles) for all treatment groups for both female (Figure 4.8 (a)) and male (Figure 4.8 (b)) emu
tibiae. There were no differences in BMD or SOS, as measured by DXA and QUS, respectively.
In fact, the measured values after partial fatigue testing varied by less than 1% and 2% between
KOH treatment times for DXA and QUS, respectively, for both sexes. However, there were
significant changes in the modulus of elasticity in all groups, as determined by three-point
bending and by MRTA for both female and male emu tibiae. The average percent modulus
change after partial fatigue testing was similar for all groups for both sexes. In each group, tibiae
lost on average 20% of their stiffness for both sexes. No differences were seen between percent
changes in modulus of elasticity as measured by three-point bending and the MRTA for both
sexes. There were no differences detected in partial fatigue testing between sexes. CT analysis
showed no changes in geometrical properties such as moment of inertia, cortical area and
thickness after partial fatigue testing for untreated and KOH treated groups (Table 4.5) for both
sexes.
Figure 4.8: Percent changes of bone quality measurements after partial fatigue testing (2000 με; 100,000 cycles) reported by the different measurement techniques as a function of KOH treatment time for (a) female and (b) male emu tibiae. No differences were seen between sexes. Significant changes in modulus of elasticity were observed as determined by three-point bending and MRTA for both female and male emu tibiae. DXA and QUS measurements did not detect any changes caused by partial fatigue testing.
0 1 3 7 14-50
-40
-30
-20
-10
0
% Change Modulus (3-point)% Change Modulus (MRTA)% Change BMD (DXA) % Change SOS (QUS)
0 1 3 7 14-50
-40
-30
-20
-10
0
% Change Modulus (3-point)% Change Modulus (MRTA)% Change BMD (DXA)% Change SOS (QUS)
a) Females
KOH Treatment (days)
Per
cen
t C
han
ge (
%)
b) Males
KOH Treatment (days)
Per
cen
t C
han
ge (
%)
0 1 3 7 14-50
-40
-30
-20
-10
0
% Change Modulus (3-point)% Change Modulus (MRTA)% Change BMD (DXA) % Change SOS (QUS)
0 1 3 7 14-50
-40
-30
-20
-10
0
% Change Modulus (3-point)% Change Modulus (MRTA)% Change BMD (DXA)% Change SOS (QUS)
a) Females
KOH Treatment (days)
Per
cen
t C
han
ge (
%)
b) Males
KOH Treatment (days)
Per
cen
t C
han
ge (
%)

94
Table 4.5: Average female and male emu tibiae geometrical parameter changes after KOH treatment and partial fatigue testing.
KOH treatment time in days Parameter
Sex
0 1 3 7 14
Female 0.4 ± 0.9 0.7 ± 0.9 0.3 ± 0.8 0.6 ± 0.8 0.5 ± 0.2 Change in medial-lateral diameter (%) Male 0.6 ± 0.8 0.3 ± 0.4 0.6 ± 0.9 0.5 ± 0.5 0.9 ± 0.6
Female 0.4 ± 0.7 0.3 ± 0.5 0.3 ± 0.3 0.2 ± 0.7 0.7 ± 0.4 Change in anterior-posterior diameter (%) Male 0.7 ± 0.7 0.2 ± 0.4 0.3 ± 0.2 0.3 ± 0.4 0.1 ± 0.9
Female 0.5 ± 0.8 0.8 ± 0.8 0.7 ± 0.5 0.8 ± 0.4 0.8 ± 0.7 Change in cortical thickness (%) Male 1.0 ± 0.9 0.7 ± 0.6 0.5 ± 0.8 0.6 ± 0.5 0.3 ± 0.4
Female 0.4 ± 0.6 0.5 ± 0.4 0.3 ± 0.7 0.8 ± 0.6 0.6 ± 0.5 Change in cortical area (%) Male 0.4 ± 0.4 0.3 ± 0.9 0.3 ± 0.2 0.3 ± 0.9 0.9 ± 0.6
Female 0.4 ± 0.6 0.5 ± 0.4 0.3 ± 0.2 1.0 ± 0.7 0.6 ± 0.3 Change in moment of inertia (%) Male 0.7 ± 0.6 0.6 ± 0.9 0.2 ± 0.9 0.4 ± 0.5 0.5 ± 0.6
4.4. Discussion
The objectives of this study were to determine how emu bone fatigue properties are affected by
KOH treatment, a treatment targeted to affect only the organic component of bone and to
determine if current clinical tools could detect the effects of partial fatigue testing in untreated
and KOH treated bones. Similarly to our previous experiments [19], KOH treatment did not
change the geometry or mineral content of the bone samples and a negligible amount of collagen
was extracted. However, the fatigue properties of the bone were significantly compromised for
bones of both sexes, which suggests that the mechanical contribution of the collagen was
impaired. The mechanical changes induced by partial fatigue testing were observed by the
MRTA, but were not detected with DXA or QUS.
4.4.1. Fatigue behaviour
In both sexes, KOH treated samples need significantly fewer cycles to fail at high stresses (>60
MPa). Analysis of the damage index and creep rates showed that the deterioration rate was
similar for bones of both sexes at all KOH treatment time points and KOH treatment appears to
cause an acceleration in damage index and creep rates at high stresses only (>60 MPa).

95
Cyclic creep may be an important mechanism in the fast deterioration rate of the KOH treated
bones at high stresses and strains, which leads to earlier fatigue failure of KOH treated groups.
Carter and Caler have shown that creep is the major cause of fatigue failure if the bone is loaded
in tension or at high stress (>60 MPa) while crack accumulation causes fatigue failure if the
specimen is loaded in compression or at low stress (<60 MPa) (Figure 4.9) [30]. At high stresses,
cracks will continue to propagate under a sustained load indicating a time-dependent mechanism
[31]. At lower stress intensities, cracks will arrest and cyclic loading is needed to further
propagate the crack [32]. Several studies have suggested that collagen is the phase responsible
for creep in bone [8]. Creep is thought to be a result of debonding of mineral crystals from the
organic matrix resulting in load transfer from the linearly elastic hydroxyapatite to the
viscoelastic collagen matrix, or simply the result of damage to collagen fibrils [8,33-35].
Collagen degradation and disorganization caused by KOH treatment may be the reason for the
observed altered fatigue behaviour at high stresses, since collagen is responsible for the creep
behaviour in bone.

96
0 20 40 60 80 100 120CYCLIC STRESS (MPa)
DA
MA
GE
FR
AC
TIO
N
1.0
0.8
0.6
0.4
0.2
0
INITIAL MAXIMUM STRAIN (mm/mm)0.0 0.001 0.002 0.003 0.004 0.005 0.006
109 108 107 106 105 104 103 102 10 1 0.5
CYCLES TO FAILURE
CREEP
CRACK ACCUMULATION
NORMALLOADING
Figure 4.9: Cumulative damage model showing the transition from creep to crack accumulation behaviour (adapted from [30]).
Conversely, at low stresses, the degraded and disorganized collagen due to KOH treatment may
act as additional microstructural barriers, leading to an increased amount of crack deflection and
thus, resistance to crack propagation. This may be the reason why no significant differences in
fatigue behaviour were observed for bones fatigued at low stresses. In addition, at low stresses,
sacrificial bonds may play a role in bone material properties. Sacrificial bonds are additional,
weak, but reformable bonds found within or between collagen molecules. These bonds break at
lower energies than the stronger collagen backbone bonds, serving to protect the collagen
molecule backbone by dissipating the applied energy [36,37]. The energy absorbed by breaking
the weak sacrificial bonds and the subsequent stretching of the otherwise tortuous collagen
molecules, increases the total energy required to fracture the bone. This increase in total energy
required to fracture the material increases the “toughness” of the material [36]. After the force is
reduced, these sacrificial bonds reform and the collagen molecules re-crimp, partially restoring
the original bone strength [36]. This sacrificial bond mechanism would increase the amount of
energy necessary for a crack to propagate through the bone at low stresses [14,36,37].
A study on the fatigue behaviour of Mov13 (Type I collagen mutation) cortical bone showed a
significant reduction in fatigue life under cyclic loading [38]. The authors postulated that the
97
reduced collagen content, the altered collagen-matrix organization, the increased proportion of
woven bone and the two-fold increase in bone porosity interfered with the ability of the Mov13
microstructure to deter and isolate cracks during the tissue-level fatigue tests [38]. In this study,
the fatigue behaviour of KOH treated bones was significantly affected at high stresses only (>60
MPa). This suggests a different mechanism of action of the KOH. We hypothesize that a
combination of in situ collagen degradation, which results in a modified collagen organization
and/or partial debonding between the mineral and organic matrix may be the reasons for the
varying fatigue behaviour observed in KOH treated bones.
4.4.2. Microdamage
Other effects such as microdamage accumulation may also play an important role in the altered
damage behaviour of KOH treated bones. Although the tibiae tested at 2000 microstrain and
4000 microstrain were subjected to cycles varying from 10,000 to 1,000,000 cycles and showed
reductions in stiffness values, histological examination of sections failed to reveal any evidence
of microdamage. This may be due to inadequate resolution capabilities of the light microscope
[27]. Even though microdamage was not observed at the level of light microscopy, it is possible
that microdamage may have been initiated at the ultrastructural level, as damage initiates
differently in different directions [39]. Results obtained by Forwood and Parker showed that
intensive exercise, producing approximately 30,000 loading cycles, was not sufficient to produce
evidence of microdamage in the cortex of tibiae from rats [40]. No evidence of microdamage
was observed in the tibiae of marathon runners following a similar duration of loading [41].
Based on these studies, it was assumed that microdamage analysis of the samples fatigued at low
stresses to 100,000 cycles may not have revealed any additional information and was not
performed. It has been shown that bone accumulates a considerable amount of microdamage
before failure due to cyclic fatigue loading [30]. However, evidence of microfracture in bone that
has yielded is difficult to observe [42,43]. As a result, there is no clear correlation between
microdamage and impaired mechanical properties [39]. Additional factors such as staining
protocol and intensity of the basic fuchsin accumulation may also affect microdamage evaluation
[44]. The three-point bending setup should also be reconsidered as a loading method, as this
testing evaluates the fatigue behaviour at the mid-diaphysis, forcing the crack to initiate and
propagate in the small region under the crosshead. As such, a four-point bending setup may be

98
more practical for future microdamage analysis. Finally, Burr and colleagues have shown that
bone can undergo a significant amount of modulus degradation before microcracks appear and
that the absence of any microdamage is not an indication of bone mechanical integrity [39].
4.4.3. Sex Differences
Female emu tibiae had significantly higher BMD compared to male tibiae for all groups. A
difference in BMD has been previously shown to affect fatigue properties [45]. According to the
result of that study, our samples with higher BMD would have been predicted to exhibit an
increased fatigue life than the bones with lower BMD (male bones). In terms of sexual
dimorphisms, male emus also differ from female emus in that they undergo 8-weeks of
immobilization when performing egg incubation [46]. This immobilization can result in
differences in bone behaviour. Both the lower BMD and possible immobilization factors suggest
that male emu tibiae should have decreased fatigue resistance compared to female emu tibiae.
However, sex differences in fatigue resistance were not observed in this study. This may be due
to the scatter inherent in fatigue testing of bone, or this data may indicate that male emu tibiae
have developed a mechanism to equally withstand fatigue testing as effectively as their female
counterparts. There may be species-specific differences in emu skeletal development that could
affect the fatigue behaviour of their bones. There may also be differences in the organization of
collagen of the female and male emu bones. Therefore, structural/organizational alterations due
to KOH treatment may be compromising normal fatigue damage processes.
Fatigue strength of bone has also been reported to be a function of microstructure [47,48].
Therefore, it may be hypothesized that a unique microstructure in female and male emu tibiae
may result in different fatigue behaviour. Choi et al. [47] demonstrated similar contradictory
results when fatigue testing single trabeculae and similarly sized cortical bone specimens. The
authors found that trabecular specimens had significantly lower fatigue strength compared to
cortical specimens even though trabecular bone exhibited higher mineral density. The authors
concluded that mineral density may be an insufficient estimator for modulus or fatigue strength
unless microstructural variations are accounted for when structurally different bones are being
compared [47]. This may also be the case in our study. Furthermore, another study has shown
that the effects of microstructural changes on fatigue strength were approximately five times
99
greater than those due to mineral density differences [48]. Finally, it is possible that no
difference in fatigue life was observed between the sexes because of excessive data scatter due to
other independent factors such as surface condition or flaw distribution [32].
4.4.4. Clinical tools
The measured changes in fatigue properties by three-point bending and MRTA were not detected
using DXA or QUS. Partial fatigue testing to induce stiffness loss without fracture did not alter
bone BMD and neither technique is designed to evaluate changes in bone mechanical properties.
In contrast, the MRTA closely mirrored the stiffness loss measured by three-point bending. This
is due to the ability of the MRTA to provide a direct measure of the cross-sectional bending
stiffness (EI), which reflects the elastic modulus, E, a material property, and the cross-sectional
moment of inertia, I, a geometric property determined by the distribution of material around the
bone central axis [15,19]. The MRTA has been shown to detect changes due to KOH treatment
[19] and we similarly detected differences in the MRTA measures between untreated and KOH
treated groups before partial fatigue testing.
Partial fatigue testing at 2000 microstrain revealed no differences between untreated (0-day) and
KOH treated groups for both sexes. This is in agreement with the fatigue to failure data where no
differences were observed at low stresses/strains. Differences between untreated (0-day) and
KOH treated groups for both sexes may have been observed if partial fatigue testing was
performed at higher stresses/strains, based on the fatigue to failure data. Partial fatigue testing
was not performed at higher strains/stresses as it is difficult to ensure stiffness loss and not
fracture.
The stiffness loss due to partial fatigue testing of untreated bones that were not exposed to KOH
treatment, which could be considered a model analogue for fragility fractures, was detected by
the MRTA and three-point bending. However, the loss of stiffness measured by mechanical
testing and detected by MRTA, was not detected by DXA or QUS. Therefore, the MRTA is
capable of detecting changes in bone mechanical properties due to fatigue. EI may be a better
method for clinical evaluation of fracture risk compared with a measurement of bone mineral
density alone.
100
4.5. Conclusions
These findings provide new insights into reductions in the cyclic behaviour of bone, in which
collagen has been degraded in situ. Noncollagenous proteins located at the mineral-collagen
interface may have also been adversely affected by KOH treatment. The present study also
emphasizes the ability of the MRTA to detect changes in bone mechanical properties induced by
fatigue. The MRTA may therefore be a more effective tool for predicting fracture risk than DXA
or QUS.
4.6. Chapter Summary
The effect of collagen alteration (induced by KOH treatment) was investigated on the fatigue
resistance of emu tibiae. KOH treated samples exhibited lower fatigue resistance compared to
untreated (0-day) bones at high stresses (>60 MPa) only for both sexes. There were no
differences in fatigue behaviour at low stresses (<60 MPa) for all groups and no evidence of
microdamage. Partial fatigue testing caused a decrease in modulus, on average 20%, for all
groups (including untreated groups) and for both sexes. MRTA detected this change however,
DXA and QUS did not.
The significant decrease in bone fatigue properties at high stresses only in this unique emu model
may be due to a change in the collagen structure caused by KOH treatment. As a result, it is
hypothesized that the significant changes in bone mechanical properties may be due to in situ
collagen degradation and/or partial debonding between the mineral and organic matrix.

101
4.7. References
[1] Lee TC, O'Brien FJ, Taylor D. (2000) The nature of fatigue damage in bone. Int.J.Fat. 22:847-853.
[2] Hsieh YF, Silva MJ. (2002) In vivo fatigue loading of the rat ulna induces both bone formation
and resorption and leads to time-related changes in bone mechanical properties and density. J.Orthop.Res. 20:764-771.
[3] Mori S, Burr DB. (1993) Increased intracortical remodeling following fatigue damage. Bone.
14:103-109. [4] Pattin CA, Caler WE, Carter DR. (1996) Cyclic mechanical property degradation during fatigue
loading of cortical bone. J.Biomech. 29:69-79. [5] Lee TC, Staines A, Taylor D. (2002) Bone adaptation to load: microdamage as a stimulus for
bone remodelling. J.Anat. 201:437-446. [6] Callister WD. (2003) Materials Science and Engineering: An Introduction. John Wiley & Sons.
New York. [7] Tami AE, Nasser P, Schaffler MB, Knothe Tate ML. (2003) Noninvasive fatigue fracture model
of the rat ulna. J.Orthop.Res. 21:1018-1024. [8] Bowman SM, Gibson LJ, Hayes WC, McMahon TA. (1999) Results from demineralized bone
creep tests suggest that collagen is responsible for the creep behavior of bone. J.Biomech.Eng. 121:253-258.
[9] Fois M, Lamure R, Fauran MJ, Lacabanne C. (1998) Viscoelastic properties of human bone.
J.Biomech. 31:2. [10] Wang X, Shen X, Li X, Agrawal CM. (2002) Age-related changes in the collagen network and
toughness of bone. Bone. 31:1-7. [11] Oxlund H, Barckman M, Ortoft G, Andreassen TT. (1995) Reduced concentrations of collagen
cross-links are associated with reduced strength of bone. Bone. 17:365S-371S. [12] Zioupos P, Currey JD, Hamer AJ. (1999) The role of collagen in the declining mechanical
properties of aging human cortical bone. J.Biomed.Mater.Res. 45:108-116. [13] Cefalu CA. (2004) Is bone mineral density predictive of fracture risk reduction?
Curr.Med.Res.Opin. 20:341-349. [14] Burr DB. (2002) The contribution of the organic matrix to bone's material properties. Bone. 31:8-
11. [15] Roberts SG, Hutchinson TM, Arnaud SB, Kiratli BJ, Martin RB, Steele CR. (1996) Noninvasive
determination of bone mechanical properties using vibration response: a refined model and validation in vivo. J.Biomech. 29:91-98.
102
[16] Hutchinson TM, Bakulin AV, Rakhmanov AS, Martin RB, Steele CR, Arnaud SB. (2001) Effects of chair restraint on the strength of the tibia in rhesus monkeys. J.Med.Primatol. 30:313-321.
[17] Norrdin RW, Simske SJ, Gaarde S, Schwardt JD, Thrall MA. (1995) Bone changes in
mucopolysaccharidosis VI in cats and the effects of bone marrow transplantation: mechanical testing of long bones. Bone. 17:485-489.
[18] Djokoto C, Tomlinson G, Waldman S, Grynpas M, Cheung AM. (2004) Relationship among
MRTA, DXA, and QUS. J.Clin.Densitom. 7:448-456. [19] Wynnyckyj C, Omelon S, Savage K, Damani M, Chachra D, Grynpas MD. (2009) A new tool to
assess the mechanical properties of bone due to collagen degradation. Bone. 44:840-848. [20] Willett TL, Wynnyckyj C, Wang J, Grynpas MD. The fatigue resistance of rabbit tibiae varies
with age from youth to middle age. Osteoporos.Int. May 22. Epub ahead of print. [21] Taylor D. (2000) Scaling effects in the fatigue strength of bones from different animals.
J.Theor.Biol. 206:299-306. [22] Boyce TM, Fyhrie DP, Glotkowski MC, Radin EL, Schaffler MB. (1998) Damage type and strain
mode associations in human compact bone bending fatigue. J.Orthop.Res. 16:322-329. [23] Turner CH, Burr DB. (1993) Basic biomechanical measurements of bone: a tutorial. Bone.
14:595-608. [24] Moreno LD, Waldman SD, Grynpas MD. (2006) Sex differences in long bone fatigue using a rat
model. J.Orthop.Res. 24:1926-1932. [25] Cotton JR, Winwood K, Zioupos P, Taylor M. (2005) Damage rate is a predictor of fatigue life
and creep strain rate in tensile fatigue of human cortical bone samples J.Biomech.Eng. 127: 213-219.
[26] Zioupos P, TW X, Currey JD. (1996) The accumulation of fatigue microdamage in human
cortical bone of two different ages in vitro. Clin.Biomech.(Bristol.Avon). 11:365-375. [27] Burr DB, Stafford T. (1990) Validity of the bulk-staining technique to separate artifactual from in
vivo bone microdamage. Clin.Orthop.Relat.Res. 305-308. [28] Frost HM. (1960) Presence of microscopic cracks in vivo in bone. Henry Ford Hospital Medical
Bulletin. 8:27-35. [29] Frank JD, Ryan M, Kalscheur VL, Ruaux-Mason CP, Hozak RR, Muir P. (2002) Aging and
accumulation of microdamage in canine bone. Bone. 30:201-206. [30] Carter DR, Caler WE. (1985) A cumulative damage model for bone fracture. J.Orthop.Res. 3:84-
90. [31] Nalla RK, Kruzic JJ, Kinney JH, Ritchie RO. (2005) Aspects of in vitro fatigue in human cortical
bone: time and cycle dependent crack growth. Biomater. 26:2183-2195.
103
[32] Kruzic JJ, Ritchie RO. (2008) Fatigue of mineralized tissues: cortical bone and dentin. J.Mech.Beh.Biomed.Mat. 3-17.
[33] Cotton JR, Zioupos P, Winwood K, Taylor M. (2003) Analysis of creep strain during tensile
fatigue of cortical bone. J.Biomech. 36:943-949. [34] Fondrk MT, Bahniuk EH, Davy DT. (1999) A damage model for nonlinear tensile behavior of
cortical bone. J.Biomech.Eng. 121:533-541. [35] Rimnac CM, Petko AA, Santner TJ, Wright TM. (1993) The effect of temperature, stress, and
microstructure on the creep of compact bovine bone. J.Biomech. 26:219-228. [36] Fantner GE, Hassenkam T, Kindt JH, Weaver JC, Birkedal H, Pechenik L, Cutroni JA, Cidade
GA, Stucky GD, Morse DE, Hansma PK. (2005) Sacrificial bonds and hidden length dissipate energy as mineralized fibrils separate during bone fracture. Nat.Mater. 4:612-616.
[37] Thompson JB, Kindt JH, Drake B, Hansma HG, Morse DE, Hansma PK. (2001) Bone
indentation recovery time correlates with bond reforming time. Nature. 414:773-776. [38] Jepsen KJ, Schaffler MB, Kuhn JL, Goulet RW, Bonadios J, Goldstein SA. (1997) Type I
collagen mutation alters the strength and fatigue behavior of MOV13 cortical tissue. J.Biomech. 11/12:1141-1147.
[39] Burr DB, Turner CH, Naick P, Forwood MR, Ambrosius W, Hasan MS, Pidaparti R. (1998) Does
microdamage accumulation affect the mechanical properties of bone? J.Biomech. 31:337-345. [40] Forwood, MR, Parker AW. (1989) Microdamage in response to repetitive torsional loading in the
rat tibia. Calcif.Tissue.Int. 45:47-53. [41] Rubin CT, Pratt GW, Porter AL, Lanyon LE, Poss R. (1987) The use of ultrasound in-vivo to
determine acute change in the mechanical properties of bone following intense physical activity. J.Biomech. 20:723-727.
[42] Currey JD. (1984) The mechanical adaptations of bones. Princeton University Press. Princeton. [43] Forwood, MR, Parker AW. (1991) Repetitive loading, in vivo, of the tibiae and femora of rats:
effects of repeated bouts of treadmill-running. Bone.Min. 13:35-46. [44] Huja SS, Sayeed Hasan M, Pidaparti R, Turner CH, Garetto LP, Burr DB. (1999) Development of
a fluorescent light technique for evaluating microdamage in bone subjected to fatigue loading. J.Biomech. 32:1243-1249.
[45] Jarvinen TL, Kannus P, Pajamaki I, Vuohelainen T, Tuukkanen J, Jarvinen M, Sievanen H.
(2003) Estrogen deposits extra mineral into bones of female rats in puberty, but simultaneously seems to suppress the responsiveness of female skeleton to mechanical loading. Bone. 32:642-651.
[46] Davies SJJF. (2002) Ratites and Tinamous. Oxford University Press. New York. [47] Choi K, Goldstein SA. (1992) A comparison of the fatigue behavior of human trabecular and
cortical bone tissue. J.Biomech. 25:1371-1381.

104
[48] Carter DR, Hayes WC. (1976) Fatigue life of compact bone-I. Effects of stress amplitude, temperature and density. J.Biomech. 9:27-37.

105
Chapter 5 Fractography 5.1. Introduction
5.2. Experimental Details
5.2.1. Emu bone samples and KOH treatment 5.2.2. Fractography analysis 5.2.3. Surface roughness measurements 5.2.4. Statistical analysis
5.3. Results
5.3.1. Tensile versus compressive areas 5.3.2. Degree of roughness 5.3.3. Regions of interest 5.3.4. Correlations
5.4. Discussion
5.4.1. Tensile versus compressive areas 5.4.2. Degree of roughness 5.4.2. Failure mechanisms
5.5. Conclusions
5.6. Chapter Summary
5.7. References

106
The following manuscript has been submitted to the Journal of Bone and Mineral
Metabolism for review in May 2010 under, “Fracture surface analysis in order to investigate
failure mechanisms of collagen degraded bone”. The complete list of authors includes: C.
Wynnyckyj, L. Wise-Milestone, S. Omelon, Z. Wang and M.D. Grynpas. In this chapter, we
use a fractography protocol previously established in our laboratory to explain the observed
increase in toughness from Chapter 3.
5.1. Introduction
Fracture surface analysis, or fractography, is the microscopic examination of failure surfaces
in an effort to gain insight about the events implicated in fracture. This technique can be
applied to the investigation of the mechanisms of bone failure [1]. Several studies have used
scanning electron microscopy (SEM) to study the fracture behaviour of bone [1-7]. These
investigators concluded that fracture surface morphology is essential in understanding how
bone fails [1-7]. Fractography has been used to help explain altered mechanical properties.
Piekarski attempted to correlate the energy required to propagate a crack by observing the
mechanism of fracture in bone on a microscopic scale [4]. Similarly, Saha and Hayes
correlated the tensile impact strength to fracture surface morphologies of human and bovine
compact bone [8]. Recently, Wise et al. showed the analytical value in quantifying the rough
and smooth areas of the fracture surfaces of mouse bone [9]. Regarding the collagen
component specifically, Jepsen et al. performed fracture surface analysis to help explain
decreased toughness in a mouse model of Osteogenesis Imperfecta [10]. Similarly, Fantner et
al. related fracture surface analysis of trabecular bone in which the organic matrix had been
degraded to the resulting modified mechanical properties [11]. Finally, George et al.
identified failure modes in bone using fractographic analysis [12].
Bone has several toughening mechanisms, such as fiber bridging, crack deflection and
microcracks that deflect, slow or stop crack propagation and increase the resistance to
fracture and ultimately failure [7,13,14]. Collagen fibrils can act as a toughening mechanism,
whereby intact fibers bridge a crack and oppose crack opening [7,13]. Similarly, uncracked
ligaments may serve to bridge opposing sides of a crack, consequently blunting further crack
propagation along the crack path, a phenomenon known as ‘crack bridging’ [15,16]. Cement

107
lines and interlamellar boundaries are believed to provide weak interfaces capable of crack
deflection, thereby prolonging the crack propagation path and accordingly increasing bone
toughness [7,17]. Finally, microdamage from microcracking works through crack-tip
shielding [7].
To study the contribution of collagen to the mechanical properties of bone, we developed a
model using the emu tibiae, in which collagen was degraded with 1 M potassium hydroxide
(KOH) while keeping the mineral content of bone unaltered [18]. While the KOH treatment
is not physiological, its role is to improve our understanding of the mechanisms by which
collagen degradation, not removal, affects bone mechanical properties. Endocortical KOH
treatment results in negligible mass loss (0.5%), collagen loss (0.05%), no differences in
geometrical parameters, but significant changes in mechanical properties [18]. Specifically,
male and female emu tibiae showed significant decreases in failure stress and increased
failure strain and toughness with increasing KOH treatment time [18].
The reason for increased failure strain and toughness values of KOH treated bones remains
unclear and in fact, contradicts other work where degraded collagen induces a more brittle-
like behaviour in bone, with decreased toughness values [10,11]. Therefore, we hypothesize
that in situ collagen degradation and/or partial debonding between the mineral and organic
matrix may be responsible for the increased toughness observed with KOH treated bones.
The goal of the present study was to gain insights into the failure mechanisms of female and
male KOH treated emu tibiae in an effort to explain the previously observed mechanical
property changes. A more thorough understanding of the relationship between fracture
surface morphologies and bone toughness can provide new insights into the underlying
mechanisms of bone failure.
5.2. Experimental Details
5.2.1. Emu bone samples and KOH treatment
The emu bone tibiae samples from Chapter 3 – Initial Study, were used in this study. Briefly,
skeletally mature (3-5 years of age) whole emu tibiae were separated from the femora and

108
tarsometatarsi with a scalpel. The shaft of each tibia was then isolated by using a circular saw
to remove the ends (15% of the total bone length from the proximal end and 10% from the
distal end), resulting in bone samples 26 to 32 cm in length. The marrow and trabecular bone
from the diaphysis of the tibiae were removed by drilling longitudinally through the bone
shaft, after which the medullary canal was flushed with tap water [18]. The emu tibiae were
filled with 1 M KOH and the ends were sealed with polymethylmethacrylate (PMMA, SR
Ivolen Liquid and Powder, Ivoclar Vivadent, Mississauga, ON). The bones were held
horizontally over a collection basin and kept moist with a 0.9% saline solution drip. The
bones were rotated 180 ° around the axial axis every 12 hours during the KOH treatment.
After the desired treatment period, the KOH solution was reclaimed, its volume measured
and the endocortical surfaces of the bones rinsed in running tap water for one hour.
Emu tibiae were tested in three-point bending using a servo-hydraulic materials testing
machine (Model 8511, Instron, Canton, MA). Each tibia was placed posterior side down on
the lower supports, 24 cm apart [18]. Anterior-posterior loading is the most commonly used
approach for anatomical and practical reasons. The bone was secured in the three-point
bending jig with a 100 N pre-load and then loaded to failure at a displacement rate of 0.04
mm/s [18]. A load-displacement curve was created for every sample and stiffness, failure
load, failure displacement and energy to failure were determined. Load-displacement data
were normalized using geometric data from Computed Tomography (CT) scans taken at the
mid-point of each emu tibia with an Aquilion 64 CT scanner (Toshiba, Canada) before and
after the different KOH treatment time points. Stress (σ; MPa) and strain (ε; %) were then
calculated using the following equations [19]:
where F is the measured load (N), L is the span of the lower supports (24 cm), APφ is the
external diameter in the anterior-posterior direction (mm), Ixx is the moment of inertia about
the mediolateral axis (mm4), and D is the measured displacement (mm). Stress-strain curves
were created from the normalized data. From these curves, the elastic modulus (E; GPa),
failure stress (σf; MPa), failure strain (εf, %) and toughness (U; mJ/mm3) were determined.
xx
AP
ILF
8φ
σ⋅⋅
= 10062 ∗=
LD APφ
ε

109
Bones were divided into two groups of female and male tibiae with ten samples allocated to
each of untreated (0-day) or 14-day KOH treatments. An additional ten female and ten male
bones were filled with saline instead of KOH for 14 days to act as controls.
5.2.2. Fractography analysis
For each sample, the fracture surfaces were cut from the rest of the bone (resulting in twenty
mm long samples) and quantified using digital images (taken by a Nikon D40 SLR digital
camera equipped with a 18-105mm macro lens from Sigma) to assess failure mechanisms of
untreated and 14-day KOH treated emu tibiae. Representative digital images of the fracture
surfaces of untreated and 14-day KOH treated sample are shown in Figure 5.1. The defined
‘tensile’ (T), ‘compressive’ (C) and ‘transition’ (Tr) regions are identified. Bone is known to
be weaker in tension than in compression. Therefore, failure in three-point bending should
typically occur primarily on the tensile side [19]. The terms ‘tension’ and ‘compression’ are
used with the understanding that purely tensile or compressive regions are uncommon in
three-point bending tests of bone [19]. The ‘tensile’ side may also experience shearing and
the ‘compressive’ side may have a portion of tensile failure [9]. From these images, areas of
‘tension’, ‘compression’ and ‘transition’ (areas that did not correspond to obvious tensile or
compressive areas) were identified, using a qualitative protocol previously defined in our
laboratory [9]. Bones were consistently loaded in the anterior-posterior direction, resulting in
medial-lateral regions that could not be defined as ‘tension’ or ‘compression’ and were
therefore termed ‘transition’ regions. Image J (ImageJ 1.28u, National Institutes of Health)
was used to trace the appropriate regions and calculate the relative area. ‘Tensile’ regions
were defined as having relatively flat, smooth surfaces, whereas ‘compressive’ regions were
defined by areas of longitudinal splitting and interlamellar cleavage [9] (Figure 5.1). These
definitions are based on previous observations by Wise et al. [9] that were originally
identified by Jepsen et al. [10] of tensile and compressive sides from four-point bending of
mouse femora.

110
Figure 5.1: Representative digital images of female and male, untreated and 14-day KOH treated fracture surfaces showing defined ‘tensile’ (T), ‘compressive’ (C) and ‘transition’ (Tr) regions.
Next, representative samples from the middle of the fracture surfaces (approximately 5 mm
long) from the compressive and tensile regions were cut, lyophilized, glued to individual
SEM stages with epoxy resin (5 min epoxy, Lepage’s Limited, Brampton, ON) and
subsequently gold-coated in preparation for scanning electron microscopy (SEM) imaging
(XL300ESEM, FEI, Hillsboro, OR). Beam conditions were set at 20 kV accelerating voltage
and a spot size of 4. Samples with debris on the fracture surface or unusual fractures were
excluded from the analysis. The samples were then qualitatively categorized as either
‘smooth’, ‘rough’ or ‘indeterminate’. ‘Indeterminate’ areas were defined as areas that could
not be classified as either ‘smooth’ or ‘rough’. On the tensile side, ‘smooth’ areas had a
relatively clean and flat morphology, whereas ‘rough’ areas displayed a ragged, uneven,
coarse surface [9]. Representative tensile fracture surfaces of male 14-day KOH treated
sample are shown in Figure 5.2 indicating the defined ‘rough’ and ‘smooth’ areas. On the
compressive side, ‘smooth’ areas were identified as having clean, layered lamellae, while
‘rough’ areas exhibited a fragmented, flaky, separated and jagged appearance [9].
Representative compressive fracture surfaces of female 14-day KOH treated sample are

111
shown in Figure 5.3 indicating the defined ‘rough’ and ‘smooth’ areas. These images were
assumed to be representative of the whole surface of each sample.
Figure 5.2: Representative tensile fracture surfaces of male 14-day KOH treated emu tibia showing ‘smooth’ (S) and ‘rough’ (R) regions. ‘Smooth’ regions appear as a flat and clean surface whereas ‘rough’ regions are characterized by an irregular and coarse surface.
Figure 5.3: Representative compressive fracture surfaces of female 14-day KOH treated emu tibia showing ‘smooth’ (S) and ‘rough’ (R) regions. ‘Smooth’ regions are defined as having clean, blunted, layered lamellae whereas ‘rough’ regions have a separated, fragmented and jagged appearance.

112
Percent areas, in the ‘tensile’ and ‘compressive’ areas individually, were then calculated
using Image J (ImageJ 1.28u, National Institutes of Health) to estimate the degree of
‘roughness’ for each sample. ‘Indeterminate’ areas were omitted from the calculations and
therefore the total relative area was calculated as either ‘rough’ or ‘smooth’.
These fracture surfaces were also examined at a higher magnification (1600X) for
characteristic features of bone toughening mechanisms such as microcracks, uncracked
ligament bridging, fiber bridging and crack deflection (Figure 5.4) [14].
Microcracking Uncrackedligament bridging
Crack bridging Crack deflection
(a) (b)
(c) (d) Figure 5.4: Schematic diagram of bone toughening mechanisms: (a) microcracking; (b) uncracked ligament bridging; (c) crack bridging by collagen fibers and (d) crack deflection by osteons [14].
Finally, the number of pores per area (mm-2) and number of small and large pores per area
(mm-2) on the ‘tensile’ side of fracture surfaces were determined using a point-counting
method in Image J. These calculations were not performed on the ‘compressive’ side of
fracture surfaces due to the fragmented and layered nature of these fracture surfaces. A 47
μm diameter threshold was used for the separation between small and large pores. This
threshold value was determined after analyzing a histogram of the overall pore area, which
showed two maximum points (bi-modal distribution). The lowest point of the ‘valley’
between the two maxima was defined as the threshold value.

113
5.2.3. Surface roughness measurements
To validate our qualitative definitions of ‘smooth’ and ‘rough’ fracture surfaces, samples
were assessed with a Veeco Surface Roughness Wyko non-contact optical profiler (AN505-
3-0902, Veeco Instruments Inc., Tucson, AZ). Profiler conditions were set for vertical
scanning interferometry (VSI) mode, 52X magnification. Areas that were previously defined
as ‘rough’ and ‘smooth’ were identified using a referenced SEM mapped image [9]. Ten
measurements were taken in each area per sample. Surface roughness profiles were generated
and analyzed using the accompanying software (WYKO Vision 32 for NT-2000; version
2.2.10). For each ‘smooth’ and ‘rough’ area, the average roughness (Ra, μm) was
determined, which represents the arithmetic average of all deviations from the mean centre
line of the roughness profile. This measurement is the most commonly reported parameter in
studies on surface roughness of bone implant materials [20,21].
5.2.4. Statistical analysis
Statistical analysis was performed using SPSS (SPSS 16.0 for Windows, Chicago, IL)
statistical analysis software. Tests for normality and equality of variances were initially
performed to determine whether parametric or non-parametric t-tests should be used. Two-
way analysis of variance (ANOVA, general linear model) was performed to examine the
effects of sex and KOH treatment on all measured parameters in the emu model and multiple
comparisons using a post-hoc test (Fisher’s Least Significant Difference (LSD)) were made
to detect significant differences between groups. In addition, multiple regression analyses
were used to explore the correlations of bone mechanical properties (elastic modulus, failure
stress, failure strain and toughness) from Chapter 3 (Objective 1 – Initial Study) with the
degree of roughness. Differences between degree of roughness with bending mechanical
parameters were investigated using a generalized linear model to determine any differences
between sexes. All data are presented as mean ± standard error of the mean. A confidence
level of 95% (p=0.05) was considered statistically significant for differences and
correlations.

114
5.3. Results
Significant differences were found in the fracture surface analysis parameters measured
between the untreated (0-day) and 14-day KOH treated groups. No differences were found
between sexes. All parameters measured for the control group (14-day filled with saline)
were similar to those of the untreated (0-day) groups (Appendix A) for both female and male
emu tibiae. Representative stress-strain curves for untreated (solid line) and 14-day KOH
treated (dashed line) emu tibiae (Figure 5.5) reveal changes in the plastic region with KOH
treatment time. The failure stress significantly decreased after 14-day KOH treatment. A
significant increase in failure strain and toughness was seen after 14-day KOH treatment.
Figure 5.5: Representative stress-strain curves for untreated (solid line) and 14-day KOH treated (dashed line) emu tibiae. No apparent changes in the elastic region with KOH treatment time. Significant differences were seen in the plastic region with KOH treatment time.
5.3.1. Tensile versus compressive areas
Representative digital images of the fracture surfaces of female and male untreated and 14-
day KOH treated samples are shown in Figure 5.1. Areas within sample images were
categorized as being ‘tensile’ (T), ‘compressive’ (C) or ‘transition’ (Tr). For both untreated
and 14-day KOH treated female and male groups, there was a significantly greater amount of
‘tensile’ areas compared to ‘compressive’ areas, which is consistent with bending tests [22].
Fracture surfaces of untreated female emu tibiae exhibited 50 ± 2% ‘tensile’ versus 34 ± 1%

115
‘compressive’ (p<0.001) with 15 ± 2% ‘transition’ regions while those of untreated male emu
tibiae exhibited 50 ± 2% ‘tensile’ versus 38 ± 2% ‘compressive’ (p<0.001) with 12 ± 2%
‘transition’ regions. Similarly, fracture surfaces of 14-day KOH treated female emu tibiae
exhibited 50 ± 1% ‘tensile’ versus 37 ± 1% ‘compressive’ (p<0.001) with 13 ± 1%
‘transition’ regions while those of 14-day KOH treated male emu tibiae exhibited 49 ± 1%
‘tensile’ versus 37 ± 1% ‘compressive’ (p<0.001) with 14 ± 1% ‘transition’ regions. All four
groups experienced more ‘tensile’ regions than ‘compressive’ regions. There were no
differences between sexes or with KOH treatment time.
5.3.2. Degree of roughness
Next, the ratios of ‘rough’ to ‘smooth’ areas were then compared for each fracture side
(tensile and compressive, independently) and for each group (female and male, untreated and
14-day KOH treatment), using the previously defined qualitative characterizations of
‘smooth’ and ‘rough’ (Figure 5.2 and Figure 5.3). Indeterminate areas were excluded from
total relative area calculation. Male untreated samples displayed similar percentages of
‘rough’ and ‘smooth’ areas in both tensile and compressive sides (Table 5.1). Specifically, on
the tensile side, untreated male emu tibiae exhibited a non-significant 50:50 ratio of ‘rough’
to ‘smooth’ areas; on the compressive side, a non-significant 44:56 ratio of ‘rough’ to
‘smooth’ areas was also observed. Similarly, untreated female emu tibiae exhibited a non-
significant 48:52 ratio of ‘rough’ to ‘smooth’ areas on the tensile side and a non-significant
46:54 ratio of ‘rough’ to ‘smooth’ areas on the compressive side (Table 5.1). Conversely,
female and male 14-day KOH treated fracture surfaces exhibited significantly more ‘rough’
areas compared to ‘smooth’ areas (Table 5.1). Specifically, on the tensile side, 14-day KOH
treated male tibiae exhibited a significant (p<0.001) 68:32 ratio of ‘rough’ to ‘smooth’ areas;
on the compressive side, a significant (p=0.002) 60:40 ratio of ‘rough’ to ‘smooth’ areas was
observed. Similarly, female 14-day KOH treated emu tibiae exhibited a significant (p=0.002)
62:38 ratio of ‘rough’ to ‘smooth’ areas on the tensile side and a significant (p=0.014) 58:42
ratio of ‘rough’ to ‘smooth’ areas on the compressive side (Table 5.1).
The percentages of ‘rough’ areas between the different treatment groups (untreated vs. KOH
treated) and between sexes (female vs. male) for each failure side (compressive or tensile)
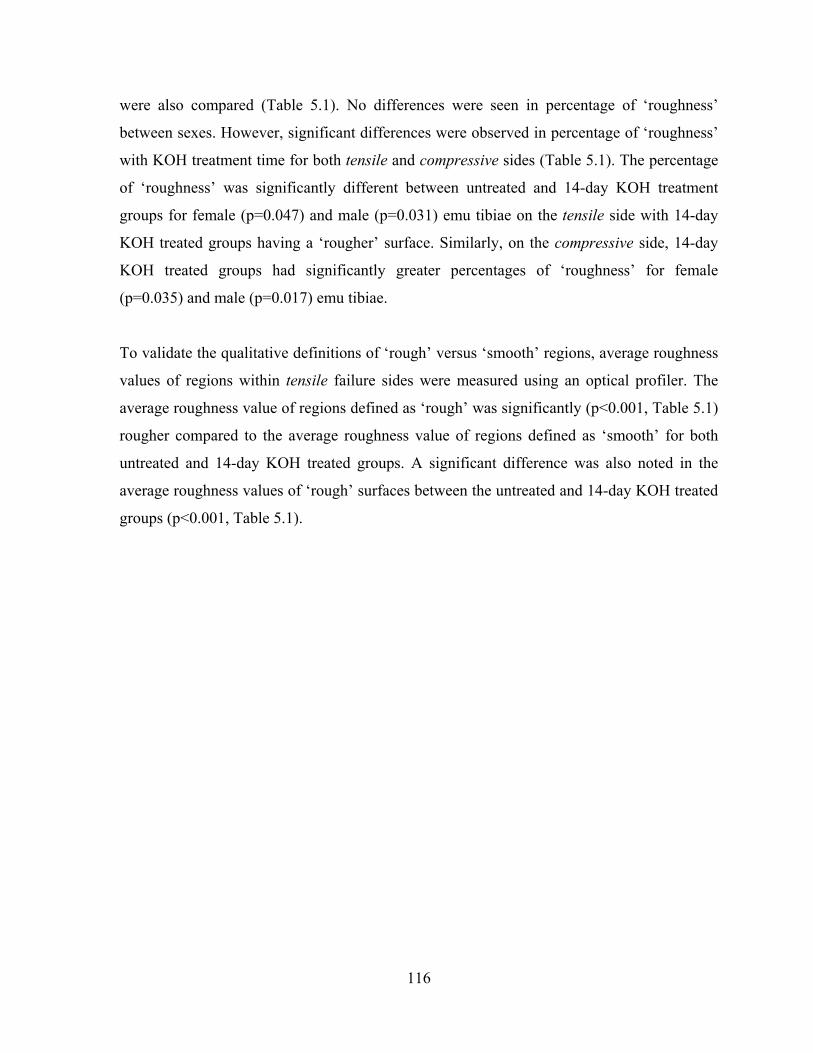
116
were also compared (Table 5.1). No differences were seen in percentage of ‘roughness’
between sexes. However, significant differences were observed in percentage of ‘roughness’
with KOH treatment time for both tensile and compressive sides (Table 5.1). The percentage
of ‘roughness’ was significantly different between untreated and 14-day KOH treatment
groups for female (p=0.047) and male (p=0.031) emu tibiae on the tensile side with 14-day
KOH treated groups having a ‘rougher’ surface. Similarly, on the compressive side, 14-day
KOH treated groups had significantly greater percentages of ‘roughness’ for female
(p=0.035) and male (p=0.017) emu tibiae.
To validate the qualitative definitions of ‘rough’ versus ‘smooth’ regions, average roughness
values of regions within tensile failure sides were measured using an optical profiler. The
average roughness value of regions defined as ‘rough’ was significantly (p<0.001, Table 5.1)
rougher compared to the average roughness value of regions defined as ‘smooth’ for both
untreated and 14-day KOH treated groups. A significant difference was also noted in the
average roughness values of ‘rough’ surfaces between the untreated and 14-day KOH treated
groups (p<0.001, Table 5.1).

117
Table 5.1: Percent area roughness and surface roughness (profiler) measurements for female and male untreated and 14-day KOH treated bones.
Males Females Failure Mode Characteristic
Untreated 14-day Untreated 14-day
%Rough (%) 50 ± 6 68 ± 6a, A 48 ± 5 62 ± 2c, C Tensile Side (TS) %Smooth (%) 50 ± 6 32 ± 6a, A 52 ± 5 38 ± 2c, C
%Rough (%) 44 ± 3 60 ± 5b, B 46 ± 4 58 ± 4d, D Compressive Side (CS) %Smooth (%) 56 ± 3 40 ± 5b, B 54 ± 4 42 ± 4d, D
Males Females Failure
Mode Validation Untreated 14-day Untreated 14-day
Rough (Ra, μm) 11.1 ± 0.4e 13.9 ± 0.9f,E 11.3 ± 0.6g 13.7 ± 0.8h,F Tensile Side (TS) Smooth (Ra, μm) 5.6 ± 0.3e 5.2 ± 0.7f 4.9 ± 0.5g 5.0 ± 0.5h Lower case letters (a,b,c,d) denote significance ( ≤ 0.05) between two marked groups. Uppercase letters (A,B,C,D) denote significance (p≤ 0.05) versus untreated group within each sex.
5.3.3. Regions of interest
Regions of interest on both the tensile and compressive sides were examined at higher
magnification (1600X) with particular focus on the differences observed between untreated
and 14-day KOH treated samples (Figure 5.6). On the tensile side, both female and male
untreated samples showed a relatively ‘smooth’ surface with the presence of deflected cracks
(Figure 5.6 (a), (b), (e) and (f)). On the other hand, both female and male 14-day KOH
treated samples showed a much ‘rougher’ surface coupled with deflected cracks, microcracks
and uncracked ligament bridging (white circle) on the tensile side (Figure 5.6 (c), (d), (g) and
(h)).
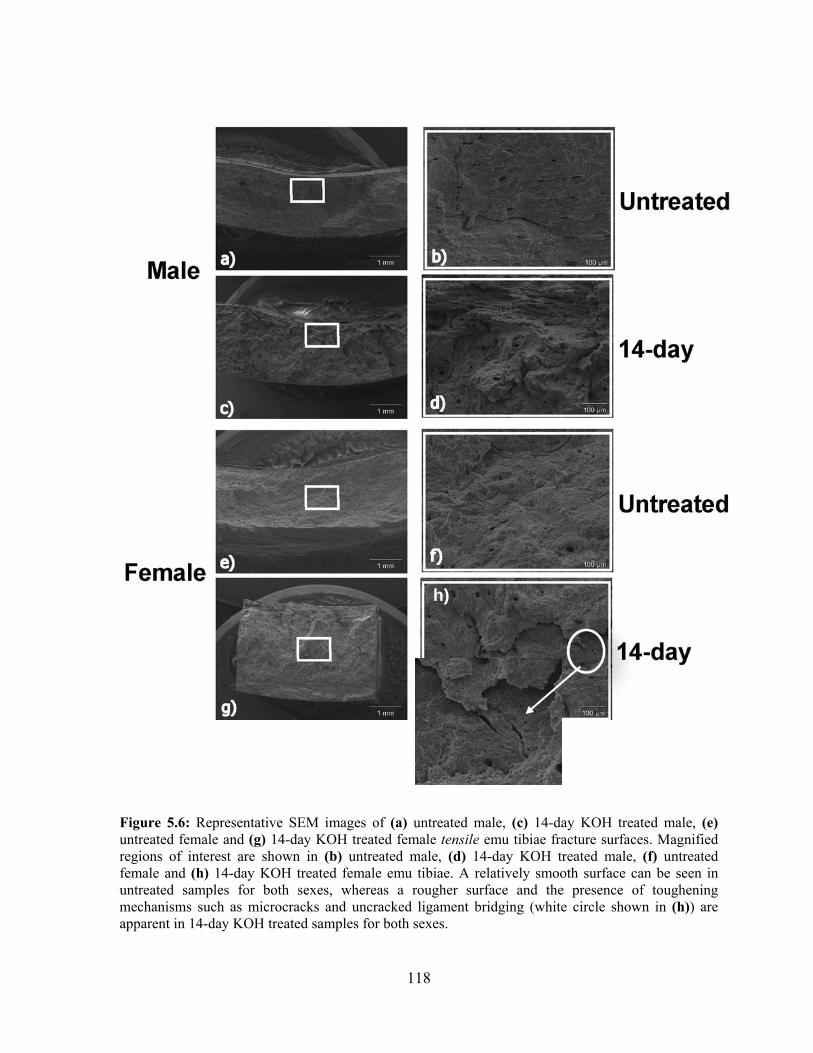
118
Figure 5.6: Representative SEM images of (a) untreated male, (c) 14-day KOH treated male, (e) untreated female and (g) 14-day KOH treated female tensile emu tibiae fracture surfaces. Magnified regions of interest are shown in (b) untreated male, (d) 14-day KOH treated male, (f) untreated female and (h) 14-day KOH treated female emu tibiae. A relatively smooth surface can be seen in untreated samples for both sexes, whereas a rougher surface and the presence of toughening mechanisms such as microcracks and uncracked ligament bridging (white circle shown in (h)) are apparent in 14-day KOH treated samples for both sexes.
h)

119
Both female and male untreated samples exhibited a typical clean delamination and layered
structure with no apparent fiber bridging on the compressive side. The surfaces appear
‘smooth’ with tightly packed lamellae, suggesting a brittle-like fracture. In contrast, both
female and male 14-day KOH treated samples showed a coarser and ‘rougher’ appearance
with apparent fiber bridging and connections on the compressive side. Figures 5.7 and 5.8
represent regions of interest on the compressive side for male (Figure 5.7) and female (Figure
5.8) emu tibiae. High magnification images show crack bridging by collagen fibrils (Figure
5.7 (e) for male and Figure 5.8 (f) for female emu tibiae). Fibers appear to be disjointed with
increased splitting and separation between fibers. Further examination between separated
lamellae reveals interwoven mineralized collagen fibers (Figure 5.7 (d) and 5.7 (f)),
indicative of a more ductile-like fracture. These interwoven mineralized collagen fibers are
tightly connected in the left side of Figure 5.7 (d) and appear to be stretched and separated in
the right side of Figure 5.7 (d).
Porosity measurements revealed no differences in large pore density (pore diameter > 47 μm)
and small pore density (pore diameter < 47 μm) between sexes and between untreated and
14-day KOH treated groups (Table 5.2).
Table 5.2: Porosity parameters from tensile side of female and male emu tibiae fracture surfaces.
Males Females Parameter
Untreated 14-day Untreated 14-day
No. of large pores (pore diameter >47 μm) per area (mm-2) 0.8 ± 0.1 1.0 ± 0.3 1.0 ± 0.1 1.2 ± 0.5
No. of small pores (pore diameter<47 μm) per area (mm-2) 75 ± 8 66 ± 7 71 ± 5 70 ± 7

120
Figure 5.7: Representative SEM images of male compressive fracture surfaces of (a) untreated and (c) 14-day KOH treated emu tibiae showing interlamellar cleavage and splitting. Magnified regions of interest are shown in (b) untreated and (d) 14-day KOH treated sample. Characteristic features of bone toughening are shown in (e) and (f) 14-day KOH treated sample. Interlamellar short fibers acting as connections between lamellae are evident in the 14-day KOH treated sample (e), but absent in the untreated sample (b). Interwoven mineralized collagen fibers remain connected upon further examination between separated lamellae (d) and (f).

121
Figure 5.8: Representative SEM images of female compressive fracture surfaces of (a) untreated and (c) 14-day KOH treated emu tibiae showing interlamellar cleaving and splitting. Magnified regions of interest are shown in (b) untreated and (d) 14-day KOH treated sample. Characteristic features of bone toughening are shown in (e) and (f) 14-day KOH treated sample. Interlamellar connecting fibers between lamellae are evident in the 14-day KOH treated sample (e) and (f) but absent in the untreated samples (b).
5.3.4. Correlations
Linear regression analyses were used to explore the correlations of bone mechanical
properties (elastic modulus, failure stress, failure strain and toughness) from Chapter 3 –
Initial Study, with the fracture surface analysis results. Significant correlations were found
between degree of roughness and mechanical properties (Table 5.3). Multiple regression
analyses indicated that the percentage of ‘roughness’ on both the tensile (Figure 5.9) and
compressive (Figure 5.10) sides had strong correlations with the mechanical properties
(elastic modulus, failure stress, failure strain and toughness) for both female and male emu

122
tibiae. The elastic modulus and failure strength of the KOH-treated groups decreased with
increasing percent of ‘rough’ area. The failure strain and toughness increased with increasing
percent of ‘rough’ area. The regression curves were not different between female and male
emu tibiae in any of these tests.
Table 5.3 .Correlations between bone fracture surface features and mechanical properties for female and male emu tibiae. Failure
Strain (%) Failure Stress
(MPa) Toughness (mJ/mm3)
Modulus (GPa)
p-value 0.011 0.028 0.011 0.016 %Rough-TS
R2 0.373 -0.401 0.319 -0.406
p-value 0.036 0.009 0.004 0.006 Males
%Rough-CS R2 0.450 -0.295 0.420 -0.492
p-value 0.006 0.002 0.004 0.003 %Rough-TS
R2 0.402 -0.353 0.414 -0.384
p-value 0.025 0.006 0.007 0.002 Females
%Rough-CS R2 0.429 -0.248 0.365 -0.341

123
Figure 5.9: Regression of (a) elastic modulus, (b) failure stress, (c) failure strain and (d) toughness with respect to the relative ‘roughness’ area on the tensile fracture surface (%Rough-TS) of bone for female (pink circles) and male (blue circles) emu tibiae, with the correlation coefficient (R2) and p-values being presented. Significant and strong correlations were found between these parameters.
0 20 40 60 80 1000
1
2
3
4
5 Male
Female
0 20 40 60 80 1000
1
2
3
4
5Male
Female
c) Failure Strain (%) d) Toughness (mJ/mm3)
R2=0.37p=0.011
R2=0.40p=0.006
R2=0.32p=0.011
R2=0.41p=0.004
Percent Rough - TS (%) Percent Rough - TS (%)0 20 40 60 80 100
0
1
2
3
4
5 Male
Female
0 20 40 60 80 1000
1
2
3
4
5Male
Female
c) Failure Strain (%) d) Toughness (mJ/mm3)
R2=0.37p=0.011
R2=0.40p=0.006
R2=0.32p=0.011
R2=0.41p=0.004
Percent Rough - TS (%) Percent Rough - TS (%)
0 20 40 60 80 1000
20
40
60
80
100
120
140
160
180
Male
Female
0 20 40 60 80 1000
5
10
15
20
25
30Male
Female
Percent Rough - TS (%)
a) Elastic Modulus (GPa) b) Failure Strength (MPa)
R2=0.41p=0.016
R2=0.38p=0.003 R2=0.35
p=0.002
R2=0.40p=0.028
Percent Rough - TS (%)0 20 40 60 80 100
0
20
40
60
80
100
120
140
160
180
Male
Female
0 20 40 60 80 1000
5
10
15
20
25
30Male
Female
Percent Rough - TS (%)
a) Elastic Modulus (GPa) b) Failure Strength (MPa)
R2=0.41p=0.016
R2=0.38p=0.003 R2=0.35
p=0.002
R2=0.40p=0.028
Percent Rough - TS (%)
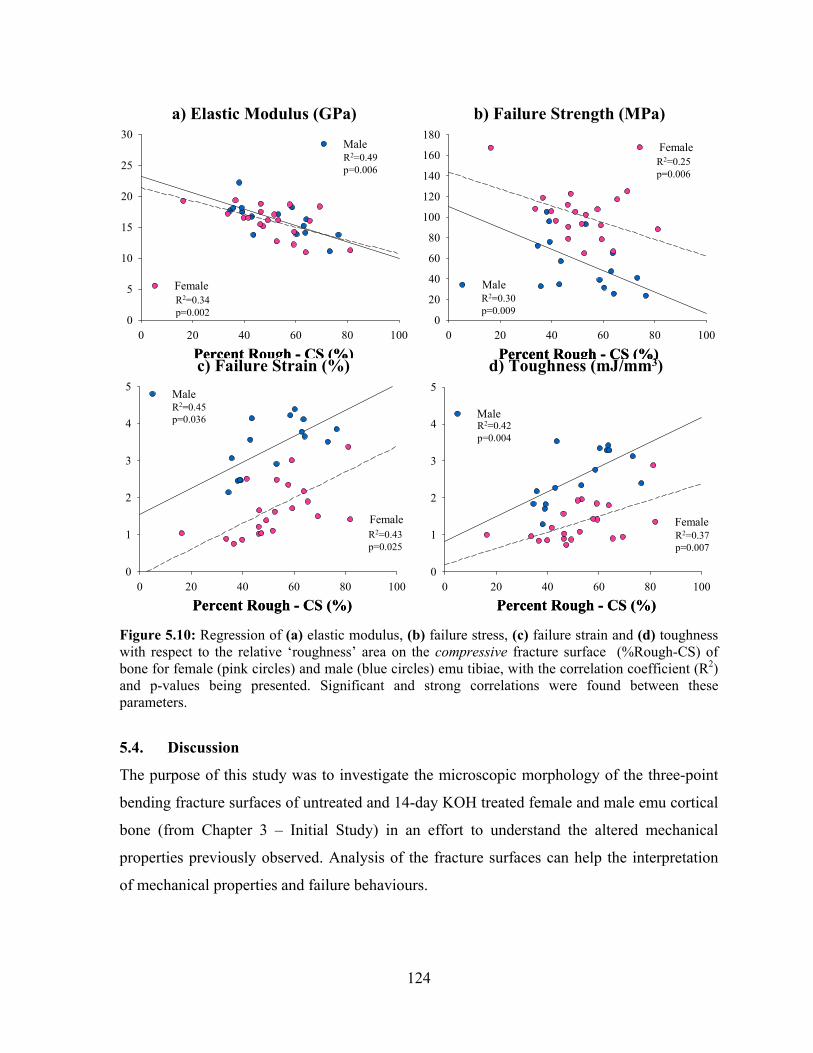
124
Figure 5.10: Regression of (a) elastic modulus, (b) failure stress, (c) failure strain and (d) toughness with respect to the relative ‘roughness’ area on the compressive fracture surface (%Rough-CS) of bone for female (pink circles) and male (blue circles) emu tibiae, with the correlation coefficient (R2) and p-values being presented. Significant and strong correlations were found between these parameters.
5.4. Discussion
The purpose of this study was to investigate the microscopic morphology of the three-point
bending fracture surfaces of untreated and 14-day KOH treated female and male emu cortical
bone (from Chapter 3 – Initial Study) in an effort to understand the altered mechanical
properties previously observed. Analysis of the fracture surfaces can help the interpretation
of mechanical properties and failure behaviours.
0 20 40 60 80 1000
20
40
60
80
100
120
140
160
180
Male
Female
0 20 40 60 80 1000
5
10
15
20
25
30Male
Female
Percent Rough - CS (%)
a) Elastic Modulus (GPa) b) Failure Strength (MPa)
R2=0.49p=0.006
R2=0.34p=0.002
R2=0.30p=0.009
R2=0.25p=0.006
Percent Rough - CS (%)0 20 40 60 80 100
0
20
40
60
80
100
120
140
160
180
Male
Female
0 20 40 60 80 1000
5
10
15
20
25
30Male
Female
Percent Rough - CS (%)
a) Elastic Modulus (GPa) b) Failure Strength (MPa)
R2=0.49p=0.006
R2=0.34p=0.002
R2=0.30p=0.009
R2=0.25p=0.006
Percent Rough - CS (%)
0 20 40 60 80 1000
1
2
3
4
5
Male
Female
0 20 40 60 80 1000
1
2
3
4
5 Male
Female
c) Failure Strain (%) d) Toughness (mJ/mm3)
R2=0.45p=0.036
R2=0.43p=0.025
R2=0.42p=0.004
R2=0.37p=0.007
Percent Rough - CS (%) Percent Rough - CS (%)0 20 40 60 80 100
0
1
2
3
4
5
Male
Female
0 20 40 60 80 1000
1
2
3
4
5 Male
Female
c) Failure Strain (%) d) Toughness (mJ/mm3)
R2=0.45p=0.036
R2=0.43p=0.025
R2=0.42p=0.004
R2=0.37p=0.007
Percent Rough - CS (%) Percent Rough - CS (%)

125
A significant increase in failure strain was seen with KOH treatment time due to a significant
increase in the post-yield strain for both female and male emu tibiae. This increased post-
yield strain contributed to a significant increase in toughness. The difference in failure strain
in the elastic region between untreated and 14-day KOH treated groups was minimal.
Therefore, the total energy to failure increased due to the accumulation of plastic damage.
These results are in agreement with the fracture surface analysis results.
Crack morphology was visualized qualitatively by taking SEM images of the tensile and
compressive surfaces of untreated and 14-day KOH treated samples. For both sexes, 14-day
KOH treated fracture surfaces exhibited significantly more ‘rough’ areas compared to
‘smooth’ areas on both the tensile and compressive areas. Similarly, the percentage of
‘roughness’ was significantly different between untreated and 14-day KOH treatment groups
for female and male emu tibiae on both the tensile and compressive sides, with 14-day KOH
treated groups exhibiting a relatively larger, ‘rougher’ appearance. These results were
confirmed with the optical profiler surface roughness measurements.
In terms of failure mechanisms, 14-day KOH treated female and male fracture surfaces
showed additional toughening mechanisms that were absent in the untreated samples,
including crack deflection, microcracks, crack bridging by collagen fibers and uncracked
ligaments. These fracture surface features are all indicative of a more ductile-like fracture.
5.4.1. Tensile versus compressive areas
Both female and male, untreated and 14-day KOH treated groups exhibit significantly larger
percent tensile surfaces (approximately 66% percentage tensile areas) compared to
compressive surfaces. This is in agreement with three-point bending fracture behaviour of
most materials. In most materials, tensile strengths are lower than compressive strengths
therefore, materials will initially fail on the tensile side during bending tests. During three-
point bending, one half experiences compression (in this case, anterior side), while the other
half experiences tension (posterior side). As the fracture progresses, the neutral axis shifts
upwards towards the original compressive side, resulting in a dynamic transition from
compressive to tensile regions. Therefore, initial compression regions become tensile regions

126
[9,19], which results in the ‘majority’ of the fracture surface being largely generated in
tension.
5.4.2. Degree of roughness
Examination of the fracture surfaces revealed distinctive differences in appearance between
the untreated and 14-day KOH treated specimens. While the untreated specimens had
‘smoother’ fracture surfaces, the 14-day KOH treated specimen fracture surfaces exhibited a
fibrous and ‘rougher’ appearance.
Rough fracture surfaces have been correlated to increased toughness of bone [4,16]. The
toughness of bone is the capability of bone to absorb energy during the failure process [19].
The degree of roughness observed on a fracture surface is representative of the resistance of a
propagating crack. Therefore, a rougher fracture surface indicates a higher crack propagation
resistance and more energy was required to further propagate the crack. Currey and Brear
[23] have observed that tissues with greater toughness display a rougher fracture surface
profile.
Fracture surface roughness is affected not only by changes in the bone structure but also by
how the loads are applied. In addition, the process of multiple initiation of cracks can result
in enhanced roughness since the majority of cracks in bone are loaded under mixed-mode
(tension and shear) conditions [24]. To avoid shear stresses in bend testing, the gauge length
(span) between the lower supports should ideally be 16 times the thickness of the specimen
[19]. This ideal span is not feasible in emu tibiae due to anatomical reasons. As a result, a
large amount of shear loading is likely present in three-point bending of the emu tibiae.
Specifically, the shear deformation is apparent in the identified ‘transition’ regions, which are
disregarded, as the focus of the fracture surface analysis was to identify only ‘tensile’ and
‘compressive’ regions. Investigation of these ‘transition’ regions would further supplement
the fracture surface analysis technique.
127
5.4.3. Failure mechanisms
Analysis of the 14-day KOH treated fracture surfaces at higher magnifications revealed
additional toughening mechanisms including crack deflection, microcracking and bridging
(as defined by uncracked ligaments and unbroken individual collagen fibers). Interlamellar
delamination and a layered morphology are commonly associated with microcracks whereas
protruding fiber bundles are usually associated with crack bridging by uncracked ligaments
and/or collagen fibers [6]. All of these toughening mechanisms have been proposed for bone
[7]. A prevalence of these features in the 14-day KOH treated fracture surfaces when
compared to untreated bones may explain the reason for the increased toughness observed for
these groups in Chapter 3 – Initial Study.
During failure in bending, collagen fibrils may separate from larger bundles and act as
‘bridges’ between adjacent lamellae. Similarly, crack bridging by uncracked ligaments along
the crack path bridge the opening crack, blunting further propagation [15,16]. As the ‘bridge’
develops, resistance to crack propagation is enhanced until a steady-state bridging zone is
achieved [25].
A discontinuous crack path is present with unbroken regions (uncracked ligaments) in both
female and male 14-day KOH treated bones. Bridges span the crack wake, limiting crack
opening and sustaining the applied load, which would otherwise be used for further crack
propagation. Crack bridging acts to resist crack opening, requiring additional energy for
fracture [15,16]. Support for this theory is provided by the high magnification images inside
cracks of the 14-day KOH treated samples, showing collagen fibrils spanning a microcrack.
Nalla et al. observed similar fibers in microcracks of human cortical bone [7]. Moreover,
fracture surface analysis of abalone shell, a biocomposite composed of calcium carbonate
and insoluble proteins, showed filaments spanning the crack. These filaments were shown to
improve the mechanical strength of the shell [11,26]. Furthermore, 14-day KOH treated male
fracture surfaces revealed interwoven mineralized collagen fibers between two adjacent
lamellae. This interconnected structure indicates resistance to a propagating crack and a
resultant expected increase in energy absorption upon failure. As a result, a ‘rougher’ fracture
surface is created and this fiber bridging may partially explain the increased toughness

128
observed in the 14-day KOH treated samples. For the untreated groups, microcracks show no
filaments spanning cracks. The crack path of untreated bones was relatively straight and
showed no evidence of bridging.
Microcracks have also been suggested as a possible toughening mechanism in bone by
shielding the crack and are constrained by the surrounding undamaged material [27].
However, the extent of microcracking was minimal in the emu tibiae of this study. If
microcrack effects impacted the samples toughness, it is assumed that this effect is secondary
to the easily identified bridging effect as a primary toughening mechanism. Another potential
toughening mechanism is the presence of cement lines and interlamellar interfaces that
deflect crack propagation [7]. In fact, microcracks have been observed to deflect along
cement lines when encountering osteons [14], suggesting that cement lines may provide a
weak path for fracture redirection. Crack deflection increases toughness by increasing the
length of the crack propagation path upon deflection, which implies more energy absorption
during its travel along the longer crack path. Subsequent crack growth is achieved when the
crack finds a more favourable, meaning less energetic, path. Microstructural features, such as
osteons and pores, play a crack arresting or deflecting role [28]. Fracture surfaces from
untreated samples appear to contain fewer features of resistance able to deflect a crack and
produce fractographic irregularities [2]. Therefore, untreated fracture surfaces have a
‘smoother’ surface compared to the ‘rougher’ KOH treated fracture surfaces.
With regards to the cement line as a weak interface, Burr et al. showed that cement lines are
weak interfaces that are more ductile than the surrounding bone matrix, as they allow crack
initiation, but provide resistance to crack growth [29]. Consequently, a propagating crack
will be decelerated by a compliant ductile interface, whereas it will be arrested by a stiffer
interface [29,30]. KOH treatment may have infused KOH between the cement line and the
surrounding tissue, altering the cement line-tissue interface. If this alteration weakened the
interface, it may result in a more compliant interface. This compliant cement line-tissue
interface could increase the ductility of the affected bone.
129
The effect of weak interfaces has long been recognized as a crack stopping mechanism in
engineering composite materials [4]. A weak interface between phases may cause separation
or delamination before the propagating crack is able to advance to the next brittle layer [31].
Conversely, a strong interface leads to high stress concentrations that cause fracture,
decreasing the toughness of the material [32]. As such, to improve toughness, interfacial
debonding and ‘frictional sliding’ are desirable as they relieve these stress concentrations.
However, extensive debonding and low interface friction decrease composite strength due to
poor load transfer. The goal is to achieve a balance between load transfer and pull-out
capabilities while still allowing for an interface to promote interfacial debonding and reduce
fiber strain [32]. In fact, it has been shown that bone with decreased bonding between the
mineral and organic phase would become more ductile [33,34]. KOH treatment may have
altered the interface between the mineral and organic matrix. Infusion of the basic solution
may have permanently affected the organic components of bone, possibly debonding the
links between the mineral and matrix through either affecting collagen and/or other protein
conformation and/or the electrostatic interaction between the mineral surface and surface
proteins. Partial debonding between the mineral and organic matrix may be an additional
mechanism that is responsible for the significant increase in toughness due to KOH
treatment.
5.5. Conclusions
The increased toughness observed in 14-day KOH treated bones compared to untreated bones
is the result of several toughening mechanisms acting together: crack deflection,
microcracking and organic matrix bridging. The increased prevalence of these mechanisms,
identified by the increase in percent area of fracture surface roughness in the 14-day KOH
treated samples are, in turn, direct results of the unique KOH treated bone microstructure.
The information gained from fracture surface analysis using SEM compliments the
mechanical testing results from Chapter 3 – Initial Study, which suggests that fracture surface
analysis is a useful technique for understanding bone fracture mechanisms.

130
5.6. Chapter Summary
The fracture surfaces of 14-day female and male KOH treated bones showed a significantly
higher ‘roughness’ compared to untreated bones, indicating that more energy was consumed
in the 14-day KOH treated fractures. Furthermore, additional toughening mechanisms, which
are important features for dissipating energy during the failure process, were observed in the
14-day KOH treated samples, but were absent in the untreated samples for both sexes. This
suggests that these mechanisms slowed the propagation of the catastrophic crack. These
results indicate that the significant increase in toughness of 14-day KOH treated bones is due
to structural alterations that enhance the ability of the bone microstructure to dissipate energy
during the failure process, thereby slowing crack propagation. Fracture surface analysis has
helped explain why 14-day KOH treated bones have increased toughness compared to
untreated bones, namely via toughening mechanisms on the compressive failure side.
However, KOH treatment may have also altered the links between the mineral and collagen,
resulting in partial debonding, which has been shown to result in a weaker bone with
increased toughness [35].

131
5.7. References
[1] Braidotti P, Branca FP, Stagni L. (1997) Scanning electron microscopy of human cortical bone failure surfaces. J.Biomech. 30:155-162.
[2] Corondan G, Haworth WL. (1986) A fractographic study of human long bone. J.Biomech.
19:207-218. [3] Bonfield W, Li CH. (1966) Deformation and fracture of bone. J.Appl.Phys. 37:869-875. [4] Piekarski K. (1970) Fracture of bone. J.Appl.Phys. 41:215-223. [5] Braidotti P, Bemporad E, D’Alessio T, Sciuto SA, Stagni L. (2000) Tensile experiments and
SEM fractography on bovine subchondral bone. J.Biomech. 33:1153-1157. [6] Sahar ND, Hong S-I, Kohn DH. (2005) Micro- and nano-structural analyses of damage of
bone. Micron. 36:617-629. [7] Nalla RK, Kinney JH, Ritchie RO. (2003) Mechanistic fracture criteria for the failure of
human cortical bone. Nat.Mater. 2:164-168. [8] Saha S, Hayes WC. (1977) Relations between tensile impact properties and microstructure of
compact bone. Calcif.Tissue.Res. 24:5-72. [9] Wise LM, Wang Z, Grynpas MD. (2007) The use of fractography to supplement analysis of
bone mechanical properties in different strains of mice. Bone. 41:620-630. [10] Jepsen KJ, Goldstein SA, Kuhn JL, Schaffler MB, Bonadio J. (1996) Type-I collagen
mutation compromises the post-yield behavior of Mov13 long bone. J.Orthop.Res. 14:493-499.
[11] Fantner GE, Birkedal H, Kindt JH, Hassenkam T, Weaver JC, Cutroni JA, Bosma BL,
Bawazer L, inch MM, Cidade GA, Morse DE, Stucky GD, Hansma PK. (2004) Influence of the degradation of the organic matrix on the microscopic fracture behavior of trabecular bone. Bone. 35:1013-1022.
[12] George WT, Vashishth D. (2005) Damage mechanisms and failure modes of cortical bone
under components of physiological loading. J.Orthop.Res. 23:1047-1053. [13] Yeni YN, Norman TL. (2000) Fracture toughness of human femoral neck effect of
microstructure, composition and age. Bone. 26:499-504. [14] Ritchie RO, Kinney JH, Druzic JJ, Nalla RK. (2005) A fracture mechanics and mechanistic
approach to the failure of cortical bone. Fat.Fract.Engng.Mater.Struct. 28:345-371. [15] Vashishth D, Behiri JC, Bonfield W. (1997) Crack growth resistance in cortical bone:
concept of microcrack toughening. J.Biomech. 30:763-769. [16] Vashishth D, Tanner KE, Bonfield W. (2000) Contribution, development and morphology of
microcracking in cortical bone during crack propagation. J.Biomech. 33:1169-1174.

132
[17] Yeni YN, Norman TL. (2000) Calculation of porosity and osteonal cement line effects on the effective fracture toughness of cortical bone in longitudinal crack growth. J.Biomed.Mater.Res. 51:504-509.
[18] Wynnyckyj C, Omelon S, Savage K, Damani M, Chachra D, Grynpas MD. (2009) A new
tool to assess the mechanical properties of bone due to collagen degradation. Bone. 44:840-848.
[19] Turner CH, Burr DB. (1993) Basic biomechanical measurements of bone: a tutorial. Bone.
14:595-608. [20] von Knoch M, Bluhm A, Morlock M, von Foerster G. (2003) Absence of surface roughness
changes after insertion of one type of matte cemented femoral component during 2 to 15 years. J.Arthroplasty. 18:471-7.
[21] Szmukler-Moncler S, Testori T, Bernard JP. (2004) Etched implants: a comparative surface
analysis of four implant systems. J.Biomed.Mater.Res.B.Appl.Biomater. 69:46-57. [22] Callister WD. (2003) Materials Science and Engineering: An Introduction 7th ed. John Wiley
& Sons, New York. [23] Currey JD, Brear K. (1992) Fractal analysis of compact bone and antler fracture surfaces.
Biomimetics. 1:103-118. [24] Zimmermann EA, Launey ME, Barth HD, Ritchie RO. (2009) Mixed-mode fracture of
human cortical bone. Biomater. 30:5877-5884. [25] Kruzic JJ, Scott JA, Nalla RK, Ritchie RO. (2006) Propagation of surface fatigue cracks in
human cortical bone. J.Biomech. 39:968-972. [26] Smith BL, Schaffler TE, Tilman E, Viani M, Thompson JB, Frederick NA, Kindt J, Belcher
A, Stucky GD, Morse GE, Hansma PK. (1999) Molecular mechanistic origin of the toughness of natural adhesives, fibres and composites. Nature. 399:761-763.
[27] Kruzic JJ, Nalla RK, Kinney JH, Ritchie RO. (2003) Crack blunting, crack bridging and
resistance-curve fracture mechanics in dentin: effect of hydration. Biomater. 24:5209-5221. [28] Hazenberg JG, Taylor D, Lee TC. (2006) Mechanisms of short crack growth at constant
stress in bone. Biomater. 27:2114-2122. [29] Burr DB, Schaffler MB, Frederickson RG. (1988) Composition of the cement line and its
possible mechanical role as a local interface in human compact bone. J.Biomech. 21:939-945. [30] Kendall K. (1975) Control of cracks by interfaces in composites. Proc.R.Soc.Lond. 341:409-
428. [31] Cooke F, Zeidman H, Scheifele SJ. (1973) The fracture mechanics of bone – another look at
composite modeling. J.Biomed.Mater.Res.Symp. 4:383-399. [32] Beyerlein IJ, Zhu YT, Mahesh S. (2001) On the influence of fiber shape in bone-shaped
short-fiber composites. Compos.Sci.Technol. 61:1341-1357.
133
[33] Bundy KJ. (1985) Determination of mineral-organic bonding effectiveness in bone--theoretical considerations. Ann.Biomed.Eng. 13:119-35.
[34] Kotha SP, Guzelsu N. (2000) The effects of interphase and bonding on the elastic modulus of
bone: changes with age-related osteoporosis. Med.Eng.Phys. 22:575-85. [35] Walsh WR, Ohno M, Guzelsu N. (1994) Bone composite behaviour: effects of mineral-
organic bonding. J.Mater.Sci.Mater.Med. 5:72-79.

134
Chapter 6 Collagen Degradation
6.1. Introduction
6.2. Experimental Details
6.2.1. Reagents 6.2.2. Emu bone samples and KOH treatment
6.2.3. Powder X-ray diffraction 6.2.4. Quantitative backscattered electron imaging 6.2.5. Microhardness testing 6.2.6. Bone powder preparation 6.2.7. α-Chymotrypsin 6.2.8. DSC 6.2.9. SDS-PAGE 6.2.10. Polarized light microscopy 6.2.11. Statistical analysis
6.3. Results
6.3.1. Powder X-ray diffraction 6.3.2. Microhardness 6.3.3. Quantitative backscattered electron imaging 6.3.4. α-Chymotrypsin 6.3.5. DSC 6.3.6. SDS-PAGE 6.3.7. Polarized light microscopy
6.4. Discussion
6.4.1. Mineral characterization 6.4.2. Collagen degradation 6.4.3. Partial debonding of the collagen-mineral interface 6.4.3. Sex differences
6.5. Conclusions
6.6. Chapter summary
6.7. References
135
The following manuscript is currently in revision in Biochimica et Biophysica Acta, General
Subjects under, “Mechanism of bone collagen degradation due to KOH treatment”. This
chapter is a continuation of the work done in Chapter 3. In this chapter, we characterized the
mineral and collagen phases of untreated (0-day) and KOH treated emu tibiae in order to gain
insights into the KOH mechanisms responsible for the altered bone mechanical properties
induced by endocortical KOH treatment observed in Chapter 3.
6.1. Introduction
The mechanical properties of bone are dependent on the quality, specific arrangement and
interaction of an organic matrix and mineral apatite crystals (hydroxyapatite) that form a
carefully designed composite material. Bone consists of approximately 65% mineral and
30% organic matrix, including proteins and cells with the remainder solutes [1]. The mineral
component of bone is composed of small, poorly crystalline and highly substituted apatite
crystals [1,2]. The mineral phase largely contributes to the overall strength and stiffness of
bone [2,3]. The organic matrix consists mainly (~90%) of Type I collagen, a triple helical
molecule that is specifically arranged in several hierarchical levels to provide elasticity and
toughness to bone [2,4,5]. The remainder of the organic matrix components consists of
various noncollagenous proteins that have functions that include initiation and inhibition of
mineral deposition. Some of the most abundant noncollagenous proteins are osteonectin,
osteocalcin, osteopontin and bone sialoprotein. While their individual roles are still not fully
defined, it is well understood that some of these proteins play integral roles in the initiation
and regulation of both mineral deposition and maturation [1]. Finally, it has been reported
that the interaction between the mineral and the collagen matrix play an important role in the
mechanical properties of bone [6,7].
Type I collagen is a heterotrimer composed of two α1(I) chains and one α2(I) chain in a triple
helical structure [8]. The triple helical collagen molecule, which is stabilized by hydrogen
bonds, aggregates with other collagen molecules to form a staggered array that is stabilized
by intermolecular crosslinks. These microfibrils aggregate into collagen fibers to form a
highly hierarchical collagen network structure [9-12]. It has been shown that changes in
collagen molecules, their lattice structure (packing) and crosslinks may affect the mechanical
136
integrity of the collagen network and subsequently lead to altered bone strength and
toughness [12-15].
Various analytical techniques have been developed to detect differences in the collagen
network of bone. Several studies have utilized a selective digestion technique that is
generally thought to distinguish between denatured and intact collagen molecules.
Identification and detection of these different collagen molecules allows for the direct
measurement of the percentage of degraded collagen [6,11,12,16-19]. The thermostability of
the collagen network has been measured frequently using calorimetry and correlated to
collagen network quality [20-27]. Direct mechanical testing has also been used to assess the
properties of the collagen network [11,12,15,17,28,29].
To study the contribution of collagen to the mechanical properties of bone, we developed a
model using the emu tibiae. In this model, the infusion of a basic solution was expected to
affect the collagen component of bone, while leaving the mineral content of bone unaltered,
as apatite is stable in basic solutions [7]. The role of collagen on bone mechanical properties
is gaining more prominence as the changes brought on by osteoporosis and other disorders
are now known to affect the organic matrix of bone and cannot be predicted with the use of
bone mineral density (BMD) measurements [30]. While the KOH treatment is not
physiological, its role is to improve our understanding of the mechanisms by which collagen
degradation, not removal, affects bone mechanical properties.
Female and male emu tibiae were endocortically treated with 1 M potassium hydroxide
(KOH) solution for 1-14 days resulting in negligible mass loss (0.5%), collagen loss (0.05%),
no differences in geometrical parameters, but exhibiting significant changes in mechanical
properties. Female and male emu tibiae showed significant decreases in failure stress and
increased failure strain and toughness with increasing KOH treatment time. These changes
were more significant in male bones compared to female bones [7]. KOH was chosen as a
degradation agent as it has been used previously to affect bone tissue [31,32] and the use of
KOH does not require a demineralization step. Consequently, this degradation method retains
the mineral phase and the geometry of the bone. While the mechanism of action of KOH is

137
not well understood, it is likely to be similar to sodium hypochlorite. Sodium hypochlorite
extraction leaves the mineral phase largely unaffected [31], similar to results seen in our
initial study with KOH treatment [33]. The high pH of 14 of the 1 M KOH solution is likely
to result in conformational changes to the collagen and may also affect mineral-organic
interactions [34].
The goal of the present study was to gain insights into the KOH mechanisms that alter the
collagen properties and/or the interface between the mineral and collagen. The hypothesis of
the present study is that in situ collagen degradation rather than collagen loss may be
responsible for the significant changes in bone mechanical properties induced by
endocortical KOH treatment. To test this hypothesis, bone samples were analyzed using
powder x-ray diffraction, microhardness testing, quantitative backscattered electron imaging,
an α-chymotrypsin selective collagen digestion technique, differential scanning calorimetry,
SDS-PAGE and polarized light microscopy. Correlations of collagen degradation results with
previously reported bone mechanical properties (from Chapter 3 – Initial Study) were also
explored.
6.2. Experimental Details
6.2.1. Reagents
Ethylenediaminetetraacetic acid (EDTA), benzamidine, N-ethylmaleimide, ε-amino-n-
caproic acid, phenylmethylsulfonyl fluoride, Tris, iodoacetamide, pepstatin A, chloramine-T,
Ehrlich’s reagent, pepsin, urea, sodium phosphate, sodium dodecyl sulfate (SDS) and β-
mercaptoethanol were purchased from Sigma Aldrich (Milwaukee, WI). Chloroform,
methanol, perchloric acid, potassium hydroxide, hydrochloric acid, sodium hydroxide and
glacial acetic acid were obtained from Fisher Scientific (Pittsburgh, PA). α-Chymotrypsin
(TLCK-treated) was purchased from MP Biomedical (Solon, OH).
6.2.2. Emu bone samples and KOH treatment
The emu bone tibiae samples from Chapter 3 – Initial Study, were used in this study. These
bones were endocortically treated with 1 M potassium hydroxide (KOH), followed by
mechanical testing in three-point bending [7]. Bones were divided into two groups of female

138
and male tibiae with ten samples allocated to each of 0, 1, 3, 7 or 14-day KOH treatments.
An additional ten female and ten male bones were filled with saline instead of KOH for 14
days to act as controls. Computed Tomography (CT) scans were taken at the mid-point of
each emu tibia with an Aquilion 64 CT scanner (Toshiba, Canada) before and after the
different KOH treatment time points to normalize load-displacement data and to eliminate
differences caused by variation in geometry.
Briefly, skeletally mature (3-5 years of age) whole emu tibiae were separated from the
femora and tarsometatarsi with a scalpel. The shaft of each tibia was then isolated by using a
circular saw to remove the ends (15% of the total bone length from the proximal end and
10% from the distal end). The marrow and trabecular bone from the diaphysis of the tibiae
were removed by drilling longitudinally through the bone shaft, after which the medullary
canal was flushed with tap water [7]. The emu tibiae were filled with 1 M KOH and the ends
were sealed with polymethylmethacrylate (PMMA, SR Ivolen Liquid and Powder, Ivoclar
Vivadent, Mississauga, ON). The bones were held horizontally over a collection basin and
kept moist with a 0.9% saline solution drip. The bones were rotated 180 ° around the axial
axis every 12 hours during the KOH treatment. After the desired treatment period, the KOH
solution was reclaimed, its volume measured and the endocortical surfaces of the bones
rinsed in running tap water for one hour. Emu tibiae were then tested in three-point bending
using a servo-hydraulic materials testing machine (Model 8511, Instron, Canton, MA). The
bone was secured in the three-point bending jig with a 100 N pre-load and then loaded to
failure at a displacement rate of 0.04 mm/s. Force and displacement data were collected and
normalized using geometric data from CT scans to create stress-strain curves to determine
the elastic modulus (E; GPa), ultimate stress (σuts; MPa), failure stress (σf; MPa), failure
strain (εf, %), and toughness (U; mJ/mm3).
6.2.3. Powder X-ray diffraction
To evaluate crystal size and changes in overall crystallinity, powder X-ray diffraction (XRD)
was performed on ground emu tibiae. In powder XRD, x-rays scan the surface of bone
powder over specified incident angles and are reflected. Sharp peaks at specific incident
angles are generated for crystalline materials, which are determined by the regular spacing

139
between the atomic planes in the relevant crystal structure. In poorly crystalline materials and
materials with crystals of very small dimensions (<100 Å), the peaks are broadened.
Broadening of the peaks in bone XRD scans is largely due to the small crystal size of bone
apatite and inherent lattice strain effects. The measurement of this peak broadening can then
be related to the average crystal size/strain [35].
For each bone, ten mm thick cross-sections from each group were cut, manually crushed,
Tris-washed, lyophilized, defatted overnight in a 2:1 chloroform:methanol solution and dried.
Dry specimens were ground to a powder (<45 μm particle size) using a cryogenic freezer
mill (SPEX Certiprep 6750 Freezer Mill, Metuchen, NJ). Each powdered sample was spread
into a thin even layer on a quartz crystal sample holder for powder X-ray diffraction scans
(Rigaku MultiFlex, Rigaku/MSC, Woodland, TX). Using CuKα radiation at 40 kV and 40
mA, samples were scanned from 24.5 to 27.0 degrees (2θ) at a scan speed of 0.1 degrees per
minute for crystal length (002) determination. Additionally, samples were scanned from 37.0
to 42.0 degrees (2θ) at a scan speed of 0.05 degrees per minute for crystal cross-section (310)
analysis. A NIST reference material (2910, Calcium Hydroxyapatite) was used as a standard
for every run.
Crystallite size was calculated from the peak broadening of the powder XRD peaks [36].
This broadening can be estimated by measuring the full width at half the maximum height
(FWHMH) of each of the apatite peaks (β1/2 (002) and β 1/2 (130)), using the JadeTM XRD
pattern processing software (Materials Data Inc., Win-OS V5). Since peak broadening (β)
can also be affected by instrument broadening, the sample peak widths were appropriately
adjusted using values obtained by scanning reference silicon at 26 and 55 °2θ. The
broadening due to the specimen only (corrected β1/2) was calculated from the square root of
the instrument broadening squared subtracted from the measured specimen peak broadening
squared. This corrected β1/2 was used to calculate the crystalline size between the (002) and
(310) planes using the Debye-Scherrer equation:
θβλKD
cos3.57
2/1=

140
where 57.3 is a conversion factor from degrees to radians, K is a correction factor (0.9) used
to reflect the elongated apatite crystals of bone, λ is the K-emission wavelength of copper, θ
is the diffraction angle and D is the size of the crystallite in angstroms along the specific axis.
The means of three independent FWHMH values for each 26 and 40 °2θ peak were
calculated for each sample.
6.2.4. Quantitative backscattered electron imaging
Quantitative backscattered electron (qBSE) imaging allows the determination of the
mineralization profile of a bone section using a scanning electron microscope. A scanning
electron microscope works through a focused beam that is continuously scanned over the
surface of a sample causing backscatter of the primary electrons and ejection of secondary
electrons. Areas containing higher atomic numbers have an increased probability of collision
with these electrons. Heavy elements (high atomic number) backscatter electrons more
strongly compared to light elements (low atomic number) and thus appear brighter in the
image. These backscattered electrons are used to detect contrast between areas with different
chemical compositions. Therefore, an area of bone with a greater density of calcium atomic
nuclei will display a greater intensity of electron collisions [39].
For each bone, ten mm thick sections of bone from each group were cut and subsequently
divided into four sections: anterior, posterior, medial and lateral. Samples were dehydrated in
ascending concentrations of acetone and subsequently infiltrated in ascending ratios of
unpolymerized Spurr resin and acetone. The bones were then embedded in blocks of Spurr
resin that were polymerized in a 60 °C oven for 48 hours. These blocks were ground,
polished, carbon-coated and imaged using quantitative backscattered electron (BSE) imaging
for evaluation of mineralization distribution (solid state BSE detector, FEI Company,
Hillsboro, OR) on a Phillips XL30 ESEM (FEI). Beam conditions were set at 20 kV, working
distance of 15 mm and a spot size of 7. The relative backscattering of the samples was
determined by comparison with a silicon dioxide standard, which was measured between
every specimen measurement. This was required to correct for the variation (drift of the
machine) that could potentially occur between specimens.

141
Histograms of the grey level distribution were created for each of the anterior, posterior,
medial and lateral sections of the cortical samples, with increasing brightness representing
increasing mineralization [40]. A Quips program on a Quantimet 500 IW system sets up a
series of bins based on the intensity of the pixels and calculates the number of pixels falling
in each bin. This information is used to create a histogram of each image. From the
histograms, the grey level of the histogram peak was determined and used to represent the
overall degree of mineralization. The full width at half the maximum height (FWHMH) of
each histogram was also noted, which represents the heterogeneity of the distribution [40].
Images obtained from quantitative BSE were next analyzed for the number of large and small
pores as well as the total width of the dark band from the endocortical region towards the
periosteal region for the medial, lateral, anterior and posterior zones of the bones using a
Quips program on a Quantimet 500 IW system. A 47 μm diameter threshold was used for the
separation between small and large pores. This threshold value was determined after
analyzing a histogram of the overall pore area, which showed two maximum points (bi-
modal distribution). The lowest point of the ‘valley’ between the two maxima was defined as
the threshold value.
6.2.5. Microhardness testing
Hardness refers to the resistance of a material to indentation. Strong correlations have been
found between microhardness and mechanical properties of bone [37,38].
Following quantitative BSE imaging, the same Spurr embedded blocks were subsequently
used for microhardness testing on a microhardness testing machine (Mitutoyo HM-122, S/N
260113). During the test, a pyramidal diamond indenter of known geometry was lowered
onto the sample under a known load for 10 s, leaving an indentation on its surface. The
resulting length of the indentation and applied force are related to the microhardness of the
bone using the following equation:
2 2 1891.02sin2
102.0102.0D F
D
θF
SF
SF k HV ====

142
where HV is the Vickers Hardness, k is a constant (0.102), F is the test force (0.025 kg), S is
the surface area of indentation (mm2), D is the average length of two diagonals (mm) and θ is
the face-to-face apex angle of the diamond indenter (136°). Indentations were taken from the
endocortical region to the periosteal region (250 μm from the bone edge; 125 μm between
each measurement). Five measurements were taken at the medial, lateral, anterior and
posterior zones of the bone in order to obtain the hardness profile of each sample.
6.2.6. Bone powder preparation
After mechanical testing, ten mm thick cross-sections of bone from each group were cut into
smaller pieces using a table saw, washed by vortexing three times in 0.2 M Tris-HCl (pH 7.4)
containing the following protease inhibitors (PI): benzamidine (5 mM); N-ethylmaleimide (5
mM); ε-amino-n-caproic acid (10 mM) and phenylmethylsulfonyl fluoride (PMSF) (1 M)
and then dried overnight on a lyophilizer. Samples were then defatted in a 2:1
chloroform:methanol mixture and left to agitate for 24 hours at room temperature. Defatted
samples were placed in 100% methanol for one hour and left to dry overnight. Dried samples
were ground to a fine powder using a cryogenic freezer mill (SPEX certiprep 6750 Freezer
Mill, Metuchen, NJ) [41-43]. Next, the powder was demineralized in buffered (pH 7.4) 0.5 M
ethylenediaminetetraacetic acid (EDTA), 4 M guanidine hydrochloride (GuHCl) with PI at 4
°C for three weeks with daily exchanges and then thoroughly washed three times in distilled
water [19,41-43]. The extracts of collagen-rich powder were lyophilized in preparation for α-
chymotrypsin digestion, DSC and SDS-PAGE.
6.2.7. α-Chymotrypsin
The amount of collagen degraded by KOH treatment was determined by the assay described
by Bank et al. [16], which is based on the observation that α-chymotrypsin digests
denatured/degraded collagen but not intact triple helical polymeric collagen [44]. Ten mg of
demineralized bone powder were digested at 37 °C for 24 hours in one ml of incubation
buffer (0.1 M Tris HCl pH 7.3, 1 mM iodoacetamide, 1 mM EDTA and 10 μg/ml pepstatin-
A), containing one mg/ml α-chymotrypsin. Since α-chymotrypsin selectively digests
degraded collagen, the solubilized (degraded) collagen was separated from intact polymeric

143
collagen by removing the supernatant (containing the degraded collagen molecules) from the
remaining insoluble matrix (containing the intact polymeric collagen molecules) [6].
The amounts of collagen in the supernatant and the pellet were determined using the
colourimetric hydroxyproline assay according to the method of Woessner [45], assuming that
collagen is 10% hydroxyproline [45,46]. Specimens were hydrolyzed in one ml of 6 N HCl
for 18 hours at 110 °C. Hydrolyzates were then neutralized with 2.4 ml of 2.5 N NaOH per
ml of HCl and diluted with distilled water. The samples were prepared for colourimetric
analysis with the addition of 0.05 N chloramine-T, 3.15 N perchloric acid and Ehrlich’s
Reagent. The colourimetric reaction was quantified with a μ-Quant Microplate
Spectrophotometer (BioTek Instruments, Winooski, VT) at 560 nm. Absorbance values were
plotted against the concentration of standard hydroxyproline (0-5 μg) and the quantity of
hydroxyproline determined from the standard curve [45]. Finally, the percentage of digested
collagen was calculated by dividing the amount of hydroxyproline present in the supernatant
by the sum of amount of hydroxyproline present in the supernatant and remaining matrix
[16]. The α-chymotrypsin digestion assay was performed in triplicates for each specimen.
6.2.8. DSC
Differential scanning calorimetry (DSC) was utilized in order to detect collagen denaturation
and/or changes in intermolecular structure (collagen degradation) [21,22,27]. Fifty μl of PBS
was added to ten mg of bone powder to maintain the collagen in a fully hydrated condition
[47]. The hydrated demineralized bone powder was then equally divided into three volumes
in order to perform triplicate measurements of each sample. Specimens were loaded in
hermetically sealed, aluminum DSC pans (TA Instruments Inc., New Castle, DE) and
scanned at 5 °C per minute from 25 °C to 85 °C [21,47,48]. An empty pan was used as a
reference. Samples were run on a TA Instruments DSC Q2000 calorimeter with refrigerated
cooling system (TA Instruments Inc., New Castle, DE). Temperature and heat flow scales
were calibrated with Indium standards.
After DSC analysis, the collagen content of each pan was determined using the
hydroxyproline assay, as described above [45], to normalize thermal properties to collagen

144
content. From the resulting thermogram of heat flow versus temperature (Figure 6.1), the
following thermodynamic parameters were determined: denaturation temperatures (Tonset and
Tpeak), enthalpy of denaturation (ΔH), Height and full width at half maximum height
(FWHMH) of the endothermic peak. Specifically, Tonset (°C) and Tpeak (°C) provide measures
of the thermal stability. Enthalpy of denaturation, ΔH (J/g) is the area under the thermogram
normalized to collagen mass and is the amount of heat required for denaturation. Height
(mW/mg) is the height of the thermogram peak normalized to collagen mass and FWHMH
(°C) is the full width at half maximum height of the endothermic peak. Together, the height
of the thermogram peak and FWHMH values provide a measure of the heterogeneity of the
molecular structure (shape of the curve). All parameters were determined using the DSC
system software (TA Instruments, Universal Analysis 2000).
Figure 6.1: Schematic of a typical DSC curve and the definitions of the DSC parameters measured. Tonset (°C) is the intersection of a line that is tangent to the steepest section of the leading edge and the baseline of the thermogram. Tpeak (°C) is the denaturation temperature at maximum heat flow. Enthalpy of denaturation, ΔH (J/g), is the area under the thermogram peak normalized to collagen weight. Height (mW/mg) is the height of the thermogram peak normalized to collagen weight and FWHMH (°C) is the full width at the half maximum of the thermogram.
Temperature (degrees C)
FWHMH
ΔH
Height
Tonset Tpeak
area =
Temperature (degrees C)
FWHMH
ΔH
Height
Tonset Tpeak
area =

145
6.2.9. SDS-PAGE
Sodium dodecyl sulfate polyacrylamide gel electrophoresis (SDS-PAGE) was used to
determine the amount of collagen fragmentation due to KOH treatment. Using an established
protocol [42,49], demineralized bone powder was solubilized in 0.5 M acetic acid solution
with pepsin in a 10:1 weight ratio of bone collagen to enzyme for 72 hours at 4 °C [50,51].
The reaction was neutralized and the samples centrifuged for 30 minutes at 14,000 rpm to
remove insoluble collagen. The concentration of soluble collagen in the supernatant was
determined by measuring the hydroxyproline content, as described above.
A one ml aliquot of solubilized collagen and fragments from each sample was lyophilized
and resuspended in a buffer containing 0.01 M sodium phosphate pH 7.2, 2 M urea and 0.1%
sodium dodecyl sulfate (SDS) [52-54]. Samples loaded onto the gel contained a 1:1 mixture
of protein (20 μg) to Laemmli buffer (BioRad) with 10% β-mercaptoethanol. The samples
were loaded in duplicates and then electrophoresed for 2 hours at 140 V on a 4-20% gradient
polyacrylamide gel (BioRad). A BioRad Precision Plus Protein Dual Colour Standard (5 μL)
and acid-soluble rat tail tendon collagen Type I (5 μg, Sigma) were loaded to act as a protein
standard and a pure collagen control, respectively. The gels were stained with Coomassie
Blue staining solution (BioRad) for one hour and then washed overnight in a methanol:acetic
acid solution until destained. Protein bands were visualized using densitometry and the
images were analyzed using ImageJ (ImageJ 1.28u, National Institutes of Health). Only
intact α-chain bands (α1(I) and α2(I)) were quantified by defining each lane with the
rectangular tool, which generated lane profile plots. Lines were drawn to enclose the peaks of
interest (α1(I) and α2(I)) and to determine the average collagen peak intensity (area under
peak).
6.2.10. Polarized light microscopy
Polarized light microscopy was used to analyze the arrangement of the collagen fibril
network in bone sections [55]. Ten mm thick cross sections were cut from untreated (0-day)
and 14-day KOH treated female and male emu tibiae. From these samples, transcortical
sections were cut (10 mm long, 5 mm circumferentially). These samples were then
demineralized in buffered (pH 7.4) 0.5 M EDTA with protease inhibitors (PI) at 4 °C for six

146
weeks with daily exchanges and then thoroughly washed three times in distilled water
[19,41-43]. After dehydration and paraffin embedding, five μm sections were cut and stained
with 0.1% picro-sirius red F3B (BDH) [56]. Picro-sirius red is used to identify collagen
fibres, by the reaction between its sulphonic acid groups and the basic groups found in
collagen fibres [55]. Picro-sirius red stains collagen red in a bright-field microscope, whereas
under polarization microscope collagen appears bright orange/red and/or bright green [55].
The sections were examined at 150X magnification at the endocortical and periosteal regions
on a Leica microscope with the use of polarized light and filter analyzer. Images were
acquired using a Leica CCD camera.
6.2.11. Statistical analysis
Statistical analysis was performed using SPSS (SPSS 16.0 for Windows, Chicago, IL)
statistical analysis software. Tests for normality and equality of variances were initially
performed to determine whether parametric or non-parametric t-tests should be used. Two-
way analysis of variance (ANOVA, general linear model) was performed to examine the
effects of sex and KOH treatment on all measured parameters in the emu model and multiple
comparisons (Fisher’s Least Significant Difference (LSD)) were made to detect significant
differences between the groups. In addition, multiple regression analyses were used to
explore the correlations of bone mechanical properties (elastic modulus, failure stress, failure
strain and toughness) from Chapter 3 – Initial Study with the percent degraded collagen from
each technique. Differences between percent degraded collagen with bending mechanical
parameters were investigated using a generalized linear model to determine any differences
between sexes. All data are presented as mean ± standard error of the mean. A confidence
level of 95% (p=0.05) was considered statistically significant for differences and
correlations.
6.3. Results
Significant differences were found in the biochemical parameters measured between the
KOH treated groups and the untreated groups, as well as between sexes. All parameters
measured for the control group (14-day filled with saline) were similar to those of the
untreated (0-day) groups (Appendix A) for both female and male emu tibiae. The data for all

147
treated groups were combined for the regression analysis of the parameters for female and
male data.
6.3.1. Powder X-ray diffraction
The KOH treatment did not affect the crystal size (length and cross section) as there were no
differences between crystal size at the periosteum (unaffected by KOH) and the endocortex
(region affected by KOH) (Table 6.1). There were no differences observed between sexes.
6.3.2. Microhardness
Microhardness testing did not show differences between locations (medial, lateral, anterior
and posterior zones), nor with increasing distance from the endocortical region. The data was
thus grouped and no differences were observed between sexes at any KOH treatment time
point (Table 6.1).
Table 6.1: Emu bone mineral crystal length (002) and cross section (310) estimated by XRD and microhardness testing results.
KOH treatment time in days Parameter
Sex
0 1 3 7 14
Female 205 ± 2 203 ± 3 204 ± 2 201 ± 3 206 ± 2 Crystal length 26° peak (Å) Male 209 ± 2 204 ± 3 207 ± 4 203 ± 2 211 ± 2
Female 62.1 ± 0.5 62.9 ± 0.7 62.8 ± 0.6 63.3 ± 0.6 62.8 ± 0.6 Crystal cross section 40° peak (Å) Male 62.9 ± 0.6 62.8 ± 0.8 63.4 ± 0.9 63.5 ± 0.6 63.9 ± 0.6
Female 61 ± 0.4 62 ± 0.8 61 ± 0.4 61 ± 0.6 63 ± 0.5 Microhardness, HV (kg/mm2) Male 62 ± 0.5 61 ± 0.8 61 ± 1.0 62 ± 0.9 63 ± 0.7
6.3.3. Quantitative backscattered electron imaging
The average peak grey level and FWHMH, which measures the heterogeneity of the
mineralization distribution, did not show any differences between sexes as well as with KOH
treatment time (Table 6.2). Porosity measurements revealed no differences in large pore
density (pore diameter > 47 μm) and small pore density (pore diameter < 47 μm) between
sexes and KOH treatment time (Table 6.2). BSE images revealed a darker coloured banding
on the endorcortical region of the samples. The total distance of dark band was measured:

148
there were no differences in the total width of the dark endocortical band between medial,
lateral, anterior and posterior locations, allowing pooling of measurements per specimen.
Once grouped, KOH treated samples (7-day and 14-day) for both sexes had significantly
(p<0.001) greater total width of the dark endocortical band compared to untreated (0-day)
samples (Table 6.2, Figure 6.2). There were no differences between sexes.
Table 6.2: Quantitative BSE results for tibiae of female and male KOH treated bone. KOH treatment time in days
Parameter
Sex 0 1 3 7 14
Female 177 ± 7 181 ± 7 184 ± 8 182 ± 7 175 ± 8 Peak grey level (pixels) Male 175 ± 9 181 ± 5 179 ± 8 188 ± 9 174 ± 8
Female 25 ± 3 27 ± 3 26 ± 2 27 ± 3 23 ± 2 FWHMH (pixels) Male 23 ± 3 25 ± 3 25 ± 2 26 ± 3 24 ± 3
Female 0.23 ± 0.06 0.20 ± 0.06 0.14 ± 0.07 0.14 ± 0.09 0.16 ± 0.06 Large Pore Density (#/mm2) Male 0.22 ± 0.07 0.26 ± 0.06 0.18 ± 0.11 0.18 ± 0.07 0.11 ± 0.06
Female 110 ± 4 106 ± 5 101 ± 5 105 ± 7 108 ± 4 Small Pore Density (#/mm2) Male 110 ± 4 115 ± 5 107 ± 8 108 ± 5 110 ± 5
Female 190 ± 45 259 ± 47 326 ± 47 357 ± 50a 409 ± 50a Total Length of Dark Band (μm) Male 220 ± 45 268 ± 53 298 ± 71 375 ± 43a 445 ± 47a
ap ≤ 0.05 versus untreated (0-day) KOH treatment time

149
Figure 6.2: BSE Images of (a) 0-day (untreated) female, (b) 0-day (untreated) male, (c) 14-day female and (d) 14-day male emu tibiae. Magnified regions of the width of the dark endocortical band are shown in (e) 14-day female and (f) 14-day male emu tibiae. For each image, the endocortical region is found on the right side. After 14-day KOH treatment, a dark band is apparent beginning from the endocortical region and moving towards the periosteal region (see white enclosed box, magnified images in (e) and (f) and the black arrows spanning from the endocortical side to the end of the dark band).
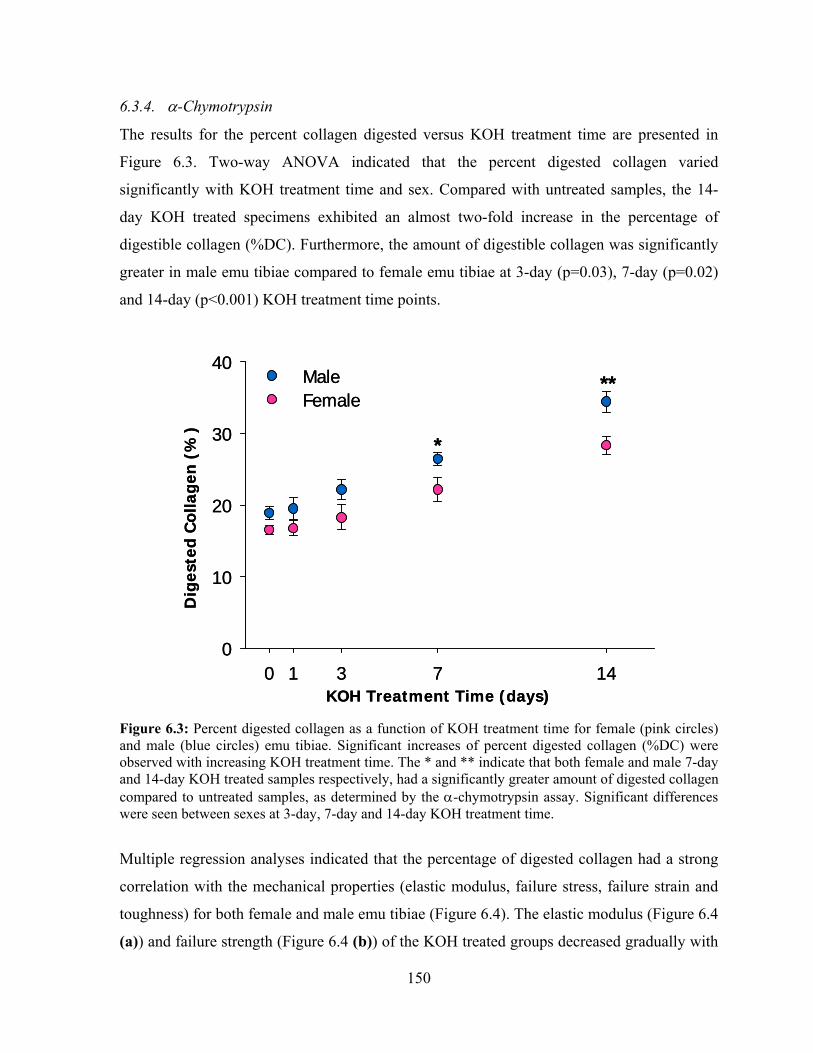
150
6.3.4. α-Chymotrypsin
The results for the percent collagen digested versus KOH treatment time are presented in
Figure 6.3. Two-way ANOVA indicated that the percent digested collagen varied
significantly with KOH treatment time and sex. Compared with untreated samples, the 14-
day KOH treated specimens exhibited an almost two-fold increase in the percentage of
digestible collagen (%DC). Furthermore, the amount of digestible collagen was significantly
greater in male emu tibiae compared to female emu tibiae at 3-day (p=0.03), 7-day (p=0.02)
and 14-day (p<0.001) KOH treatment time points.
Figure 6.3: Percent digested collagen as a function of KOH treatment time for female (pink circles) and male (blue circles) emu tibiae. Significant increases of percent digested collagen (%DC) were observed with increasing KOH treatment time. The * and ** indicate that both female and male 7-day and 14-day KOH treated samples respectively, had a significantly greater amount of digested collagen compared to untreated samples, as determined by the α-chymotrypsin assay. Significant differences were seen between sexes at 3-day, 7-day and 14-day KOH treatment time.
Multiple regression analyses indicated that the percentage of digested collagen had a strong
correlation with the mechanical properties (elastic modulus, failure stress, failure strain and
toughness) for both female and male emu tibiae (Figure 6.4). The elastic modulus (Figure 6.4
(a)) and failure strength (Figure 6.4 (b)) of the KOH treated groups decreased gradually with
0 1 3 7 140
10
20
30
40MaleFemale
KOH Treatment Time (days)
Dig
este
d C
olla
gen
(%
)
*
**
0 1 3 7 140
10
20
30
40MaleFemale
KOH Treatment Time (days)
Dig
este
d C
olla
gen
(%
)
*
**
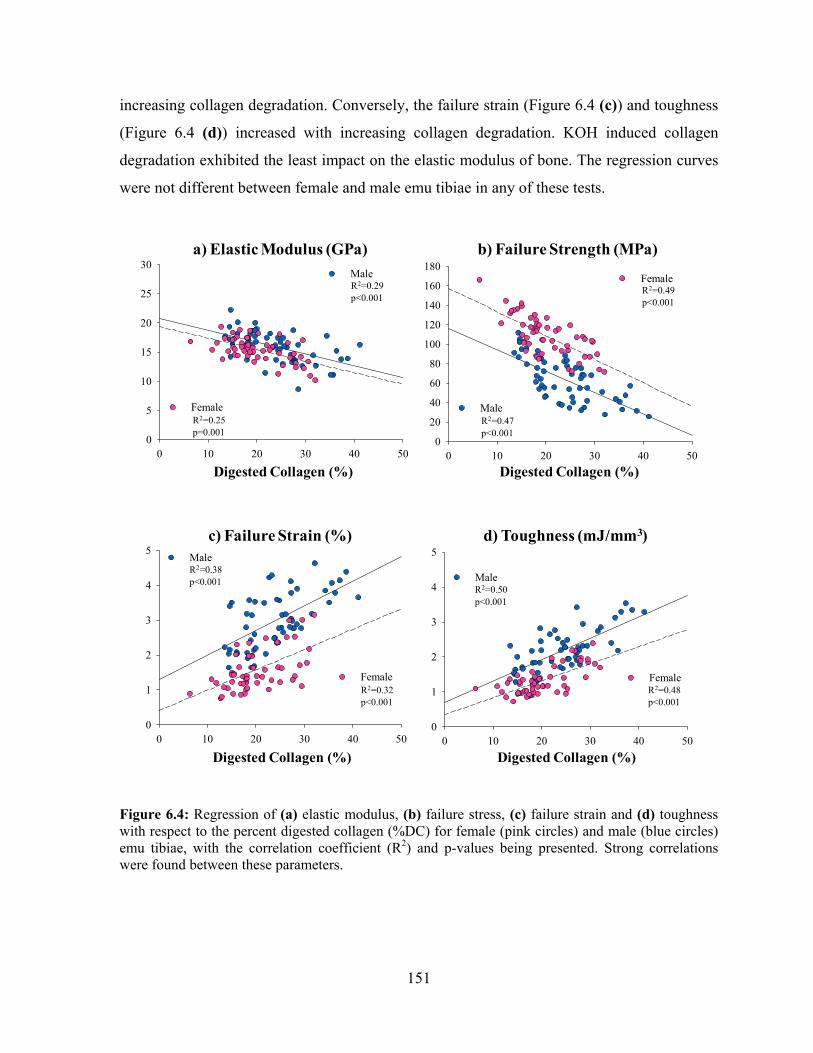
151
increasing collagen degradation. Conversely, the failure strain (Figure 6.4 (c)) and toughness
(Figure 6.4 (d)) increased with increasing collagen degradation. KOH induced collagen
degradation exhibited the least impact on the elastic modulus of bone. The regression curves
were not different between female and male emu tibiae in any of these tests.
0 10 20 30 40 500
20
40
60
80
100
120
140
160
180
Male
Female
0 10 20 30 40 500
5
10
15
20
25
30Male
Female
Digested Collagen (%)
a) Elastic Modulus (GPa) b) Failure Strength (MPa)
R2=0.29p<0.001
R2=0.25p=0.001
R2=0.47p<0.001
R2=0.49p<0.001
Digested Collagen (%)
0 10 20 30 40 500
1
2
3
4
5
Male
Female
0 10 20 30 40 500
1
2
3
4
5 Male
Female
c) Failure Strain (%) d) Toughness (mJ/mm3)
R2=0.38p<0.001
R2=0.32p<0.001
R2=0.50p<0.001
R2=0.48p<0.001
Digested Collagen (%) Digested Collagen (%)
Figure 6.4: Regression of (a) elastic modulus, (b) failure stress, (c) failure strain and (d) toughness with respect to the percent digested collagen (%DC) for female (pink circles) and male (blue circles) emu tibiae, with the correlation coefficient (R2) and p-values being presented. Strong correlations were found between these parameters.
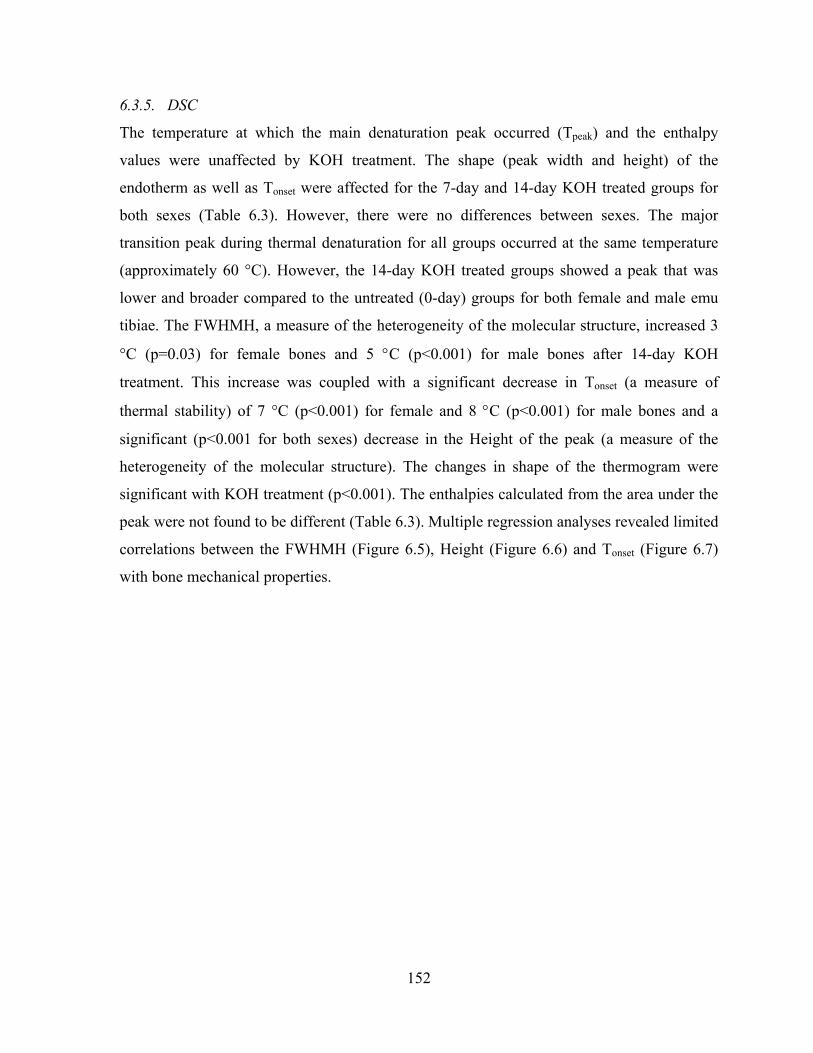
152
6.3.5. DSC
The temperature at which the main denaturation peak occurred (Tpeak) and the enthalpy
values were unaffected by KOH treatment. The shape (peak width and height) of the
endotherm as well as Tonset were affected for the 7-day and 14-day KOH treated groups for
both sexes (Table 6.3). However, there were no differences between sexes. The major
transition peak during thermal denaturation for all groups occurred at the same temperature
(approximately 60 °C). However, the 14-day KOH treated groups showed a peak that was
lower and broader compared to the untreated (0-day) groups for both female and male emu
tibiae. The FWHMH, a measure of the heterogeneity of the molecular structure, increased 3
°C (p=0.03) for female bones and 5 °C (p<0.001) for male bones after 14-day KOH
treatment. This increase was coupled with a significant decrease in Tonset (a measure of
thermal stability) of 7 °C (p<0.001) for female and 8 °C (p<0.001) for male bones and a
significant (p<0.001 for both sexes) decrease in the Height of the peak (a measure of the
heterogeneity of the molecular structure). The changes in shape of the thermogram were
significant with KOH treatment (p<0.001). The enthalpies calculated from the area under the
peak were not found to be different (Table 6.3). Multiple regression analyses revealed limited
correlations between the FWHMH (Figure 6.5), Height (Figure 6.6) and Tonset (Figure 6.7)
with bone mechanical properties.

153
Table 6.3: Average female and male emu tibiae thermal characteristics from DSC. KOH treatment time in days Thermal
Characteristics
Sex
0 1 3 7 14 Female 48.5 ± 1.6 48.0 ± 1.6 47.0 ± 1.0 44.9 ± 1.3a 41.7 ± 1.0a
Tonset (°C) Male 47.7 ± 1.5 46.7 ± 1.4 45.3 ± 1.1 42.9 ± 1.3a 40.2 ± 0.7a
Female 60.9 ± 0.2 61.3 ± 0.4 60.2 ± 0.5 59.8 ± 0.3 59.8 ± 0.4
Tpeak (°C) Male 60.6 ± 0.4 61.0 ± 0.4 61.2 ± 0.6 59.9 ± 0.3 59.9 ± 0.4
Female 18.4 ± 1.1 19.4 ± 1.1 19.7 ± 1.0 20.8 ± 1.1 21.5 ± 0.9a
FWHMH (°C) Male 17.6 ± 0.8 19.0 ± 0.6 19.4 ± 1.2 21.1 ± 0.8a 23.0 ± 1.0a
Female 38.7 ± 0.8 36.7 ± 1.3 39.1 ± 1.3 38.5 ± 1.4 38.9 ± 0.9 Enthalpy (ΔH; J/g of collagen) Male 38.6 ± 1.2 39.5 ± 1.6 37.8 ± 1.1 40.4 ± 1.6 39.5 ± 1.8
Female 0.17 ± 0.01 0.16 ± 0.01 0.15 ± 0.01 0.15 ± 0.01 0.13 ± 0.01a Height (mW/mg of collagen) Male 0.16 ± 0.01 0.17 ± 0.01 0.15 ± 0.01 0.14 ± 0.01 0.13 ± 0.01a
ap ≤ 0.05 versus 0-day KOH treatment time

154
Figure 6.5: Regression of (a) elastic modulus, (b) failure stress, (c) failure strain and (d) toughness with respect to the FWHM (from DSC curves) of bone for female (pink circles) and male (blue circles) emu tibiae, with the correlation coefficient (R2) and p-values being presented. Limited correlations were found between these parameters.
0 10 20 300
1
2
3
4
5
Male
Female
0 10 20 300
1
2
3
4
5
6Male
Female
c) Failure Strain (%) d) Toughness (mJ/mm3)
R2=0.07p=0.068
R2=0.01p=0.427
R2=0.11p=0.019
R2=0.001p=0.957
FWHM (°C) FWHM (°C)0 10 20 30
0
1
2
3
4
5
Male
Female
0 10 20 300
1
2
3
4
5
6Male
Female
c) Failure Strain (%) d) Toughness (mJ/mm3)
R2=0.07p=0.068
R2=0.01p=0.427
R2=0.11p=0.019
R2=0.001p=0.957
FWHM (°C) FWHM (°C)
0 10 20 300
20
40
60
80
100
120
140
160
180
Male
Female
0 10 20 300
5
10
15
20
25
30Male
Female
FWHM (°C)
a) Elastic Modulus (GPa) b) Failure Strength (MPa)
R2=0.08p=0.055
R2=0.19p=0.002 R2=0.02
p=0.307
R2=0.002p=0.777
FWHM (°C)0 10 20 30
0
20
40
60
80
100
120
140
160
180
Male
Female
0 10 20 300
5
10
15
20
25
30Male
Female
FWHM (°C)
a) Elastic Modulus (GPa) b) Failure Strength (MPa)
R2=0.08p=0.055
R2=0.19p=0.002 R2=0.02
p=0.307
R2=0.002p=0.777
FWHM (°C)

155
Figure 6.6: Regression of (a) elastic modulus, (b) failure stress, (c) failure strain and (d) toughness with respect to the Height (from DSC curves) of bone for female (pink circles) and male (blue circles) emu tibiae, with the correlation coefficient (R2) and p-values being presented. Limited correlations were found between these parameters.
0.00 0.05 0.10 0.15 0.20 0.250
1
2
3
4
5
Male
Female
0.00 0.05 0.10 0.15 0.20 0.250
1
2
3
4
5
6Male
Female
c) Failure Strain (%) d) Toughness (mJ/mm3)
R2=0.02p=0.328
R2=0.0002p=0.938
R2=0.007p=0.581
R2=0.004p=0.623
Height (mW/mg of collagen) Height (mW/mg of collagen)0.00 0.05 0.10 0.15 0.20 0.25
0
1
2
3
4
5
Male
Female
0.00 0.05 0.10 0.15 0.20 0.250
1
2
3
4
5
6Male
Female
c) Failure Strain (%) d) Toughness (mJ/mm3)
R2=0.02p=0.328
R2=0.0002p=0.938
R2=0.007p=0.581
R2=0.004p=0.623
Height (mW/mg of collagen) Height (mW/mg of collagen)
0.00 0.05 0.10 0.15 0.20 0.250
20
40
60
80
100
120
140
160
180
Male
Female
0.00 0.05 0.10 0.15 0.20 0.250
5
10
15
20
25
30Male
Female
a) Elastic Modulus (GPa) b) Failure Strength (MPa)
R2=0.03p=0.18
R2=0.04p=0.228
R2=0.06p=0.068
R2=0.01p=0.689
Height (mW/mg of collagen) Height (mW/mg of collagen)0.00 0.05 0.10 0.15 0.20 0.25
0
20
40
60
80
100
120
140
160
180
Male
Female
0.00 0.05 0.10 0.15 0.20 0.250
5
10
15
20
25
30Male
Female
a) Elastic Modulus (GPa) b) Failure Strength (MPa)
R2=0.03p=0.18
R2=0.04p=0.228
R2=0.06p=0.068
R2=0.01p=0.689
Height (mW/mg of collagen) Height (mW/mg of collagen)

156
Figure 6.7: Regression of (a) elastic modulus, (b) failure stress, (c) failure strain and (d) toughness with respect to the Tonset (from DSC curves) of bone for female (pink circles) and male (blue circles) emu tibiae, with the correlation coefficient (R2) and p-values being presented. Limited correlations were found between these parameters.
0 20 40 60 80 1000
20
40
60
80
100
120
140
160
180
Male
Female
0 20 40 60 80 1000
5
10
15
20
25
30Male
Female
Tonset (°C)
a) Elastic Modulus (GPa) b) Failure Strength (MPa)
R2=0.06p=0.083
R2=0.16p=0.006
R2=0.06p=0.068
R2=0.01p=0.689
Tonset (°C)0 20 40 60 80 100
0
20
40
60
80
100
120
140
160
180
Male
Female
0 20 40 60 80 1000
5
10
15
20
25
30Male
Female
Tonset (°C)
a) Elastic Modulus (GPa) b) Failure Strength (MPa)
R2=0.06p=0.083
R2=0.16p=0.006
R2=0.06p=0.068
R2=0.01p=0.689
Tonset (°C)
0 20 40 60 80 1000
1
2
3
4
5
Male
Female
0 20 40 60 80 1000
1
2
3
4
5
6Male
Female
c) Failure Strain (%) d) Toughness (mJ/mm3)
R2=0.03p=0.278
R2=0.01p=0.637
R2=0.001p=0.868
R2=0.05p=0.162
Tonset (°C) Tonset (°C)0 20 40 60 80 100
0
1
2
3
4
5
Male
Female
0 20 40 60 80 1000
1
2
3
4
5
6Male
Female
c) Failure Strain (%) d) Toughness (mJ/mm3)
R2=0.03p=0.278
R2=0.01p=0.637
R2=0.001p=0.868
R2=0.05p=0.162
Tonset (°C) Tonset (°C)

157
6.3.6. SDS-PAGE
The electrophoretic profiles for select samples from each treatment group are shown in
Figure 6.8 (a)) for female (left) and male (right) emu tibiae. The representative densitometric
scans for the selected samples from each treatment group of female (left) and male (right)
emu tibiae are shown in Figure 6.8 (b)), where the peaks correspond to protein bands on the
gel and the area under the peak is related to the amount of protein in the band. Although the
same amount of protein was loaded in each lane, as determined by the hydroxyproline assay,
the peak areas changed when comparing the different groups and between sexes. The
intensity of the α1(I) and α2(I) protein bands appear to decrease with KOH treatment time
where male emu tibiae seem to be more affected by KOH treatment compared to female emu
tibiae. The pepsin band intensity remained constant in each lane, indicating consistent
loading. Collagen degradation fragment area (shown to the extreme right on the
representative densitometric scans for both sexes) increases with KOH treatment time with
no differences between sexes. The results from these scans, represented as relative peak
intensity band area for the different treatment groups, are presented in Figure 6.8 (c)). A
decrease in α-chain band intensity was observed with KOH treatment time for both sexes.
This decrease was greater for male samples compared to female samples for the scans shown
in Figure 6.8 (b)).
Figure 6.8: SDS-PAGE results: (a) Analysis of proteins from select samples from each treatment group for female (left) and male (right) emu tibiae. Lane 1: Std, standard; Lane 2: RTC, rat tail collagen; Lanes 3-4: untreated (0-day); Lanes 5-6: 1-day; Lanes 7-8: 3-day; Lanes 9-10: 7-day; Lanes 11-12: 14-day KOH treatment time.

158
Figure 6.8: (b) Representative densitometric scans of proteins from (a) are shown to indicate more clearly changes in protein revealed on SDS-PAGE gels. Note that the intensity of α1(I) and α2(I) protein bands decrease with KOH treatment time. Figure 6.8: (c) Plot of average relative peak intensity band area versus KOH treatment time for female (pink circles) and male (blue circles) emu tibiae from (a). Decreased α-chain band intensity indicates collagen fragmentation due to KOH treatment.
0 1 3 7 148000
10000
12000
14000
16000
18000
20000
0 1 3 7 148000
10000
12000
14000
16000
18000
20000
KOH Treatment Time (days)
Col
lage
n pe
ak a
rea
inte
nsity
KOH Treatment Time (days)
Col
lage
n pe
ak a
rea
inte
nsity
c)
0 1 3 7 148000
10000
12000
14000
16000
18000
20000
0 1 3 7 148000
10000
12000
14000
16000
18000
20000
KOH Treatment Time (days)
Col
lage
n pe
ak a
rea
inte
nsity
KOH Treatment Time (days)
Col
lage
n pe
ak a
rea
inte
nsity
c)

159
Similar results were seen after analysis of all samples within each group. Figure 6.9
represents the average percent change in α-chain band intensity as a function of KOH
treatment time for all samples. Overall, α-chain band intensity decreased 38% for male emu
tibiae and 28% for female emu tibiae after 14-day KOH treatment. Significant differences in
α-chain band intensity between female and male emu tibiae were observed for 7-day
(p=0.002) and 14-day (p=0.005) KOH treated groups. Multiple regression analyses of the
average α-chain band intensity with the mechanical properties yielded similar correlations to
the α-chymotrypsin digestion results (Figure 6.10).
Figure 6.9: Average percent change in α-chain band intensity area for all samples as a function of KOH treatment time for female (pink circles) and male (blue circles) emu tibiae. Significant decreases in average α-chain peak intensity with increasing KOH treatment time and significant differences between female and male emu tibiae at 7-day and 14-day KOH treated groups. The * and ** indicate that both female and male 7-day and 14-day KOH treated samples respectively, had a significantly greater decrease in α-chain band intensity compared to untreated groups.
0 1 3 7 1450
60
70
80
90
100
FemaleMale
KOH Treatment Time (days)
Ave
rage
α-C
hai
n b
and
Inte
nsi
tyP
erce
nt
Ch
ange
(%
) ***
0 1 3 7 1450
60
70
80
90
100
FemaleMale
KOH Treatment Time (days)
Ave
rage
α-C
hai
n b
and
Inte
nsi
tyP
erce
nt
Ch
ange
(%
) ***

160
Figure 6.10: Regression of (a) elastic modulus, (b) failure stress, (c) failure strain and (d) toughness with respect to the collagen peak area intensity (from SDS-PAGE) of bone for female (pink circles) and male (blue circles) emu tibiae, with the correlation coefficient (R2) and p-values being presented. Strong correlations were found between these parameters.
0 10000 20000 300000
20
40
60
80
100
120
140
160
180
Male
Female
0 10000 20000 300000
5
10
15
20
25
30Male
Female
Collagen peak area intensity Collagen peak area intensity
a) Elastic Modulus (GPa) b) Failure Strength (MPa)
R2=0.23p<0.001
R2=0.18p=0.001
R2=0.40p<0.001
R2=0.37p<0.001
0 10000 20000 300000
20
40
60
80
100
120
140
160
180
Male
Female
0 10000 20000 300000
5
10
15
20
25
30Male
Female
Collagen peak area intensity Collagen peak area intensity
a) Elastic Modulus (GPa) b) Failure Strength (MPa)
R2=0.23p<0.001
R2=0.18p=0.001
R2=0.40p<0.001
R2=0.37p<0.001
0 10000 20000 300000
1
2
3
4
5
Male
Female
0 10000 20000 300000
1
2
3
4
5Male
Female
c) Failure Strain (%) d) Toughness (mJ/mm3)
R2=0.33p<0.001
R2=0.36p<0.001
R2=0.32p<0.001
R2=0.33p<0.001
Collagen peak area intensity Collagen peak area intensity0 10000 20000 30000
0
1
2
3
4
5
Male
Female
0 10000 20000 300000
1
2
3
4
5Male
Female
c) Failure Strain (%) d) Toughness (mJ/mm3)
R2=0.33p<0.001
R2=0.36p<0.001
R2=0.32p<0.001
R2=0.33p<0.001
Collagen peak area intensity Collagen peak area intensity

161
6.3.7. Polarized light microscopy
Histological sections stained with picro-sirius red with and without polarization are shown in
Figure 6.11 for both female and male emu tibiae after 14-day KOH treatment. Images from
polarized light microscopy revealed differences in structure in terms of pattern distribution of
preferentially oriented collagen between the periosteal and endocortical regions for both
sexes. Collagen oriented in a similar direction will have the same brightness/colour, whereas
collagen oriented in other directions result in different brightness/colours. The endocortical
regions appear to have different amounts of layers with alternating birefringence (Figure
6.11), indicating a less organized structure. Both endocortical and periosteal regions of
untreated samples for both sexes had similar appearances to the periosteal region seen in the
14-day KOH treated samples (Figure 6.11).
162
Figure 6.11: Images of transcortical sections of demineralized 14-day KOH treated male ((a), (b), (c), (d)) and female ((e), (f), (g), (h)) emu tibiae, viewed under non-polarized ((a), (c), (e) and (g)) and polarized ((b), (d), (f) and (h)) light. Note the differences in structure in terms of pattern distribution of preferentially oriented collagen between the periosteal and endocortical regions for both sexes.

163
6.4. Discussion
In our initial study [7], KOH treatment was shown to significantly compromise the
mechanical properties of bone with a minimal amount of collagen loss and no significant
changes in geometry or mineral content, as determined by DXA. It was hypothesized that
these observed changes may result from in situ collagen degradation. The purpose of this
study was to determine if the collagen and mineral were indeed affected by the KOH
treatment and could be correlated to previously observed altered mechanical properties.
6.4.1. Mineral characterization
KOH treatment had no effect on bone mineralization and bone microhardness for both
female and male emu tibiae. These results may be influenced by the lack of sensitivity to
detecting changes in bone mineral at the microstructure level and the fact that both
techniques were performed on specimens at one cross-section only. Similarly, XRD analysis
revealed no differences in crystal size for both sexes. These results are not surprising as KOH
does not affect bone mineral [7,31,32] and may be of importance in understanding the
mechanisms by which certain bone disorders alter bone collagen without causing changes to
the bone mineral.
For example, cortical bone samples irradiated with gamma radiation showed small changes
in the elastic behaviour under static testing but a significant decrease in fracture resistance
under cyclic loading [50]. The authors determined by SDS-PAGE that gamma radiation
caused a decrease of intact alpha-chains resulting in cleavage of the collagen backbone [50].
Similarly, cortical bone samples incubated in ribose caused an accumulation of advanced
glycation end products (AGEs), which increased the formation of collagen crosslinks,
resulting in brittle bone [57]. Finally, patients with Type 2 diabetes have been shown to have
increases in fractures despite having increased BMD [58], suggesting the collagen may be
affected.
BSE images of female and male 7-day and 14-day KOH treated samples revealed darker
coloured banding on the endocortical region, suggesting that KOH treatment affected the
bone mineral. However, this was not reflected in the bone mineralization analysis,
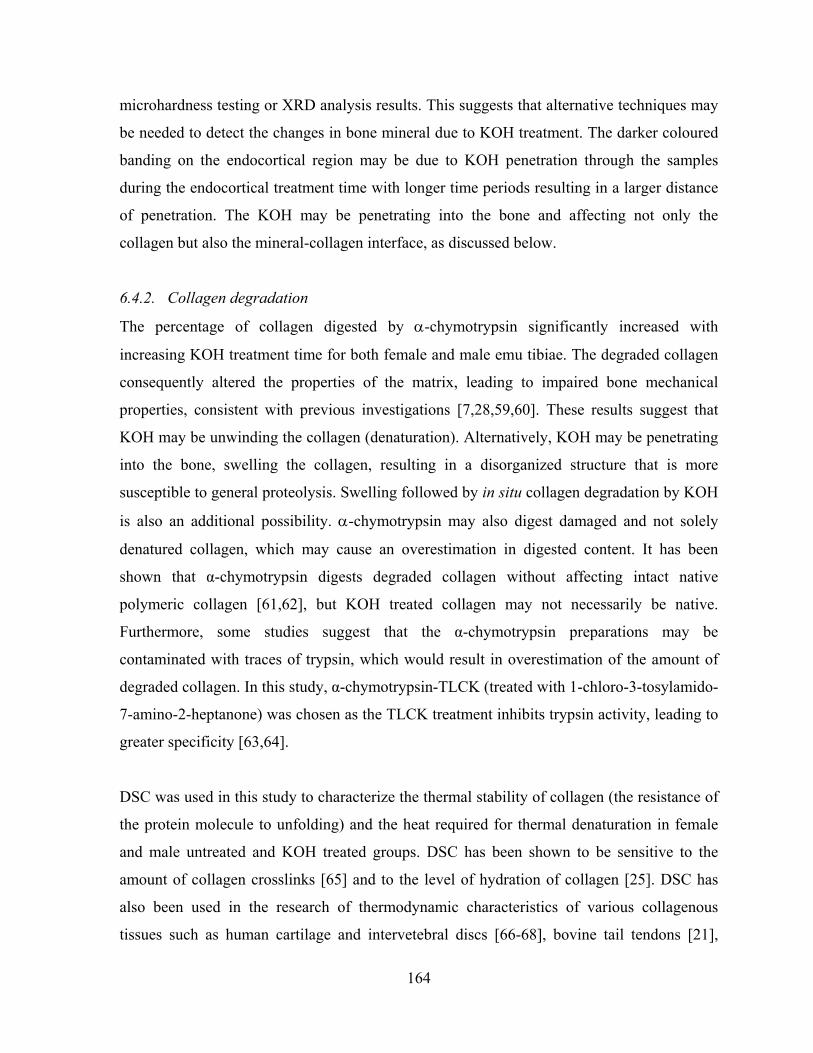
164
microhardness testing or XRD analysis results. This suggests that alternative techniques may
be needed to detect the changes in bone mineral due to KOH treatment. The darker coloured
banding on the endocortical region may be due to KOH penetration through the samples
during the endocortical treatment time with longer time periods resulting in a larger distance
of penetration. The KOH may be penetrating into the bone and affecting not only the
collagen but also the mineral-collagen interface, as discussed below.
6.4.2. Collagen degradation
The percentage of collagen digested by α-chymotrypsin significantly increased with
increasing KOH treatment time for both female and male emu tibiae. The degraded collagen
consequently altered the properties of the matrix, leading to impaired bone mechanical
properties, consistent with previous investigations [7,28,59,60]. These results suggest that
KOH may be unwinding the collagen (denaturation). Alternatively, KOH may be penetrating
into the bone, swelling the collagen, resulting in a disorganized structure that is more
susceptible to general proteolysis. Swelling followed by in situ collagen degradation by KOH
is also an additional possibility. α-chymotrypsin may also digest damaged and not solely
denatured collagen, which may cause an overestimation in digested content. It has been
shown that α-chymotrypsin digests degraded collagen without affecting intact native
polymeric collagen [61,62], but KOH treated collagen may not necessarily be native.
Furthermore, some studies suggest that the α-chymotrypsin preparations may be
contaminated with traces of trypsin, which would result in overestimation of the amount of
degraded collagen. In this study, α-chymotrypsin-TLCK (treated with 1-chloro-3-tosylamido-
7-amino-2-heptanone) was chosen as the TLCK treatment inhibits trypsin activity, leading to
greater specificity [63,64].
DSC was used in this study to characterize the thermal stability of collagen (the resistance of
the protein molecule to unfolding) and the heat required for thermal denaturation in female
and male untreated and KOH treated groups. DSC has been shown to be sensitive to the
amount of collagen crosslinks [65] and to the level of hydration of collagen [25]. DSC has
also been used in the research of thermodynamic characteristics of various collagenous
tissues such as human cartilage and intervetebral discs [66-68], bovine tail tendons [21],

165
mineralizing turkey leg tendons [69] and bone [22-25,27]. Furthermore, DSC has been
successfully used as a tool for investigating collagen and its degradation by correlating
changes in thermal denaturation temperature and/or changes in enthalpy of denaturation
[67,70,71].
In this study, both the temperature of maximum heat flow, Tpeak and the enthalpy were
unaffected in KOH treated groups. However, the shape of the thermogram was altered for
both sexes, indicating a change in the intermolecular collagen structure of the KOH treated
groups [22]. A change in enthalpy would indicate denaturation of the collagen molecule
[21,22], whereas changes in Tonset, Height and FWHMH would suggest that KOH treatment
causes disruption of fibrillar structure and collagen degradation [21,22]. In fact, a broad
shape of the peak has been shown to correspond to an increased dispersion in terms of
stability of the collagen [21,22,47]. Knott et al. examined the thermal characteristics of
normal and osteoporotic avian bone and observed lower and broader thermogram peaks for
the osteoporotic bone with no differences in peak temperature or enthalpies compared to
normal bone [22]. These DSC thermogram results are in agreement with our findings. The
authors postulated this was due to increased variability in thermal stability in the osteoporotic
bone collagen, perhaps due to increased disorder of the fibrillar structure [22]. Furthermore, a
recent in vitro tensile overload tendon model that used DSC to measure the thermal
behaviour of collagen, reported similar results due to intermolecular mechanical deformation,
which alters the fibrillar structure and organization [21]. Changes in the shape of the
thermogram have also been associated with differences in post-translational modifications of
collagen [22]. Furthermore, Herbage et al. showed that the DSC curves obtained for
demineralized normal bone and demineralized Osteogenesis Imperfecta (OI) bone were
identical and contained a single peak at 60 °C [66]. They concluded that the collagen thermal
stability had not been influenced by changes of the nature of the reducible intermolecular
crosslinks [66]. Therefore, it may be inferred that the mechanism of KOH on emu tibiae did
not affect the collagen crosslinks, as there were no changes in Tpeak or enthalpy observed
between treatment groups or between sexes. The DSC results of no enthalpy change, increase
in FWHMH and decrease in Height and Tonset, measured in this study, suggest that KOH

166
treatment increases disorder of the fibrillar structure causing collagen degradation rather than
denaturation.
The interpretation of the DSC curves must be done with regards to the way in which the
sample was prepared [23]. It has been reported that bone shows different thermal behaviour
if it is ground or studied in pieces and this may affect the shape of the DSC curve and the
change in the enthalpy of denaturation values [23,24]. Sample preparation may be the reason
for the unaffected enthalpy values as well as the weak correlations observed in this study and
this interesting issue is currently being investigated by our group.
Analysis by SDS-PAGE revealed a general decrease in α-chain band intensity with KOH
treatment time for both female and male emu tibiae, indicating collagen fragmentation due to
KOH treatment. Furthermore, densitometric scans revealed possible lower molecular weight
fragments with increasing KOH treatment time for both sexes, indicating chain scission in
helical regions [53]. These results are in agreement with the α-chymotrypsin digestion and
DSC results and further supports the hypothesis that KOH treatment causes in situ collagen
degradation rather than denaturation. The high pH of 14 of the KOH solution may have
caused fibrillar swelling and α-chain hydrolysis (degradation). This combination could
explain the results from all these assays. It would be interesting to investigate the
susceptibility of the proteolytic treatment to known, bone-rich collagenases such as cathepsin
K and MMPs. Furthermore, pepsin digestion, used to prepare for gel electrophoresis,
specifically cleaves native polymeric collagen in the telopeptide regions, circumventing the
covalent crosslinks and therefore, should liberate both intact collagen molecules and any
fragments from the insoluble crosslinked matrix without significant additional degradation
[42,49,51]. However, KOH treated collagen may not be native, which pepsin may also be
digesting.
Collagen degradation is also confirmed by the images obtained from polarized light
microscopy where the endocortical region of the 14-day KOH treated bones show a different
microstructure (due to the endocortical KOH treatment) compared to the periosteal region for
both sexes. The different regional structures are an indication of collagen that is no longer

167
organized in the same orientation as the surrounding collagen. This disorientation may be due
to KOH penetration, which causes swelling and a change in the lattice structure, resulting in
a less densely packed and less ordered structure.
Multiple regression analyses from α-chymotrypsin digestion and gel electrophoresis showed
the amount of degraded collagen had a strong correlation with the failure stress, failure strain
and toughness. The weakest correlation was found with the elastic modulus, indicating that
collagen degradation had little effect on the stiffness of bone. This is not surprising as the
maximum contribution of collagen to bone stiffness has been shown to be less than 1% [17].
However, it is important to note that after KOH treatment, the specimens remained intact,
suggesting that KOH treatment did not lead to a total disintegration of the collagen network
but rather in situ collagen degradation. The endocortical treatment with KOH likely resulted
in an inner zone where collagen was significantly altered, with less disruption as the distance
increased [7].
The regression curves were not significantly different between sexes, contradictory to results
shown in Chapter 3 – Initial Study, which indicated that male emu tibiae had significantly
decreased failure stress and increased failure strain and toughness compared to female emu
tibiae [7]. Since these differences are no longer prevalent when correlating to the percentage
of degraded collagen and regression analysis explained on average only 40% of the original
variability for both sexes, this suggests an additional mechanism of action by KOH other
than simply in situ collagen degradation, such as damage to the mineral-collagen interface.
6.4.3. Partial debonding of the collagen-mineral interface
Bone is a composite material whose mechanical properties depend on the characteristics of
the mineral, collagen and the interaction between the mineral and the collagen [6,7]. KOH
treatment causes collagen degradation, which in turn may affect the mineral-organic
interface, altering the way the overall bone behaves. Several authors have tested and
published data regarding decreases of bone quality due to changes in bonding between the
mineral and organic phases [7,72-75]. Kotha and Guzelsu modeled the stress transfer
between the mineral and organic components of bone in order to investigate the mineral-

168
collagen interface [74]. Their model showed that a composite with lower bonding would
have decreased elastic modulus, yield and ultimate stresses, while the ultimate strain would
be increased. They concluded that bone with decreased bonding between the mineral and
collagen would become more ductile [74]. Their results are very similar to our observations
and suggests a mechanism for the significant alteration of mechanical properties in the
absence of geometric or compositional changes.
Walsh and Guzelsu postulated that ion permeation modification of chemical bonds between
the collagen and mineral may affect bone interfacial bonding [76]. Bone fluid is rich in
potassium and correspondingly poor in Na+ and Ca+ [77]. The bone fluid is actively
maintained by the metabolic activity of bone cells [78]. As such, the bonding strength and
bond distribution at the collagen-mineral interface could easily be altered due to the different
binding and displacing capabilities of these inorganic free ions in competition with collagen
polar groups for mineral binding sites. Specifically, it has been shown that in vitro soaking of
bone specimens in fluoride or phosphate ion solutions for several days alters the mechanical
properties similarly to those reported in Chapter 3 – Initial Study (lower elastic modulus,
failure stress and higher failure strain and toughness) [7,76,79]. The authors attributed these
alterations to compromised interfacial bonding between the mineral and collagen as a result
of the ability of these free ions to compete with the organic negative groups on the collagen
or noncollagenous proteins for the binding sites on the bone mineral surface [76,79]. This
may be a mechanism of action of KOH, where the free potassium and/or hydroxyl ions are
permanently incorporated into the bone structure, debonding the links between the mineral
and matrix. Partial debonding between the mineral and organic matrix may be an additional
mechanism together with collagen degradation that is responsible for the significant observed
alteration of mechanical properties.
6.4.4. Sex differences
There were significant differences observed in the amount of digested collagen from the α-
chymotrypsin digestion and gel electrophoresis between KOH treated female and male emu
tibiae. Specifically, male samples had a significantly larger amount of digested collagen
compared to female emu tibiae at 7-day and 14-day KOH treatment. In skeletally mature

169
emus, sexual dimorphism in size (geometry), mass and BMD have been reported [7,80,81].
Male emus carry out the egg incubation period (approximately 8 weeks) [81], which may
lead to adverse effects of disuse on bone. During periods of disuse or immobilization, bones
experience altered magnitudes of loading. Disuse decreases the stresses in bones, which leads
to an adaptive remodeling response, bone atrophy and decreased mechanical properties [82].
For example, sixteen weeks of immobilization significantly decreased the mechanical
properties of canine cortical bone [82]. It has been shown that the remobilization period to
recover lost bone is much longer than the disuse period. Dogs and rats require a
remobilization period of 2-3 times the length of disuse period to recover all the bone lost
during disuse [82-84] and bone loss may continue during remobilization [85]. It is unknown
whether the male emus used in this study were sacrificed before or after incubation.
However, the inactivity or insufficient remobilization period and the sexual dimorphisms
may be the reasons why male emu tibiae are more susceptible to KOH attack, resulting in a
higher amount of degraded collagen.
6.5. Conclusions
Bone quality is a complex property that we do not fully understand and the way that KOH
exposure alters bone quality is still partially unclear. In addition to the collagen degradation
results presented in this study, the observed decreases in bone mechanical properties may be
the manifestation of the involvement of other mechanisms induced by KOH treatment such
as partial debonding of the collagen-mineral interface. To clarify these underlying
mechanisms, further investigations are needed. The results of this study support our
hypothesis that the compromised mechanical properties previously reported [7], are partly a
result of in situ collagen degradation. It is also important to remember that bone is a
composite material comprising mineral, collagen, noncollagenous proteins and solutes. It is a
limitation of this study that the noncollagenous proteins were not studied. Bone mechanical
properties are dependent on the mineral, the collagen and the interaction between mineral and
collagen [1,7]. Thus, the in situ collagen degradation measured in this study serves only as a
measure of a combined effect of the above factors.

170
6.6. Chapter Summary
This study has shown, with the use of several mineral and collagen characterization
techniques, that endocortical KOH treatment causes collagen degradation without affecting
the mineral phase. Furthermore, polarized light microscopy images revealed differences in
collagen structure in terms of pattern distribution of preferentially oriented collagen between
the periosteal and endocortical regions of 14-day KOH treated samples. These results help
explain the previously reported altered mechanical properties in Chapter 3 – Initial Study as
well as the altered fatigue properties in Chapter 4 - Fatigue. However, multiple regression
analysis could not fully explain the observed results (average R2=0.40), suggesting an
additional mechanism of action by KOH, such as changes to the mineral-collagen interface.

171
6.7. References
[1] Boskey A. (2001) Bone Mineralization. In: Cowin SC, editor. Bone Mechanics Handbook. CRC Press. Boca Raton. Florida. pp. 1-33.
[2] Rho JY, Kuhn-Spearing L, Zioupos P. (1998) Mechanical properties and the hierarchical
structure of bone. Med.Eng.Phys. 20:92-102. [3] Jee WSS. (2001) Integrated Bone Tissue Physiology. In: Cowin SC, editor. Bone Mechanics
Handbook. CRC Press. Boca Raton. Florida. pp. 1-68. [4] Nyman JS, Reyes M, Wang X. (2005) Effect of ultrastructural changes on the toughness of
bone. Micron. 36:566-582. [5] Currey JD, Brear K, Zioupos P. (1996) The effects of ageing and changes in mineral content
in degrading the toughness of human femora. J.Biomech. 29:257-260. [6] Li X, Agrawal M, Wang X. (2003) Age dependence of in situ thermostability of collagen in
human bone. Calcif.Tissue.Int. 72:513-518. [7] Wynnyckyj C, Omelon S, Savage K, Damani M, Chachra D, Grynpas MD. (2009) A new
tool to assess the mechanical properties of bone due to collagen degradation. Bone. 44:840-848.
[8] Garnero P, Schott AM, Prockop D, Chevrel G. (2009) Bone turnover and type I collagen C-
telopeptide isomerization in adult osteogenesis imperfecta: associations with collagen gene mutations. Bone. 44:461-466.
[9] Baron R. Anatomy and Ultrasturcture of Bone. (1993) In: Favus MJ, editor. Primer on the
Metabolic Bone Diseases and Disorders of Mineral Metabolism. Lippincott-Raven. New York. pp. 3-9.
[10] Termine JD. Bone Matrix Proteins and the Mineralization Process. (1993) In: Favus M,J
editor. Primer on the Metabolic Bone Diseases and Disorders of Mineral Metabolism. Lippincott-Raven. New York. pp. 21-25.
[11] Wang X, TeKoppele JM, Athanasiou KA. (2000) Effect of collagen denaturation on the
toughness of bone. Clin.Orthop.Relat.Res. 371:228-239. [12] Wang X, Li X, Bank RA, Agrawal CM. (2002) Effects of collagen unwinding and cleavage
on the mechanical integrity of the collagen network in bone. Calcif.Tissue.Int. 71:186-192. [13] Bailey AJ, Wotton SF, Sims TJ, Thompson PW. (1993) Biochemical changes in the collagen
of human osteoporotic bone matrix. Connect.Tissue.Res. 29:119-132. [14] Oxlund H, Barckman M, Ortoft G, Andreassen TT. (1995) Reduced concentrations of
collagen cross-links are associated with reduced strength of bone. Bone. 17:365S-371S. [15] Jepsen KJ, Goldstein SA, Kuhn JL, Schaffler MB, Bonadio J. (1996) Type-I collagen
mutation compromises the post-yield behavior of Mov13 long bone. J.Orthop.Res. 14:493-499.

172
[16] Bank RA, Krikken M, Beekman B, Sttop R, Maroudas A, Lafebers FPJG, TeKoppele JM. (1997) A simplified measurement of degraded collagen in tissues: application in healthy, fibrillated and osteoarthritic cartilage. Matrix.Biology. 16:233-243.
[17] Wang X, Bank RA, TeKoppele JM, Agrawal CM. (2001) The role of collagen in determining
bone mechanical properties. J.Orthop.Res. 19:1021-1026. [18] Viguet-Carrin S, Farlay D, Bala Y, Munoz F, Bouxsein ML, Delmas PD. (2008) An in vitro
model to test the contribution of advanced glycation end products to bone biomechanical properties. Bone. 42:139-149.
[19] Garnero P, Borel O, Gineyts E, Duboeuf F, Solbreg H, Bouxsein ML, Christiansen C, Delmas
PD. (2006) Extracellular post-translational modifications of collagen are major determinants of biomechanical properties of fetal bovine cortical bone. Bone. 38:300-309.
[20] Danielsen CC. (1990) Age-related thermal stability and susceptibility to proteolysis of rat
bone collagen. Biochem.J. 272:697-701. [21] Willett TL, Labow RS, Lee JM. (2008) Mechanical overload decreases the thermal stability
of collagen in an in vitro tensile overload tendon model. J.Orthop.Res. 12:1605-1610. [22] Knott L, Whitehead CC, Fleming RH, Bailey AJ. (1995) Biochemical changes in the
collagenous matrix of osteoporotic avian bone. Biochem.J. 310:1045-1051. [23] Lozano LF, Pena-Rico MA, Heredia A, Ocotlan-Flores J, Gomez-Cortes A, Velazquez R,
Belio IA. (2003) Thermal analysis study of human bone. J.Mater.Sci. 38:4777-4782. [24] Nielsen-Marsh CM, Hedges REM, Mann T, Collins MJ. (2000) A preliminary investigation
of the application of differential scanning calorimetry to the study of collagen degradation in archaeological bone. Thermochim.Acta. 365:129-139.
[25] Trebacz H, Wojtowicz K. (2005) Thermal stabilization of collagen molecules in bone tissue.
Int.J.Biol.Macromol. 37:257-262. [26] Kronick PL, Cooke P. (1996) Thermal stabilization of collagen fibers by calcification.
Connect.Tissue.Res. 33:275-282. [27] Kubisz L, Mielcarek S. (2005) Differential scanning calorimetry and temperature dependence
of electric conductivity in studies on denaturation process of bone collagen. J.Non.Cry.Sol. 351:2935-2939.
[28] Wang X, Shen X, Li X, Agrawal CM. (2002) Age-related changes in the collagen network
and toughness of bone. Bone. 31:1-7. [29] Wang X, Li X, Shen X, Agrawal CM. (2003) Age-related changes of noncalcified collagen in
human cortical bone. Ann.Biomed.Eng. 31:1365-1371. [30] Burr DB. (2002) The contribution of the organic matrix to bone's material properties. Bone.
31:8-11.

173
[31] Abe K, Hashizume H, Ushiki T. (1992) An EDTA-KOH method to expose bone cells for scanning electron microscopy. J.Electron.Microsc.(Tokyo). 41:113-115.
[32] Arsenault AL, Grynpas MD. (1988) Crystals in calcified epiphyseal cartilage and cortical
bone of the rat. Calcif.Tissue.Int. 43:219-25. [33] Broz JJ, Simske SJ, Corley WD, Greenberg AR. (1997) Effects of deproteinization and
ashing on site-specific properties of cortical bone. J.Mater.Sci.Mater.Med. 8:395-401. [34] Walsh WR, Labrador DP, Kim HD, Guzelsu N. (1994) The effect of in vitro fluoride ion
treatment on the ultrasonic properties of cortical bone. Ann.Biomed.Eng. 22:404-15. [35] Burr DB, Miller L, Grynpas MD, Li J, Boyde A, Mashiba T, Hirano T, Johnston CC. (2003)
Tissue mineralization is increased following 1-year treatment with high doses of bisphosphonates in dogs. Bone. 33:960-969.
[36] Klug H, Alexander L. (1974) X-ray diffraction procedures for polycrystalline and amorphous
materials. Wiley. New York. [37] Currey JD, Brear K. (1990) Hardness, Young's modulus and yield stress in mammalian
mineralized tissues. J.Mat.Sci.Mat.Med. 1:14-20. [38] Grynpas M. (1993) Age and disease-related changes in the mineral of bone. Calcif.Tissue.Int.
53 Suppl. 1:S57-S64. [39] An and Draughn [Eds.] (2000) Mechanical Testing of Bone and the Bone-Implant Interface.
CRC Press LLC. Boca Raton. Florida. [40] Boyde A, Jones SJ. (1983) Back-scattered electron imaging of skeletal tissues.
Metab.Bone.Dis.Relat.Res. 5:145-150. [41] Domenicucci C, Goldberg HA, Hofmann T, Isenman D, Wasi S, Sodek J. (1988)
Characterization of porcine osteonectin extracted from foetal calvariae. Biochem.J. 253:139-151.
[42] Grynpas MD, Tupy JH, Sodek J. (1994) The distribution of soluble, mineral-bound and
matrix-bound proteins in osteoporotic and normal bones. Bone. 15:505-513. [43] Sodek KL, Tupy JH, Sodek J, Grynpas MD. (2000) Relationships between bone protein and
mineral in developing porcine long bone and calvaria. Bone. 26:189-198. [44] van der Harst MR, Brama PAJ, van de Lest CHA, Kiers GH, DeGroot J, van Weeren PR.
(2004) An integral biochemical analysis of the main constituents of articular cartilage, subchondral and trabecular bone. Osteoarthritis.Cartilage. 12:752-761.
[45] Woessner JF Jr. (1976) Determination of hydroxyproline in connective tissues. In: Hall D,
editor. The methodology of connective tissue research. Joynson-Bruvvers Ltd. Oxford. pp. 227-233.
[46] Reddy GK, Enwemeka CS. (1996) A simplified method for the analysis of hydroxyproline in
biological tissues. Clin.Biochem. 29:225-229.

174
[47] Gelinsky M, Welzel PB, Simon P, Bernhardt A, Konig U. (2008) Porous three-dimensional scaffolds made of mineralised collagen: preparation and properties of a biomimetic nanocomposite material for tissue engineering of bone. Chem.Eng.J. 137:84-96.
[48] Koon HEC, Loreille OM, Covington AD, Christensen AF, Parsons TJ, Collins MJ. (2008)
Diagnosing post-mortem treatments which inhibit DNA amplification from US MIAs buried at the Punchbowl. Forensic.Sci.Int. 178:171-177.
[49] Butkowski RJ, Noelken ME, Hudson BG. (1982) Estimation of the size of collagenous
proteins by electrophoresis and gel chromatography. In: Cunningham LW, Frederiksen DW, editors. Methods of Enzymology. Academic Press. New York. pp. 410-423.
[50] Akkus O, Belaney RM, Das P. (2005) Free radical scavenging alleviates the biochemical
impairment of gamma radiation sterilized bone tissue. J.Orthop.Res. 23:838-845. [51] Baht GS, Hunter GK, Goldberg HA. (2008) Bone sialoprotein-collagen interaction promotes
hydroxyapatite nucleation. Matrix.Biology. 27:600-608. [52] Furthmayr H, Timpl R. (1971) Characterization of collagen peptides by sodium
dodecylsulfate-polyacrylamide electrophoresis. Anal.Biochem. 41:510-516. [53] Carmichael DJ, Dodd CM, Veis A. (1977) The solubilization of bone and dentin collagens by
pepsin effect of cross-linkages and non-collagen components. Biochim.Biophys.Acta. 491:177-192.
[54] Penkova R, Goshev I, Gorinstein S, Nedkov P. (1999) Stability of collagen during
denaturation. J.Protein.Chem. 18:397-401. [55] Junqueira LC, Bignolas G, Brentani RR. (1979) Picrosirius staining plus polarization
microscopy, a specific method for collagen detection in tissue sections. Histochem.J. 11:447-455.
[56] Dayan D, Hiss Y, Hirshberg A, Bubis JJ, Wolman M. (1989) Are the polarization colors of
picrosirius red-stained collagen determined only by the diameter of the fibers? Histochemistry. 93:27-29.
[57] Vashishth D, Gibson GJ, Khoury JI, Schaffler MB, Kimura J, Fyhrie DP. (2001) Influence of
nonenzymatic glycation on biomechanical properties of cortical bone. Bone. 28:195-201. [58] Melton LJ III, Leibson CL, Achenbach SJ, Therneau TM, Khosla S. (2008) Fracture risk in
type 2 diabetes: update of a population-based study. J.Bone.Miner.Res. 23:1334-1342. [59] Bailey AJ, Wotton SF, Sims TJ, Thompson PW. (1993) Biochemical changes in the collagen
of human osteoporotic bone matrix. Connect.Tissue.Res. 29:119-132. [60] Miles CA, Bailey AJ. (2001) Thermally labile domains in the collagen molecule. Micron.
32:325-332. [61] Hollander AP, Heathfield TF, Webber C, Iwata Y, Bourne R, Rorabeck C, Poole AR. (1994)
Increased damage to type II collagen in osteoarthritic articular cartilage detected by a new immunoassay. J.Clin.Invest. 93:1722-1732.
175
[62] van Wart HJ, Bond MD. (1982) An accurate, quantitative assay for collagenase activity based on the synergistic hydrolysis of collagen. Anal.Biochem. 120:151-158.
[63] Shaw E, Mares-Guia M, Cohen W. (1965) Evidence for an active-center histidine in trypsin
through use of a specific reagent, 1-chloro-3-tosylamido-7-amino-2-heptanone, the chloromethyl ketone derived from n-tosyl-l-lysine. Biochem. 4:2219-2224.
[64] Willet TL, Labow RS, Avery NC, Lee MJ. (2007) Increased proteolysis of collagen in an in
vitro tensile overload tendon model. Ann.Biomed.Eng. 35:1961-1972. [65] Knott L, Bailey AJ. (1998) Collagen cross-links in mineralizing tissues: a review of their
chemistry, function, and clinical relevance. Bone. 22:181-187. [66] Herbage D, Borsali F, Buffevant C, Flandin F, Aguercif M. (1982) Composition, cross-
linking and thermal stability of bone and skin collagens in patients with osteogenesis imperfecta. Metab.Bone.Dis.Rel.Res. 4:95-101.
[67] Doman I, Toth Gy, Illes T, Lorinczy D. (2001) Differential scanning calorimetric
examination of the human intervertebral disc: A preliminary study. Thermochim.Acta. 376:117-122.
[68] Than P, Vermes Cs, Schaffer B, Lorinczy D. (2000) Differential scanning calorimetric
examination of human cartilage. Thermochim.Acta. 346:147-151. [69] Knott L, Tarlton JF, Bailey AJ. (1997) Chemistry of collagen cross-linking: biochemical
changes in collagen during the partial mineralization of turkey leg tendon. Biochem.J. 322:535-542.
[70] Miles CA, Wardale RJ, Birch HL, Bailey AJ. (1994) Differential scanning calorimetric
studies of superficial digital flexor tendon degeneration in the horse. Equine.Vet.J. 26:291-296.
[71] Miles CA. (1994) Differential scanning calorimetry (DSC): protein structure probe useful for
the study of damaged tendons. Equine.Vet.J. 26:255-256. [72] Bundy KJ. (1985) Determination of mineral-organic bonding effectiveness in bone--
theoretical considerations. Ann.Biomed.Eng. 13:119-135. [73] Walsh WR, Ohno M, Guzelsu N. (1994) Bone composite behaviour: effects of mineral-
organic bonding. J.Mater.Sci.Mater.Med. 5:72-79. [74] Kotha SP, Guzelsu N. (2000) The effects of interphase and bonding on the elastic modulus of
bone: changes with age-related osteoporosis. Med.Eng.Phys. 22:575-585. [75] Gupta HS, Fratzl P, Kerschnitzki M, Benecke G, Wagermaier W, Kirchner HO. (2007)
Evidence for an elementary process in bone plasticity with an activation enthalpy of 1 eV. J.R.Soc.Interface. 4:277-282.
[76] Walsh WR, Guzelsu N. (1993) The role of ions and mineral-organic interfacial bonding on
the compressive properties of cortical bone. Biomed.Mater.Eng. 3:75-84.

176
[77] Neuman WF, Ramp WK. (1971) The concept of a bone membrane: some implications. In: Nichols G Jr, Wasserman RH, editors. Cellular Mechanisms for Calcium Transfer and Homeostasis. Academic Press. New York. pp. 197-209.
[78] Rasmussen H, Border P. (1974) The Physiological and Cellular Basis of Metabolic Bone
Disease. The Williams and Wilkins Company. Baltimore. pp. 71-104. [79] DePaula CA, Abjornson C, Pan Y, Kotha SP, Koike K, Guzelsu N. (2002) Changing the
structurally effective mineral content of bone with in vitro fluoride treatment. J.Biomech. 35:355-361.
[80] Maloney SK, Dawson TJ. (1993) Sexual dimorphism in basal metabolism and body
temperature of a large bird, the emu. Condor. 95:1034-1037. [81] Davies SJJF. (2002) Ratites and Tinamous. Oxford University Press. New York. [82] Kaneps AJ, Stover SM, Lane NE. (1997) Changes in canine cortical and cancellous bone
mechanical properties following immobilization and remobilization with exercise. Bone. 21: 419-423.
[83] Donahue SW, McGee ME, Harvey KB, Vaughan MR, Robbins CT. (2006) Hibernating bears
as a model for preventing disuse osteoporosis. J.Biomech. 39: 1480-1488. [84] Weinreb M, Patael H, Preisler O, Ben-Shemen S. (1997) Short-term healing kinetics of
cortical and cancellous bone osteopenia induced by unloading during the reloading period in young rats. Virchow.Arch. 431: 449-452.
[85] Trebacz H. (2001) Disuse-induced deterioration of bone strength is not stopped after free
remobilization in young adult rats. J.Biomech. 34: 1631-1636.

177
Chapter 7 Interface
7.1. Introduction
7.2. Experimental Details
7.2.1. Emu bone samples and KOH treatment 7.2.2. Raman spectroscopy data acquisition 7.2.3. Raman spectroscopy data analysis 7.2.4. Atomic force microscopy imaging 7.2.5. Secondary surface roughness measurements 7.2.6. Statistical analysis
7.3. Results
7.3.1. Raman spectroscopy analysis 7.3.2. Atomic force microscopy
7.4. Discussion
7.4.1. Raman spectroscopy 7.4.2. Atomic force microscopy
7.5. Conclusions
7.6. Acknowledgement
7.7. Chapter Summary
7.8. References

178
The following manuscript has been submitted to Calcified Tissues International for review in
May 2010 under, “Bone collagen degradation affects the mineral-matrix interface”. The
complete list of authors includes: C. Wynnyckyj, S. Omelon and M.D. Grynpas. This chapter
is a continuation of the work done in Chapter 3. In this chapter, we use Raman spectroscopy
and atomic force microscopy to investigate the interface alterations in KOH treated emu
tibiae.
7.1. Introduction
Bone is a complex composite material, consisting of two main phases: a dense mineral phase
embedded within a compliant organic matrix. The mechanical properties of bone depend on
the characteristics of the mineral and organic matrix phases as well as the interactions
between the mineral and organic phases [1-3]. The importance of bonding strength between
the mineral and collagen components was shown by studies that investigated the effects of
decreased bone quality due to changes in bonding between the mineral and organic phases
[2-5].
An emu tibia model was developed to study the contribution of the organic component of
bone, which is approximately 90% collagen matrix and 10% noncollagenous proteins, to the
mechanical properties of bone. In this model, the collagen matrix of bone was degraded with
1 M potassium hydroxide (KOH), while maintaining the mineral content unaltered [6]. While
KOH treatment of bone is non physiological, it helps to understand the mechanisms by which
the degradation of the organic component of bone affects bone mechanical properties, as this
strategy leaves the apatite mineral content of bone unaffected. Endocortical treatment
resulted in negligible mass loss (0.5%), collagen loss (0.05%), no differences in geometrical
parameters, but with significant changes in mechanical properties [6]. Specifically, female
and male emu tibiae showed significant decreases in failure stress and increased failure strain
and toughness with increasing KOH treatment time.
We have recently shown using several mineral (qBSE, microhardness, powder XRD) and
collagen (α-chymotrypsin, DSC, gel electrophoresis, polarized light microscopy)
characterization techniques, that endocortical KOH treatment causes in situ collagen

179
degradation without affecting the mineral phase [7]. However, the reasons for the increased
failure strain and toughness values of KOH treated bones are not fully understood. Previous
studies that have affected collagen by removal with sodium hypochlorite showed a more
brittle-like behaviour with decreased toughness values [8,9], an opposing result to our study
[6]. Therefore, we hypothesize that partial debonding between the mineral and organic matrix
may be an additional mechanism together with in situ collagen degradation that is
responsible for the significant observed alterations of mechanical properties. We probed the
effects of KOH on the organic component of bone with Raman spectroscopy and atomic
force microscopy (AFM).
Raman spectroscopy has been used for chemical identification, characterization of molecular
structures, effects of bonding, environment and stress on a sample material [10]. Raman
spectroscopy measures the non-elastic scattering of the monochromatic light due to light-
induced changes in a molecule. The frequency of this scattered light depends on the structure
and composition of the molecular units in the sample being measured [11]. In biological
tissues, Raman spectroscopy probes the molecular and ionic vibrations of mineral species as
well as the many vibrations that arise from the organic matrix. The Raman spectra of bone is
complex, so researchers have mainly focused on specific bands including the phosphate ν1
band at ~960 cm-1, carbonate ν1 band at ~1070 cm-1 and the bands associated with collagen
(amide III at ~1270 cm-1, C-H bending at ~1450 cm-1 and amide I at ~1665 cm-1) for
spectroscopic chemical characterization of the bone sample [12].
The typically strong, Raman phosphate ν1 band is a prominent marker for mineral content in
bone [10]. The amide I, amide III, and C-H bending (methylene) are typical markers for the
protein or organic matrix of bone. Changes in the amide I band are associated with changes
in collagen crosslinks in bone. The bands of amide I and amide III have been shown to be
good indicators of protein conformation [13]. Furthermore, it has been reported that collagen
denaturation is reflected by the shift of amide III line and broadening of the peak in that
region [14]. Carden et al. recently showed that a shifted amide band is indicative of the
presence of collagen that has undergone a transformation from its normal triple-helical state
to a disordered state [12]. Finally, the phosphate ν1/amide I [15] or amide III [16-18] or C-H

180
bending [12] band height ratio have been used to estimate the mineral-to-organic matrix
ratio.
AFM has been used to study the tissue structure in bone [19], in ossified tendon [20] and at
the calcification front of growing bone [21]. AFM uses the measurement of the surface
topography of a sample by tracing the sample surface with a minute mechanical probe (sharp
needle) attached to a softspring (cantilever). When the probe approaches the sample surface,
tiny interaction forces, such as van der Waals and electrostatic forces, occur between the
probe and the sample. The resulting cantilever deflection is recorded by measuring the
displacement of a laser beam reflected from the back side of the cantilever [22]. A recent
study used AFM to investigate the effect of sodium floride (NaF) on trabecular bone fracture
surfaces in situ and in a time-lapsed fashion [23]. NaF exposure has been shown to influence
the interfacial bonding of the organic components of bone [24]. AFM imaging showed that in
vitro treatment of bone fracture surfaces with highly concentrated NaF solutions resulted in
observable mineral detachment from the underlying collagen fibrils and extraction of more
bone proteins than sodium chloride exposure [23]. The authors suggested that NaF exposure,
which did not significantly reduce bone mass, interfered with the noncollagenous proteins
involved in bonding between the collagen-mineral interface, resulting in weakening of the
organic-mineral interface that was observed in previous NaF exposure studies [24].
The goal of using Raman spectroscopy and AFM to analyze KOH affected bone tissue in this
study was to understand the effect of KOH treatment on the bone mineral-collagen interface.
The major mineral and matrix bands in the spectrum of untreated and KOH treated bone
samples were analyzed using Raman spectroscopy. AFM surface topology data supported by
surface roughness measurements using profilometry was used to investigate changes in bone
surface following KOH treatment. The insights gained were used to explain the significant
changes in the bone mechanical properties from Chapter 3.

181
7.2. Experimental Details
7.2.1. Emu bone samples and KOH treatment
The emu bone tibiae samples from Chapter 3 – Initial Study, were used in this study. These
bones were endocortically treated with 1 M potassium hydroxide (KOH), followed by
mechanical testing in three-point bending [6]. Bones were divided into two groups of female
and male tibiae, with ten samples each allocated to 0-day (untreated) or 14-day KOH
treatments. An additional ten female and ten male bones were filled with PBS instead of
KOH for 14 days to act as controls.
Briefly, skeletally mature (3-5 years of age) whole emu tibiae were separated from the
femora and tarsometatarsi with a scalpel. The shaft of each tibia was then isolated by using a
circular saw to remove the ends (15% of the total bone length from the proximal end and
10% from the distal end). The marrow and trabecular bone from the diaphysis of the tibiae
were removed by drilling longitudinally through the bone shaft, after which the medullary
canal was flushed with tap water [6]. The emu tibiae were filled with 1 M KOH and the ends
were sealed with polymethylmethacrylate (PMMA, SR Ivolen Liquid and Powder, Ivoclar
Vivadent, Mississauga, ON). The bones were held horizontally over a collection basin and
kept moist with a 0.9% saline solution drip. The bones were rotated 180 ° around the axial
axis every 12 hours during the KOH treatment. After the desired treatment period, the KOH
solution was reclaimed, its volume measured and the endocortical surfaces of the bones
rinsed in running tap water for one hour.
7.2.2. Raman spectroscopy data acquisition
Ten mm thick cross sections were cut from untreated and 14-day KOH treated female and
male bones. From these samples, transcortical sections were cut (~ 5 mm x 5 mm x 5mm)
under constant irrigation. These samples were assumed to be representative of the whole
cross-sectional area of each sample. The exposed endocortical surface of the cut sample was
placed under a Hiroba Jobin Yvon LabRam Raman microscope (integrated Raman system)
for spectral scanning over the range 400-1800 cm-1 using a 532 nm laser with a 100X
microscope objective and a laser power of ≤0.5 mW at the sample surface. This wavenumber
range covers the signature bands of mineral and collagen phases [25]. For a given sample, the

182
spectrum was acquired with the LabSpec software (v4.18-05, Jobin Yvon, France) at a
distance of 100 µm from the edges. The 100X objective provided a laser spot size of
approximately 2 µm in diameter. The measured spectra consisted of five accumulations with
an integration time of 25 seconds each and a scan step of 1 cm-1. These settings resulted in
signal to noise ratios ranging from 5:1 (weak amide bands) to 50:1 (prominent phosphate
band). Samples were kept hydrated in between consecutive measurements using a saline-
soaked brush.
7.2.3. Raman spectroscopy data analysis
The sample background fluorescence was subtracted and spectra were filtered using the
LabSpec software (Jobin Yvon, France). Data analysis was performed using MatLab 6.5
(MathWorks Inc., MA) to determine the peak heights and full width at half maximum height
(FWHM) values of the phosphate, carbonate, amide III, methylene (C-H bending) and amide
I bands.
The analysis was confined to the Raman scattering region between 800 and 1800 cm-1. The
average of measurements at five locations was taken to determine the mean mineralization,
the mean carbonate substitution and the mean crystallinity, as shown in Figure 7.1 [15]. The
degree of mineralization was determined by the mineral to matrix ratio. Recent studies have
found that the intensity of the amide I band is affected by the orientation of the collagen
fibrils relative to the incident Raman laser beam [16,17]. Therefore, the ratio of
phosphate/amide I may not be sensitive enough to detect differences in tissue composition.
Therefore, the degree of mineralization was calculated by dividing the peak intensities of the
ν1 phosphate band (at ~960 cm1) with each of the amide III, C-H bending or amide I bands
(at ~1270, 1450, 1665 cm-1), respectively. An increasing mineral:matrix ratio indicates a
more mineralized collagen matrix [15]. Two types of carbonate substitutions have been
described for bone: type A (OH- substituted by CO32-) and type B (PO4
3- substituted by
CO32-) [15]. Raman spectroscopy is not able to detect type A carbonation due to peak overlap
[26]. The extent of type B carbonate substitution was quantified by dividing the intensity of
the phosphate symmetric stretch (ν1) band (at ~960 cm-1) with the type B carbonate
symmetric stretch band (at ~1072 cm-1). An increase in carbonate substitution indicates more

183
mature bone composition [15]. Mineral crystallinity (a combination of crystal size/strain) was
calculated as the inverse of the width of the phosphate symmetric stretch band at half the
maximum intensity value (FWHM). An increasing FWHM indicates a disordered crystal
lattice and hence, lower crystallinity [15]. Furthermore, the average FWHM and Raman shift
values (wavenumber) at the phosphate, carbonate, amide III, C-H bending (methylene) and
amide I were determined (Figure 7.1). Shifts of the collagen bands have been shown to
indicate collagen that has undergone a transformation from its normal tripe-helical state to a
disordered state [12].
Figure 7.1: Typical Raman spectra of bone showing the calculation of degree of mineralization, carbonate substitution and crystallinity (adapted from [15]).
7.2.4. Atomic force microscopy imaging
Following Raman spectroscopy, the same samples were subsequently used for atomic force
microscopy (AFM). Samples were glued onto small discs using epoxy resin (5 min epoxy,
Lepage’s Limited, Brampton, ON) with the endocortical surface face-up for AFM analysis.
Tapping-mode AFM imaging in air was performed with PPP-NCH-50 tips (manufacturer

184
specifications: length=125μm, k=42 N/m; Nanosensors, Neuchalet, Switzerland) using a
Digital Instruments Bioscope™ scanning probe microscope equipped with a Nanoscope IIIa
controller and a dual-range J-scanner with a maximum possible scan size of 90 μm x 90 μm
(Veeco instruments, Santa Barbara, CA). All AFM images were acquired as 16-bit, 512 x
512 pixel images in tapping mode under amplitude feedback, at a typical line scan rate of 1.2
Hz. All AFM images were analyzed with Digital Instruments Nanoscope software (version
5.30r3). Height deviations from the x-y plane, which gives a statistical roughness (r, nm2)
histogram with Gaussian distribution, were measured. Images shown are representative of
features observed from all groups.
7.2.5. Secondary surface roughness measurements
Histograms of the grey level distribution were created for each sample, with decreasing
brightness representing increasing distance from the AFM cantilever tip. A Quips program
on a Quantimet 500 IW system sets up a series of bins based on the intensity of the pixels
and calculates the number of pixels corresponding to each bin. This information is used to
create a histogram of each image. From the histograms, the grey level of the histogram peak
was determined as well as the width at the half peak height. The grey level was used to
represent the overall height profile (dark grey represents the sample surface whereas light
grey corresponds to increased height from the surface) and the width at the half peak height
relates to the heterogeneity of the surface (height distribution). To validate the surface
roughness values determined from the AFM software (Bioscope™) and histograms, samples
were assessed with a Veeco Surface Roughness Wyko non-contact optical profiler (AN505-
3-0902, Veeco Instruments Inc., Tucson, AZ). Profiler conditions were set for vertical
scanning interferometry (VSI) mode, 52X magnification. Five areas were measured per
sample. Surface roughness profiles were generated and analyzed using the accompanying
software (WYKO Vision 32 for NT-2000; version 2.2.10). For each sample, the average
roughness (Ra, μm) was determined, which represents the arithmetic average of all deviations
from the mean center line of the roughness profile. This measurement is the most commonly
reported parameter in studies on surface roughness of bone implant materials [27].

185
7.2.6. Statistical analysis
Statistical analysis was performed using SPSS (SPSS 16.0 for Windows, Chicago, IL)
statistical analysis software. Tests for normality and equality of variances were initially
performed to determine whether parametric or non-parametric t-tests should be used. Two-
way analysis of variance (ANOVA, general linear model) was performed to examine the
effects of sex and KOH treatment on all measured parameters in the emu model and multiple
comparisons (Fisher’s Least Significant Difference (LSD)) were made to detect significant
differences between the groups. All data are presented as mean ± standard error of the mean.
A confidence level of 95% (p=0.05) was considered statistically significant.
7.3. Results
All parameters measured for the control group (14-day filled with saline) were similar to
those of the untreated (0-day) groups (Appendix A) for both female and male emu bones.
7.3.1. Raman spectroscopy analysis
The typical Raman spectra profiles of male (Figure 7.2) and female (Figure 7.3) untreated
(solid lines) and 14-day KOH treated groups (dashed lines) have the same peak positions and
relative intensity, with minor differences. The prominent bands are labeled. The ν1 phosphate
band at ~965 cm-1 is the strongest marker for bone mineral. The band at ~1072 cm-1 indicates
type B carbonate substitution in the bone (carbonate substituting for phosphate in the apatite
lattice). The broad bands in the high frequency region are amide III (~1265 cm-1), the C-H
bending (~1457 cm-1) and amide I (~1665 cm-1). The amide I and amide III peaks are mainly
associated with the presence of collagen while the C-H bending band is present in collagen
and noncollagenous proteins [28,29]. These assignments are in good agreement with those
described previously in the literature [10-12,15].

186
Figure 7.2: Typical Raman spectra scans taken from male untreated (solid line) and 14-day KOH treated (dashed line) samples. No differences in intensities and position of the mineral and collagen peaks between treatment groups.
Figure 7.3: Typical Raman spectra scans taken from female untreated (solid line) and 14-day KOH treated (dashed line) samples. No differences in intensities and position of the mineral and collagen peaks between treatment groups.

187
The resulting Raman spectra showed little differences amongst the groups. The intensity of
each labeled peak and the FWHM of the phosphate peak were used to calculate the degree of
mineralization, type-B carbonate substitution and crystallinity, as shown in Figure 7.1. The
results are presented in Table 7.1. There were no differences observed between the different
groups (untreated vs. 14-day KOH treated), or between sexes, for any of the listed Raman
spectra parameters.
Table 7.1: Average female and male emu tibiae Raman spectroscopy parameters. KOH treatment time in days
Parameter
Sex Untreated 14 days
Female 9.17 ± 0.55 9.02 ± 0.86
Mineralization (phosphate/amide I) Male 10.18 ± 0.91 8.75 ± 0.53
Female 18.47 ± 0.71 17.11 ± 1.27
Mineralization (phosphate/amide III) Male 18.39 ± 1.48 19.22 ± 3.02
Female 11.20 ± 0.70 12.63 ± 0.97
Mineralization (phosphate/C-H bending) Male 12.25 ± 1.19 11.29 ± 1.90
Female 4.76 ± 0.14 4.38 ± 0.22 Carbonate Substitution (phosphate/carbonate)
Male 4.56 ± 0.29 4.35 ± 0.21
Female 0.057 ± 0.001 0.058 ± 0.002
Mineral Crystallinity (1/phosphate FWHM) Male 0.056 ± 0.001 0.057 ± 0.002
Finally, the FWHM versus Raman shift values (wavenumber) at the phosphate, carbonate,
amide III, C-H bending and amide I bands were calculated and plotted to determine any
changes in peak position and band width of the mineral (Figure 7.4) and collagen bands
(Figure 7.5). In both figures, untreated groups are filled circles whereas 14-day KOH
treatment groups are shown as hollow circles (female samples are represented in pink, male
samples in blue). KOH treatment showed no effect on peak position or FWHM for the
phosphate and carbonate bands (mineral) (Figure 7.4) for both sexes. In terms of the collagen
bands, 14-day KOH treatment increased the peak position of the amide III band from 1261
cm-1 ± 2 to 1267 cm-1 ± 2 for female emu tibiae (p=0.041) and from 1263 cm-1 ± 2 to 1270
cm-1 ± 2 for male emu tibiae (p=0.034) while simultaneously, significantly increasing the

188
FWHM of the amide III band from 40 cm-1 ± 2 to 46 cm-1 ± 2 for male emu tibiae (p=0.027)
only (Figure 7.5). The increase in FWHM for females from 41 cm-1 ± 1 to 44 cm-1 ± 2 was a
trend (p=0.076). There were no differences in peak position and FWHM of the collagen
bands between sexes. 14-day KOH treatment had no effect on the C-H bending or amide I
peak position or FWHM (Figure 7.5).
Figure 7.4: Changes in Raman peak widths (FWHM = full width at half maximum) and Raman peak positions of (a) phosphate band and (b) carbonate band for female (pink) and male (blue), untreated (filled circles) and 14-day KOH treated (hollow circles) samples. Error bars represent standard error from the ten samples allocated to each group. No differences were observed between treatment groups as well as between sexes.

189
Figure 7.5: Changes in Raman peak widths (FWHM = full width at half maximum) and Raman peak positions of (a) amide III band, (b) C-H bending band and (c) amide I band for female (pink) and male (blue), untreated (filled circles) and 14-day KOH treated (hollow circles) samples . Error bars represent standard error from the ten samples allocated to each group. 14-day KOH treatment significantly increased the peak position of the amide III band from 1261 cm-1 ± 2 to 1267 cm-1 ± 2 for female emu tibiae and from 1263 cm-1 ± 2 to 1270 cm-1 ± 2 for male emu tibiae while simultaneously increasing the FWHM of the amide III band from 41 cm-1 ± 1 to 44 cm-1 ± 2 for female emu tibiae and from 40 cm-1 ± 2 to 46 cm-1 ± 2 for male emu tibiae. There were no differences between sexes. 14-day KOH treatment had no effect on the C-H bending or amide I position or FWHM.

190
7.3.2. Atomic force microscopy
Figure 7.6 shows AFM images of male, untreated, endocortical samples in Figure 7.6 (a) and
(b) and 14-day KOH treated samples in Figure 7.6 (c) and (d). The bright pixels in the
images correspond to higher points in the topography whereas the darker pixels represent
lower points. The surface of the untreated male sample is covered with rounded bumps,
giving a granular texture. The 67 nm banding pattern characteristic of collagen Type I is not
discernible due to the overlying mineral. The diameter of the spherical subparticles ranges
from 200 nm to 1.25 μm, with the larger particles appearing to be clusters of two or three
smaller particles. The surface morphology of untreated and 14-day KOH treated samples
appears different. Densely packed agglomerated spheroidal particles are present with a
‘swollen’ appearance in the high resolution image (Figure 7.6 (d)) of the 14-day KOH treated
male bone sample.
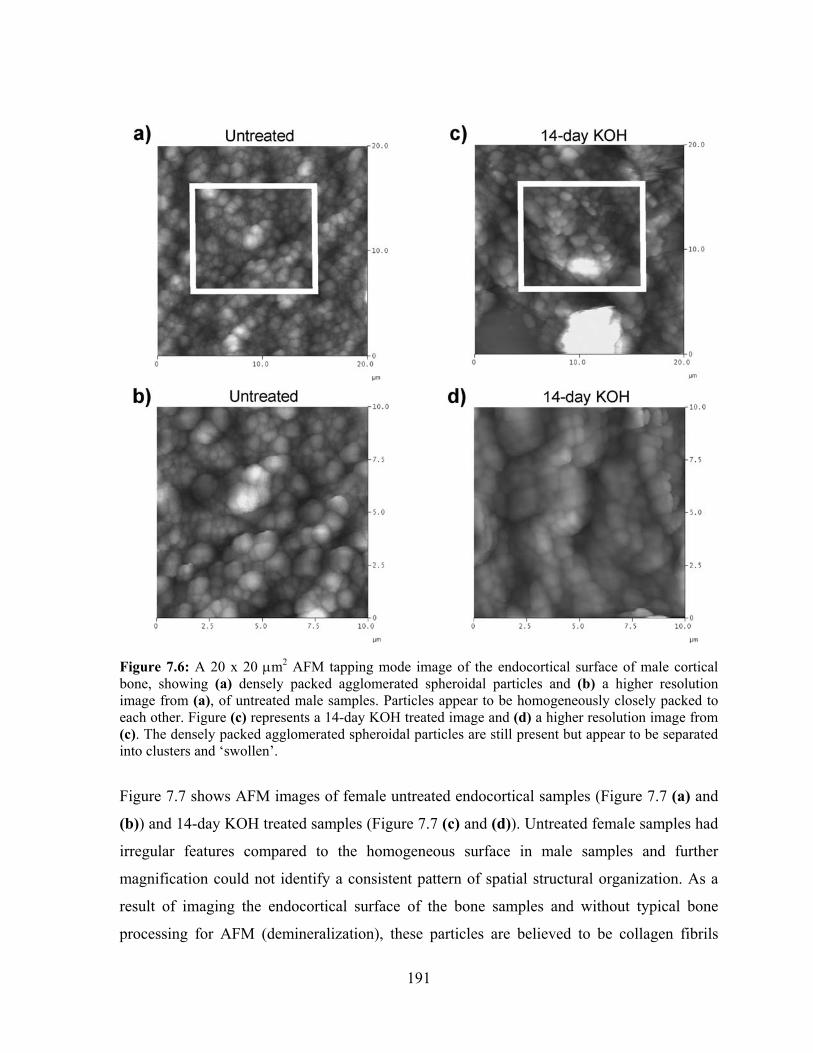
191
Figure 7.6: A 20 x 20 μm2 AFM tapping mode image of the endocortical surface of male cortical bone, showing (a) densely packed agglomerated spheroidal particles and (b) a higher resolution image from (a), of untreated male samples. Particles appear to be homogeneously closely packed to each other. Figure (c) represents a 14-day KOH treated image and (d) a higher resolution image from (c). The densely packed agglomerated spheroidal particles are still present but appear to be separated into clusters and ‘swollen’.
Figure 7.7 shows AFM images of female untreated endocortical samples (Figure 7.7 (a) and
(b)) and 14-day KOH treated samples (Figure 7.7 (c) and (d)). Untreated female samples had
irregular features compared to the homogeneous surface in male samples and further
magnification could not identify a consistent pattern of spatial structural organization. As a
result of imaging the endocortical surface of the bone samples and without typical bone
processing for AFM (demineralization), these particles are believed to be collagen fibrils
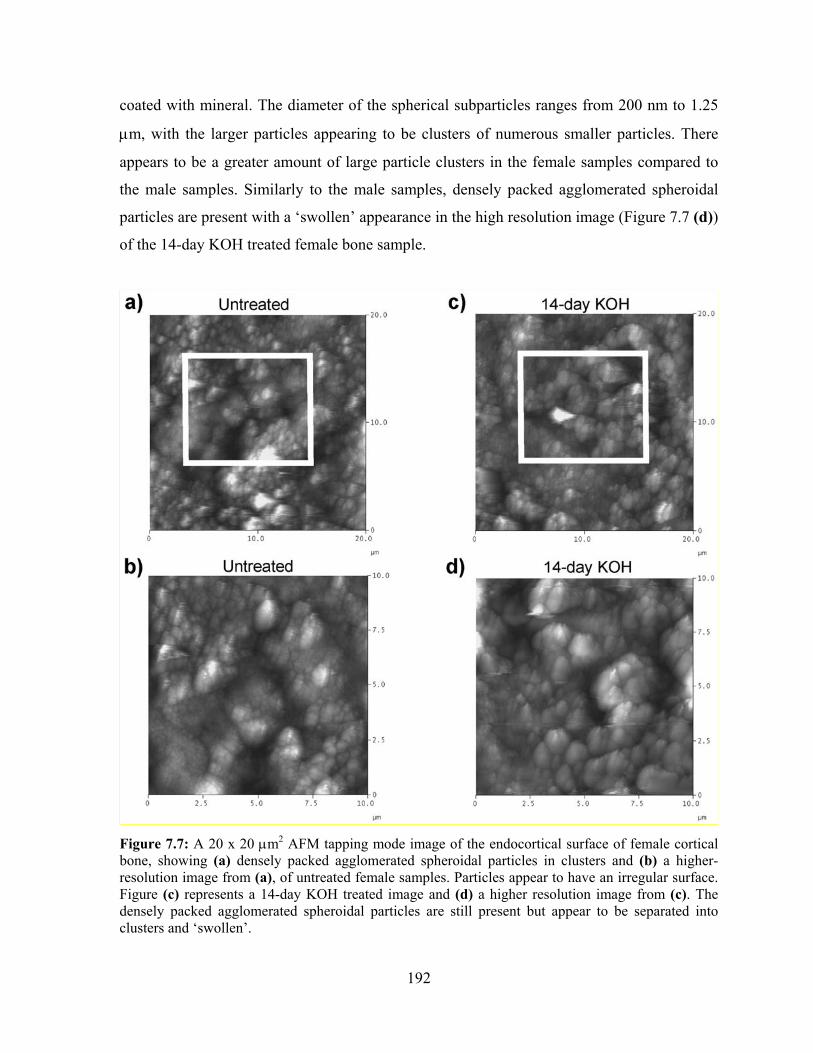
192
coated with mineral. The diameter of the spherical subparticles ranges from 200 nm to 1.25
μm, with the larger particles appearing to be clusters of numerous smaller particles. There
appears to be a greater amount of large particle clusters in the female samples compared to
the male samples. Similarly to the male samples, densely packed agglomerated spheroidal
particles are present with a ‘swollen’ appearance in the high resolution image (Figure 7.7 (d))
of the 14-day KOH treated female bone sample.
Figure 7.7: A 20 x 20 μm2 AFM tapping mode image of the endocortical surface of female cortical bone, showing (a) densely packed agglomerated spheroidal particles in clusters and (b) a higher-resolution image from (a), of untreated female samples. Particles appear to have an irregular surface. Figure (c) represents a 14-day KOH treated image and (d) a higher resolution image from (c). The densely packed agglomerated spheroidal particles are still present but appear to be separated into clusters and ‘swollen’.

193
To quantitatively validate these observations, average roughness values of the samples were
measured using an optical profiler (Table 7.2). The 14-day KOH treated female and male
samples had significantly higher average roughness values compared to untreated surfaces
(p<0.001 for both sexes). Furthermore, the average roughness value of female surfaces was
greater compared to the average roughness value of male surfaces for both untreated
(p=0.066) and 14-day KOH treated groups (p=0.041) (Table 7.2).
Analysis of the histograms created from the grey level distribution from each sample
confirmed these results (Table 7.2). There were no differences between sexes or between
treatment groups in the average grey level (representation of overall surface height profile).
Conversely, the width at half the peak height (representation of the heterogeneity of the
surface) of these histograms increased after 14-day KOH treatment for both female (p=0.062)
and male (p=0.056) emu tibiae, indicating a greater distribution of profile heights.
Furthermore, the width at half the peak height of female samples had a trend towards larger
values compared to male samples for both untreated (p=0.079) and 14-day KOH treated
groups (p=0.057).
Height deviations from the x-y plane of the AFM images (Bioscope™), showed similar
results (Table 7.2). Male untreated samples presented lower roughness (r = 101 ± 10 nm2)
compared to female untreated samples (r = 124 ± 12 nm2) (p=0.061). Finally, 14-day KOH
treated samples showed higher roughness compared to untreated samples for female samples
(r = 191 ± 11 nm2) and male samples (r = 167 ± 123 nm2) (p<0.001 for both sexes).

194
Table 7.2 Quantitative grey level distribution and surface roughness results for female and male emu tibiae.
KOH treatment time in days Parameter
Sex
Untreated 14 days
Female 77 ± 3 75 ± 4 Peak grey level (pixels)
Male 78 ± 4 76 ± 2
Female 53 ± 2 56 ± 2a
Width at half peak height (pixels) Male 50 ± 1A 53 ± 2a,A
Female 124 ± 12 191 ± 11b
Surface Roughness (Bioscope™: r, nm2) Male 101 ± 10A 167 ± 13b,A
Female 1.7 ± 0.2 2.8 ± 0.2b
Surface Roughness (Optical profiler: Ra, μm) Male 1.4 ± 0.1A 2.3 ± 0.2b,B
a0.01 ≤ p ≤ 0.05 versus untreated group; b p < 0.05 versus untreated group. A0.01 ≤ p ≤ 0.05 versus female; Bp< 0.05 versus female.
7.4. Discussion
In our previous study [6], KOH treatment was shown to significantly compromise the
mechanical properties of bone with minimal amount of collagen loss (0.05%), mineral
content loss (0.5%) and no significant changes in geometry. We determined that these
observed changes resulted from in situ collagen degradation [7]. We hypothesized that partial
debonding between the mineral and organic matrix may be an additional mechanism,
together with collagen degradation, that is responsible for the significant observed altered
mechanical properties. The reduction in the bone mineral-interface strength observed with
KOH treatment is comparable to adversely affected bone mechanical properties observed
after NaF treatment [23]. Specifically, both KOH and NaF treatment resulted in significant
decreases in failure stress and increased failure strain and toughness with treatment time,
without significant bone loss [6,23]. The purpose of this study was to determine if
endocortical KOH treatment of whole emu tibiae affected the mineral-organic matrix
interface by investigating endocortical chemical and surface roughness changes. Endocortical
surfaces (mineral and organic components) of female and male, untreated and 14-day KOH
treated samples were characterized using Raman spectroscopy. Subsequently, topographic

195
profiles of female and male, untreated and 14-day KOH treated bone samples were studied
using AFM and profilometry.
7.4.1. Raman spectroscopy
For all groups, the position of the prominent peaks found in emu bone was comparable to
those found in other studies [15-17,26,30]. The Raman signal is dependent upon a
combination of the composition and the structure of the sample [16,31]. There were no
differences between sexes or with KOH treatment of the degree of mineralization (calculated
as the ratio of peak intensities of the phosphate band to either of the amide III, C-H bending
or amide I bands). The three calculations were performed, as recent studies suggested that the
phosphate/amide I ratio may be sensitive to the orientation of the incident light [16]. It was
also shown that the amide III band would be less susceptible to orientation effects [16].
Nevertheless, no differences in degree of mineralization were observed in this study.
Furthermore, the degree of carbonate substitution and crystallinity were also unaffected by
KOH treatment and there were no differences between sexes. In addition, the position,
intensity and shape of the Raman bands assigned to the mineral components of bone
remained unchanged between untreated and 14-day KOH treated samples for both sexes.
These results confirm previous observations that KOH treatment of bone tissue does not
affect bone mineral [6,7].
Shifts of the collagen bands and broader peaks have been shown to indicate collagen that has
undergone a transformation from its normal triple-helical state to a disordered state [12,30].
Increased shifts in amide I and amide III bands are typical features of collagen that has lost
its structure through crosslink rupture (amide I) [32] or collagen denaturation (amide III)
[33]. Changes in peak shape were observed for the amide III band, particularly in the spectra
from the 14-day KOH treated samples. Specifically, the height of the amide III peak
decreased and increased in FWHM and the position of the peak was shifted to a higher
wavenumber after KOH treatment for both sexes, suggesting a change in the secondary
structure of the collagen. It is not clear if the amide III peak changes are due to denatured
collagen, altered noncollagenous proteins, or a combination of both. KOH treatment showed
no effect in peak position and band width of the C-H bending or amide I bands.

196
The amide bands of the Raman spectral pattern are mostly composed of peptide vibrations
[34]. Since collagen consists of amino acids linked by peptide bonds, the vibrational modes
most sensitive to secondary structure (the backbone) are those of the amino class [35]. The
amide I band is mostly due to the C=O stretching vibration of the peptide groups with some
C-N stretching and N-H bending and has been shown to be sensitive to changes in protein
structure [35-37]. Specifically, the amide I band responds to changes in secondary structure
[38] and a shape change of the amide I band has been shown to indicate the rupture of
crosslinks [39]. Based on these observations, it may be inferred that the mechanism of KOH
on emu tibiae did not rupture collagen crosslinks as there were no significant changes in
amide I band peak position or shape after 14-day KOH treatment. However, modifications to
these crosslinks cannot be ruled out. The C-H bending stems from side-chains thus, it is less
susceptible to changes in the collagen structure [34]. The amide III mode is associated with
the C-N vibration [37] and has also been used to estimate conformation characteristics of the
protein backbone [35,37,40]. Wang et al. determined molecular changes in collagen of rat tail
tendon under strain using Raman spectroscopy and showed a decrease in FWHM in several
key collagen bands, indicating that the structure had become more ordered [35]. Therefore,
an increase in FWHM indicates an increase in bending of the molecular kinks, resulting in an
increase in disorder of the protein structure. In a previous study [7], we have shown that
endocortical KOH treatment causes in situ collagen degradation without affecting the mineral
phase. These resulting degradation fragments as well as the high pH of 14 of the 1 M KOH
solution would in turn cause an increased susceptibility to conformational changes in the
protein structure, which may also result in mineral-matrix interface debonding. Therefore,
AFM was utilized to investigate the interface.
7.4.2. Atomic force microscopy
AFM images of untreated and 14-day KOH treated samples revealed a large number of
spherical subparticles packed closely together on the surface. Larger particles in the images
appear to be clusters of two or three smaller particles. Similar spherical particles have been
observed using AFM of bovine bone [41,42]. Specifically, Sasaki et al. treated bovine bone
with collagenase to eliminate the collagen fibers from the bone surface, leaving the mineral
phase unchanged [42]. The resulting AFM images showed spherical particles that the authors

197
described as the mineral component of bone. Conversely, treatment of bovine bone with
EDTA, which is known to eliminate the mineral component in bone, causes the spherical
particles to disappear, revealing thread-like objects with a banding pattern [42]. The authors
attributed the thread-like objects to the collagen fibrils of bone. Clusters of mineralized
spherical structures were seen in AFM images of dentine treated with phosphoric acid. The
residual clusters were a result of incomplete mineral dissolution [43]. Phosphoric-acid treated
samples exhibited irregular features and further magnification could not identify a consistent
pattern of spatial structural organization. The presence of the 67 nm periodicity of gap zones
was not observed, but would become apparent and increasingly pronounced if the samples
were to be demineralized, as shown by Balooch et al. [44]. The lack of visible collagen fibrils
in the AFM images of this study further confirms the fact that KOH treatment does not affect
the bone mineral and collagen fibrils are not normally visible on the surface of bone, without
appropriate treatment to remove the mineral component.
In our study, significant differences in surface topography were observed by AFM scanning
between sexes in untreated bone samples as well as between 14-day KOH treated and
untreated samples. For the untreated samples, the spherical particles appear to be connected
to each other relatively homogeneously in the male bone samples, whereas a higher number
of particle clusters appear to be present in the female bone samples. Similar differences were
observed when comparing the 14-day KOH treated images to the untreated images for both
sexes. The 14-day KOH treated samples appear to have increasing spacing between adjacent
particle clusters. These qualitative measures are validated with the width at half the peak
height of the grey level distribution histograms: for both female and male 14-day KOH
treated samples, the width at half the peak height increased, indicating an increase in height
distribution. Therefore, untreated samples appear to have a more homogeneous surface
compared to the more irregular, uneven 14-day KOH treated samples.
The irregular surface profile is likely due to the endocortical KOH treatment. Furthermore,
the measured surface roughness values from the optical profiler as well as the height
deviations from the x-y plane of the AFM images show similar results. The topographical
differences observed in these AFM images may be due to the KOH penetrating into the bone,

198
altering the collagen structure and possibly the noncollagenous protein structures or the
bonding between the noncollagenous proteins and the mineral or the collagen. Altering the
collagen conformation may change the surface interactions with the mineral component of
bone, which in turn, may alter the bone mineral-matrix interface. Should the noncollagenous
proteins be altered, the role they play in providing a bond between the charged bone mineral
surface and the surrounding collagen may be compromised. This interfacial debonding would
result in reduced mechanical properties.
Closer examination of high magnification AFM images of the 14-day KOH treated samples
revealed a ‘swollen’ appearance. This swollen appearance may be due to an altered mineral-
matrix interface. The bone mineral-collagen interface proteins hold the mineral in close
proximity to the collagen. If KOH treatment denatures or degrades these proteins or
interfaces, the collagen may separate from the mineral surface, causing it to look ‘bigger’ or
‘swollen’. Recently, Xu et al. analyzed the structure of bovine tibiae before and after
demineralization using AFM [45]. The authors observed that demineralization dissolved the
bone mineral phase and revealed a layer of small spherical particles deposited on the surface
of collagen bundles, preventing mineral crystals of being in direct contact with collagen
bundles. These particles were identified as lipids since organic solvents were capable of
dissolving them [45]. If a layer of lipids is present in between the mineral and collagen, KOH
treatment may be interacting with these lipids, causing a modification in the mineral-collagen
interface, resulting in a ‘swollen’ appearance. A ‘swollen’ appearance may also be due to an
increase in bone hydration after KOH treatment. Silva and Ulrich observed increased bone
hydration following NaF treatment [46]. Increased water content may be possible with the
loss of the strong links between the mineral, the collagen and the noncollagenous proteins.
Therefore, increased bone hydration might be observed as a ‘swollen’ bone tissue.
Similarly, AFM studies of boiled bone samples revealed a soft appearance compared to
untreated bone samples and the authors suggested that even though the organic phase was
still present, the cohesion of the organic matrix was reduced [8]. This modified bonding
would explain the increased flexible behaviour of boiled bone: the organic component is still
present for energy dissipation functions however, the organic matrix no longer binds the
199
inorganic component tightly together with the compliant organic matrix [8]. This may be
analogous to the mechanism of action of KOH. KOH may have affected the binding between
the collagen and mineral as well as the interactions within the collagen, leading to an increase
in toughness but decrease in strength. It has been postulated that the bonding between bone
apatite and collagen fibrils involves sharing of hydroxyl groups since bone apatite lacks
hydroxyl groups, whereas collagen fibrils are abundant in hydroxyl groups [47]. This shared
bonding would allow for rapid breaking or reformation of the mineral-collagen bond and
variations in pH would be able to accomplish such bonding and debonding [47]. The high pH
of 14 of the 1 M KOH solution may have taken place within the emu bone samples and may
have reduced interfacial bonding [24]. Alternatively, KOH may be altering the behaviour of
noncollagenous proteins or peptides [47]. Various researchers have shown noncollagenous
proteins to be either mineral-bound or collagen-bound [48,49], suggesting that the mineral-
collagen interface is formed by a complex noncollagenous protein network, which involves
the binding of noncollagenous proteins to both the mineral and the collagen [50]. The
endocortical KOH treatment may be affecting the binding of the noncollagenous proteins
however, it still remains unclear which proteins may be involved and further research is
needed.
7.5. Conclusions
The results of this study support our hypothesis that KOH treatment causes alterations to the
collagen-mineral interface. While Raman analysis of 14-day KOH treated bones showed
changes only to the amide III bands, AFM images provide visual proof of a swollen
mineralized surface, which we believe to be due to KOH treatment modifying the underlying
interactions between the mineral and collagen, as well as modifying the collagen matrix. The
effect of KOH on the collagen and possibly the noncollagenous proteins involved in bonding
between the collagen and the mineral phases of bone may be responsible for the altered
mechanical properties previously observed in endocortically, KOH treated emu bones.
7.6. Acknowledgement
The author acknowledges assistance from Gary Mo, who performed the AFM imaging and
measurements.

200
7.7. Chapter Summary
The endocortical surface of female and male untreated and 14-day KOH treated emu tibiae
were assessed using Raman spectroscopy and atomic force microscopy (AFM) to identify
chemical and morphological changes. The Raman spectra of 14-day KOH treated bone
samples showed a singular increase in amide III band peak position and width for both sexes.
This observation supports the theory that KOH treatment causes disorder in the organic
component of bone. The disorganization of collagen and noncollagenous proteins would
adversely affect collagen matrix integrity and the mineral-organic interface. AFM images
revealed a swollen appearance in 14-day KOH treated samples compared to untreated
samples. These results suggest that degradation of the organic matrix of bone weakens the
mineral-collagen interface.

201
7.8. References [1] Li X, Agrawal M, Wang X. (2003) Age dependence of in situ thermostability of collagen in
human bone. Calcif.Tissue.Int. 72:513-518. [2] Bundy KJ. (1985) Determination of mineral-organic bonding effectiveness in bone--
theoretical considerations. Ann.Biomed.Eng. 13:119-35. [3] Walsh WR, Ohno M, Guzelsu N. (1994) Bone composite behaviour: effects of mineral-
organic bonding. J.Mater.Sci.Mater.Med. 5:72-9. [4] Kotha SP, Guzelsu N. (2000) The effects of interphase and bonding on the elastic modulus of
bone: changes with age-related osteoporosis. Med.Eng.Phys. 22:575-85. [5] Gupta HS, Fratzl P, Kerschnitzki M, Benecke G, Wagermaier W, Kirchner HO. (2007)
Evidence for an elementary process in bone plasticity with an activation enthalpy of 1 eV. J.R.Soc.Interface. 4:277-82.
[6] Wynnyckyj C, Omelon S, Savage K, Damani M, Chachra D, Grynpas MD. (2009) A new
tool to assess the mechanical properties of bone due to collagen degradation. Bone. 44:840-848.
[7] Wynnyckyj C, Willet TL, Omelon S, Kyle K, Goldberg H, Grynpas MD. (2010) Mechanism
of bone collagen degradation due to KOH treatment. Biochim.Biophys.Acta. In revision. [8] Fantner GE, Birkedal H, Kindt JH, Hassenkam T, Weaver JC, Cutroni JA, Bosma BL,
Bawazer L, Finch MM, Cidade GA, Morse DE, Stucky GD, Hansma PK. (2004) Influence of the degradation of the organic matrix on the microscopic fracture behavior of trabecular bone. Bone. 35:1013-1022.
[9] Jepsen KJ, Goldstein SA, Kuhn JL, Schaffler MB, Bonadio J. (1996) Type-I collagen
mutation compromises the post-yield behavior of Mov13 long bone. J.Orthop.Res. 14:493-499.
[10] Morris MD, Finney WF. (2004) Recent developments in Raman and infrared spectroscopy
and imaging of bone tissue. Spectroscopy. 18:155-159. [11] Carden A, Morris MD. (2000) Application of vibrational spectroscopy to the study of
mineralized tissues (review). J.Biomed.Opt. 5:259-68. [12] Carden A, Rajachar RM, Morris MD, Kohn DH. (2003) Ultrastructural changes
accompanying the mechanical deformation of bone tissue: a raman imaging study. Calcif.Tissue.Int. 72:166-175.
[13] Kubisz L, Polomska M. (2007) FT NIR Raman studies on γ-irradiated bone.
Spectrochim.Acta.A.Mol.Biomol.Spectrosc. 66:616-625. [14] Bandekar J. (1992) Amide modes and protein conformation. Biochim.Biophys.Acta.
1120:123-143.

202
[15] Akkus O, Addar F, Schaffler MB. (2004) Age-related changes in physiochemical properties of mineral crystals are related to impaired mechanical function of cortical bone. Bone. 34:443-453.
[16] Kazanci M, Roschger P, Paschalis EP, Klaushofer K, Fratzl P. (2006) Bone osteonal tissues
by Raman spectral mapping: orientation-composition. J.Structur.Biol. 156:489-496. [17] Kazanci M, Wagner HD, Manjubala NI, Gupta HS, Paschalis EP, Roschger P, Fratzl P.
(2007) Raman imaging of two orthogonal planes within cortical bone. Bone. 41:456-461. [18] Nyman JS, Masui P, Patil CA, O’Quinn EC, Edwards JR, Guelcher S, Nicollela DP,
Mahadevan-Jansen A. (2009) Detecting compositional differences by raman spectroscopy in non-fixed and embedded human cortical bone. Proceedings of the 55th annual meeting of the Orthopaedic Research Society.
[19] Reilly GC, Knapp HF, Stemmer A, Niederer P, Knothe Tate ML. (2001) Investigation of the
morphology of the lacunocanalicular system of cortical bone using atomic force microscopy. Ann.Biomed.Eng. 29:1074-1081.
[20] Lees S, Prostak KS, Ingle VK, Kjoller K. (1994) The loci of mineral in turkey leg tendon as
seen by atomic force microscope and electron microscopy. Calcif.Tissue.Int. 55:180-189. [21] Wiesmann HP, Chi L, Stratmann U, Plate U, Fuchs H, Joos U, Hohling HJ. (1998) Sutural
mineralization of rat calvaria characterized by atomic force microscopy and transmission electron microscopy. Cell.Tissue.Res. 294:93-97.
[22] Thalhammer S, Heckl WM, Zink A, Nerlich AG. (2001) Atomic force microscopy for high
resolution imaging of collagen fibrils – A new technique to investigate collagen structure in historic bone tissues. J.Arch.Sci. 28:1061-1068.
[23] Kindt JH, Thurner PJ, Lauer ME, Bosma BL, Schitter G, Fantner GE, Izumi M, Weaver JC,
Morse DE, Hansma PK. (2007) In situ observation of fluoride-ion-induced hydroxyapatite-collagen detachment on bone fracture surfaces by atomic force microscopy. Nanotech. 18:1-8.
[24] Walsh WR, Labrador DP, Kim HD, Guzelsu N. (1994) The effect of in vitro fluoride ion
treatment on the ultrasonic properties of cortical bone. Ann.Biomed.Eng. 22:404-15. [25] Yeni YN, Yerramshetty J, Akkus O, Pechey C, Les CM. (2006) Effect of fixation and
embedding on raman spectroscopic analysis of bone tissue. Calcif.Tissue.Int. 78:363-371. [26] Shen J, Fan J, Yang A, Shen G, Hu JM. (2010) A longitudinal raman microspectroscopic
study of osteoporosis induced by spinal cord injury. Osteoporos.Int. 21:81-87. [27] Szmukler-Moncler S, Testori T, Bernard JP. (2004) Etched implants: a comparative surface
analysis of four implant systems. J.Biomed.Mater.Res.B.Appl.Biomater. 69:46-57. [28] Timlin JA, Carden A, Morris MD. (1999a) Chemical microstructure of cortical bone probed
by Raman transects. App.Spect. 53:1429-1435.

203
[29] Timlin JA, Carden A, Morris MD, Bonadio JF, Hoffler II, Kozloff CE, Goldstein KM. (1999b) Spatial distribution of phosphate species in mature and newly generated mammalian bone by hyperspectral Raman imaging. J.Biomed.Opt. 4:28-34.
[30] Freeman JJ, Wopenka B, Silva MJ, Pasteris JD. (2001) Raman spectroscopic detection of
changes in bioapatite in mouse femora as a function of age and in vitro fluoride treatment. Calcif.Tissue.Int. 68:156-162.
[31] Leroy G, Penel G, Leroy N, Bres E. (2002) Human tooth enamel: a Raman polarized
approach. Appl.Spect. 56:1030-1034. [32] Paschalis EP, Verdelis K, Doty SB, Boskey AL, Mendelsohn R, Yamauchi M. (2001)
Spectroscopic characterization of collagen cross-links in bone. J.Bone.Min.Res. 16:1821-1828.
[33] Frushour BG, Koenig JL. (1975) Raman scattering of collagen, gelatin, and elastin.
Biopolym. 14:379-391. [34] Yeni YN, Yerramshetty J, Akkus O, Pechey C, Les CM. (2006) Effect of fixation and
embedding on raman spectroscopic analysis of bone tissue. Calcif.Tissue.Int. 78:363-371. [35] Wang YN, Galiotis C, Bader DL. (2000) Determination of molecular changes in soft tissues
under strain using laser Raman microscopy. J.Biomech. 33:483-486. [36] McCreadie BR, Morris MD, Chen TC, Sudhaker Rao D, Finney WF, Widjaja E, Goldstein
SA. (2006) Bone tissue compositional differences in women with and without osteoporotic fracture. Bone. 39:1190-1195.
[37] Rousseau ME, Lefevre T, Beaulieu L, Asakura T, Pezolet M. (2004) Study of protein
conformation and orientation in silkworm and spider silk fibers using raman microspectroscopy. Biomacro. 5:2247-2257.
[38] Carmejane O, Morris MD, Davis MK, Stixrude L, Tecklenburg M, Rajachar RM, Kohn DH.
(2005) Bone chemical structure response to mechanical stress studied by high pressure raman spectroscopy. Calcif.Tissue.Int. 76:207-213.
[39] Sahar N, Kohn DH, Golcuk K, Morris MD. (2009) Effects of exercise on bone quality as
shown by raman microspectroscopy. In proceedings of the 55th annual meeting of the Orthopaedic Research Society.
[40] Dong R, Yan X, Pang X, Liu S. (2004) Temperature-dependent Raman spectra of collagen
and DNA. Spectrochim.Acta.A.Mol.Biomol.Spectrosc. 60:557-561. [41] Tong W, Glimcher MJ, Katz JL, Kuhn L, Eppell SJ. (2003) Size and shape of mineralites in
young bovine bone measured by atomic force microscopy. Calcif.Tissue.Int. 72:592-598. [42] Sasaki N, Tagami A, Goto T, Taniguchi M, Nakata M, Hikichi K. (2002) Atomic force
microscopic studies on the structure of bovine femoral cortical bone at the collagen fibril-mineral level. J.Mat.Sci.Mat.Med. 13:333-337.

204
[43] Bozec L, de Groot J, Odlyha M, Nicholls B, Horton MA. (2002) Mineralised tissues as nanomaterials: analysis by atomic force microscopy. IEE.Proc.Nanobiotechnol. 152:183-186.
[44] Balooch M, Habelitz S, Kinney JH, Marshall SJ, Marshall GW. (2008) Mechanical properties
of mineralized collagen fibrils as influenced by demineralization. J.Struct.Biol. 162:404-410. [45] Xu S, Yu JJ. (2006) Beneath the minerals, a layer of round lipid particles was identified to
mediate collagen calcification in compact bone formation. Biophys.J. 91:4221-4229. [46] Silva MJ, Ulrich SR. (2000) In vitro sodium fluoride exposure decreases torsional and
bending strength and increases ductility of mouse femora. J.Biomech. 33:231-234. [47] Pasteris JD, Wopenka B, Freeman JJ, Rogers K, Valsami-Jones E, van der Houwen JA, Silva
MJ. (2004) Lack of OH in nanocrystalline apatite as a function of degree of atomic order: implications for bone and biomaterials. Biomater. 25:229-238.
[48] Tye CE, Hunter GK, Goldberg HA. (2005) Identification of type I collagen-binding domain
of bone sialoprotein and characterization of the mechanism of interaction. J.Biol.Chem. 280:13487-13492.
[49] Grynpas MD, Tupy JH, Sodek J. (1995) The distribution of soluble, mineral-bound, and
matrix-bound proteins in osteoporotic and normal bones. Bone. 15:505-513. [50] Raif EM, Harmand MF. (1993) Molecular interface characterization in human bone matrix. I.
Biochemical and IR spectroscopic studies. Biomater. 14:978-984.

205
Chapter 8 Conclusions

206
As outlined in Chapter 1, the work in this thesis was divided into five separate objectives.
This section outlines the overall conclusions that have been drawn based on the culmination
of work performed within the five objectives.
1. Untreated female emu tibiae had significantly higher cross-sectional geometry, mass,
BMD and BMC values as well as ultimate stress and failure stress compared to
untreated male bone samples. However, male emu tibiae had significantly higher
failure strain and post-yield strain compared to female bone samples. The inactivity
or insufficient remobilization period experienced by male emus during incubation (8-
weeks) and the sexual dimorphisms may be the reasons for the observed mechanical
property differences in untreated bones.
2. Endocortical KOH treatment of whole emu tibiae does not affect bone mineral.
3. Endocortical KOH treatment of whole emu tibiae resulted in negligible bone mass
loss (0.5%), collagen loss (0.05%), no changes in geometrical parameters, but the
mechanical properties were significantly affected. Specifically, a significant decrease
in modulus and failure strength as well as a significant increase in failure strain and
toughness was observed with increasing KOH treatment time for both sexes. The
KOH treated bones behaved in a more ductile-like manner.
4. Endocortical KOH treatment of whole emu tibiae causes in situ collagen degradation
rather than removal. This occurs through KOH penetration into the bone, which
causes swelling and a change in the lattice structure, resulting in a less densely
packed and less ordered structure. Male emu tibiae had significantly more degraded
collagen compared to female emu tibiae.
5. Polarized light microscopy revealed differences in collagen organization in KOH
treated bones on the endocortical side compared to the periosteal side for both sexes.

207
6. Endocortical KOH treatment lowered the fatigue resistance of emu tibiae at high
stresses (>60 MPa) only. It was determined that cyclic creep was an important
mechanism in the fast deterioration rate of the KOH treated bones. Collagen
degradation and disorganization caused by KOH treatment is the reason for the
observed altered fatigue behaviour at high stresses only, since collagen is responsible
for the creep behaviour in bone. At low stresses (<60 MPa), the degraded and
disorganized collagen in KOH treated bones act as additional microstructural barriers,
leading to an increased amount of crack deflection and thus, resistance to crack
propagation.
7. DXA and QUS did not detect changes in bone mechanical properties as a result of
collagen degradation as well as fatigue.
8. MRTA detected the changes in bone mechanical properties induced by collagen
degradation as well as fatigue.
9. Fracture surface analysis of KOH treated samples revealed a higher degree of
‘roughness’ as well as the presence of additional toughening mechanisms, indicating
higher resistance to crack propagation and hence, increased toughness.
10. The high pH of the KOH solution causes conformational changes in the protein
structure (as seen from the shape change of the amide III band in the Raman spectra),
as well as degradation fragments, which in turn, may also lead to partial interface
debonding (as seen from the swollen appearance of 14-day KOH treated AFM
images).
208
Chapter 9 Future work
9.1. Introduction
9.2. Future work
9.2.1. Objective 1 - Initial study 9.2.2. Objective 2 - Fatigue 9.2.3. Objective 4 - Collagen degradation 9.2.4. Objective 5 - Interface
9.3. References
209
9.1. Introduction
In this study, we investigated the role of collagen on the mechanical and fatigue properties of
female and male bone, using an emu model. This study increased our knowledge of bone
mechanical properties, mineral-matrix interface, collagen degradation and sex differences on
bone quality at the various hierarchical levels of bone. An understanding of the role of
collagen degradation from the mineral phase may provide new avenues of treatment of bone
fragility. To more extensively investigate the consequences of collagen degradation on bone
mechanical properties, some future work is recommended here.
9.2. Future work
9.2.1. Objective 1 - Initial study
The MRTA has been successfully developed to clinically test the human ulna. Other sites
such as the femur and tibia are of greater clinical concern. The human tibia is the most
common site of stress fractures in athletes and military recruits [1]. Therefore, it would be
advantageous to further develop the MRTA to measure the human tibia and other possible
sites.
Collagen is not quantifiable by current imaging modalities (DXA and QUS). It has been
demonstrated that when the collagen phase is damaged, the fatigue and fracture resistance of
bone are greatly reduced [2-6]. It would be interesting to modify the collagen in whole emu
tibiae using known techniques that affect collagen such as GuHCl (collagen denaturation)
[7], gamma radiation (cleavage of collagen) [8] and ribose incubation (increased crosslink
formation) [9] and determine if CT, DXA, QUS and MRTA can detect these changes.
Similarly, investigations should be undertaken to determine the ability of CT, DXA, QUS
and MRTA to detect induced changes in bone mineral of whole emu tibiae with known
demineralization agents (EDTA/HCl) [7,10].
Three-point bend testing offers the advantage of being a simple test however, it has the
disadvantage of creating high shear stresses in the region around the midsection of the bone
[11]. Conversely, four-point bend testing ensures transverse shear stresses are zero by
producing pure bending between the two upper loading points. Unfortunately, the force at

210
each loading point needs to be equal in order for this to occur, a difficult requirement to
achieve when testing whole bones [11]. As a result, three-point bend testing is the common
testing methodology for measuring the mechanical properties of bones. However, four-point
bend testing of emu tibiae should be investigated.
Various factors can affect the fracture properties of bone including porosity and mineral
content as well as strain rate. It would be interesting to investigate the behaviour of KOH
treated bones at varying strain rates.
9.2.2. Objective 2 - Fatigue
In terms of fatigue testing, with the S/N approach, the measured fatigue lifetime represents
the number of cycles to both initiate and propagate a (dominant) crack to failure. As a result,
the S/N fatigue results are difficult to interpret in terms of mechanisms responsible for
fatigue failure, as the factors affecting crack initiation and subsequent crack growth cannot
readily be differentiated [12]. To analyze fatigue crack propagation, a fracture mechanics
approach needs to be considered where the crack-propagation rate, da/dN, is assessed in
terms of the range in stress-intensity factor, ΔK, defined as the difference between the stress
intensity at the maximum and minimum of the loading cycle [12]. The stress-intensity factor
fully characterizes the local stress and deformation fields in the immediate vicinity of a crack
tip in a linear-elastic solid and thus can be used to correlate to the extent of crack advance.
By using this approach, it is possible to isolate the specific mechanisms responsible for
fatigue crack growth and determine the microstructural or external factors which affect
growth separately from crack initiation. This may be deemed a more important aspect of
fatigue damage as bone is known to possess an inherent population of microcracks which
may minimize the role of the crack initiation stage [13].
The ability to characterize fracture resistance in emu tibiae (untreated and KOH treated) is of
importance to understanding bone fragility. Studies have measured the critical stress intensity
factor, Kc, and the critical strain energy release rate, Gc, in various bone tissues [14,15].
However, a linear elastic fracture mechanics (LEFM) approach is often inadequate to
characterize bone because of its complex microstructure and nonlinear, anisotropic

211
behaviour. This is especially valid when nonlinear processes absorb energy at the crack tip,
resulting in stable crack growth and increasing fracture resistance with increasing crack
length [15]. Such materials are commonly evaluated using the R-curve method, in which
fracture resistance is measured as a function of crack length as the crack propagates in a
stable, rather than catastrophic manner [15]. In order to provide a better estimate of bone’s
resistance to fracture, application of fracture mechanics should be utilized. As such, to study
fracture characteristics of untreated and KOH treated bones, a controlled notch can be
introduced into bone samples.
Microdamage assessment should be attempted using confocal microscopy as this technique
offers better visualization of microdamage than brightfield or fluorescence microscopy. The
small aperture of the confocal microscope improves brightness and spatial resolution by
providing light that does not scatter, hence enhancing the contrast between the stained crack
and the unstained background [16]. An alternative staining agent, such as lead uranyl acetate,
could be used to assess microdamage, as it has been shown to stain for microdamage in bone
[17].
It would also be interesting to investigate the fatigue damage accumulation (loss of stiffness)
and microdamage accumulation at different intervals during fatigue testing of emu tibiae
(untreated and KOH treated) in order to determine at what point during fatigue testing the
majority of the modulus degradation occurs. The samples could be fatigued to a set number
of cycle intervals (such as every 10,000 cycles) and then assessed using CT, DXA, QUS and
MRTA.
9.2.3. Objective 4 - Collagen degradation
Bone is a composite material composed of mineral, collagen, noncollagenous proteins and
solutes. Noncollagenous proteins play various roles in regulating mineralization and
maintaining the strength, stability and integrity of bone [18]. Noncollagenous protein
extraction experiments should be undertaken in order to verify any effect due to KOH
treatment.
212
The collagen molecules are stabilized by intermolecular crosslinks. Crosslinks have been
shown to inhibit intermolecular sliding and are important for enhancement of bone toughness
[19]. The location, identification and quantification of crosslinks in untreated and KOH
treated bones should also be investigated.
9.2.4. Objective 5 - Interface
In terms of investigating the nature of the collagen-mineral interface in KOH treated bone,
solid-state NMR can be used. It has been shown that 13C spins are mostly confined to the
organic matrix while 31P spins are largely confined to the inorganic component and thus, any 13C-31P distances measured, can be related to the organic-inorganic interface [20].
Finally, time-resolved sequence AFM imaging should be performed on emu tibiae samples
during chemical treatment with a highly concentrated KOH solution and afterwards with
EDTA. Untreated samples should be flushed with EDTA only. The EDTA treatment will
show the loss of mineral and may reveal any changes in the underlying collagen structure due
to KOH treatment. Subsequently, these samples should be analyzed using Raman
spectroscopy.
With respect to Raman spectroscopy, amide I profiles contain contributions from β-sheets, β-
strands, β-turns and disordered residues as well as from the predominant α-helical portions
[21]. Therefore, to resolve contributions from α-helix and β-sheet/strand, the Raman amide I
band should be deconvoluted for secondary structure quantification.

213
9.3. References
[1] Bennell K, Matheson G, Meeuwisse W, Brukner P. (1999) Risk factors for stress fractures. Sports.Med. 28:91-122.
[2] Li X, Agrawal M, Wang X. (2003) Age dependence of in situ thermostability of collagen in
human bone. Calcif.Tissue.Int. 72:513-518. [3] Wang X, TeKoppele JM, Athanasiou KA. (2000) Effect of collagen denaturation on the
toughness of bone. Clin.Orthop.Relat.Res. 371:228-239. [4] Wang X, Li X, Bank RA, Agrawal CM. (2002) Effects of collagen unwinding and cleavage
on the mechanical integrity of the collagen network in bone. Calcif.Tissue.Int. 71:186-192. [5] Oxlund H, Barckman M, Ortoft G, Andreassen TT. (1995) Reduced concentrations of
collagen cross-links are associated with reduced strength of bone. Bone. 17:365S-371S. [6] Jepsen KJ, Goldstein SA, Kuhn JL, Schaffler MB, Bonadio J. (1996) Type-I collagen
mutation compromises the post-yield behavior of Mov13 long bone. J.Orthop.Res. 14:493-499.
[7] Grynpas MD, Tupy JH, Sodek J. (1994) The distribution of soluble, mineral-bound and
matrix-bound proteins in osteoporotic and normal bones. Bone. 15:505-513. [8] Akkus O, Belaney RM, Das P. (2005) Free radical scavenging alleviates the biochemical
impairment of gamma radiation sterilized bone tissue. J.Orthop.Res. 23:838-845. [9] Vashishth D, Gibson GJ, Khoury JI, Schaffler MB, Kimura J, Fyhrie DP. (2001) Influence of
nonenzymatic glycation on biomechanical properties of cortical bone. Bone. 28:195-201. [10] Abe K, Hashizume H, Ushiki T. (1992) An EDTA-KOH method to expose bone cells for
scanning electron microscopy. J.Electron.Microsc.(Tokyo). 41:113-115. [11] Turner CH, Burr DB. (2001) Experimental Techniques for Bone Mechanics. In: Cowin SC,
editor. Bone Mechanics Handbook. CRC Press. Florida. pp. 1-35. [12] Kruzic JJ, Ritchie RO. (2008) Fatigue of mineralized tissues: cortical bone and dentin.
J.Mech.Beh.Biomed.Mat. 3-17. [13] Nalla RK, Kruzic JJ, Kinney JH, Ritchie RO. (2005) Aspects of in vitro fatigue in human
cortical bone: time and cycle dependent crack growth. Biomater. 26:2183-2195. [14] Bonfield W. (1987) Advances in the fracture mechanics of cortical bone. J.Biomech.
20:1071-1081. [15] Malik CL, Stover SM, Martin RB, Gibeling JC. (2003) Equine cortical bone exhibits rising
R-curve fracture mechanics. J.Biomech. 36:191-198. [16] O’Brien FJ, Taylor D, Dickson GR, Lee TC. (2000) Visualisation of three-dimensional
microcracks in compact bone. J.Anat. 197:413-420.
214
[17] Schaffler MB, Pitchford WC, Choi K, Riddle JM. (1994) Examination of compact bone microdamage using back-scattered electron microscopy. Bone. 15:483-488.
[18] Gundberg CM. (2003) Matrix proteins. Osteoporos.Int. 14:S37-S42. [19] Knott L, Bailey AJ. (1998) Collagen cross-links in mineralizing tissues: a review of their
chemistry, function, and clinical relevance. Bone. 22:181-187. [20] Jaeger C, Groom NS, Bowe EA, Horner A, Davies ME, Murray RC, Duer MJ. (2005)
Investigation of the nature of the protein-mineral interface in bone by solid-state NMR. Chem.Mater. 17:3059-3061.
[21] Shen J, Fan L, Yang J, Shen AG, Hu JM. (2010) A longitudinal raman microspectroscopic
study of osteoporosis induced by spinal cord injury. Osteoporos.Int. 21:81-87.

215
Appendix A Untreated (0-day) versus Control (14-day filled with saline) results A.1. Objective 1 - Initial study A.2. Objective 2 - Fatigue A.3. Objective 3 - Fractography A.4. Objective 4 - Collagen degradation A.5. Objective 5 - Interface

216
For each objective, two additional 14-day groups of ten female and ten male bones were
filled with saline instead of KOH to act as controls. This appendix presents the results from
each objective comparing the untreated (0-day) versus control (14-day filled with saline)
groups for both sexes.
A.1. Objective 1 - Initial study
In Objective 1, female and male emu tibiae were treated with 1 M potassium hydroxide
(KOH) solutions for 1-14 days. DXA, QUS, MRTA and three-point bending measurements
were performed on the tibiae before and after KOH treatment. KOH treatment did not change
the geometry or mineral content of the bone samples and only a minimal amount of collagen
was extracted. This was confirmed with the control (14-day filled with saline) group, whose
data was comparable to the untreated (0-day) group. Below is a summary of this data.
Table A.1: Average geometrical parameters, BMD, BMC values and normalized mechanical properties of untreated (0-day) and control (14-day filled with saline) samples. No differences were observed in these parameters between the untreated and control samples for both sexes.
Untreated (0-day) Control (14-day saline) Parameter
Female Male Female Male
Medial-Lateral diameter (mm) 28.6 ± 0.3 27.8 ± 0.3 28.5 ± 0.3 27.9 ± 0.3
Anterior-Posterior diameter (mm) 23.4 ± 0.2 22.8 ± 0.3 23.5 ± 0.2 23.2 ± 0.3
Cortical Thickness (mm) 4.2 ± 0.1 3.9 ± 0.1 4.2 ± 0.1 3.8 ± 0.1
Cortical area (mm2) 275 ± 5 240 ± 5 272 ± 5 239 ± 5
Moment of Inertia (mm4) 14132 ± 416 12068 ± 455 141115 ± 423 11995 ± 437
BMD (g/cm2) 1.3 ± 0.02 1.2 ± 0.02 1.3 ± 0.01 1.2 ± 0.01
BMC (g) 73.7 ± 1.1 65.4 ± 1.6 75.0 ± 1.5 64.7 ± 1.9
Ultimate Strength (MPa) 141.9 ± 5.1 124.7 ± 6.8 144.9 ± 7.5 129.6 ± 5.4
Failure Strength (MPa) 111.3 ± 6.0 70.8 ± 13.7 120.1 ± 9.5 76.4 ± 15.0
Failure strain (%) 1.6 ± 0.2 2.2 ± 0.3 1.5 ± 0.2 2.2 ± 0.4
Post Yield strain (%) 1.1 ± 0.2 1.8 ± 0.3 1.0 ± 0.2 1.7 ± 0.2
Toughness (mJ/mm3) 1.2 ± 0.2 1.6 ± 0.2 1.2 ± 0.1 1.6 ± 0.1
‘Post Yield’ Toughness (mJ/mm3) 1.0 ± 0.2 1.4 ± 0.2 0.9 ± 0.1 1.3 ± 0.2
Elastic Modulus (GPa) 16.9 ± 0.4 17.8 ± 0.6 15.9 ± 0.6 17.4 ± 0.9

217
Table A.2: Average geometrical parameter changes of untreated (0-day) and control (14-day filled with saline) samples. No differences were observed in geometrical parameter changes between the untreated and control samples for both sexes.
Untreated (0-day) Control (14-day saline) Parameter
Female Male Female Male
Change in medial-lateral diameter (%) 0.19 ± 0.2 0.34 ± 0.3 0.42 ± 0.8 0.13 ± 0.5
Change in anterior-posterior diameter (%) 0.34 ± 0.2 0.48 ± 0.4 0.40 ± 0.6 0.23 ± 0.4
Change in cortical thickness (%) 0.29 ± 0.6 0.39 ± 0.9 0.32 ± 0.3 1.0 ± 0.7
Change in cortical area (%) 0.11 ± 0.2 0.26 ± 0.4 0.17 ± 0.1 0.23 ± 0.4
Change in moment of inertia (%) 0.93 ± 0.5 0.89 ± 0.9 0.88 ± 0.7 0.71 ± 0.8 Table A.3: Average percent collagen weight removed and bone weight loss of untreated (0-day) and control (14-day filled with saline) samples. No differences were observed in the collagen weight removed and bone weight loss between the untreated and control samples for both sexes.
Untreated (0-day) Control (14-day saline) Parameter
Female Male Female Male Percent collagen loss (%) 0.0024 ± 0.001 0.0023 ± 0.001 0.0024 ± 0.001 0.0023 ± 0.001
Percent bone mass change (%) 0.0004 ± 0.001 0.0004 ± 0.001 0.0004 ± 0.001 0.0004 ± 0.001
Table A.4: Percent changes of bone quality measurements reported by the different measurement techniques of untreated (0-day) and control (14-day filled with saline) samples. No differences were observed in the measured output from DXA, QUS, MRTA and three-point bending between the untreated and control samples for both sexes.
Untreated (0-day) Control (14-day saline) Parameter
Female Male Female Male Percent change in BMD from DXA (%) 0.14 ± 0.2 0.26 ± 0.4 0.28 ± 0.3 0.15 ± 0.2
Percent change in SOS from QUS (%) 0.38 ± 0.2 0.48 ± 0.2 0.21 ± 0.3 0.27 ± 0.4
Percent change in EI from MRTA (%) 0.82 ± 1.2 1.28 ± 1.6 0.90 ± 1.0 1.13 ± 0.9
Percent change in E from three-point bending (%) 0.66 ± 0.6 0.87 ± 0.8 0.76 ± 1.0 1.01 ± 0.7

218
A.2. Objective 2 - Fatigue
The purpose of Objective 2 was to determine how emu bone fatigue properties are affected
by KOH treatment, a treatment targeted to affect only the organic component of bone and to
determine if current clinical tools could detect the effects of partial fatigue testing in
untreated and KOH treated bones. Similarly to Objective 1, KOH treatment did not change
the geometry or mineral content of the bone samples and a negligible amount of collagen was
extracted. Fatigue testing to 100,000 cycles also did not alter the geometry or mineral content
of the bone samples. This was confirmed with the control (14-day filled with saline) group,
whose data was comparable to the untreated (0-day) group. Below is a summary of this data.
Table A.5: Average geometrical parameters and BMD values of untreated (0-day) and control (14-day filled with saline) fatigue samples. No differences were observed in these parameters between the untreated and control samples for both sexes.
Untreated (0-day) Control (14-day saline) Parameter
Female Male Female Male
Medial-Lateral diameter (mm) 28.1 ± 0.3 27.9 ± 0.3 27.9 ± 0.4 28.0 ± 0.3
Anterior-Posterior diameter (mm) 24.0 ± 0.2 23.2 ± 0.3 24.2 ± 0.2 23.3 ± 0.2
Cortical Thickness (mm) 4.55 ± 0.14 3.91 ± 0.14 4.49 ± 0.23 3.94 ± 0.10
Cortical area (mm2) 292 ± 11 251 ± 10 285 ± 17 256 ± 13
Moment of Inertia (mm4) 15234 ± 729 11805 ± 685 14789 ± 865 11467 ± 601
BMD (g/cm2) 1.32 ± 0.03 1.20 ± 0.04 1.35 ± 0.02 1.19 ± 0.05
Table A.6: Average geometrical parameter changes of untreated (0-day) and control (14-day filled with saline) fatigue samples. No differences were observed in geometrical parameter changes between the untreated and control samples for both sexes.
Untreated (0-day) Control (14-day saline) Parameter
Female Male Female Male
Change in medial-lateral diameter (%) 0.35 ± 0.9 0.56 ± 0.8 0.49 ± 0.6 0.60 ± 0.9
Change in anterior-posterior diameter (%) 0.38 ± 0.7 0.68 ± 0.7 0.47 ± 0.6 0.59 ± 0.9
Change in cortical thickness (%) 0.50 ± 0.8 1.02 ± 0.9 0.62 ± 0.9 0.76 ± 0.7
Change in cortical area (%) 0.40 ± 0.6 0.38 ± 0.4 0.45 ± 0.5 0.37 ± 0.5
Change in moment of inertia (%) 0.42 ± 0.6 0.69 ± 0.6 0.56 ± 0.7 0.63 ± 0.9

219
Table A.7: Initial secant modulus, creep strain at fracture and maximum strain at fracture for untreated (0-day) and control (14-day filled with saline) fatigue samples. No differences were observed in these parameters between the untreated and control samples for both sexes.
Untreated (0-day) Control (14-day saline) Parameter
Female Male Female Male
Eo (MPa) 24947 ± 1110 27821 ± 1139 26651 ± 1019 25113 ± 1110
εcreep_fracture (με) 3340 ± 793 3394 ± 800 3514 ± 1037 3487 ± 955
εmax_fracture (με) 7983 ± 1059 6457 ± 814 6582 ± 1033 6993 ± 934
Table A.8: Average percent collagen weight removed and bone weight loss of untreated (0-day) and control (14-day filled with saline) fatigue samples. No differences were observed in the collagen weight removed and bone weight loss between the untreated and control samples for both sexes.
Untreated (0-day) Control (14-day saline) Parameter
Female Male Female Male Percent collagen loss (%) 0.0034 ± 0.001 0.0017 ± 0.001 0.0029 ± 0.001 0.0023 ± 0.001
Percent bone mass change (%) 0.0009 ± 0.001 0.0007 ± 0.001 0.0004 ± 0.001 0.0006 ± 0.001
Table A.9: Strain levels during partial fatigue testing of untreated (0-day) and control (14-day filled with saline) fatigue samples. No differences were observed in the strain levels between the untreated and control samples for both sexes.
Untreated (0-day) Control (14-day saline) Parameter
Female Male Female Male
Percent collagen loss (%) 1980 ± 34 2003 ± 20 2001 ± 42 1989 ± 37

220
Figure A.1: Peak stress versus log(N) curves for untreated (0-day) and control (14-day filled with saline) fatigue samples. No differences were observed in fatigue behaviour between the untreated and control samples for both sexes. All tests were subjected to a constant minimum stress of 5 MPa.
Figure A.2: Peak stress versus damage index rate curves for untreated (0-day) and control (14-day filled with saline) fatigue samples. No differences were observed in fatigue behaviour between the untreated and control samples for both sexes. All tests were subjected to a constant minimum stress of 5 MPa.
1 10 100 1000 10000 100000 10000000
50
100
150
200Female Untreated (0-day)Male Untreated (0-day)Female Control (14-day saline)Male Control (14-day saline)
Cycles to failure (N)
Pea
k St
ress
(M
Pa)
1 10 100 1000 10000 100000 10000000
50
100
150
200Female Untreated (0-day)Male Untreated (0-day)Female Control (14-day saline)Male Control (14-day saline)
Cycles to failure (N)
Pea
k St
ress
(M
Pa)
10-910-810-710-610-510-410-310-210-11000
50
100
150
200Female Untreated (0-day)Male Untreated (0-day)Female Control (14-day saline)Male Control (14-day saline)
Damage index rate (1/sec)
Pea
k St
ress
(M
Pa)
10-910-810-710-610-510-410-310-210-11000
50
100
150
200Female Untreated (0-day)Male Untreated (0-day)Female Control (14-day saline)Male Control (14-day saline)
Damage index rate (1/sec)
Pea
k St
ress
(M
Pa)

221
Figure A.3: Peak stress versus creep rate curves for untreated (0-day) and control (14-day filled with saline) fatigue samples. No differences were observed in fatigue behaviour between the untreated and control samples for both sexes. All tests were subjected to a constant minimum stress of 5 MPa. Table A.10: Percent changes of bone quality measurements reported by the different measurement techniques of untreated (0-day) and control (14-day filled with saline) fatigue samples. No differences were observed in the measured output from DXA, QUS, MRTA and three-point bending between the untreated and control samples for both sexes.
Untreated (0-day) Control (14-day saline) Parameter
Female Male Female Male Percent change in BMD from DXA (%) 0.26 ± 0.5 1.09 ± 0.3 0.34 ± 0.4 0.58 ± 0.7
Percent change in SOS from QUS (%) 1.38 ± 0.5 0.68 ± 0.5 1.72 ± 0.4 1.12 ± 0.6
Percent change in EI from MRTA (%) 19.28 ± 4.0 21.98 ± 4.1 20.99 ± 3.6 19.71 ± 4.7
Percent change in E from three-point bending (%) 20.16 ± 4.8 19.45 ± 3.5 20.02 ± 4.0 20.03 ± 3.8
10-910-810-710-610-510-410-310-20
50
100
150
200Female Untreated (0-day)Male Untreated (0-day)Female Control (14-day saline)Male Control (14-day saline)
Creep rate (1/sec)
Pea
k St
ress
(M
Pa)
10-910-810-710-610-510-410-310-20
50
100
150
200Female Untreated (0-day)Male Untreated (0-day)Female Control (14-day saline)Male Control (14-day saline)
Creep rate (1/sec)
Pea
k St
ress
(M
Pa)

222
A.3. Objective 3 - Fractography
In Objective 3, we attempted to determine the failure mechanisms responsible for the altered
fracture behaviour of female and male emu tibiae endocortically treated with KOH. We
investigated the microscopic morphology of the three-point bending fracture surfaces of
untreated and KOH treated female and male emu cortical bone (from Objective 1) in an effort
to understand the altered mechanical properties previously observed. Crack morphology was
visualized qualitatively by taking SEM images of the tensile and compressive surfaces of
untreated and 14-day KOH treated samples. The fracture surfaces of 14-day female and male
KOH treated bones showed a significantly higher ‘roughness’ compared to untreated bones.
Furthermore, additional toughening mechanisms, which are important features for dissipating
energy during the failure process, were observed in the KOH treated samples, but were
absent in the untreated samples for both sexes. This was confirmed with the control (14-day
filled with saline) group, whose data was comparable to the untreated (0-day) group. Below
is a summary of this data.
Table A.11: Average tensile, compressive and transition areas of untreated (0-day) and control (14-day filled with saline) samples. No differences were observed in the percent tensile, compressive or transition areas between the untreated and control samples for both sexes.
Untreated (0-day) Control (14-day saline) Parameter
Female Male Female Male
Percent tensile region (%) 50 ± 2 50 ± 2 48 ± 2 49 ± 2
Percent compressive region (%) 34 ± 1 38 ± 2 37 ± 2 37 ± 2
Percent transition region (%) 15 ± 2 12 ± 2 15 ± 2 14 ± 2 Table A.12: Average percent area roughness measurements of untreated (0-day) and control (14-day filled with saline) samples. No differences were observed in the percent area roughness between the untreated and control samples for both sexes.
Untreated (0-day) Control (14-day saline) Failure Mode Characteristic
Female Male Female Male
%Rough (%) 50 ± 6 48 ± 5 51 ± 5 50 ± 4 Tensile Side (TS)
%Smooth (%) 50 ± 6 52 ± 5 49 ± 5 50 ± 4
%Rough (%) 44 ± 3 46 ± 4 43 ± 4 45 ± 4 Compressive Side (CS)
%Smooth (%) 56 ± 3 54 ± 4 57 ± 4 55 ± 4
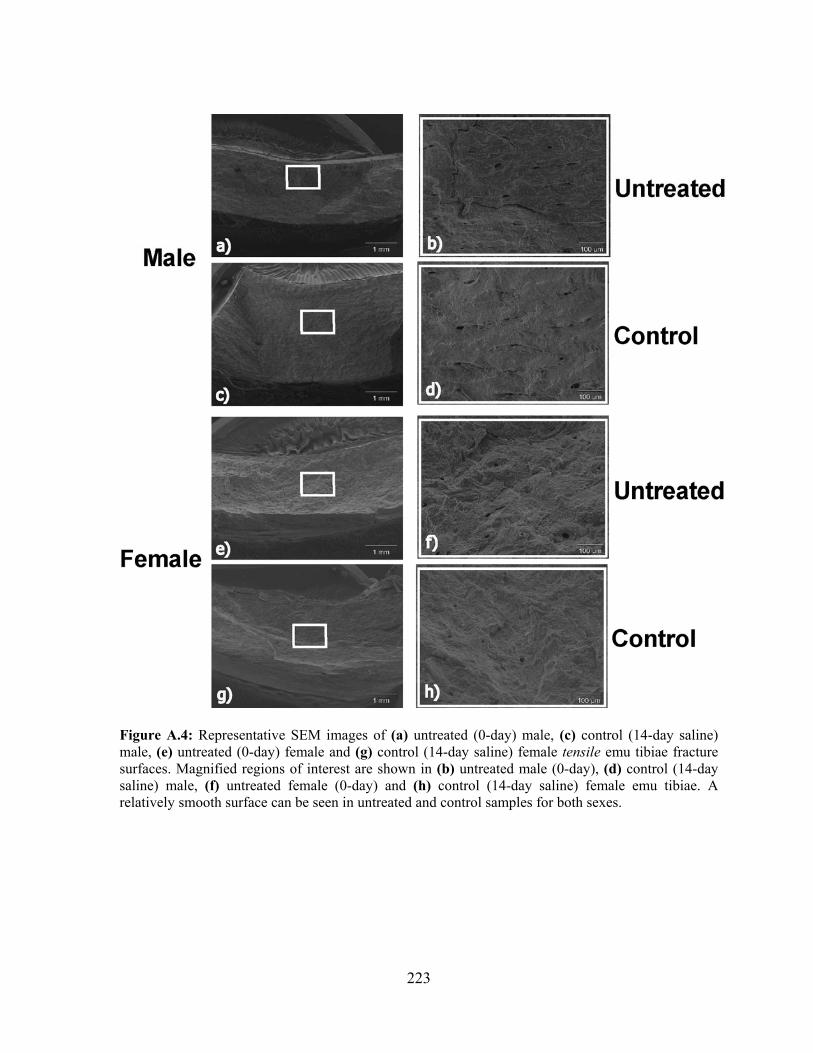
223
Figure A.4: Representative SEM images of (a) untreated (0-day) male, (c) control (14-day saline) male, (e) untreated (0-day) female and (g) control (14-day saline) female tensile emu tibiae fracture surfaces. Magnified regions of interest are shown in (b) untreated male (0-day), (d) control (14-day saline) male, (f) untreated female (0-day) and (h) control (14-day saline) female emu tibiae. A relatively smooth surface can be seen in untreated and control samples for both sexes.

224
Figure A.5: Representative SEM images of (a) untreated (0-day) male, (c) control (14-day saline) male, (e) untreated (0-day) female and (g) control (14-day saline) female compressive emu tibiae fracture surfaces. Magnified regions of interest are shown in (b) untreated male (0-day), (d) control (14-day saline) male, (f) untreated female (0-day) and (h) control (14-day saline) female emu tibiae. A relatively smooth surface can be seen in untreated and control samples for both sexes.

225
Table A.13: Average porosity parameters from tensile side of untreated (0-day) and control (14-day filled with saline) fracture surfaces. No differences were observed in the percent area roughness between the untreated and control samples for both sexes.
Untreated (0-day) Control (14-day saline) Parameter
Female Male Female 14-day
No. of large pores (pore diameter >47 μm) per area (mm-2) 0.8 ± 0.1 1.0 ± 0.1 1.1 ± 0.2 1.0 ± 0.2
No. of small pores (pore diameter<47 μm) per area (mm-2) 75 ± 8 71 ± 5 72 ± 6 69 ± 7

226
A.4. Objective 4 - Collagen degradation
The purpose of Objective 4 was to determine if the mineral and collagen were affected by
KOH treatment using several mineral (powder XRD, microhardness testing, qBSE) and
collagen (α-chymotrypsin, DSC, SDS-PAGE, polarized light microscopy) characterization
techniques. KOH treatment causes in situ collagen degradation without affecting the mineral
phase. 14-day KOH treated emu tibiae for both sexes had significantly greater amounts of
degraded collagen compared to untreated samples. This was also confirmed with the control
(14-day filled with saline) group, whose data was comparable to the untreated (0-day) group.
Below is a summary of this data.
Table A.14: Emu bone mineral crystal length (002) and cross section (310) estimated by XRD and microhardness testing results of untreated (0-day) and control (14-day filled with saline) samples. No differences were observed in BSE parameters between the untreated and control samples for both sexes.
Untreated (0-day) Control (14-day saline) Parameter
Female Male Female Male
Crystal length 26° peak (Å) 205 ± 2 209 ± 2 207 ± 3 206 ± 2
Crystal cross section 40° peak (Å) 62 ± 0.5 63 ± 0.6 63 ± 0.7 62 ± 0.7
Microhardness, HV (kg/mm2) 61 ± 0.4 62 ± 0.5 60 ± 0.7 61 ± 0.6
Table A.15: Quantitative BSE results of untreated (0-day) and control (14-day filled with saline) samples. No differences were observed in BSE parameters between the untreated and control samples for both sexes.
Untreated (0-day) Control (14-day saline) Parameter
Female Male Female Male
Peak grey level (pixels) 177 ± 7 175 ± 9 180 ± 8 179 ± 8
FWHMH (pixels) 25 ± 3 23 ± 3 24 ± 3 23 ± 4
Large Pore Density (#/mm2) 0.23 ± 0.06 0.22 ± 0.07 0.18 ± 0.08 0.19 ± 0.06
Small Pore Density (#/mm2) 110 ± 4 110 ± 4 108 ± 4 109 ± 4
Total Length of Dark Band (μm) 190 ± 45 220 ± 45 198 ± 51 195 ± 46

227
Table A.16: Average percent digested collagen from the α-chymotrypsin technique of untreated (0-day) and control (14-day filled with saline) samples. No differences were observed in percent digested collagen between the untreated and control samples for both sexes.
Untreated (0-day) Control (14-day saline) Parameter
Female Male Female Male Percent digested collagen (%) 16.53 ± 0.93 18.89 ± 0.64 17.48 ± 0.53 18.55 ± 0.47
Table A.17: Average female and male emu tibiae thermal characteristics from DSC of untreated (0-day) and control (14-day filled with saline) samples. No differences were observed in DSC parameters between the untreated and control samples for both sexes.
Untreated (0-day) Control (14-day saline) Parameter
Female Male Female Male
Tonset (°C) 48.5 ± 1.6 47.7 ± 1.5 48.2 ± 1.8 48.7 ± 1.4
Tpeak (°C) 60.9 ± 0.2 60.6 ± 0.4 60.7 ± 0.4 60.4 ± 0.3
FWHMH (°C) 18.4 ± 1.1 17.6 ± 0.8 17.2 ± 0.8 18.1 ± 0.8
Enthalpy (ΔH; J/g of collagen) 38.7 ± 0.8 38.6 ± 1.2 38.9 ± 0.9 38.5 ± 1.4
Height (mW/mg of collagen) 0.17 ± 0.01 0.16 ± 0.01 0.17 ± 0.01 0.17 ± 0.01
Table A.18: Average relative peak intensity from SDS-PAGE of untreated (0-day) and control (14-day filled with saline) samples. No differences were observed in percent digested collagen between the untreated and control samples for both sexes.
Untreated (0-day) Control (14-day saline) Parameter
Female Male Female Male Average relative peak intensity (Arbitrary Units) 16944 ± 189 16948 ± 218 16714 ± 345 17019 ± 287

228
A.5. Objective 5 - Interface
The goal of Objective 5 was to understand the effect of KOH treatment on the bone mineral-
collagen interface using Raman spectroscopy and AFM. The Raman spectra of bone samples
treated with KOH showed an increase in peak position and band width of the amide III band
for both sexes compared to untreated samples. AFM images revealed a ‘swollen’ appearance
in KOH treated samples compared to untreated samples. No differences were observed in
Raman spectroscopy parameters as well as AFM images between the untreated (0-day) and
control (14-day filled with saline) groups for both sexes. Below is a summary of this data.
Table A.19: Average female and male emu tibiae Raman spectroscopy parameters of untreated (0-day) and control (14-day filled with saline) samples. No differences were observed in Raman spectroscopy parameters between the untreated and control samples for both sexes.
Untreated (0-day) Control (14-day saline) Parameter
Female Male Female Male Mineralization (phosphate/amide I) 9.17 ± 0.55 10.18 ± 0.91 9.23 ± 0.66 9.67 ± 0.45
Mineralization (phosphate/amide III) 18.47 ± 0.71 18.39 ± 1.48 18.45 ± 1.21 18.21 ± 1.64
Mineralization (phosphate/CH2)
11.20 ± 0.70 12.25 ± 1.19 12.11 ± 0.88 11.75 ± 1.94
Carbonate Substitution (phosphate/carbonate) 4.76 ± 0.14 4.56 ± 0.29 4.42 ± 0.27 4.47 ± 0.34
Mineral Crystallinity (1/phosphate FWHMH) 0.057 ± 0.001 0.056 ± 0.001 0.059 ± 0.002 0.058 ± 0.002
Table A.20: Average Raman peak widths of the major bands of untreated (0-day) and control (14-day filled with saline) samples. No differences were observed in Raman peak widths between the untreated and control samples for both sexes.
Untreated (0-day) Control (14-day saline) FWHMH (cm-1)
Female Male Female Male
Phosphate 17.60 ± 0.36 17.19 ± 0.33 17.45 ± 0.27 17.30 ± 0.41
Carbonate 53.00 ± 1.83 52.99 ± 1.36 53.01 ± 2.01 53.00 ± 1.18
Amide III 41.01 ± 1.36 40.23 ± 1.46 41.11 ± 1.26 40.55 ± 0.99
C-H bending 30.71 ± 0.81 29.90 ± 1.21 29.98 ± 1.01 30.52 ± 0.69
Amide I 50.65 ± 0.93 51.81 ± 0.85 50.85 ± 0.37 50.47 ± 0.91
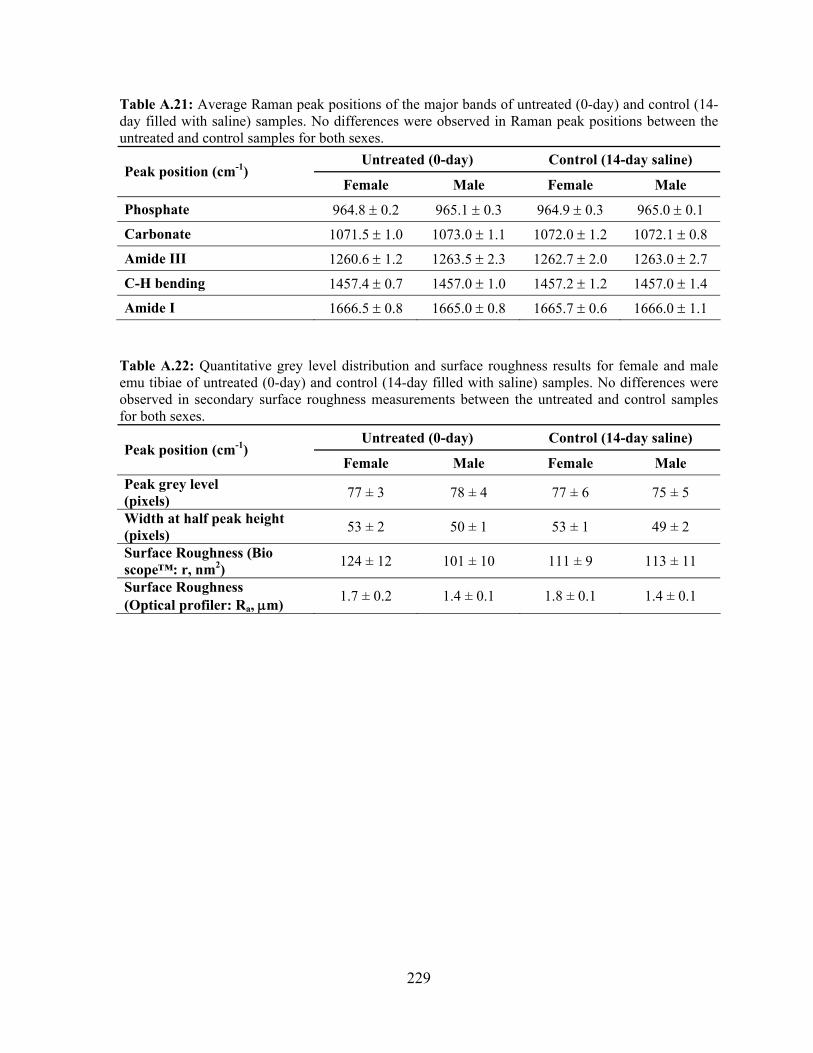
229
Table A.21: Average Raman peak positions of the major bands of untreated (0-day) and control (14-day filled with saline) samples. No differences were observed in Raman peak positions between the untreated and control samples for both sexes.
Untreated (0-day) Control (14-day saline) Peak position (cm-1)
Female Male Female Male
Phosphate 964.8 ± 0.2 965.1 ± 0.3 964.9 ± 0.3 965.0 ± 0.1
Carbonate 1071.5 ± 1.0 1073.0 ± 1.1 1072.0 ± 1.2 1072.1 ± 0.8
Amide III 1260.6 ± 1.2 1263.5 ± 2.3 1262.7 ± 2.0 1263.0 ± 2.7
C-H bending 1457.4 ± 0.7 1457.0 ± 1.0 1457.2 ± 1.2 1457.0 ± 1.4
Amide I 1666.5 ± 0.8 1665.0 ± 0.8 1665.7 ± 0.6 1666.0 ± 1.1
Table A.22: Quantitative grey level distribution and surface roughness results for female and male emu tibiae of untreated (0-day) and control (14-day filled with saline) samples. No differences were observed in secondary surface roughness measurements between the untreated and control samples for both sexes.
Untreated (0-day) Control (14-day saline) Peak position (cm-1)
Female Male Female Male Peak grey level (pixels) 77 ± 3 78 ± 4 77 ± 6 75 ± 5
Width at half peak height (pixels) 53 ± 2 50 ± 1 53 ± 1 49 ± 2
Surface Roughness (Bio scope™: r, nm2) 124 ± 12 101 ± 10 111 ± 9 113 ± 11
Surface Roughness (Optical profiler: Ra, μm) 1.7 ± 0.2 1.4 ± 0.1 1.8 ± 0.1 1.4 ± 0.1