the connection between thermal and nonthermal …bzhang/peer12.pdf · the connection between...
TRANSCRIPT

Mon. Not. R. Astron. Soc. 420, 468–482 (2012) doi:10.1111/j.1365-2966.2011.20052.x
The connection between thermal and non-thermal emission in gamma-raybursts: general considerations and GRB 090902B as a case study
Asaf Pe’er,1,2!† Bin-Bin Zhang,3 Felix Ryde,4 Sinead McGlynn,4 Bing Zhang,3
Robert D. Preece5 and Chryssa Kouveliotou6
1Space Telescope Science Institute, 3700 San Martin Drive, Baltimore, MD 21218, USA2Harvard–Smithsonian Center for Astrophysics, 60 Garden Street, MS-51, Cambridge, MA 02138, USA3Department of Physics and Astronomy, University of Nevada, Las Vegas, NV 89154, USA4Department of Physics, Royal Institute of Technology, AlbaNova, SE-106 91 Stockholm, Sweden5Center for Space Plasma and Aeronomic Research (CSPAR), University of Alabama in Huntsville, Huntsville, AL 35899, USA6Space Science Office, VP62, NASA/Marshall Space Flight Center, Huntsville, AL 35812, USA
Accepted 2011 October 20. Received 2011 October 20; in original form 2011 September 23
ABSTRACTPhotospheric (thermal) emission is inherent to the gamma-ray burst (GRB) ‘fireball’ model.We show here that inclusion of this component in the analysis of the GRB prompt emissionphase naturally explains some of the prompt GRB spectra seen by the Fermi satellite over itsentire energy band. The sub-MeV peak is explained as multicolour blackbody emission, andthe high-energy tail, extending up to the GeV band, results from roughly similar contribu-tions of synchrotron emission, synchrotron self-Compton and Comptonization of the thermalphotons by energetic electrons originating after dissipation of the kinetic energy above thephotosphere. We show how this analysis method results in a complete, self-consistent pictureof the physical conditions at both emission sites of the thermal and non-thermal radiation. Westudy the connection between the thermal and non-thermal parts of the spectrum, and showhow the values of the free model parameters are deduced from the data. We demonstrate ouranalysis method on GRB 090902B: we deduce a Lorentz factor in the range 920 ! " ! 1070,photospheric radius rph " 7.2–8.4 # 1011 cm and dissipation radius r# $ 3.5–4.1 # 1015 cm.By comparison to afterglow data, we deduce that a large fraction $d % 85–95 per cent of thekinetic energy is dissipated, and that a large fraction, & equipartition of this energy, is carriedby the electrons and the magnetic field. This high value of $d questions the ‘internal shock’scenario as the main energy dissipation mechanism for this GRB.
Key words: plasmas – radiation mechanisms: thermal – radiative transfer – scattering –gamma-ray burst: general.
1 IN T RO D U C T I O N
Although extensively studied for nearly two decades, the originof the prompt emission of gamma-ray bursts (GRBs) is still puz-zling. Up until these days, GRB prompt emission spectra are oftenmodelled as a smoothly broken power law, which is referred to asthe ‘Band’ function (Band et al. 1993; Preece et al. 1998a, 2000;Kaneko et al. 2006, 2008; Abdo et al. 2009b). While the ‘Band’function often provides very good fits to the observed spectra overa limited energy range, it suffers two crucial drawbacks. In severalbursts seen by the Fermi satellite, a high-energy tail extending up to
!E-mail: [email protected]†Giacconi Fellow.
tens of GeV was seen (e.g. GRB 090510, Ackermann et al. 2010;or GRB 090902B, Abdo et al. 2009a). The first drawback is thatthis tail requires more than the ‘Band’ function on its own to havean acceptable fit. However, the most severe drawback is that the‘Band’ function, being empirical in nature, does not provide any in-formation about the emission mechanism that produces the promptradiation.
A common interpretation of the observed GRB spectrum is thatit results from synchrotron emission, accompanied perhaps by syn-chrotron self-Compton (SSC) emission at high energies (Rees &Meszaros 1994; Sari & Piran 1997a; Pilla & Loeb 1998; Guetta &Granot 2003; Pe’er & Waxman 2004; Gupta & Zhang 2007). Theemission follows the dissipation of a kinetic energy. The preva-lent dissipation models involve either internal shocks (Rees &Meszaros 1994; Sari & Piran 1997b), magnetic energy dissipation in
C' 2011 The AuthorsMonthly Notices of the Royal Astronomical Society C' 2011 RAS

Thermal and non-thermal emission in GRBs 469
Poynting-dominated outflows (Thompson 1994; Spruit, Daigne &Drenkhahn 2001; Giannios & Spruit 2005; Zhang & Yan 2011),or collisional heating (Beloborodov 2010). These models have twomain advantages. First, they can explain the complex light curvesoften seen (albeit with very little predictive power). Secondly, theynaturally account for the non-thermal spectrum.
In spite of these advantages, in recent years evidence is accumu-lating for serious difficulties in these models. A well-known defi-ciency of the internal shock scenario is the low efficiency of energyconversion (Mochkovitch, Maitia & Marques 1995; Kobayashi,Piran & Sari 1997; Daigne & Mochkovitch 1998; Lazzati, Ghisellini& Celotti 1999; Guetta, Spada & Waxman 2001; Maxham &Zhang 2009), resulting from the fact that only the energy asso-ciated with the differential motion between the expanding ejectashells after the GRB explosion can be dissipated, and that this en-ergy is much lower than the energy associated with the bulk motion.This is in contrast to the observations which show high efficiencyin # -ray emission, of the order of tens of per cent (Zhang et al.2007; Nysewander, Fruchter & Pe’er 2009). A second drawback isthat optically thin synchrotron and SSC emission cannot accountfor the steepness of the low-energy spectral slopes (Crider et al.1997; Preece et al. 1998b, 2002; Ghirlanda, Celotti & Ghisellini2003) (although part of the observed steepening may be accountedfor when SSC in the Klein–Nishina limit is considered; see Daigne,Bosnjak & Dubus 2009; Bosnjak, Daigne & Dubus 2009). Thirdly,the high-energy spectral slope varies significantly from burst toburst (Preece et al. 1998a; Kaneko et al. 2006), with some burstsshowing very steep high energy spectral slopes. This is in contra-diction to the expected spectral slope of synchrotron emission froma power-law distribution of electrons, which is expected to producea fairly flat spectrum, %F% ( %0. Finally, the fitting is often madeto the time-integrated spectrum. Analysis of time resolved spectradone by Crider, Liang & Preece (1998) and Ghirlanda et al. (2003)has shown that neither the synchrotron nor the SSC models canexplain the time resolved low-energy spectral slopes.
These well-known difficulties of the synchrotron emission modelhave motivated the study of alternative scenarios. These include,among others, quasi-thermal Comptonization (Ghisellini & Celotti1999), Compton drag (Zdziarski, Svensson & Paczynski 1991;Shemi 1994; Lazzati et al. 2000), jitter radiation (Medvedev2000), Compton scattering of synchrotron self-absorbed photons(Panaitescu & Meszaros 2000; Stern & Poutanen 2004) and syn-chrotron emission from a decaying magnetic field (Pe’er & Zhang2006).
An alternative model, which is arguably the most naturalone, is a radiative contribution from the photosphere (Eichler &Levinson 2000; Meszaros & Rees 2000; Daigne & Mochkovitch2002; Meszaros et al. 2002; Rees & Meszaros 2005; Ghirlandaet al. 2007; Beloborodov 2010; Ioka 2010; Mizuta, Nagataki & Aoi2010). Indeed, a photospheric emission is a natural outcome of the‘fireball’ model. At small radii, close to the inner engine, the opticaldepth is huge, & & 1015 (see e.g. Piran 2005, for a review). As aresult, photons cannot escape, but are advected with the flow untilthey decouple at the photosphere. The huge value of the opticaldepth implies that regardless of the initial emitted spectrum, if pho-tons are emitted deep enough in the flow, the spectrum emergingat the photosphere is blackbody (a Wien spectrum may be obtainedif the number of photons is conserved). In fact, in the classical‘fireball’ model, photons serve as mediators for energy conversion(the explosion energy is converted into kinetic energy of the rel-ativistically expanding plasma jet by scattering between photonsand leptons, which in turn convert the energy to the baryons via
Coulomb collisions). Therefore, the appearance of thermal photonsas part of the observed spectrum is not only expected, but is in factrequired.
Apart from being an inherent part of the ‘fireball’ model, oneof the key advantages of the idea that at least part of the observedspectrum originates from the photosphere is that it provides a re-lief for the efficiency problem of the internal shock model (Pe’er,Meszaros & Rees 2005; Lazzati, Morsony & Begelman 2009; Ryde& Pe’er 2009). This is because if indeed part of the photons that wesee have photospheric origin, then the total energy seen in photonsis higher than the energy released by the internal dissipation: onlythe non-thermal part of the spectrum is required to originate fromenergy dissipation above the photosphere. Thus, the dissipated en-ergy may be smaller than the remaining kinetic energy, even thoughthe total energy seen in the photon component is comparable tothe kinetic energy. A second great advantage of this idea is thatthe Rayleigh–Jeans part of the thermal spectrum (or modificationof it) can naturally account for low-energy spectral slopes muchsteeper than those allowed by the synchrotron theory, and are henceconsistent with observations.
The observed GRB spectra are therefore expected to be hybrid,i.e. containing both thermal and non-thermal parts. These two partsare connected in a non-trivial way. As the non-thermal part orig-inates from energy dissipation (one or more) occurring above thephotosphere, it is naturally delayed with respect to the thermal pho-tons. A complete decomposition of the thermal and non-thermalparts of the spectrum is in fact nearly impossible. Thermal pho-tons serve as seed photons to Compton scattering by the energeticelectrons, thereby affecting the non-thermal part as well. Even ifthe dissipation occurs high above the photosphere, thermal pho-tons significantly contribute to the cooling of the electrons (Pe’eret al. 2005), therefore affecting the spectrum emitted by these elec-trons. As was shown by Pe’er, Meszaros & Rees (2006), underthese conditions a flat energy spectrum (%F% ( %0), resulting frommultiple Compton scattering of the thermal photons, is naturallyobtained for a large range of parameters. A similar conclusionwas drawn in the case of a magnetized outflow under the assump-tion of slow heating due to continuous reconnection at all radii(Giannios 2006). These predictions were shown to be in quali-tatively very good agreement with Fermi results (Toma, Wu &Meszaros 2010).
The non-trivial connection between the thermal and non-thermalcomponents, combined with the fact that both components vary intime, makes it difficult to identify the thermal component. A break-through in identifying this component was made by Ryde (2004,2005), who looked at time resolved spectra, thereby allowing anidentification of the temporal evolution of the temperature. Repeat-ing a similar analysis on a fairly large sample of bursts, it wasshown by Ryde & Pe’er (2009) that the thermal component notonly could be identified, but that both the temperature and flux ofthis component show repetitive temporal behaviour at late times:F ob
BB ( t)2 and Tob ( t)2/3. This behaviour was found to be invery good agreement with the theoretical predictions (Pe’er 2008),thereby providing an independent indication for the correct identifi-cation of the thermal emission component. It should be pointed outhere that the thermal emission is expected to appear as grey-bodyemission, composed of multicolour blackbody spectra. This resultsfrom the fact that at a given time interval an observer sees photonsemitted from different radii and different angles, hence undergoingdifferent Doppler shifts. A full analysis shows that the resultinglow-energy spectrum (below the observed spectral peak, typicallyseen at sub-MeV) is a power law (Pe’er & Ryde 2011).
C' 2011 The Authors, MNRAS 420, 468–482Monthly Notices of the Royal Astronomical Society C' 2011 RAS
470 A. Pe’er et al.
Once the thermal component is identified, it is relatively easy touse its properties to deduce the dynamics of the outflow. As opposedto the non-thermal part, whose emission radius is uncertain (theremay be multiple emission radii), the emission radius of the thermalphotons is defined to be at the photosphere. Thus, by studying theproperties (thermal flux and temperature) of the thermal component,under the assumption of constant outflow velocity, it is possible todeduce the photospheric radius and the Lorentz factor of the flow(Pe’er et al. 2007). We note that this method is independent, andis complementary to the opacity argument method commonly usedto constrain the Lorentz factor of the flow at the emission radiusof the high-energy photons (Svensson 1987; Krolik & Pier 1991;Woods & Loeb 1995; Lithwick & Sari 2001). It has two mainadvantages to the opacity argument method. First, it provides adirect measurement of the Lorentz factor, rather than a lower limit.Secondly, it is independent of measurements of the variability time,which is highly uncertain.
While in the past a clear identification of a thermal componentwas difficult, the situation dramatically changed with the broad-band spectral coverage enabled with the launch of Fermi. Out of14 GRBs detected by the Large Area Telescope (LAT) until 2010January, three show clear evidence for a distinctive high-energy(>MeV and up to the GeV range) spectral component, and anothereight show marginal evidence for such a component (Granot 2010).Thus, it is natural to deduce that the low-energy photons (below andat the sub-MeV peak of the flux) have a different origin than thehigher energy (LAT) photons.
Out of the three bursts that show clear evidence for a distincthigh-energy spectral component, GRB 090902B may be the easi-est to analyse, for two reasons. First, the low-energy part of thespectrum (the spectral peak) is very narrow, and both the low-energy and high-energy spectral slopes are very steep. Thus, anyattempts of fitting the spectrum using the standard synchrotron-SSC model are rejected. On the other hand, the spectrum is eas-ily fitted with a (multicolour) blackbody spectrum, plus an addi-tional power law (Ryde et al. 2010; Zhang et al. 2011). Thus, todate, this burst is unique by the fact that a thermal component isso clearly pronounced in its spectrum. Secondly, the high-energypower-law component is spectrally distinctive from the low-energyone. Using the opacity argument, the detection of a 33.4- GeV pho-ton associated with this burst (Abdo et al. 2009a) implies that theemission radius of this photon must be much greater than the pho-tosphere (see below). These two facts make this burst ideal fordemonstrating how separation of the spectrum into thermal andnon-thermal components enables one to deduce the physical con-ditions of the outflow at the emission sites of both the thermal andnon-thermal photons. Moreover, as we will show below, one canuse measurements of the non-thermal part, to remove some of theuncertainties that exist in measurements of the thermal componentalone.
This paper is organized as follows. In Section 2, we providethe general properties of the combined thermal and non-thermalmodel. We show how one can combine the hydrodynamic infor-mation derived by studying the properties of the thermal com-ponent with the constraints given by measuring the properties ofthe non-thermal part of the spectrum, to provide a comprehen-sive picture of the physical parameters at both emission sites.In Section 3 we demonstrate the use of our method by fit-ting the prompt emission spectrum of GRB 090902B, and de-ducing its physical properties. We summarize and conclude inSection 4.
2 G E N E R A L P RO P E RT I E S O F A TH E R M A LA N D N O N - T H E R M A L M O D E L S
2.1 Temperature, luminosity and constraints on the value of !e
We consider a fireball wind of total luminosity L, expanding froman initial radius r0 (which, for the sake of argument, can be assumedto be a few times the last stable orbit around the central black holeor the sonic radius; in any case, it is a few times the Schwarzschildradius around a non-rotating black hole; see further discussion atthe end of Section 3.1). The initial blackbody temperature at r0 isT0 = (L/4!r2
0 ca)1/4, where c is the speed of light and a is theradiation constant. As the optically thick (adiabatic) wind expands,the baryon bulk Lorentz factor increases as ' ( r, and the comov-ing temperature drops as T * ( r)1 (see e.g. Meszaros 2006, fora comprehensive review).1 As long as the wind remains opticallythick, the acceleration continues until the plasma reaches the satu-ration radius, rs = "r0, above which ' coasts to a value equal to thedimensionless entropy, " + L/Mc2. Here, M is the mass outflowrate.
The photospheric radius is the radius above which the flow be-comes optically thin to scattering by the baryon-related electrons.Depending on the values of the free model parameters (", L and r0),this radius can be above or below the saturation radius (see Meszaroset al. 2002). For the parameter values characterizing GRBs (see be-low), the photospheric radius is above the saturation radius, and isgiven by (Abramowicz, Novikov & Paczynski 1991; Pe’er 2008)
rph = L(T
8!mp"3c3= 5.8 # 1011L54"
)33 cm. (1)
Here and below, ( T is the Thomson cross-section, mp is the protonmass, and we use the convention Q = 10xQx in cgs units. Thehigh values of the luminosity and the Lorentz factor chosen for thedemonstration in equation (1) are for ease of comparison with theFermi results of GRB 090902B (see Section 3 below).
Above the saturation radius, adiabatic energy losses (in theabsence of dissipation) cause the temperature to drop as T =T0(rs/r))2/3. The observed temperature of photons emitted at thephotosphere is therefore
T ob = T0
!rph
rs
")2/3
= 3.6 # 105(1 + z))1 L)5/1254 "
8/33 r
1/60,8 eV, (2)
where z is the redshift. Note the very strong dependence of theobserved temperature on the asymptotic value of the Lorentz factor,": for high ", high values of the temperature are expected.
The observed photospheric thermal luminosity drops above thesaturation radius as LTh(r) = (L/2)(r/rs))2/3, the greater part of theenergy being in a kinetic form, Lk & L/2 (Meszaros & Rees 2000;Rees & Meszaros 2005).2 The non-thermal part of the spectrumresults from dissipation of the kinetic energy. Part of the dissipatedenergy goes into accelerating electrons that radiate the non-thermalspectrum. Denoting by $d the fraction of kinetic energy that is dis-sipated and by $e the fraction of dissipated energy that is converted
1 From here on, quantities measured in the comoving frame are primed,while unprimed quantities are in the observer frame.2 Note that in fact at r > rph the kinetic luminosity is slightly higher due toenergy conversion from the photons above the saturation radius. While thefull treatment will be given below, in the content of equation (3) this haslittle effect, and is omitted for clarity.
C' 2011 The Authors, MNRAS 420, 468–482Monthly Notices of the Royal Astronomical Society C' 2011 RAS

Thermal and non-thermal emission in GRBs 471
to energetic electrons, one obtains an upper limit on the ratio ofnon-thermal to thermal luminosity in the spectrum:
LobNT
LobTh
! $d$e
!rph
rs
"2/3
= 0.33 L2/354 "
)8/33 r
)2/30,8 $d,0$e,)1, (3)
where the non-equality results from the fact that the electrons donot necessarily radiate 100 per cent of their energy. Equation (3)implies an interesting result: the higher the Lorentz factor of theflow is, the more pronounced its thermal luminosity is expected tobe. This result may be very significant given recent Fermi-LATdata, which show evidence for high values of the Lorentz factors inseveral bursts. We further point out that as " increases, the saturationradius rs increases, while the photospheric radius decreases. Thus,at high enough value of " = ", + (L(T/4!mpc
3r0)1/4, rph = rs,and the ratio Lob
NT/LobTh saturates to $e$d (see Meszaros et al. 2002;
Pe’er et al. 2007, for further details). Higher value of " > ", doesnot change this result.
2.2 Initial expansion radius, photospheric radiusand Lorentz factor
As was shown by Pe’er et al. (2007), the outflow parameters, inparticular the Lorentz factor ", the initial expansion radius r0 andthe photospheric radius rph can be inferred directly from study-ing the thermal component alone (for bursts with known redshift).For completeness of the analysis, we briefly repeat here the mainarguments given by Pe’er et al. (2007).
The observed temperature of thermal photons emitted from thephotosphere is Tob " 1.48"T *(rph)/(1 + z).3 Due to Lorentz aber-ration, the ratio (F ob
Th/(T ob4)1/2 is proportional to the photosphericradius divided by the Lorentz factor:
R +!
F obTh
(T ob4
"1/2
= )(1 + z)2
dL
rph
". (4)
Here, ( is Stefan’s constant, ) is a geometrical factor of orderunity, dL is the luminosity distance and F ob
Th = LobTh/4!d2
L is theobserved thermal flux. Using the parametric dependence of rph fromequation (1) in equation (4), one obtains the asymptotic Lorentzfactor:
" =#) (1 + z)2dL
F obTh(T
2mpc3R
$1/4 !L
LobTh
"1/4
. (5)
Combining this result with the equation for the observed thermalflux, Lob
Th = (L/2)(rph/rs))2/3, one obtains the initial expansionradius:
r0 =!
dLR) (1 + z)2
" !L
2LobTh
")3/2
, (6)
and the photospheric radius:
rph =#
d5LF ob
Th(TR3
) 3(1 + z)62mpc3
$1/4 !L
LobTh
"1/4
. (7)
The values of ", r0 and rph are thus fully determined by theobserved quantities of the thermal emission, up to the uncertaintyin the luminosity ratio L/Lob
Th $ 1. Furthermore, equations (5) and(7) imply that the values of " and rph are not very sensitive to theuncertainty in this ratio.
3 For photons emitted along the line of sight, the Doppler shift is D(* =0) = 2". The numerical factor 1.48 results from angular integration.
Constraining the ratio of the total luminosity released in the ex-plosion to the luminosity emitted as thermal photons, L/Lob
Th, canmost easily be done if an independent measurement of the kineticenergy exists. Such measurements are provided by studying theemission during the afterglow phase (Wijers & Galama 1999; Frailet al. 2001; Freedman & Waxman 2001; Panaitescu & Kumar 2001;Berger, Kulkarni & Frail 2003; Bloom, Frail & Kulkarni 2003;Nysewander et al. 2009), which provides good estimates of thekinetic energy remaining after the prompt emission phase. Fortu-nately, such measurements become ubiquitous and are availablefor GRB 090902B (Cenko et al. 2011); see further discussion inSection 3 below.
Even if afterglow measurements do not exist, the luminosityratio L/Lob
Th can still be constrained indirectly, in three independentmethods. First, by fitting the non-thermal part of the spectrum, oneobtains a constraint on $d$e(L/Lob
Th) (see equation 3). Since $d$e <
1, a lower limit on L/LobTh is obtained. Secondly, variability time
measurements (if they exist) can constrain the initial expansionradius, since +t $ r0/c, which, in turn, provides an upper limit onthe ratio L/Lob
Th via equation (6). And finally, a high value of LobTh
implies that the luminosity ratio should not be high, in order toavoid an energy crisis.
2.3 Constraint on the emission radiusof the non-thermal photons
Observations of high-energy (!10 GeV) photons by Fermi, arecommonly used in the literature to constrain the Lorentz factorsof GRB outflows, using the opacity argument. We point out thoughthat the constraints set in the literature are often based on an addi-tional assumption, that is that the emission radius of the high-energyphotons, r# , is connected to the Lorentz factor via r# = 2"2c+t,where +t is the variability time of the inner engine activity. Thisassumption, while true in the internal shock model scenario, hastwo main drawbacks. First, it assumes an a priori knowledge of thevariability in the Lorentz factor, namely ," " " (this assumptiontranslates into the numerical coefficient), and secondly, it relies onan assumed knowledge of the physical variability time, +t, which isdifficult to be measured accurately.
A different approach was suggested by Zhang & Pe’er (2009):by releasing the requirement r# = 2"2c+t, it was shown that theopacity argument can be used to provide general constraints in ther# –" space. While this method does not provide directly the valueof " (or of r# ), its main advantage is that it is not sensitive tothe uncertainties mentioned above. Here, we take the argumentspresented by Zhang & Pe’er (2009) one step forward. We first usethe analysis of the thermal component to estimate the Lorentz factor". At the second step, we use the constraints found by the opacityargument in the r# –" plane to deduce a lower limit on the emissionradius of the non-thermal photons, r# .
The calculation is performed as follows. The cross-section forpair production of photon with energy -1 is the highest for in-teractions with photons of energy -2 = (mec2)2/-1. Therefore,considering the Lorentz boosting, a photon observed with energy-ob
max = 10 -obmax,10 GeV interacts mainly with photons having ener-
gies
-ob1 ! (mec
2)2"2
-max(1 + z)2= 26
(1 + z)2"2
3
%-ob
max,10
&)1MeV. (8)
This energy is about 2 orders of magnitude higher than the energyof the thermal photons (see equation 2). We therefore do not expectthe thermal photons to play a significant role in constraining the
C' 2011 The Authors, MNRAS 420, 468–482Monthly Notices of the Royal Astronomical Society C' 2011 RAS

472 A. Pe’er et al.
emission radius of the most energetic photons seen by the Fermi-LAT.
The observed spectrum above a few MeV is often modelled by asingle power law, dNob/dtobdAd-ob = f 0(-ob)). . For such a spectralfluence, the optical depth for pair production can be written as(Krolik & Pier 1991; Woods & Loeb 1995; Lithwick & Sari 2001;Zhang & Pe’er 2009)
&# # = -( .d2L
r2# (1 + z)2
f0,tobGeV
. ) 1
#(mec
2)2
-obmax
$1). !"
1 + z
"2)2.
. (9)
Here, -( . is the cross-section averaged over all angles; for flatenergy spectrum (. = 2), one obtains -( . % ( T/8 (Svensson 1987;Gupta & Zhang 2008).4 Further note that ,tob
GeV in equation (9)represents the observed time bin during which high-energy photonsare seen, and thus does not necessarily correspond directly to theuncertain physical variability time.5
For a flat energy spectrum (. = 2) observed between -min and-max ,6 the observed fluence is related to the (non-thermal) lumi-nosity via f0 = Lob
NT/4!d2L log(-max/-min). The requirement that the
optical depth to pair production of the highest energy photon seenis smaller than unity is translated into a lower limit on the emissionradius,
r# $# -( .Lob
NT,tobGeV-
obmax
4! log(-max/-min)
$1/2 1"mec2
= 3 # 1015 L1/254 ,tob
GeV,01/2
-obmax,10
1/2")1
3 cm, (10)
where log (-max /-min ) % 20 was taken. For parameters characteriz-ing GRBs seen by the LAT, the emission radius of the non-thermalphotons is about 3–4 orders of magnitude larger than the photo-spheric radius (equation 1), indicating that the observed spectrummust be emitted from (at least) two separate regions.
2.4 The observed non-thermal spectrum: additionalconstraints on the free model parameters
The dissipation at r# , regardless of its exact nature, produces apopulation of energetic electrons. The energetic electrons emit thenon-thermal part of the spectrum, by radiating their energy. Thereare three main radiative mechanisms responsible for the non-thermalemission: synchrotron emission, SSC emission and Comptonizationof the thermal photons.
In order to estimate the relative contributions of the differentemission mechanisms to the observed spectrum, we proceed in thefollowing way.
2.4.1 Electron energy loss by Comptonizationof the thermal photons
The thermal photons serve as seed photons for Compton scatteringby the energetic electrons. Their existence therefore contributes tothe high-energy part of the non-thermal spectrum.
The power emitted by Comptonization of the thermal photons (inthe Thomson regime), relative to the power emitted as synchrotronradiation, is given by the ratio of the energy density of the thermal
4 Note that this value is about twice the value presented in Lithwick & Sari(2001).5 For example, ,tob
GeV could correspond to the integrated time over severaldistinct events.6 This assumption is taken here, as it provides a good first-order approxi-mation to the observed high-energy spectrum. A more accurate calculationconsidering the exact power-law index will be used in Section 3.
photon field to the energy density in the magnetic field. At thephotosphere, the (comoving) energy density of the thermal photonsis uTh(rph) = aT *(rph)4 = (L/8!r2
s c"2)(rph/rs))8/3. Since abovethe saturation radius the energy density of the photon field dropsas uTh ( r)2, at the dissipation radius r# it is equal to uTh(r# ) =(L/8!r2
# "2c)(rph/rs))2/3. The energy density in the magnetic field
assumes a fraction $B of the comoving energy density, L/8!r2# "
2c.One therefore concludes that the ratio of the energy densities in thethermal photon and magnetic field is given by
'Y + uTh
uB
= 1$B
!rph
rs
")2/3
= 3 L)2/354 "
8/33 r
2/30,8 $)1
B,)1. (11)
It is thus clear that for parameters characterizing GRBs, the roleplayed by Comptonization of thermal photons is, at the least, com-parable to the role played by the synchrotron emission as a sourceof energy loss of the energetic electrons.
2.4.2 Synchrotron spectrum
The dissipation process is expected to produce a power-law distri-bution of energetic electrons with power-law index p ! 2.0, abovea characteristic Lorentz factor # m " $e(mp/me) = 184$e,)1.7 Com-parison of the cooling time to the dynamical time implies thatthe entire electron population is in the fast cooling regime: thecooling time is equal to the dynamical time for electrons hav-ing Lorentz factor #c = (3!mec
3"3r# )/[(T$BL(1 + Y + 'Y )] =3.5 (1 + Y + 'Y ))1 L)1
54 "33 r# ,15 $
)1B,)1. Here, Y has its usual meaning
as the ratio of SSC to synchrotron radiated power, Y + PSSC/Psyn.The peak of the synchrotron emission, -ob
m = (3/2)!"/(1 +z)(qB# 2
m/mec) = 1.5 (1+z))1L1/254 $
1/2B,)1r
)1# ,15$
2e,)1 keV, is below the
threshold energy of the Fermi-Gamma-ray Burst Monitor (GBM)detector. Here, q is the electron charge and B is the magnetic fieldat the dissipation radius. At the other end of the energy spec-trum, comparison of the cooling time to the acceleration timeprovides an estimate of the maximum Lorentz factor of the ac-celerated electrons (assuming high efficiency in the accelerationprocess), #max = [6!q/(TB(1 + Y + 'Y )]1/2. Synchrotron pho-tons emitted by these electrons are expected at energies -ob
max,syn =240 (1 + z))1 "3 (1 + Y + 'Y ))1 GeV, above the threshold energyfor pair production, and above the maximum photon energy seenso far by Fermi. These results imply that synchrotron emission isexpected to contribute to the spectrum at the entire spectral rangecovered by Fermi.
The fast cooling of the electrons imply that (i) virtually all ofthe dissipated energy given to the electrons is radiated, and (ii) forpower-law index p % 2.0, a flat energy spectrum (%F% ( %0) isexpected from synchrotron emission over the entire energy rangecovered by Fermi. Note though that a high-energy cut-off result-ing from pair production can limit the maximum observed photonenergy to values lower than -ob
max,syn (see Section 2.3 above).
2.4.3 Comptonization
There are two sources of Comptonized spectrum: Comptonizationof the thermal photons and SSC. At low energies, below the thermalpeak, Comptonization is not a significant source of photons. Hence,the spectrum below the thermal peak is dominated by synchrotron
7 If the dissipation results from shock waves crossing, this equation impliesa mildly relativistic shock Lorentz factor, 's ) 1 % 1, and is thus consistentwith the internal shock model.
C' 2011 The Authors, MNRAS 420, 468–482Monthly Notices of the Royal Astronomical Society C' 2011 RAS

Thermal and non-thermal emission in GRBs 473
emission. However, above the thermal peak, the three emissionmechanisms – synchrotron, SSC and Comptonization of the ther-mal photons – contribute in parts to the spectrum. As shown inequation (11) and is further discussed below, the relative contribu-tions of the different emission mechanisms are of the same orderof magnitude (in other words, both Y and 'Y are of the order unity).As a result, it is difficult to determine a single dominant emissionmechanism at high energies. A consequence of this is that the ob-served spectral index at high energies (at the LAT band, above thethermal peak) cannot be directly related to a power-law index of theenergetic electrons.
Comptonization of the thermal emission. Since (#mT *)/mec2 =
0.13 L)5/1254 "
5/33 r
1/60,8 $e,)1 < 1, Comptonization of the thermal emis-
sion is in the Thomson limit. The Comptonized thermal photonspectrum has characteristic breaks similar to the SSC spectrum.Since the electrons are in the fast cooling regime, the Comptonizedspectrum is expected to rise above # 2
c T ob ! T ob up to a peak at-IC,ob
Th = (4/3)# 2m(2.8T ob) % 50 (1 + z))1 L
)5/1254 "
8/33 r
1/60,8 $
2e,)1 GeV,
roughly as %F% ( %1/2 (Sari & Esin 2001). At the highest energies,photons annihilate by producing pairs, a phenomenon which canexplain the lack of detection of the 50 GeV photons so far.
SSC. The ratio of SSC to synchrotron luminosity is given by theparameter Y . For $e / $B, the value of Y can be approximated asY % ($e/$B)1/2 (Sari & Esin 2001).8 A significant high-energy non-thermal part, as is seen by the Fermi-LAT, implies (via equation 3)high value of $e, close to equipartition. However, value of $B >
10)2 as is inferred in many GRBs (see below), guarantees a valueof Y of a few at most.
The SSC spectrum rises as %F% ( %1/2 below the peak of theSSC emission, which is expected at -IC,ob
m = 2# 2m-
obm % 100(1 +
z))1L1/254 $
1/2B,)1$
4e,)1r
)1# ,15 MeV. At higher energies, the spectral shape
follows a similar power law as the synchrotron spectrum, i.e. a flatenergy spectrum is expected for p % 2.
The rise parts of both the thermal Comptonization and the SSCemission are independent of the power-law index of the acceleratedelectrons. For power-law index p ! 2.0, a flat or slightly decayingsynchrotron (energy) spectrum is expected at the entire Fermi energyrange (see Section 2.4.2 above). The combined effects of the flatsynchrotron emission with the rise of the Comptonized spectrumtherefore results in a mild increase in the total observed spectrumat high energies, above the thermal peak (see Section 3 below).Demonstration of spectral decomposition into its basic physicalingredients is presented in Appendix A.
The rising of the SSC component below &100 MeV, combinedwith the fact that the synchrotron spectrum is expected to be flat (orslightly inverted) and that Y is not expected to be much larger thana few, implies that at low energies (below the thermal peak), Comp-tonization is not expected to play a significant role. The main emis-sion mechanism below the thermal peak is therefore synchrotronemission. Since the Fermi-GBM detection range is above $ob
m , thespectrum below the thermal peak is expected to be sensitive to thepower-law index of the accelerated electrons, p. Thus, measurementof the flux at low energies can provide an indication for both thevalues of $B and of p.
Finally, we point out that the analysis carried in this section holdsonly as long as r# / rph. For r# ! rph, the effect of Comptonizationis much more complicated due to the fact that the electrons coolingtime is ( r# . Therefore, for small dissipation radius, the coolingtime is much faster than the dynamical time for all electron energies,
8 Note that if Y = Y , one obtains Y " ($B/2$e)1/2.
and # c ! 1. For such rapid cooling, additional physical phenomenathat are not considered here become important. Direct Comptonscattering of the energetic photons provide the main source of heat-ing, resulting in a quasi-steady state distribution of mildly relativis-tic electrons (Pe’er et al. 2005). Close to the photosphere, multipleCompton scattering by electrons in this quasi-steady state producesa flat energy spectrum for a large region of parameter space (Pe’eret al. 2006).
3 D E M O N S T R ATI O N O F TH E A NA LY S I SM E T H O D : G R B 0 9 0 9 0 2 B A S A C O N C R E T EEXAMPLE
The bright, long GRB 090902B, which is one of the brightest burstsobserved by LAT to date (Abdo et al. 2009a), provides an excellentexample for demonstrating our analysis method. This is because oftwo very pronounced properties of its prompt emission spectrum.First, time resolved spectral analysis reveals a significant power-law component in the LAT data (emission was observed up to 30GeV ), which is clearly distinct from the usual ‘Band’ function usedby Abdo et al. (2009a) to fit the spectrum in the sub-MeV range(Ryde et al. 2010; Zhang et al. 2011). Moreover, the fact that thehigh-energy photons were delayed with respect to the photons atthe sub-MeV peak indicates a different origin. Secondly, the ‘Band’function used in fitting the sub-MeV peak is extremely steep onboth sides [low-energy spectral slope n(-) ( -. , with . % )0.5to )0.3, and high-energy spectral slope / % )3 to )5], resultingin an unusually narrow peak. The steep spectral slopes seen in thesub-MeV range make it impossible to fit this spectrum with a modelthat contains only synchrotron and SSC.
On the other hand, both properties of the prompt spectrum fitperfectly into the framework suggested here. First, the sub-MeVpeak is naturally modelled with the thermal emission component.While a single blackbody provides a sufficient fit, and is used todeduce the values of ", r0 and rph, better fits are obtained withmulticolour blackbody, as expected from a theoretical point of view(Pe’er & Ryde 2011). Secondly, the non-thermal part (the high-energy power law which extends to lower energies) can be easilyexplained by a combination of synchrotron, SSC and Comptoniza-tion of the thermal photons. Moreover, by doing so, we deducethe physical properties in the emission sites of both the thermaland non-thermal components, hence we obtain a comprehensivephysical picture of the properties of this burst.
In the original analysis, Abdo et al. (2009a) separated the ob-served prompt emission into several time bins. The most restrictiveconstraints on the emission radius of the non-thermal photons arisein time interval (c), 9.6–13.0 s from the trigger, since in this timeinterval an 11.16- GeV photon was observed. We therefore focusour analysis on this time interval.
3.1 Analysis of the thermal component: Lorentz factor,photospheric radius and dissipation radius
In order to deduce the value of the Lorentz factor by using themethod presented in Section 2.2, one needs to fit the sub-MeVpeak with a single blackbody spectrum, and study its properties(temperature and thermal flux). While this can be done for thedata in time interval (c), since the properties of the outflow varyon a shorter time-scale (variability time of "0.1 s was observed),smearing of the blackbody spectrum is expected. The shorter thetime interval used for the fits, the higher the quality of the blackbodyfits obtained (Ryde et al. 2010; Zhang et al. 2011). On the other hand,
C' 2011 The Authors, MNRAS 420, 468–482Monthly Notices of the Royal Astronomical Society C' 2011 RAS
474 A. Pe’er et al.
shorter time intervals result in lower quality of the high-energy data,which are sparse.
We thus use time interval as short as possible to fit the narrowpeak with a single blackbody, in order to deduce the hydrodynamicsof the flow, and in particular obtain the Lorentz factor. We then usethe longer time interval [the full time interval (c)] to study theproperties of the non-thermal part of the spectrum. For the longtime interval, we fit the spectral peak with a multicolour blackbody,which, as was shown by Ryde et al. (2010), provides better fits tothe peak. Clearly, by choosing to fit the longer time interval duringwhich the values of the parameters vary, we lose an accuracy in thefits. However, we stress here that our purpose in this paper is not toprovide the best statistical fits (in terms of 02) to the data. Instead,our goal here is to prove that one can obtain an acceptable fits tothe data in the entire Fermi energy band, in the sense that the curvesplotted all fall within the ±1( error bars of the data points. By doingso, we show that we are able to provide an acceptable, completephysical interpretation to the observed data, although, necessarily,we are not able to capture many second-order effects.
For the shorter time interval we use the results presented by Rydeet al. (2010), who showed that the narrow time interval, 11.008–11.392 s from the trigger, during which the 11.16- GeV photon
is seen, provides sufficient data to analyse the sub-MeV spectralpeak. During this time interval, the sub-MeV peak can be fittedwith a single blackbody, with observed temperature Tob = 168 keV,and observed thermal flux F ob
Th = 1.96 # 10)5 erg cm)2 s)1. Equa-tion (4) thus implies a ratio R = 1.55 # 10)19 cm. At redshiftz = 1.822 (Cucchiara et al. 2009), the (isotropic-equivalent) ther-mal luminosity is Lob
Th = 4!d2LF ob
Th = 4.6 # 1053 erg s)1. Using) = 1.06 in equations (5), (6) and (7) (Pe’er et al. 2007), oneobtains " = 764 (L/Lob
Th)1/4, rph = 6.0 # 1011 (L/LobTh)1/4 cm and
r0 = 7.9 # 108 (L/2LobTh))3/2 cm.
Estimating the ratio (L/LobTh) is done in the following way. Due to
the rapid cooling of the electrons, nearly 100 per cent of the energythat is converted to the energetic electrons in the dissipation processis radiated in the form of non-thermal photons, i.e., Lob
NT " $e$dLk.Here, Lk is the energy available in kinetic form above the photo-sphere. By fitting the non-thermal part of the spectrum, one obtainsLob
NT " 0.9LobTh, or $e$d & 0.9(Lob
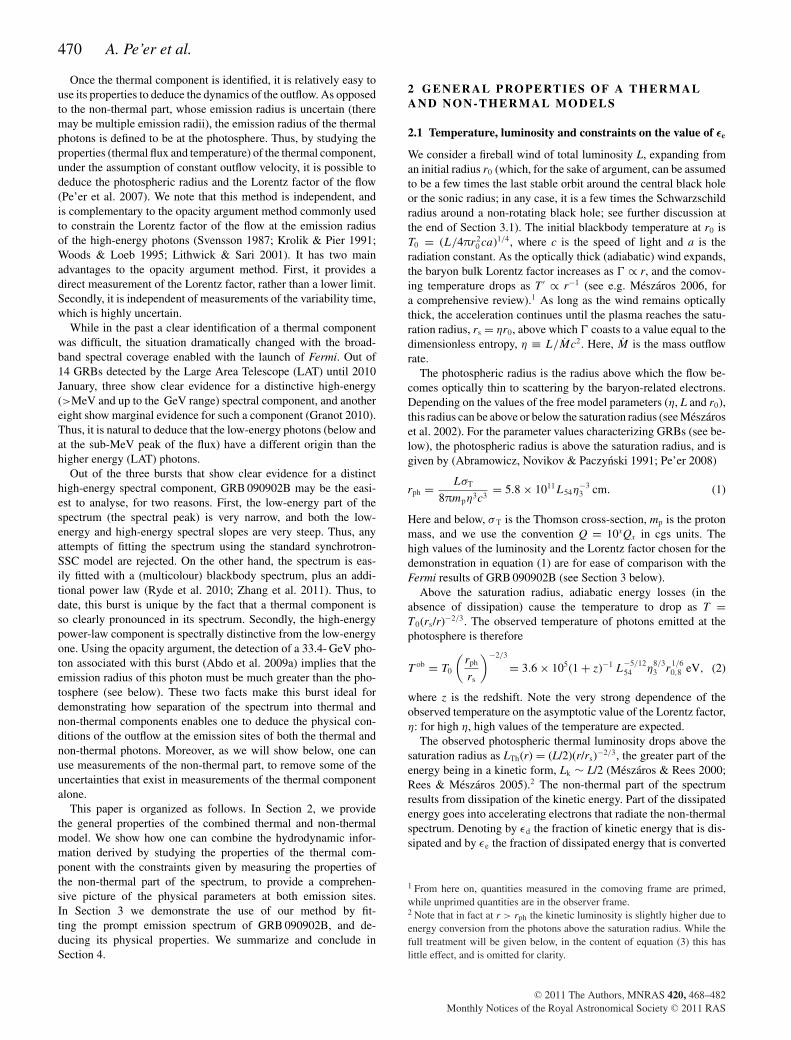
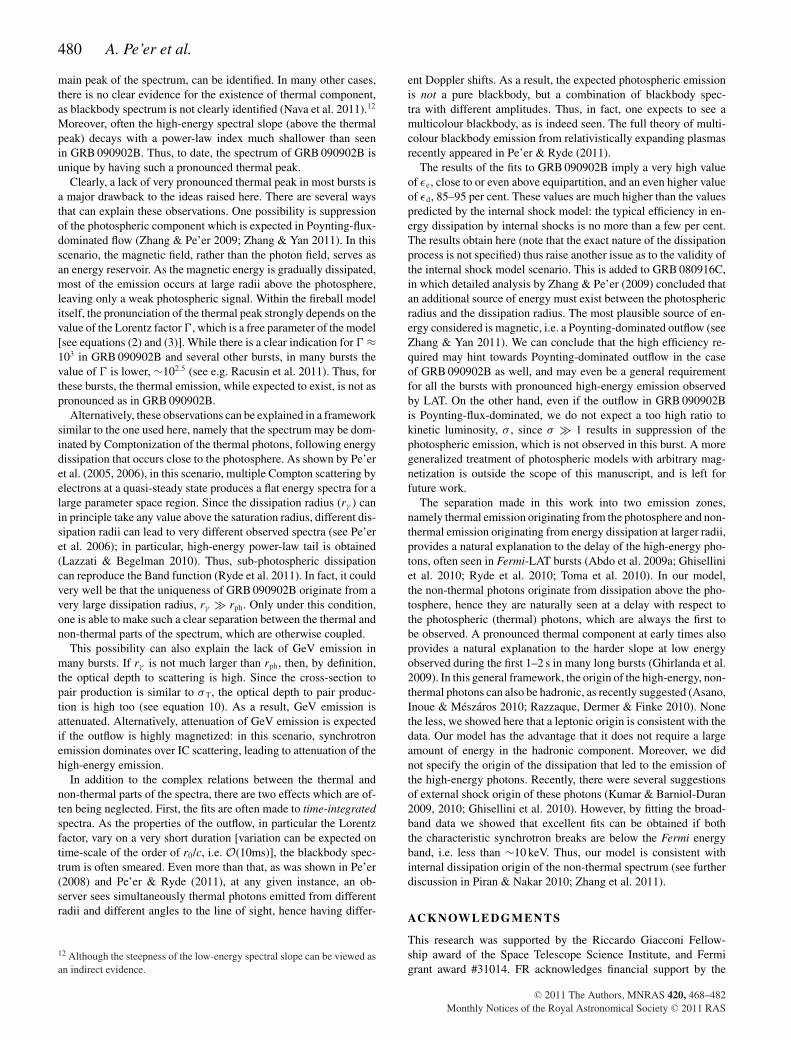
Th/Lk) (see Fig. 1). These fitsare best done using a numerical simulation, since part of the dis-sipated energy is released outside the observed energy range ofFermi. After the main dissipation, the remaining kinetic luminosity,LAG = Lk(1 ) $d), is the available luminosity for the afterglow emis-sion phase. As was found by Cenko et al. (2011), the energy released
Figure 1. The dependence of the non-thermal flux on the fraction of energy given to the electrons, $e. The data of GRB 090902B are from the NaI (0,1),BGO (0,1) and LAT (back and front) detectors at time interval (c), 9.6–13.0 s after the GBM trigger. The light yellow shaded area shows the ±1( fit to the dataat this time interval, made by Abdo et al. (2009a). Note that this area is calculated by Abdo et al. (2009a) by fitting a ‘Band’ plus a single power-law spectra,hence the apparent discrepancy between the high-energy (LAT) data points and the shaded area. In our work, the parameter values chosen are dissipation radiusr# = 1017 cm, bulk motion Lorentz factor ' = 910, power-law index of the accelerated electrons p = 2.0, GRB luminosity L = 9.2 # 1053 erg s)1 and fractionof dissipated kinetic energy $d = 0.9. Shown are the simulation results for $e = 0.5 (blue, solid line) and $e = 0.17 (dashed, green line). The & MeV peak isfitted with a (multicolour) blackbody spectrum; the non-thermal flux is linear in the value of $e.
C' 2011 The Authors, MNRAS 420, 468–482Monthly Notices of the Royal Astronomical Society C' 2011 RAS

Thermal and non-thermal emission in GRBs 475
during the afterglow phase is &5 times less than the energy releaseduring the prompt emission phase. However, since the luminosityin time interval (c) is about twice the average luminosity during theprompt phase, we estimate the luminosity (thermal+non-thermal)in time interval (c) to be about 10 times higher than the luminosityduring the afterglow phase,
LAG
LobTh + Lob
NT= Lk(1 ) $d)
LobTh + Lk$e$d
% 110
. (12)
Using $e$d & 0.9(LobTh/Lk), one obtains the relation:
$d = 91.9$e + 9
. (13)
This result immediately implies very high dissipation efficiency,since for any value of $e, $d ! 0.83.
At the photosphere, the thermal luminosity is equal to LobTh =
(L/2)(rph/rs))2/3, and the kinetic luminosity is equal to Lk =(L/2)[2 ) (rph/rs))2/3]. At larger radii, the kinetic luminosity isassumed unchanged, up until the dissipation radius. Using the ob-served relation Lob
NT/LobTh = $d$eLk/L
obTh " 0.9 and the results ob-
tained in equation (13), one obtains the luminosity ratio:
L
LobTh
" (1.19$e + 0.9)$e
. (14)
For equipartition value, $e = 0.33, one obtains L/LobTh = 3.9,
which imply " = 1070 (and $d = 0.94). However, we consider thisvalue of the Lorentz factor as an upper limit, due to two reasons:first, this result implies very high total GRB luminosity, L = 1.8 #1054 erg s)1; and secondly, using equation (6), it implies an initialexpansion radius r0 " 3.0 # 108 cm, which translates into veryshort variability time, +t = r0/c = 10 ms. Lower value of $e resultsin higher Lorentz factor, but also leads to significantly higher totalluminosity, significantly lower variability time and nearly 100 percent dissipation efficiency, which we consider unlikely.
Using the extreme value $e = 1, one obtains L/LobTh = 2.09, " =
920, $d = 0.83 and r0 " 7.4 # 108 cm, which translates into physicalvariability time +t % 25 ms. We thus conclude that the asymptoticvalue of the Lorentz factor is in the range 920 ! " ! 1070, and thevalue of $e is at or slightly above equipartition. We further deducethat the photospheric radius is rph " 7.2–8.4 # 1011 cm, and that thedissipation efficiency is $d % 85–95 per cent. Using these values of" in equation (10) leads to the conclusion that the emission radiusof the non-thermal photons is constrained, r# $ 3.5–4.1 # 1015 cm.
The derived value of r0 " 3.0–7.5 # 108 cm implies r0 " 33–80 rISCO,10, where rISCO,10 = 6 GM/c2 is the innermost stable circularorbit (ISCO) of a non-rotating 10-M0 black hole. As the exact massof the progenitor of GRB 090902B is unknown, we can deduce thatr0 is of the order of few tens of the ISCO radius. According tothe theory adopted here, r0 marks the initial expansion radius. Asthe theory of jet acceleration is not fully developed yet, the valuesobtained may thus be used to constrain models of jet accelerationto this scale. Alternatively, we note that this value is very closeto the value obtained in several numerical models (e.g. Aloy et al.2000; Zhang, Woosley & MacFadyen 2003). While in these modelsthe jets are assumed to be produced closer to the ISCO radius, theacceleration begins only at larger radii due to the fact that at smallerradii the jet is not well collimated.
3.2 Numerical calculations: further constraintson the free model parameters
As discussed in Section 2.4 above, following the dissipation pro-cess, simple analytical descriptions are insufficient to describe the
spectrum, due to the roughly similar contributions from the dif-ferent physical phenomena (synchrotron, SSC and thermal Comp-tonization), as well as the cut-off resulting from pair production.Therefore, in order to derive the spectral dependence on the differ-ent values of the free parameters, as well as confirm the analyticalcalculations presented above, we calculate numerically the photonand particle energy distribution for the different scenarios. In ourcalculations, we use the time-dependent numerical code presentedin Pe’er & Waxman (2005). This code solved self-consistentlythe kinetic equations that determine the temporal evolution of e±
and photons, describing cyclo-synchrotron emission, synchrotronself-absorption, direct and inverse Compton (IC) scattering, pairproduction and annihilation, and the evolution of high-energycascade.
This code has two great advantages, which make it ideal in thestudy of the prompt spectra. First, it has a unique integrator, whichenables solving the rate equations that govern the time evolution ofthe particles and photons energy distribution over the entire energyrange. The code is able to calculate simultaneously processes hap-pening over more than 15 orders of magnitude in time and energyranges, thereby covering the entire spectral range, from radio up tothe TeV band. The second advantage of the code is a full treatmentof the various physical process, including the full cross-sections(e.g. Klein–Nishina effect is inherently taken into account, or thatfor mildly relativistic electrons, the full cyclo-synchrotron emissionspectrum is calculated, etc.).
In modelling the spectrum in time interval (c), the sub-MeVpeak is best described as a multicolour blackbody spectrum,with varying amplitudes (Ryde et al. 2010): F ob
Th (%; Tmax) =( TmaxTmin
(dA/dT )B%(T )dT , where B%(T) = (2h/c2)%3/(eh%/T ) 1) isPlanck function. The amplitude A(T) is temperature-dependent,A(T) = A(Tmax )(Tmax /T)4)q, and is normalized such that the to-tal flux is equal to the observed flux at the spectral peak, F ob
Th =1.82 # 10)5 erg cm)2 s)1. The normalization constant q and Tmax
are determined by fitting the spectrum, Tmax = 328 keV and q =1.49. Tmin cannot be determined, and its exact value is unimportantfor the fits, as long as Tmin 1 Tmax .
While the best value for q is found by fitting the data, we notethat this multicolour description of the thermal part of the spectrumis inherent to emission from relativistically expanding plasma. Atany given instance, an observer sees simultaneously photons emittedfrom a range of radii and angles (Pe’er 2008). The Doppler boostingof photons emitted at high angles to the line of sight is smallerthan that of photons emitted on the line of sight. Therefore, a purePlanck function in the comoving frame is inevitably observed asmulticolour blackbody.
In the framework developed here, the value of q is related tothe spectral index via F% ( %q)1. This can be seen by noting thatdA/dT ( Tq)5, and hence FTh(%) (
(dT(dA/dT)B%(T) ( %q)1; the
last equality is easily obtained by replacing the integrand from Tto z = h%/T . Thus, the value of q found by fitting the data impliesspectral index F% ( %0.49. This index is significantly softer thanthe index expected for pure blackbody (F% ( %2), or from thescenario considered by Beloborodov (2010), of fixed comovingtemperature, in which F% ( %1.4. On the other hand, this indexis harder than the expected index at late times, F% ( %0 (Pe’er& Ryde 2011). At these times, off-axis emission dominates thespectra. When the spectrum is dominated by on-axis emission, inthe spherically symmetric scenario it is expected to be F% ( %1
(Lundman, Pe’er & Ryde in preparation). The fitted spectral indexis thus in between these values. We find this result encouraging,given that (i) here the fitted spectrum is integrated over a finite
C' 2011 The Authors, MNRAS 420, 468–482Monthly Notices of the Royal Astronomical Society C' 2011 RAS
476 A. Pe’er et al.
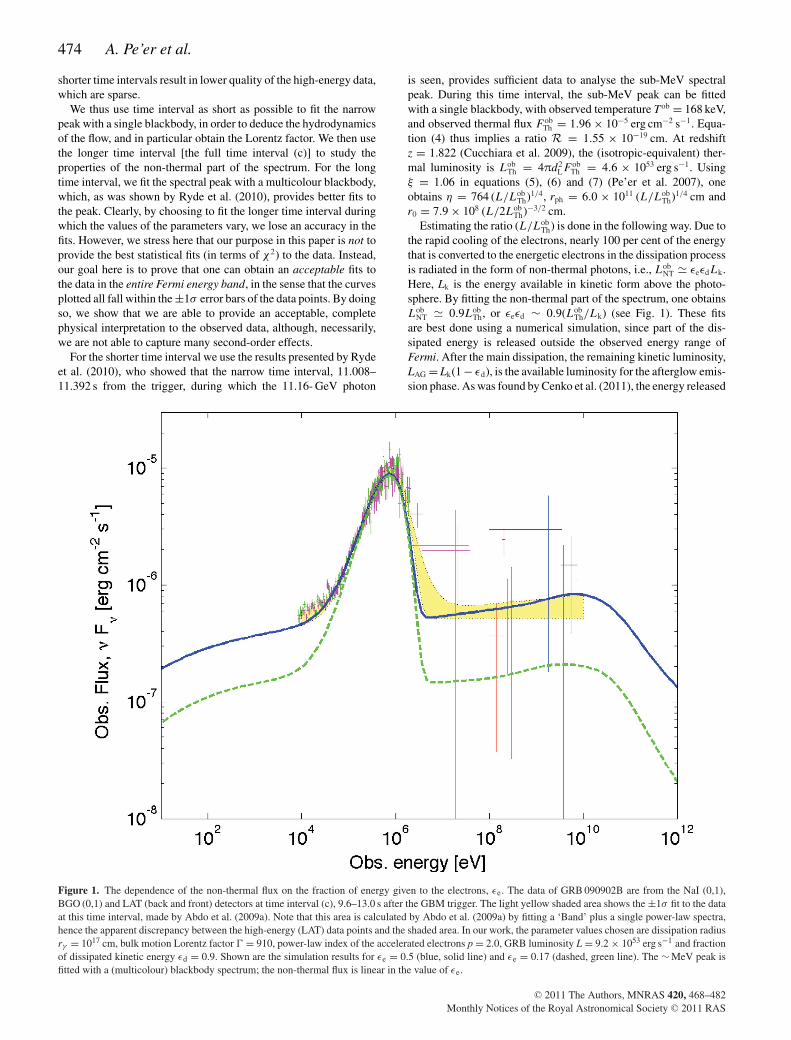
Figure 2. The dependence of the non-thermal flux on the dissipation radius, r# . We show the numerical results for dissipation occurring at r# = 1017 cm(solid, blue), 1016 cm (dashed, green), 1015.5 cm (dot–dashed, red) and 1015 cm (dotted, purple), superimposed on the Fermi data and the ±1( ‘Band’ functionfit to the data (light yellow shaded area). Values of $B = 0.33 and $e = 0.5 were chosen, apart from the fit for r# = 1016 cm, where $e = 0.4 is chosen. All theother parameters are the same as in Fig. 1. Below 1015.5 cm, pair production limits the maximum observed energy of photons to !GeV, and is thus inconsistentwith the LAT observation of 11.16- GeV photon at this time interval.
time interval, hence we average over spectra obtained at differenttimes, and (ii) the theories are developed for the ‘pure’ case ofconstant outflow Lorentz factor. Hence, the results obtained are ingood agreement with the theoretical expectations.9
In producing the spectrum, we assume that at radius r# a fraction$d of the kinetic energy is being dissipated (by an unspecified dissi-pation process). The energetic electrons, which assume a power-lawdistribution with power-law index p, carry a fraction $e of the dis-sipated energy, and the magnetic field carries a fraction $B of thisenergy. The multicolour blackbody spectra serve as backgroundspectra for all the various processes (mainly Compton scattering bythe energetic electrons, but also other processes such as e.g. pairproduction). The code tracks the evolution of the spectrum, duringthe dynamical time. Here, we present the results at the end of timeinterval (c), i.e. we assume that the processes take place during anobserved time of 3.4 s.
9 Additional broadening may result from sub-photospheric dissipation; seeRyde et al. (2011).
3.3 Numerical results
The numerical fits to the spectrum of GRB09092B at time interval(c), 9.6–13.0 s after the trigger, are presented in Figs 1–4.10 In Fig. 1,we demonstrate the linear dependence of the non-thermal flux onthe value of $e. For the fits shown in this figure, we chose parametervalues that fulfil the requirements in the previous sections and aretypical for GRBs. Thus, we chose large dissipation radius, r# =1017 cm, strong magnetic field, $B = 0.1, and electron power-lawindex p = 2.0. The Lorentz factor was chosen to be ' = 910, whichimplies L/Lob
Th = 2.0 or L = 9.2 # 1053 erg s)1. These valuesimply, via equation (14), $e = 0.5 and $d = 0.9. The fit to theFermi (GBM+LAT) data at time interval (c) appears as the solid(blue) line in Fig. 1. The fit shows the combined spectrum resultingfrom both the thermal peak (at & MeV) and the nearly flat energy
10 These can be compared to the spectra presented in fig. 3 in Abdo et al.(2009a), although note that in this work the spectrum is presented at adifferent time interval. However, the spectral shape and the main spectralfeatures (such as the ratio of the flux at the peak to the flux at &10 keV) aresimilar.
C' 2011 The Authors, MNRAS 420, 468–482Monthly Notices of the Royal Astronomical Society C' 2011 RAS

Thermal and non-thermal emission in GRBs 477
Figure 3. The dependence of the non-thermal flux on the power-law index of the accelerated electrons. On top of the Fermi data, shown are the numericalresults for p = 2.0 (solid, blue), p = 2.2 (dashed, green) and p = 2.5 (dot–dashed, red). Dissipation radius r# = 1016 cm, $e = 0.5, $B = 0.33 and all otherparameter values same as in Fig. 1 are chosen. The high-energy spectrum is nearly insensitive to the exact value of p in the range considered, 2.0–2.5. However,the low-energy part (below the thermal peak) may provide indication for 2.0 ! p ! 2.2.
spectrum (%F% ( %0) resulting from synchrotron emission fromelectrons in the fast cooling regime. We further added a scenarioin which $e is three times smaller ($e = 0.17, dashed green line),which demonstrates the linear dependence of the non-thermal fluxon the value of $e. We point out that although a power-law index p =2.0 was chosen, the combined effects of flat (%F% ( %0) synchrotronspectrum and rising (%F% ( %1/2) Comptonization spectrum lead to aslight increase in the high-energy spectral slope, which is consistentwith the slope seen with Fermi.
We further note that the fit to the Wien part of the thermal com-ponent falls slightly below the ±1( error bars of the data (theshaded, yellow areas in the figures). This discrepancy can be eas-ily understood as due to smearing of the data: the data presentedin the figures is averaged over several seconds, during which theproperties of the outflow (such as the Lorentz factor) slightly vary,while in the numerical fit we assume steady values of the physicalparameters. Variation in the parameters values inevitably lead tosmearing of the signal, which is translated to a high-energy decaywhich is somewhat shallower than the exponential cut-off of thethermal spectrum considered by the fits. Indeed, detailed analysesof time resolved spectra done by Ryde et al. (2010) and Zhang et al.(2011) show that as the time interval considered becomes shorter,the exponential decay above the thermal peak becomes more andmore pronounced, hence the (multicolour) blackbody function used
in fitting the peak becomes better the shorter the time bin is. Nonethe less, as explained above, we chose here to fit the data in the en-tire time interval (c), since reducing the time interval results in poorquality of the high-energy part of the data (the non-thermal part).We therefore find it appropriate to use the fits presented, as theyserve the main goal of this paper: to demonstrate that the physicallymotivated, hybrid (thermal+non-thermal) model provides accept-able fits, which, moreover, enable a good estimate of the physicalconditions at both emission sites.
In Fig. 2, we consider different dissipation radii: r# = 1017 cm(solid, blue), 1016 cm (dashed, green), 1015.5 cm (dot–dashed, red)and 1015 cm (dotted, purple). As the numerical code considers thefull cross-section for pair production, the numerical results aremore accurate than the analytical approximations presented in Sec-tion 2.3, and can be used to validate them. The results presentedin Fig. 2 indeed confirm the main conclusion obtained analytically,that is that the observation of the 11.16- GeV photon necessitatesthe dissipation radius to be above 1015.5 cm.
At larger radii, the high-energy non-thermal part of the spectrumis not very sensitive to the exact dissipation radius. As shown inFig. 2, for dissipation radii r# $ 1015.5 cm it is possible to obtainnumerical results which are within ±1( errors of the empirical‘Band’ fit. In order to achieve this, high value of $B and a slighttuning of the value of $e is required. Thus, for r# = 1016 cm, a value
C' 2011 The Authors, MNRAS 420, 468–482Monthly Notices of the Royal Astronomical Society C' 2011 RAS

478 A. Pe’er et al.
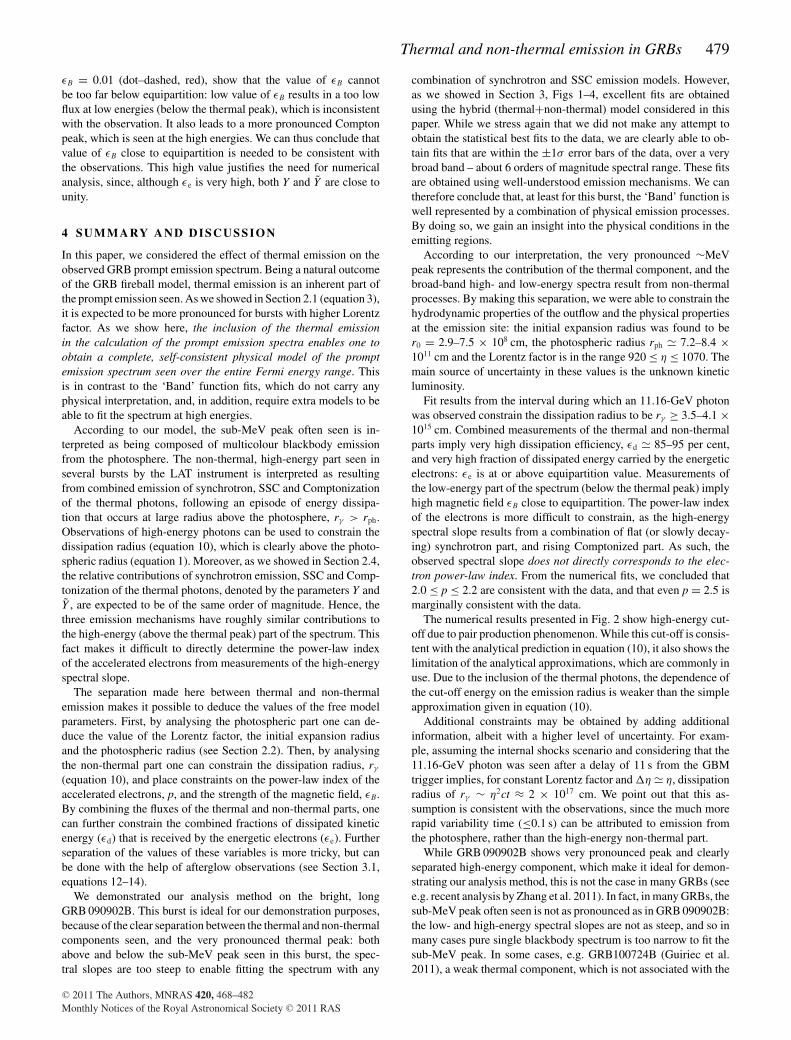
Figure 4. The dependence of the non-thermal flux on the fraction of energy carried by the magnetic field, $B. Shown are the numerical results for equipartition($B = 0.33; solid, blue), $B = 0.1 (dashed, green) and $B = 0.01 (dot–dashed, red). Dissipation radius r# = 1016 cm, $e = 0.4 and all other parameter valuessame as in Fig. 1 are chosen. While the effect of $B on the high-energy spectrum is minor, the low-energy flux (below the thermal peak) necessitates high valueof $B, close to equipartition.
of $e = 0.4 was chosen, while for the other fits in this figure, $e =0.5 was found adequate.
The numerical results show that the dependence of the pair pro-duction cut-off at high energies on r# is weaker than the analyticalapproximation presented in equation (10). The main reason for thisis the contribution from the thermal photons, which is neglected inthe derivation of equation (10). We can therefore conclude that fur-ther constraints on the dissipation radius cannot be obtained directlyfrom the prompt spectrum, without additional assumptions. Finally,we point out that the small bump obtained in the scenario of r# =1015 cm at 'mec2/(1 + z) " 150 MeV results from pair annihilationprocess, which is more pronounced at small dissipation radii due tothe more rapid production of e± pairs. Such a small bump is difficultto be observed, and indeed has not been observed so far. Moreover,since the Lorentz factor of the flow likely varies during the timeinterval considered here, it is expected to be smeared.
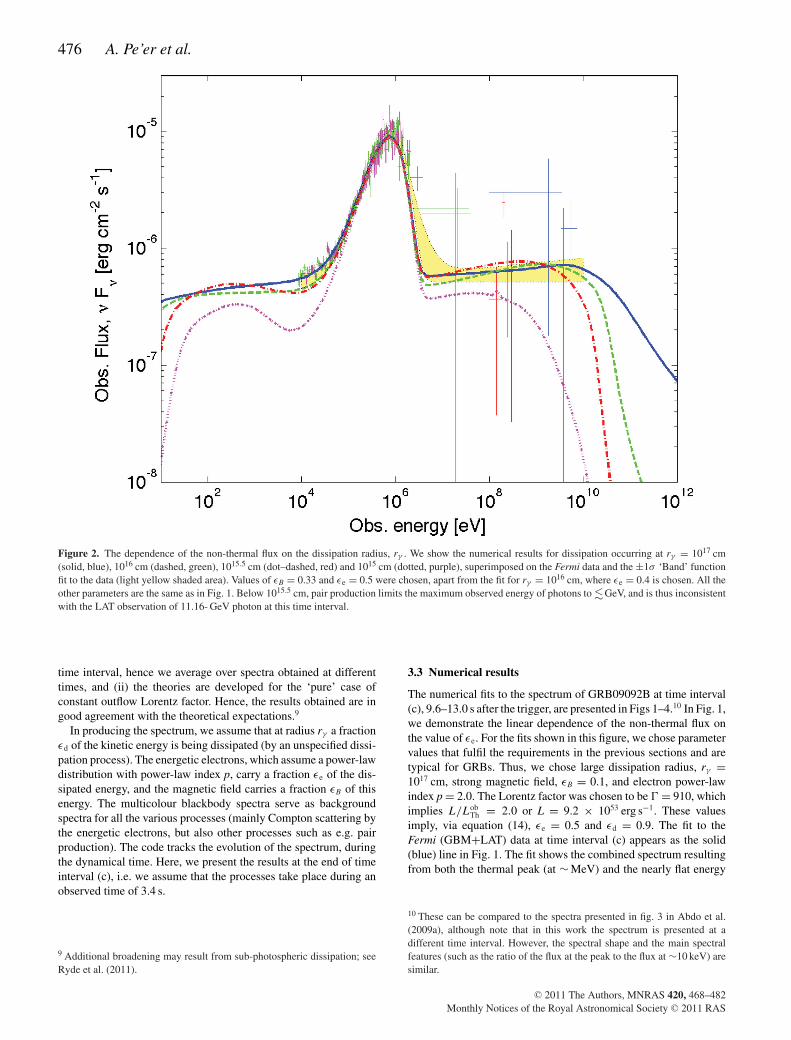
In Figs 3 and 4 we examine the dependence of the spectra on theuncertain values of the power-law index of the energetic electronsand the fraction of dissipated energy carried by the magnetic field.In Fig. 3, we consider three values of the power-law index: p = 2.0(solid, blue), p = 2.2 (dashed, green) and p = 2.5 (dot–dashed, red).As explained in Section 2.4.3 above, and is further demonstrated inAppendix A, the high-energy part of the spectrum (above the ther-mal peak) is governed by Compton scattering which is in the rising
part of the spectrum (below $ICm ), and therefore the spectrum is not
sensitive to the exact power-law index of the accelerated electrons.We thus conclude that for GRB 090902B-type bursts, for which thethermal peak is pronounced,11 observations at high energies can-not be used to constrain the power-law index of the acceleratedelectrons. On the other hand, the low-energy part of the spectrum(below the thermal peak) is dominated by synchrotron emission,and is thus sensitive to the power-law index of the electrons. Unfor-tunately, most of the effect is expected below the threshold energyof the Fermi- GBM detector, and therefore only weak observationalconstraints exist. We can therefore conclude that a power-law indexin the range 2.0 ! p ! 2.2 is consistent with the data, and even thehigher value of p = 2.5 can be consistent, however for such highpower-law index a somewhat fine tuning of the other model param-eters (in particular, very high value of $B, close to equipartition) isrequired.
Examination of the spectral dependence on the value of $B ispresented in Fig. 4. The three fits presented in this figure, equipar-tition ($B = 0.33; solid, blue), $B = 0.1 (dashed, green) and
11 Some other bursts such as e.g. GRB080916C show much less pronouncedthermal peak, hence Comptonization may play a subdominant role forGRB080916c-type bursts.
C' 2011 The Authors, MNRAS 420, 468–482Monthly Notices of the Royal Astronomical Society C' 2011 RAS
Thermal and non-thermal emission in GRBs 479
$B = 0.01 (dot–dashed, red), show that the value of $B cannotbe too far below equipartition: low value of $B results in a too lowflux at low energies (below the thermal peak), which is inconsistentwith the observation. It also leads to a more pronounced Comptonpeak, which is seen at the high energies. We can thus conclude thatvalue of $B close to equipartition is needed to be consistent withthe observations. This high value justifies the need for numericalanalysis, since, although $e is very high, both Y and Y are close tounity.
4 SU M M A RY A N D D I S C U S S I O N
In this paper, we considered the effect of thermal emission on theobserved GRB prompt emission spectrum. Being a natural outcomeof the GRB fireball model, thermal emission is an inherent part ofthe prompt emission seen. As we showed in Section 2.1 (equation 3),it is expected to be more pronounced for bursts with higher Lorentzfactor. As we show here, the inclusion of the thermal emissionin the calculation of the prompt emission spectra enables one toobtain a complete, self-consistent physical model of the promptemission spectrum seen over the entire Fermi energy range. Thisis in contrast to the ‘Band’ function fits, which do not carry anyphysical interpretation, and, in addition, require extra models to beable to fit the spectrum at high energies.
According to our model, the sub-MeV peak often seen is in-terpreted as being composed of multicolour blackbody emissionfrom the photosphere. The non-thermal, high-energy part seen inseveral bursts by the LAT instrument is interpreted as resultingfrom combined emission of synchrotron, SSC and Comptonizationof the thermal photons, following an episode of energy dissipa-tion that occurs at large radius above the photosphere, r# > rph.Observations of high-energy photons can be used to constrain thedissipation radius (equation 10), which is clearly above the photo-spheric radius (equation 1). Moreover, as we showed in Section 2.4,the relative contributions of synchrotron emission, SSC and Comp-tonization of the thermal photons, denoted by the parameters Y andY , are expected to be of the same order of magnitude. Hence, thethree emission mechanisms have roughly similar contributions tothe high-energy (above the thermal peak) part of the spectrum. Thisfact makes it difficult to directly determine the power-law indexof the accelerated electrons from measurements of the high-energyspectral slope.
The separation made here between thermal and non-thermalemission makes it possible to deduce the values of the free modelparameters. First, by analysing the photospheric part one can de-duce the value of the Lorentz factor, the initial expansion radiusand the photospheric radius (see Section 2.2). Then, by analysingthe non-thermal part one can constrain the dissipation radius, r#(equation 10), and place constraints on the power-law index of theaccelerated electrons, p, and the strength of the magnetic field, $B.By combining the fluxes of the thermal and non-thermal parts, onecan further constrain the combined fractions of dissipated kineticenergy ($d) that is received by the energetic electrons ($e). Furtherseparation of the values of these variables is more tricky, but canbe done with the help of afterglow observations (see Section 3.1,equations 12–14).
We demonstrated our analysis method on the bright, longGRB 090902B. This burst is ideal for our demonstration purposes,because of the clear separation between the thermal and non-thermalcomponents seen, and the very pronounced thermal peak: bothabove and below the sub-MeV peak seen in this burst, the spec-tral slopes are too steep to enable fitting the spectrum with any
combination of synchrotron and SSC emission models. However,as we showed in Section 3, Figs 1–4, excellent fits are obtainedusing the hybrid (thermal+non-thermal) model considered in thispaper. While we stress again that we did not make any attempt toobtain the statistical best fits to the data, we are clearly able to ob-tain fits that are within the ±1( error bars of the data, over a verybroad band – about 6 orders of magnitude spectral range. These fitsare obtained using well-understood emission mechanisms. We cantherefore conclude that, at least for this burst, the ‘Band’ function iswell represented by a combination of physical emission processes.By doing so, we gain an insight into the physical conditions in theemitting regions.
According to our interpretation, the very pronounced &MeVpeak represents the contribution of the thermal component, and thebroad-band high- and low-energy spectra result from non-thermalprocesses. By making this separation, we were able to constrain thehydrodynamic properties of the outflow and the physical propertiesat the emission site: the initial expansion radius was found to ber0 = 2.9–7.5 # 108 cm, the photospheric radius rph " 7.2–8.4 #1011 cm and the Lorentz factor is in the range 920 ! " ! 1070. Themain source of uncertainty in these values is the unknown kineticluminosity.
Fit results from the interval during which an 11.16-GeV photonwas observed constrain the dissipation radius to be r# $ 3.5–4.1 #1015 cm. Combined measurements of the thermal and non-thermalparts imply very high dissipation efficiency, $d " 85–95 per cent,and very high fraction of dissipated energy carried by the energeticelectrons: $e is at or above equipartition value. Measurements ofthe low-energy part of the spectrum (below the thermal peak) implyhigh magnetic field $B close to equipartition. The power-law indexof the electrons is more difficult to constrain, as the high-energyspectral slope results from a combination of flat (or slowly decay-ing) synchrotron part, and rising Comptonized part. As such, theobserved spectral slope does not directly corresponds to the elec-tron power-law index. From the numerical fits, we concluded that2.0 ! p ! 2.2 are consistent with the data, and that even p = 2.5 ismarginally consistent with the data.
The numerical results presented in Fig. 2 show high-energy cut-off due to pair production phenomenon. While this cut-off is consis-tent with the analytical prediction in equation (10), it also shows thelimitation of the analytical approximations, which are commonly inuse. Due to the inclusion of the thermal photons, the dependence ofthe cut-off energy on the emission radius is weaker than the simpleapproximation given in equation (10).
Additional constraints may be obtained by adding additionalinformation, albeit with a higher level of uncertainty. For exam-ple, assuming the internal shocks scenario and considering that the11.16-GeV photon was seen after a delay of 11 s from the GBMtrigger implies, for constant Lorentz factor and ," " ", dissipationradius of r# & "2ct % 2 # 1017 cm. We point out that this as-sumption is consistent with the observations, since the much morerapid variability time (!0.1 s) can be attributed to emission fromthe photosphere, rather than the high-energy non-thermal part.
While GRB 090902B shows very pronounced peak and clearlyseparated high-energy component, which make it ideal for demon-strating our analysis method, this is not the case in many GRBs (seee.g. recent analysis by Zhang et al. 2011). In fact, in many GRBs, thesub-MeV peak often seen is not as pronounced as in GRB 090902B:the low- and high-energy spectral slopes are not as steep, and so inmany cases pure single blackbody spectrum is too narrow to fit thesub-MeV peak. In some cases, e.g. GRB100724B (Guiriec et al.2011), a weak thermal component, which is not associated with the
C' 2011 The Authors, MNRAS 420, 468–482Monthly Notices of the Royal Astronomical Society C' 2011 RAS
480 A. Pe’er et al.
main peak of the spectrum, can be identified. In many other cases,there is no clear evidence for the existence of thermal component,as blackbody spectrum is not clearly identified (Nava et al. 2011).12
Moreover, often the high-energy spectral slope (above the thermalpeak) decays with a power-law index much shallower than seenin GRB 090902B. Thus, to date, the spectrum of GRB 090902B isunique by having such a pronounced thermal peak.
Clearly, a lack of very pronounced thermal peak in most bursts isa major drawback to the ideas raised here. There are several waysthat can explain these observations. One possibility is suppressionof the photospheric component which is expected in Poynting-flux-dominated flow (Zhang & Pe’er 2009; Zhang & Yan 2011). In thisscenario, the magnetic field, rather than the photon field, serves asan energy reservoir. As the magnetic energy is gradually dissipated,most of the emission occurs at large radii above the photosphere,leaving only a weak photospheric signal. Within the fireball modelitself, the pronunciation of the thermal peak strongly depends on thevalue of the Lorentz factor ', which is a free parameter of the model[see equations (2) and (3)]. While there is a clear indication for ' %103 in GRB 090902B and several other bursts, in many bursts thevalue of ' is lower, &102.5 (see e.g. Racusin et al. 2011). Thus, forthese bursts, the thermal emission, while expected to exist, is not aspronounced as in GRB 090902B.
Alternatively, these observations can be explained in a frameworksimilar to the one used here, namely that the spectrum may be dom-inated by Comptonization of the thermal photons, following energydissipation that occurs close to the photosphere. As shown by Pe’eret al. (2005, 2006), in this scenario, multiple Compton scattering byelectrons at a quasi-steady state produces a flat energy spectra for alarge parameter space region. Since the dissipation radius (r# ) canin principle take any value above the saturation radius, different dis-sipation radii can lead to very different observed spectra (see Pe’eret al. 2006); in particular, high-energy power-law tail is obtained(Lazzati & Begelman 2010). Thus, sub-photospheric dissipationcan reproduce the Band function (Ryde et al. 2011). In fact, it couldvery well be that the uniqueness of GRB 090902B originate from avery large dissipation radius, r# / rph. Only under this condition,one is able to make such a clear separation between the thermal andnon-thermal parts of the spectrum, which are otherwise coupled.
This possibility can also explain the lack of GeV emission inmany bursts. If r# is not much larger than rph, then, by definition,the optical depth to scattering is high. Since the cross-section topair production is similar to ( T, the optical depth to pair produc-tion is high too (see equation 10). As a result, GeV emission isattenuated. Alternatively, attenuation of GeV emission is expectedif the outflow is highly magnetized: in this scenario, synchrotronemission dominates over IC scattering, leading to attenuation of thehigh-energy emission.
In addition to the complex relations between the thermal andnon-thermal parts of the spectra, there are two effects which are of-ten being neglected. First, the fits are often made to time-integratedspectra. As the properties of the outflow, in particular the Lorentzfactor, vary on a very short duration [variation can be expected ontime-scale of the order of r0/c, i.e. O(10ms)], the blackbody spec-trum is often smeared. Even more than that, as was shown in Pe’er(2008) and Pe’er & Ryde (2011), at any given instance, an ob-server sees simultaneously thermal photons emitted from differentradii and different angles to the line of sight, hence having differ-
12 Although the steepness of the low-energy spectral slope can be viewed asan indirect evidence.
ent Doppler shifts. As a result, the expected photospheric emissionis not a pure blackbody, but a combination of blackbody spec-tra with different amplitudes. Thus, in fact, one expects to see amulticolour blackbody, as is indeed seen. The full theory of multi-colour blackbody emission from relativistically expanding plasmasrecently appeared in Pe’er & Ryde (2011).
The results of the fits to GRB 090902B imply a very high valueof $e, close to or even above equipartition, and an even higher valueof $d, 85–95 per cent. These values are much higher than the valuespredicted by the internal shock model: the typical efficiency in en-ergy dissipation by internal shocks is no more than a few per cent.The results obtain here (note that the exact nature of the dissipationprocess is not specified) thus raise another issue as to the validity ofthe internal shock model scenario. This is added to GRB 080916C,in which detailed analysis by Zhang & Pe’er (2009) concluded thatan additional source of energy must exist between the photosphericradius and the dissipation radius. The most plausible source of en-ergy considered is magnetic, i.e. a Poynting-dominated outflow (seeZhang & Yan 2011). We can conclude that the high efficiency re-quired may hint towards Poynting-dominated outflow in the caseof GRB 090902B as well, and may even be a general requirementfor all the bursts with pronounced high-energy emission observedby LAT. On the other hand, even if the outflow in GRB 090902Bis Poynting-flux-dominated, we do not expect a too high ratio tokinetic luminosity, ( , since ( / 1 results in suppression of thephotospheric emission, which is not observed in this burst. A moregeneralized treatment of photospheric models with arbitrary mag-netization is outside the scope of this manuscript, and is left forfuture work.
The separation made in this work into two emission zones,namely thermal emission originating from the photosphere and non-thermal emission originating from energy dissipation at larger radii,provides a natural explanation to the delay of the high-energy pho-tons, often seen in Fermi-LAT bursts (Abdo et al. 2009a; Ghiselliniet al. 2010; Ryde et al. 2010; Toma et al. 2010). In our model,the non-thermal photons originate from dissipation above the pho-tosphere, hence they are naturally seen at a delay with respect tothe photospheric (thermal) photons, which are always the first tobe observed. A pronounced thermal component at early times alsoprovides a natural explanation to the harder slope at low energyobserved during the first 1–2 s in many long bursts (Ghirlanda et al.2009). In this general framework, the origin of the high-energy, non-thermal photons can also be hadronic, as recently suggested (Asano,Inoue & Meszaros 2010; Razzaque, Dermer & Finke 2010). Nonethe less, we showed here that a leptonic origin is consistent with thedata. Our model has the advantage that it does not require a largeamount of energy in the hadronic component. Moreover, we didnot specify the origin of the dissipation that led to the emission ofthe high-energy photons. Recently, there were several suggestionsof external shock origin of these photons (Kumar & Barniol-Duran2009, 2010; Ghisellini et al. 2010). However, by fitting the broad-band data we showed that excellent fits can be obtained if boththe characteristic synchrotron breaks are below the Fermi energyband, i.e. less than &10 keV. Thus, our model is consistent withinternal dissipation origin of the non-thermal spectrum (see furtherdiscussion in Piran & Nakar 2010; Zhang et al. 2011).
ACK NOW L E DG ME NT S
This research was supported by the Riccardo Giacconi Fellow-ship award of the Space Telescope Science Institute, and Fermigrant award #31014. FR acknowledges financial support by the
C' 2011 The Authors, MNRAS 420, 468–482Monthly Notices of the Royal Astronomical Society C' 2011 RAS

Thermal and non-thermal emission in GRBs 481
Swedish National Space Board. AP wishes to thank Dale Frail,Jeremy Schnittman, Andy Fruchter, Kuntal Misra, Zeljka Bosnjak,Mario Livio and Kailash Sahu for useful discussions.
R E F E R E N C E S
Abdo A. A. et al. (The Fermi collaboration), 2009a, ApJ, 706, L138Abdo A. A. et al. (The Fermi collaboration), 2009b, Sci, 323, 1688Abramowicz M. A., Novikov I. D., Paczynski B., 1991, ApJ, 369, 175Ackermann M. et al. (The Fermi collaboration), 2010, ApJ, 617, 1178Aloy M. A., Muller E., Ibanez J., Martı J., MacFadyen A., 2000, ApJ, 531,
L119Asano K., Inoue S., Meszaros P., 2010, ApJ, 725, L121Band D. et al., 1993, ApJ, 413, 281Beloborodov A. M., 2010, MNRAS, 407, 1033Berger E., Kulkarni S. R., Frail D., 2003, ApJ, 590, 379Bloom J. S., Frail D. A., Kulkarni S. R., 2003, ApJ, 594, 674Bosnjak Z., Daigne F., Dubus G., 2009, A&A, 498, 677Cenko S. B. et al., 2011, ApJ, 732, 29Crider A. et al., 1997, ApJ, 479, L39Crider A., Liang E. P., Preece R. D., 1998, in Meegan C. A., Preece R. D.,
Koshut T. M., eds, AIP Conf. Proc. Ser. Vol. 428, Gamma-Ray Bursts,4th Hunstville Symposium. Am. Inst. Phys., New York, p. 359
Cucchiara A., Fox D. B., Tanvir N., Berger E., 2009, GRB CoordinateNetwork, 9873, 1
Daigne F., Mochkovitch R., 1998, MNRAS, 296, 275Daigne F., Mochkovitch R., 2002, MNRAS, 336, 1271Daigne F., Bosnjak Z., Dubus G., 2009, in 2009 Fermi Symposium, eConf
Proceedings C091122, preprint (arXiv:0912.3743)Eichler D., Levinson A., 2000, ApJ, 529, 146Frail D. A. et al., 2001, ApJ, 562, L55Freedman D. L., Waxman E., 2001, ApJ, 547, 922Ghirlanda G., Celotti A., Ghisellini G., 2003, A&A, 406, 879Ghirlanda G., Bosnjak Z., Ghisellini G., Tavecchio F., Firmani C., 2007,
MNRAS, 379, 73Ghirlanda G., Nava L., Ghisellini G., Celotti A., Firmani C., 2009, A&A,
496, 585Ghisellini G., Celotti A., 1999, ApJ, 511, L93Ghisellini G., Ghirlanda G., Nava L., Celotti A., 2010, MNRAS, 403, 926Giannios D., 2006, A&A, 457, 763Giannios D., Spruit H., 2005, A&A, 430, 1Granot J., 2010, in Proc. The Shocking Universe – Gamma-Ray Bursts and
High Energy Shock phenomena, preprint (arXiv:1003.2452)Guetta D., Granot J., 2003, ApJ, 585, 885Guetta D., Spada M., Waxman E., 2001, ApJ, 557, 399Guiriec S. et al., 2011, ApJ, 727, L33Gupta N., Zhang B., 2007, MNRAS, 380, 78Gupta N., Zhang B., 2008, MNRAS, 384, L11Ioka K., 2010, Prog. Theor. Phys., 124, 667Kaneko Y., Preece R. D., Briggs M. S., Paciesas W. S., Meegan C. A., Band
D. L., 2006, ApJS, 166, 298Kaneko Y., Gonzalez M. M., Preece R. D., Dingus B. L., Briggs M. S., 2008,
ApJ, 677, 1168Kobayashi S., Piran T., Sari R., 1997, ApJ, 490, 92Krolik J. H., Pier E. A., 1991, ApJ, 373, 277Kumar P., Barniol-Duran R., 2009, MNRAS, 400, L75Kumar P., Barniol-Duran R., 2010, MNRAS, 409, L226Lazzati D., Begelman M. C., 2010, ApJ, 725, 1137Lazzati D., Ghisellini G., Celotti A., 1999, ApJ, 523, L113Lazzati D., Ghisellini G., Celotti A., Rees M. J., 2000, ApJ, 529, L17Lazzati D., Morsony B. J., Begelman M. C., 2009, ApJ, 700, L47Lithwick Y., Sari R., 2001, ApJ, 555, 540Maxham A., Zhang B., 2009, ApJ, 707, 1623Medvedev M. V., 2000, ApJ, 540, 704Meszaros P., 2006, Rep. Prog. Phys., 69, 2259Meszaros P., Rees M. J., 2000, ApJ, 530, 292Meszaros P., Ramirez-Ruiz E., Rees M. J., Zhang B., 2002, ApJ, 578, 812
Mizuta A., Nagataki S., Aoi J., 2011, ApJ, 732, 26Mochkovitch R., Maitia V., Marques R., 1995, Ap&SS, 231, 441Nava L., Ghirlanda G., Ghisellini G., Celotti A., 2011, A&A, 530, A21Nysewander M., Fruchter A., Pe’er A., 2009, ApJ, 701, 824Panaitescu A., Kumar P., 2001, ApJ, 560, L49Panaitescu A., Meszaros P., 2000, ApJ, 544, L17Pe’er A., 2008, ApJ, 682, 463Pe’er A., Ryde F., 2011, ApJ, 732, 49Pe’er A., Waxman E., 2004, ApJ, 613, 448Pe’er A., Waxman E., 2005, ApJ, 628, 857Pe’er A., Zhang B., 2006, ApJ, 653, 454Pe’er A., Meszaros P., Rees M. J., 2005, ApJ, 635, 476Pe’er A., Meszaros P., Rees M. J., 2006, ApJ, 642, 995Pe’er A., Ryde F., Wijers R. A. M. J., Meszaros P., Rees M. J., 2007, ApJ,
664, L1Pilla R. P., Loeb A., 1998, ApJ, 494, L167Piran T., 2005, Rev. Mod. Phys. 76, 1143Piran T., Nakar E., 2010, ApJ, 718, L63Preece R. D., Pendleton G. N., Briggs M. S., Mallozzi R. S., Paciesas W. S.,
Band D. L., Matteson J. L., Meegan C. A., 1998a, ApJ, 496, 849Preece R. D., Briggs M. S., Mallozzi R. S., Pendleton G. N., Paciesas W. S.,
Band D. L., 1998b, ApJ, 506, L23Preece R. D., Briggs M. S., Mallozzi R. S., Pendleton G. N., Paciesas W. S.,
Band D. L., 2000, ApJS, 126, 19Preece R. D., Briggs M. S., Giblin T. W., Mallozzi R. S., Pendleton G. N.,
Paciesas W. S., Band D. L., 2002, ApJ, 581, 1248Racusin J. L. et al., 2011, ApJ, 738, 138Razzaque S., Dermer C. D., Finke J. D., 2010, Open Astron. J., 3, 150Rees M. J., Meszaros P., 1994, ApJ, 430, L93Rees M. J., Meszaros P., 2005, ApJ, 628, 847Ryde F., 2004, ApJ, 614, 827Ryde F., 2005, ApJ, 625, L95Ryde F., Pe’er A., 2009, ApJ, 702, 1211Ryde F. et al., 2010, ApJ, 709, L172Ryde F. et al., 2011, MNRAS, 415, 3693Sari R., Esin A. A., 2001, ApJ, 548, 787Sari R., Piran T., 1997a, MNRAS, 287, 110Sari R., Piran T., 1997b, ApJ, 485, 270Shemi A., 1994, MNRAS, 269, 1112Spruit H., Daigne F., Drenkhahn G., 2001, A&A, 369, 694Stern B. E., Poutanen J., 2004, MNRAS, 352, L35Svensson R., 1987, MNRAS, 227, 403Thompson C., 1994, MNRAS, 270, 480Toma K., Wu X.-F., Meszaros P., 2011, MNRAS, 415, 1663Wijers R. A. M. J., Galama T. J., 1999, ApJ, 523, 177Woods E., Loeb A., 1995, ApJ, 453, 583Zdziarski A. A., Svensson R., Paczynski B., 1991, ApJ, 366, 343Zhang B., Pe’er A., 2009, ApJ, 700, L65Zhang B., Yan H., 2011, ApJ, 726, 90Zhang W., Woosley S. E., MacFadyen A. I., 2003, ApJ, 586, 356Zhang B. et al., 2007, ApJ, 655, 989Zhang B.-B. et al., 2011, ApJ, 730, 141
A P P E N D I X A : D E C O M P O S I T I O N O F T H ESPECTRUM I NTO I TS BASI C PHYSI CALI N G R E D I E N T S
The observed spectrum results from synchrotron emission, SSC andthermalization of the thermal photons, with a high-energy cut-offresulting from pair production. As discussed in Section 3.2, thethree emission processes are expected to have similar contributionsto the observed spectrum of GRB 090902B. Therefore, a ‘clean’decomposition into the spectral ingredients, as is presented in e.g.Sari & Esin (2001), does not exist in practice.
The high-energy spectral slope (above the thermal peak) doesnot have a direct correspondence to the power-law index of the
C' 2011 The Authors, MNRAS 420, 468–482Monthly Notices of the Royal Astronomical Society C' 2011 RAS

482 A. Pe’er et al.
Figure A1. Demonstration of spectral decomposition into basic physical ingredients. The dot–dashed (red) curve shows the spectrum that would have obtainedif synchrotron radiation was the only source of emission. The dashed (green) curve shows the resulting spectrum from synchrotron and SSC, and the solid(blue) curve shows the spectrum with the full radiative ingredients (synchrotron, SSC, the thermal peak at & MeV and Comptonization of the thermal photons).Dissipation radius r# = 1016 cm, $e = 0.5, $B = 0.33, p = 2.2 and all other parameter values same as in Fig. 1 are chosen. The low-energy spectral slope (belowthe thermal peak) is mainly due to synchrotron emission, and is thus sensitive to the power-law index of the accelerated electrons. However, the high-energy part(above the thermal peak) results from all of the radiative processes, and therefore cannot be used directly to constrain the values of the free model parameters.
accelerated electrons. Therefore, a decomposition of the spectruminto the basic radiative processes can be useful in understandingthe physical processes that shape the spectrum. Fortunately, such adecomposition can (up to some level) be done numerically.
The numerical results are presented in Fig. A1, for dissipationradius r# = 1016 cm and power-law index p = 2.2. The dot–dashed(red) curve represents the spectrum that would have been ob-tained if only synchrotron emission was considered. As the coolingfrequency is low, the spectral index in the entire Fermi range is%F% ( %1)p/2 ( %)0.1. When SSC is added (dashed, green curve)the spectral slope at low energies (below %104 eV) is not affected,while the spectrum at high energies becomes nearly flat. This resultsfrom a combination of a decreasing synchrotron flux and an increas-
ing SSC flux. Note that in this scenario the flux at low energies isweaker than the flux obtained for the pure synchrotron scenario,due to the fact that part of the electron energy is converted to SSC.Finally, the solid (blue) curve shows the combined effects when allthe physical ingredients are added. Inclusion of the thermal photonsdoes not affect the low-energy spectral slope (below the thermalpeak). However, Comptonization of the thermal photons contributeto the more pronounced spectrum at high energies. In addition, theinclusion of thermal photons leads to a sharper high-energy cut-off,resulting from pair production.
This paper has been typeset from a TEX/LATEX file prepared by the author.
C' 2011 The Authors, MNRAS 420, 468–482Monthly Notices of the Royal Astronomical Society C' 2011 RAS