the connecticut department of transportation ... · expenses – up to $1b capital payment...
TRANSCRIPT

1

Outline
• STF condition – February to present
• Reasons for STF shortfall
• Short and long term problem
• Operating budget impacts
• Capital program impacts
• STF after budget actions
2

Oct/Nov 2017 STF Graph
$(45.2)
$78.8
$2.3
$(35.5)
$(99.7)
$(178.9)
$97.6
$176.4 $178.7
$143.2
$43.5
$(135.4)
$(200.0)
$(150.0)
$(100.0)
$(50.0)
$-
$50.0
$100.0
$150.0
$200.0
FY 2017 FY 2018 FY 2019 FY 2020 FY 2021 FY 2022
Mill
ion
s o
f D
olla
rs
Special Transportation Fund Projections
FY18-19 Three Year Outyear Budget Report - Feb 2017
Operating Surplus/(Deficit) Cumulative Balance
STF Forecast - February
3

Oct/Nov 2017 STF Graph
-45.2
39.5
-31.7
-108.7
-216.3
-350
97.6
137.1 105.4
-3.3
-219.6
-569.6
-700
-600
-500
-400
-300
-200
-100
0
100
200
FY 2017 FY 2018 FY 2019 FY 2020 FY 2021 FY 2022
Mill
ion
s o
f D
olla
rs
Special Transportation Fund Projections
OPM Revenue Projections (Sept 2017)
Operating Surplus/(Deficit) Cumulative Balance
STF Forecast - September
4

$(45.2)
$52.7
$(19.4)
$(52.6) $(63.3) $(62.9)
$97.6
$150.3 $130.9
$78.3
$15.0
$(47.9)
$(100.0)
$(50.0)
$-
$50.0
$100.0
$150.0
$200.0
FY 2017 FY 2018 FY 2019 FY 2020 FY 2021 FY 2022
Mill
ion
s o
f D
olla
rs
Special Transportation Fund Projections
Adopted Budget with LATEST OPM Revenue Projections
(OCT 2017)
Operating Surplus/(Deficit) Cumulative Balance
STF Forecast - October
5

$(45.2)
$4.2
$(67.6)
$(109.2) $(127.8) $(134.9)
$97.6 $101.8
$34.2
$(75.0)
$(202.8)
$(337.7)
$(400.0)
$(350.0)
$(300.0)
$(250.0)
$(200.0)
$(150.0)
$(100.0)
$(50.0)
$-
$50.0
$100.0
$150.0
FY 2017 FY 2018 FY 2019 FY 2020 FY 2021 FY 2022
Mill
ion
s o
f D
olla
rs
Special Transportation Fund Projections
Adopted Budget with OPM Rev and DOT Operating Projections
Operating Surplus/(Deficit) Cumulative Balance
STF Forecast -- November DOT Expenses forecast through June 2017
6

The major contributor to STF Total Expenditure Increases is Debt Service although DOT and Other Agency operating expenses are also growing
7

Growth in STF Expenditures FY15 – FY22
8
Description
Projected
Growth
(millions)
%
Existing Debt Service $341,032,944 74%
DOT Operating/Fringes $240,349,414 31%
Other Agencies Operating $18,404,018 23%
Let's Go CT Debt Service $139,944,933 n/a

BUDGET GROWTH FY1997 – FY2017
FY1997 FY2017 %
Operating Budget $288M $620M 215%
Capital Budget $150M $900M 600%
9

• Short Term: Inability to sell bonds • STF Bond proceeds are fully expended • Additional Bond proceeds are required to meet existing capital project
expenses – up to $1B capital payment obligations in FY18 • Current year and cumulative STF deficits prevent bond sales – Cumulative
projected deficit over $300M through 2022 so immediate operating and capital reductions are required
• Longer Term: Existing Revenue Levels insufficient to support STF • Rising Debt Service associated with past debt is eroding available STF
revenue. • Decreasing Revenue Estimates combined with Increasing Operating Costs
making the problem worse • Revenue to Debt Service coverage ratios headed lower, risking Bond Rating • Operating and Capital Reductions alone cannot solve the long term
problem
Problem Statement
10

Implement a series of operating budget cuts beginning in FY19 Significantly reduce capital program beginning in the upcoming construction season
DOT Budget Impacts without New Revenue
11

DOT Administrative Impacts • Reduction in DOT Staffing – currently 423 vacancies (14%) Highway and Bridge Impacts • Reduction in PAYGO road and bridge paving and maintenance work • Completely close Rest Areas • Reduced maintenance staff will impact service levels for snow events and routine maintenance Bus Impacts • Eliminate Non-ADA local bus service subsidies • 15% Bus Fare Increase FY 2019 • Transit District 15% Subsidy Cut FY 2019 • Transit District 50% Subsidy cut FY 2021 • Additional CMAQ subsidy for CTfastrak • 5% Bus service reduction in FY 2021
12
Operating Budget Actions

Rail Impacts • 10% Rail Fare Increase FY 2019 • 5% Rail Fare Increase FY 2021 • 5% Rail Fare Increase FY 2022 • Metro-North Non-Service Expense Reductions FY 2019 • No Weekend and Some Off-Peak Service Reductions - Danbury, Waterbury and New Canaan Rail Lines FY 2019 • 50% Reduction in Shoreline East Service FY 2019
13
Operating Budget Actions

• Fund ongoing (already awarded) construction projects • Ensure match of all federal funds • Fund ongoing phase-funded federal projects, to avoid
payback obligations • Award new projects ONLY if funded with federal funds or
essential for safety/state of good repair • Eliminate approximately $2.0 billion of $2.8 billion of
Let’s Go CT! Ramp Up authorizations • Fund core DOT projects and programs, Eliminate local/municipal funding - Reduced – Federalized LOTCIP - No local bridge projects - No STF funded Town Aid Road starting FY18
Capital Program Principles
14

Highway and Bridge
Bridge Repairs @ $25m/yr
Pavement; VIP @ $54m/yr plus Preservation @ $25m/yr
Gold Star NB Bridge(Phase 1) @ $104m
East Haddam Swing Bridge @$ 38m (in lieu of $55m rehab project)
Charter Oak Repairs @ $10m (in lieu of larger Charter Oak Bridge
Interchange project) Note: If Federal INFRA Grant is awarded, full
project will be funded
Waterbury Bridges (I-84 & CT 8) @ $180m
$10.4m/year for Equipment Procurements for the Highway and Bridge
Maintenance fleet
Capital Projects Going Forward
15

Highway and Bridge
LOTCIP: 100% State Funded in 2018, revised to STP-Urban in 2019-22 at
80/20
Local Bridge included only for projects with a fully executed agreement
Town Aid Road Payments to Municipalities – only the portion out of GO
Bonds
Facility funds for Roof Repairs
Environmental Compliance Funds for Tank Replacements and other
Mandated Activities
Funds for PE/RW/Mods, Safety Program, Guiderail, Illumination, some
Signing
Capital Projects Going Forward
16

Public Transportation
All Projects associated with the Walk Bridge Program
Hartford Line Construction (New Haven to Hartford)
Locomotive Overhauls
60 M8 rail cars for New Haven Line to address ridership growth
16 New Coaches for Hartford Line to replace leased equipment
SAGA Bridge Repairs
New Haven Line Signal System Replacement
New Haven Line Network Infrastructure
New Haven Rail Yard Projects
Waterbury Branch Signalization
Capital Projects Going Forward
17

Generally
100% state funded projects will be reviewed for suspension or deferral (unless
required to maintain base state of good repair) – this includes many Let’s Go CT
Ramp Up projects, FIF-Road and FIF-Bridge projects, as well as many 100% state
funded Public Trans projects.
Limit Design work and Rights-of-way acquisitions for 100% state funded
Construction projects – this will likely mean stopping existing Consultant Design
agreements. Some additional expenses will be necessary to bring design to logical
stopping point.
5 Year Impact: $4.3 Billion of Engineering, Construction and Public
Transportation projects would not be done.
Impact to date: $100M of construction projects will not be done this year
Capital Projects Under Review for Suspension or Deferral
18

Highway and Bridge
• State Bridges currently rated in fair condition, excluded @ $77m
• Hartford Interchange 29 @ Charter Oak Bridge (unless Federal grant approved)
• Woodbridge CT 15 West Rock (Heroes) Tunnel
• Norwalk 7/15 Interchange
• Hartford I-84 Viaduct
• Middletown Route 9 Signals/Bridges
• Waterbury 8/84 Interchange (Mixmaster)
• West Hartford, I-84 Construct Operational Lanes EB & WB
• I-95 Widening between Stamford to Bridgeport
• I-95 Widening from the Baldwin Bridge to the Gold Star Bridge
• Danbury, Reconstruct I-84 between Exits 3 & 8
• Gold Star Bridge NB (Phase 2)
• Maintenance Facility Rehabs and Replacements
• Renovate District 1 HQ Building in Rocky Hill
• Salt Shed Roof replacements and wetland remediation
19

Highway and Bridge
• Town Aid Road Payments to Municipalities - portion from STO Bonds
• Local Bridge projects without a fully executed agreement
• Pavement; VIP underfunded by $21m/yr and Preservation by $25 m/yr
• Signing Preservation (underfunded by $15m/year)
• Community Connectivity Program
• Expanded Trail/Alternative Mobility Program
• Innovative Bridge Program
• Minimally Funded Miscellaneous Needs: Emergency Projects, Construction Claims,
Asset Management , MS-4 Compliance, Alternative Contracting Expansion
• Highways Over-programming (approximately $500m). Projects included in Over-
programming may advance if other projects, on the Go List are delayed, leaving a hole
in the federal program.
20
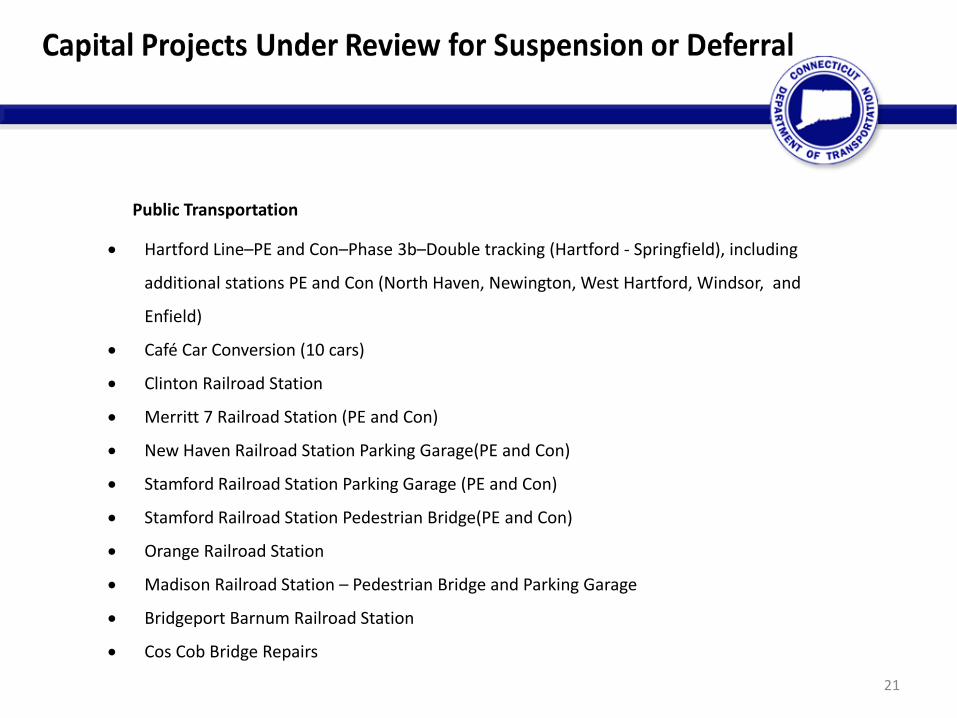
Public Transportation
Hartford Line–PE and Con–Phase 3b–Double tracking (Hartford - Springfield), including
additional stations PE and Con (North Haven, Newington, West Hartford, Windsor, and
Enfield)
Café Car Conversion (10 cars)
Clinton Railroad Station
Merritt 7 Railroad Station (PE and Con)
New Haven Railroad Station Parking Garage(PE and Con)
Stamford Railroad Station Parking Garage (PE and Con)
Stamford Railroad Station Pedestrian Bridge(PE and Con)
Orange Railroad Station
Madison Railroad Station – Pedestrian Bridge and Parking Garage
Bridgeport Barnum Railroad Station
Cos Cob Bridge Repairs
21

Public Transportation
New Canaan Branch Improvements
New Haven Line Customer Service Initiative
New Haven Line – Rail Maintenance Facility Improvements
Replacement of Rail Cars on Shore Line East, Waterbury and Danbury Lines
Off System Bridge Repairs
Middletown Swing Bridge Repairs
Greater New Haven Transit District (GNHTD) New Maintenance Facility
Estuary TD New Maintenance Facility
Norwalk TD Facility Improvements
Greater Hartford Transit District (GHTD)- Union Station Improvements
Greater Bridgeport Transit Authority (GBTA) – Facility Improvements
Bus Service Expansion Fleet
22

$(45.2)
$46.4
$7.5
$(41.1) $(34.7) $(29.3)
$97.6
$144.0 $151.5
$110.4
$75.7 $46.4
$(100.0)
$(50.0)
$-
$50.0
$100.0
$150.0
$200.0
FY 2017 FY 2018 FY 2019 FY 2020 FY 2021 FY 2022
Mill
ion
s o
f D
olla
rs
Special Transportation Fund Projections
Based on Table 8 including Expenditure Reductions (Dec 2017)
Operating Surplus/(Deficit) Cumulative Balance
STF Forecast – December 2017
23

REVENUE
24

CT Gas Tax History
25
• Gas tax reduced from 39 cents to 25 cents starting in 1997
• 20 years with no increases
• If gas tax was indexed to inflation, current gas tax would be 39
cents today

$-
$100,000,000
$200,000,000
$300,000,000
$400,000,000
$500,000,000
$600,000,000
$700,000,000
$800,000,000
FY97
FY98
FY99
FY00
FY01
FY02
FY03
FY04
FY05
FY06
FY07
FY08
FY09
FY10
FY11
FY12
FY13
FY14
FY15
FY16
FY17
Motor Fuels - actual revenues "Lost" revenue
STF – Lost Motor Fuel Tax Revenue from gas tax cut $3.6 Billion (in red)
26
CT Gas Tax History

State Motor Fuel Tax Tolls • Connecticut: 25 cents NO • Massachusetts: 24 cents YES
• New Jersey: 37.1 cents YES
• Rhode Island: 34 cents YES
• New York: 24.2 cents YES
27
Gas Tax/Tolls - Regional Comparison

Gas Tax vs. Rail and Bus Fares
Rail Bus Motor Fuels
Calendar Year Fare increase Index Fare increase Index Tax Increase/ (Decrease) Tax Index
2000 100.000 100.000 -21.88% $0.25 100.000
2001 100.000 100.000 $0.25 100.000
2002 100.000 100.000 $0.25 100.000
2003 15.00% 115.000 100.000 $0.25 100.000
2004 115.000 10.00% 110.000 $0.25 100.000
2005 5.50% 121.325 13.64% 125.000 $0.25 100.000
2006 121.325 125.000 $0.25 100.000
2007 121.325 125.000 $0.25 100.000
2008 121.325 125.000 $0.25 100.000
2009 121.325 125.000 $0.25 100.000
2010 121.325 125.000 $0.25 100.000
2011 121.325 125.000 $0.25 100.000
2012 5.25% * 127.695 4.00% 130.000 $0.25 100.000
2013 5.00% * 134.079 130.000 $0.25 100.000
2014 5.00% * 140.783 15.38% 150.000 $0.25 100.000
2015 1.00% * 142.191 150.000 $0.25 100.000
2016 6.00% * 150.723 16.67% 175.000 $0.25 100.000
2017 1.00% * 152.230 175.000 $0.25 100.000
2018 1.00% * 153.752 175.000 $0.25 100.000
2018 20.00% 184.502 13.80% 199.150 $0.25 100.000
1992 – 2018 Change 53.8% 75.0% 0.0%
1992 – 2020 Change 84.5% 99.2% 0.0%
28

Connecticut Household Expenditures
29
$15.14
$153.61
$151.26
$153.21
$42.00
$362.00
$0 $100 $200 $300 $400
Road and TransitImprovements
Television and Internet
Electricity and Gas
Cell Phone Services
Bus Fare
Rail Fare
Average Monthly Expenses

Sales Tax Dedication
• 2015 Legislative session
– Oil Companies Tax directed to Special Transportation Fund
– Sales tax dedication (estimated)
• FY2016 0.3% $109.0M
• FY2017 0.4% $194.5M
• FY2018 0.5% $340.1M
– Actual revenues less than forecast
30

New Car Sales Tax
• Included in Biennial Budget starting in 2021
– 2021 $66.9
– 2022 $145.6
– 2023 $220.5
– 2024 $300.0
31

TOLLS?
• No authorization for DOT regarding tolls.
• Estimates done for Finance Panel for statewide interstate and major limited access highways (Routes 2, 3, 8, 9)
• Implementation 4-5 years after authorization to proceed.
• Revenue could yield $750 million/year
32

WHAT’S NEXT
• Governor Malloy will propose a plan for the STF by the end of January
• Legislature in session February 7
• Commission on Fiscal Stability and Economic Growth report to Legislature by March 1
• Lock Box – November 2018
33

THE END
34