the condition of corporate taxation in the oecd in a … · the condition of corporate taxation in...
TRANSCRIPT

The condition of corporate taxation inthe OECD in a wider context
Simon Loretz∗
June 2008
(Draft version, Comments welcome)
Abstract
Against the background of increased globalisation statutory corporatetax rates showed a clear downward trend over the last two decades. Thesharp decline in the corporate statutory tax rates was accompanied by abroadening of the corporate tax base which partly offsets the downwardtrend. However, examining measures of effective tax rate which take intoaccount the base broadening, overall there is a significant reduction ofthe corporate tax burden. This is widely seen as evidence for tax competi-tion, however, tax revenues from corporate taxation remained fairly stable,which is at odds with the standard tax competition models. This papertherefore puts corporate taxation in the OECD into a wider context andanalyses the development of the corporate tax systems as part of the over-all tax system. This more holistic view allows to gain some new insightsto the state of corporate taxation relative to the two other sources of taxrevenues, personal income and consumption. Against the background ofpersonal tax rates falling at a slower pace the relatively stable corporatetax revenues could come at the expense of personal income tax revenues.
JEL classification: H25Keywords: Corporate Taxation; OECD: Tax Competition
∗Oxford University Centre for Business Taxation; Park End Street, OX1 1HP Oxford, Eng-land, e-mail: [email protected]
1 Introduction
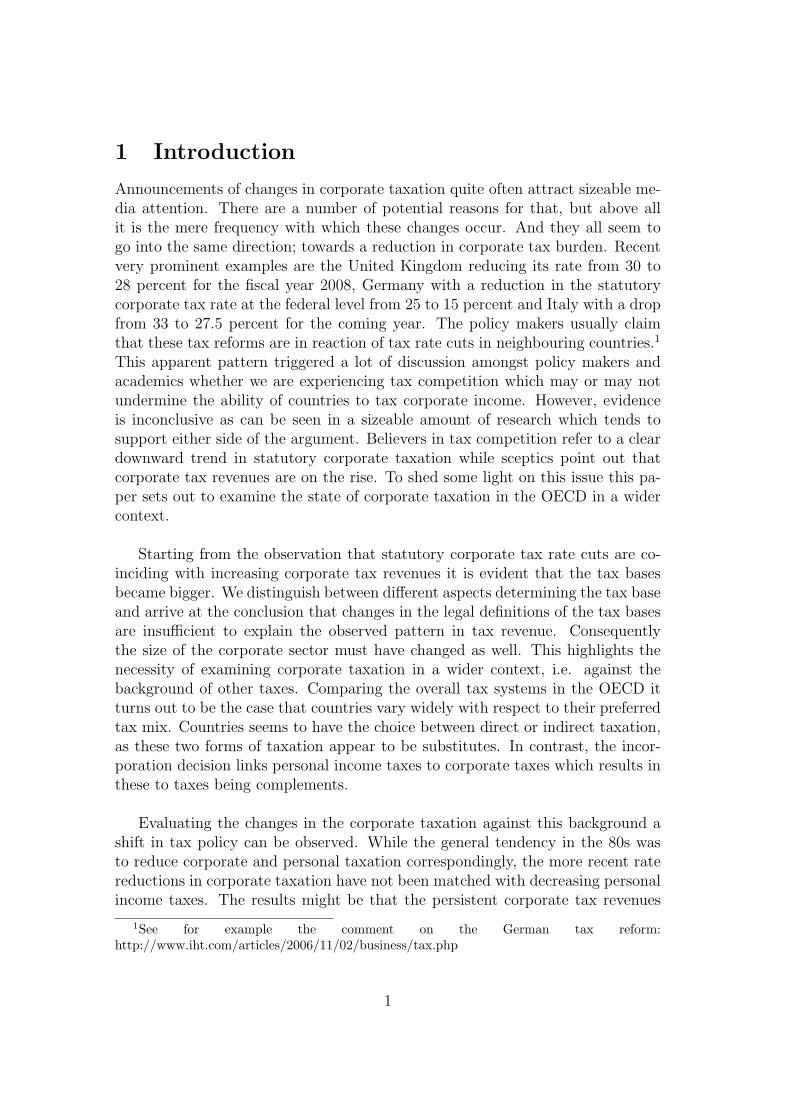
Announcements of changes in corporate taxation quite often attract sizeable me-dia attention. There are a number of potential reasons for that, but above allit is the mere frequency with which these changes occur. And they all seem togo into the same direction; towards a reduction in corporate tax burden. Recentvery prominent examples are the United Kingdom reducing its rate from 30 to28 percent for the fiscal year 2008, Germany with a reduction in the statutorycorporate tax rate at the federal level from 25 to 15 percent and Italy with a dropfrom 33 to 27.5 percent for the coming year. The policy makers usually claimthat these tax reforms are in reaction of tax rate cuts in neighbouring countries.1
This apparent pattern triggered a lot of discussion amongst policy makers andacademics whether we are experiencing tax competition which may or may notundermine the ability of countries to tax corporate income. However, evidenceis inconclusive as can be seen in a sizeable amount of research which tends tosupport either side of the argument. Believers in tax competition refer to a cleardownward trend in statutory corporate taxation while sceptics point out thatcorporate tax revenues are on the rise. To shed some light on this issue this pa-per sets out to examine the state of corporate taxation in the OECD in a widercontext.
Starting from the observation that statutory corporate tax rate cuts are co-inciding with increasing corporate tax revenues it is evident that the tax basesbecame bigger. We distinguish between different aspects determining the tax baseand arrive at the conclusion that changes in the legal definitions of the tax basesare insufficient to explain the observed pattern in tax revenue. Consequentlythe size of the corporate sector must have changed as well. This highlights thenecessity of examining corporate taxation in a wider context, i.e. against thebackground of other taxes. Comparing the overall tax systems in the OECD itturns out to be the case that countries vary widely with respect to their preferredtax mix. Countries seems to have the choice between direct or indirect taxation,as these two forms of taxation appear to be substitutes. In contrast, the incor-poration decision links personal income taxes to corporate taxes which results inthese to taxes being complements.
Evaluating the changes in the corporate taxation against this background ashift in tax policy can be observed. While the general tendency in the 80s wasto reduce corporate and personal taxation correspondingly, the more recent ratereductions in corporate taxation have not been matched with decreasing personalincome taxes. The results might be that the persistent corporate tax revenues
1See for example the comment on the German tax reform:http://www.iht.com/articles/2006/11/02/business/tax.php
1

come at least partly at the expense of personal income tax revenues.
The rest of the paper is organized as follows. Section 2 describes the trends incorporate taxation. Section 3 embeds this developments in a wider context andSection 4 re-evaluates the trends against this background. Section 5 concludes.
2 Stylized Facts in Corporate Taxation
This section starts with the well documented trend of falling statutory corpo-rate tax rates and relates them to the corporate tax revenues.2 The increasingdivergence between this two trends suggest that there are substantial changes inthe corporate tax base. In line with Devereux, Griffith and Klemm (2002) weexamine to which extent this divergence can be attributed to the changes in thelegal definition of the corporate tax base.
2.1 Trends in Tax Rates and Revenues
For the purpose of this study we define the statutory corporate tax rate as thetop statutory tax rate including local profit taxes. If the latter can be deductedfrom the tax base this is also accounted for. Even with the inclusion of local profittaxes, literally all countries in the OECD have reduced their statutory corporatetax rate in the last 25 years.3 It is therefore given, that the unweighted averageof statutory corporate tax rates in the OECD, as displayed through the black linein Figure 1, shows a clear downward pattern. Between 1982 and 2007 the ratesdropped from an average of 47.6 percent to 27.6 percent.4 The reduction seemsto be fairly constant over time apart from a small period between 1992 and 1997where the tax rates remained stable.
To further reinforce the point of falling corporate tax rates, Figure 1 also in-cludes the GDP weighted average of the statutory rates represented through thegrey line. This measure shows a somewhat more moderate decline, but neverthe-less drops from 50.7 percent to 35.8 percent. The difference in the speed of thedecline reflects the fact that smaller countries were behaving differently in cutting
2There is an increasing literature investigating the trends in corporate taxation, rangingfrom early contribution of Chennells and Griffith (1997) to very recent contribution of Devereux(2007).
3The only exception in our dataset is Ireland, as we use the preferential tax rate of 10 percentapplicable for the manufacturing sector for the years prior to 2003 when the corporate tax ratein general was lowered to 12.5 percent and the preferential treatment was abolished.
4Note that our sample changes, as the Eastern European countries (Poland, Hungary, CzechRepublic, Slovak Republic and Turkey) are included only from 1991 onwards. However, theresults are fairly robust to the exclusion of these countries. Alternative graphs are availablefrom the author upon request.
2

Corporate Tax Rates 1982-2007
20.0
25.0
30.0
35.0
40.0
45.0
50.0
55.0
1982 1983 1984 1985 1986 1987 1988 1989 1990 1991 1992 1993 1994 1995 1996 1997 1998 1999 2000 2001 2002 2003 2004 2005 2006 2007
Stat
utor
y C
orpo
rate
Tax
Rat
esunweighted average weighted average
Figure 1: Trend in statutory corporate tax rates (1982-2007)
the corporate tax rates. The weighted average corporate tax rate is higher thanthe unweighted average for most of the time, which mirrors that smaller countriestend to have lower tax rates. Only in 1987 the weighted average drops below theunweighted average which can be linked to the 1986 tax reform in the UnitedStates. Ever since that smaller countries display a more aggressive behaviour incutting statutory corporate tax rates.
These developments have been frequently interpreted as evidence for corpo-rate tax competition. However, at the same time some economists using backwardlooking tax rates, i.e. measures based on actual tax payments, found weak or noevidence for a downward trend.5 It seems therefore natural to analyse the trendsin actual corporate tax payments as well. To this extent Figure 2 displays theshare of corporate tax revenues in percent of the gross domestic product. Theblack line describes the development of the unweighted average of the corporatetax revenues. Between 1982 and 2005 the corporate tax revenues showed an in-crease from 2.5 percent of GDP to 3.7 percent.6 It becomes evident that thedownward trend in the tax rates is not reflected in the tax revenues. In contrast,
5See Devereux and Loretz (2008) for a discussion about the empirical evidence of corporatetax competition.
6Again, the sample is not constant over time, as the Czech Republic (1993), Hungary (1991),Poland (1991), Portugal (1989), the Slovak Republic (1998) and Turkey (1991) are only includedin the latter years. Further Mexico is not part of the sample, as it reports no separate statisticfor corporate income tax revenues.
3
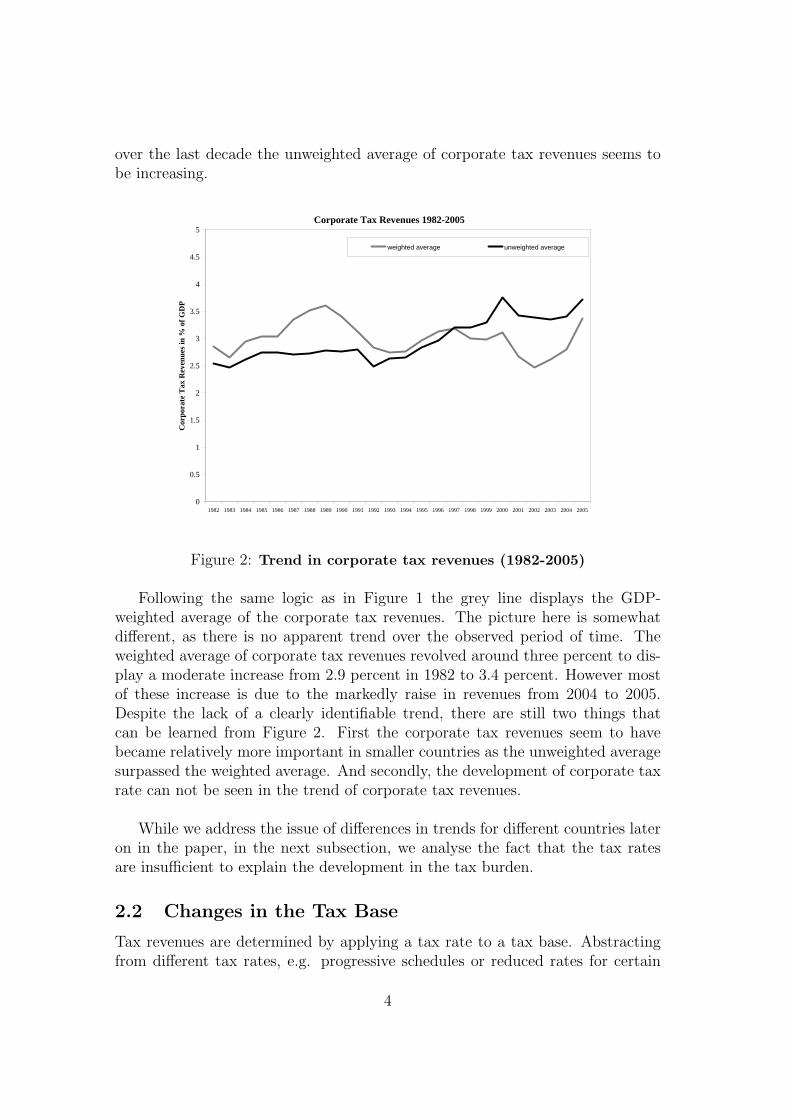
over the last decade the unweighted average of corporate tax revenues seems tobe increasing.
Corporate Tax Revenues 1982-2005
0
0.5
1
1.5
2
2.5
3
3.5
4
4.5
5
1982 1983 1984 1985 1986 1987 1988 1989 1990 1991 1992 1993 1994 1995 1996 1997 1998 1999 2000 2001 2002 2003 2004 2005
Cor
pora
te T
ax R
even
ues i
n %
of G
DP
weighted average unweighted average
Figure 2: Trend in corporate tax revenues (1982-2005)
Following the same logic as in Figure 1 the grey line displays the GDP-weighted average of the corporate tax revenues. The picture here is somewhatdifferent, as there is no apparent trend over the observed period of time. Theweighted average of corporate tax revenues revolved around three percent to dis-play a moderate increase from 2.9 percent in 1982 to 3.4 percent. However mostof these increase is due to the markedly raise in revenues from 2004 to 2005.Despite the lack of a clearly identifiable trend, there are still two things thatcan be learned from Figure 2. First the corporate tax revenues seem to havebecame relatively more important in smaller countries as the unweighted averagesurpassed the weighted average. And secondly, the development of corporate taxrate can not be seen in the trend of corporate tax revenues.
While we address the issue of differences in trends for different countries lateron in the paper, in the next subsection, we analyse the fact that the tax ratesare insufficient to explain the development in the tax burden.
2.2 Changes in the Tax Base
Tax revenues are determined by applying a tax rate to a tax base. Abstractingfrom different tax rates, e.g. progressive schedules or reduced rates for certain
4

industries, the tax base must have been subject to change to explain the differ-ences between Figure 1 and Figure 2. It is therefore useful to have a closer lookat the corporate tax base. At a very abstract level, the corporate tax base changebecause of two reasons; on the one hand, because a different number of taxpayersis subject to corporate income tax and on the other hand, because the corporatetax payers have a different average tax base. The latter can further be split intotwo determinants, namely the corporate profits and the allowed tax deductions.While it proofs to be very difficult to get reliable information about the number ofcorporate tax payers and their average profits, economists established a shortcutto measure the legal definition of the tax deductions.7
In line with the cost of capital literature we approximate the tax base defini-tion through the net present value (NPV) of capital allowances.8 As the capitalallowances vary across different kind of assets, it would be ideal to include a largenumber of different assets. However, as not all countries explicitly lay down le-gal provision for the each individual type of assets, we restrict ourselves to twomain categories; industrial buildings and general plant and machinery. Figure 3displays the trend of the NPV of depreciation allowances over the period 1982 to2007. In doing so, the results in the graph equally weigh the NPVs for industrialbuildings and plant and machinery.9 The definition of the variable in the graphis such, that a drop in the NPV represents a widening of the corporate tax base.
In contrast with the previous graphs the inclusion of more countries over timewould bias the result. Therefore Figure 3 distinguishes between two samples; theOECD19 sample which is unchanged over the whole period and the OECD30sample which gradually fills up including the newer OECD members, most no-tably the Eastern European countries.10 The most obvious pattern in the taxbase is the significant drop in the depreciation allowances in the late 80s. Forthe smaller sample this continued into the early 90s, before it remains stable overthe last fifteen years. Overall the value dropped from an unweighted average of64.4 percent to 55.1 percent. In contrast, adding new countries to the sample,temporarily reverses the trend in the early 90s. This reflects that some of thenewly added countries, most notably Turkey, had very generous tax allowancesat the time. However, ever since 1993 the trend of the NPV has been downwardand the OECD30 sample drops further to an unweighted average of 53.9 percent.
7See de Mooij and Nicodeme (2007a and 2007b) for studies on the number of firms incorpo-rating themselves because of tax reasons.
8This approach dates back to at least Jorgensen (1963) and Hall and Jorgensen (1967).9The calculations are using the assumptions of Devereux, Griffith and Klemm (2002), i.e. a
real discount rate of 10 percent and a fixed inflation rate of 3.5 percent.10The following countries enter the sample only after the year in brackets: Denmark (1985),
Czech Republic, Luxembourg, New Zealand, Hungary, Slovak Republic and Turkey (1990),Iceland and Poland (1991), Mexico (1994) Korea (1995)
5

NPV of depreciation allowances 1982-2007
50%
55%
60%
65%
70%
75%
1982 1983 1984 1985 1986 1987 1988 1989 1990 1991 1992 1993 1994 1995 1996 1997 1998 1999 2000 2001 2002 2003 2004 2005 2006 2007
Net
pre
sent
val
ue o
f cap
ital a
llow
ance
sNPV(OECD19) NPV(OECD30)
Figure 3: Trend in corporate tax base (1982-2007)
This reflects that most of the Eastern European countries systematically reducedtax incentives in form of extra allowances or very generous depreciation rates.
The reduction in capital allowances in Figure 3 signifys a broadening of thecorporate tax base, which potentially can explain the divergence between thetrends in statutory tax rates and tax revenues. To get a better understandingwhether this tax base broadening was large enough to explain the stable or evenincreasing tax revenues we combine the statutory rates with the NPV of thecapital allowances into measures of the effective tax burden. The economic lit-erature introduces two measures for this purpose; the effective marginal tax rate(EMTR), which measures the tax burden for an investment earning just the costof an alternative investment and the effective average tax rate (EATR), measur-ing the tax burden for an inframarginal investment project with a real economicrent.11 Figure 4 displays the trend for both measures of effective tax rates.
The left part of Figure 4 displays the development of the EMTR between1982 and 2007, while the right part shows the trend for the EATR over the sameperiod. Again, following the same logic as in the previous Figure, we distinguishbetween the small unchanged sample of 19 OECD countries and the larger sam-ple which is filling up over time. At first sight both graphs seem remarkably
11We assume a real economic rent of 20 percent, and equally weight the effective tax rates foran investment in buildings and machinery. Further we assume the the investment is financedthrough retained earnings.
6

Effective marginal tax rates 1982-2007
20%
25%
30%
35%
40%
45%
50%
1982 1983 1984 1985 1986 1987 1988 1989 1990 1991 1992 1993 1994 1995 1996 1997 1998 1999 2000 2001 2002 2003 2004 2005 2006 2007
unw
eigh
ted
aver
age
of E
MT
R
EMTR(OECD19) EMTR(OECD30)
Effective average tax rates 1982-2007
20%
25%
30%
35%
40%
45%
50%
1982 1983 1984 1985 1986 1987 1988 1989 1990 1991 1992 1993 1994 1995 1996 1997 1998 1999 2000 2001 2002 2003 2004 2005 2006 2007
unw
eigh
ted
aver
age
of E
AT
R
EATR(OECD19) EATR(OECD30)
Figure 4: Trends in effective tax rates (1982-2007)
similar and both show a clear downward trend. This clearly is at odds withthe idea, that the tax base broadening was large enough to offset the tax ratecuts. However, examining the numbers more closely, it can be observed that thedrop in the EMTR is less pronounced than in the statutory tax rates. Overallthe EMTR dropped from an unweighted average of 37.9 percent to 23.8 percent.The base broadening was sufficient to offset the tax rate cuts until the late 80s,which is reflected in the relatively stable EMTR. For the period between 1988and 2007 the EMTR consistently fall. The inclusion of more countries reversesthis trend for some years in the early 90s, however, overall the trend is still clearlydownwards. The same holds true for the EATR, as displayed in the right handside of Figure 4. Overall the unweighted average decreases from 37.9 percentin 1982 to 23.8 percent in 2007. This downward trend is smoother than in theEMTRs and comparable to the fall in statutory tax rates as displayed in Figure 1.
Although the decrease in both measures of effective tax rates is less pro-nounced than in the statutory tax rates, they still display a very different trendthan the corporate tax revenues. This points into the direction that either thenumber of corporate tax payers or their average profit level have changed. Bothof these changes can not be evaluated looking at the corporate sector of an in-dividual country alone. The number of tax payers can change because a largernumber of persons respectively businesses incorporate themselves.12 Therefore itis necessary to evaluate the observed pattern against the background of personalincome taxes or more generally the tax system overall. Before we set out to doso in the subsequent section, it is also worthwhile to have a short look into theinternational aspects of corporate taxation. This is insofar of importance as theaverage profit of corporate taxpayers can potentially depend on their ability to
12See Fuest and Weichenrieder (2002) for an indepth analysis of the incorporated vs. unin-corporated sector.
7

shift production or profits between jurisdictions. Both the attractiveness and thepossibility of profit shifting for companies in turn is influenced by interaction ofinternational tax laws, which is addressed in the next subsection.
2.3 Developments in International Corporate Taxation
The increasing importance of multi jurisdictional corporations puts more weighton international aspects of corporate taxation. In a first instance legally indepen-dent subsidiaries are subject to corporate taxation where they operate. Giventhat some countries tax corporations on their worldwide income corporation ac-tive in more than more than one country might be subject to double taxation.On top of that some countries impose withholding taxes on interest or dividendflows between parent and subsidiaries in different countries.13
The tax obstacles to international investment and the extent of double taxa-tion depend on the interaction of unilateral provisions, bilateral treaties and mul-tilateral agreements. The latter includes legally binding directives like the parent-subsidiary and the interest and royalties directive of the European Union.14 Thesetwo directives directly reduce the tax burden for bilateral investments throughthe abolition of withholding taxes on dividends, interest or royalty payments be-tween affiliated companies. Further multilateral initiatives, which are guidelinesrather than legally binding, are pursued by the OECD. However, this initiativescan be of some significance, like the OECD model tax treaty, which has now beensigned by an increasing number of OECD countries. Between 1982 and 2007 thepercentage of the bilateral country combinations within the OECD that fall un-der a tax treaty increased from 50.7 percent to 92.3 percent.15
On a unilateral level one can observe a tendency of countries to adopt anexemption system.16 This implies that foreign income of corporations is nottaxed in the home country. All else equal this tends to reduce the tax burdenof cross-border investment. In summing up the overall trends in internationalcorporate taxation, seems towards an alleviation of the corporate tax burdenfor cross border investment. Along these lines Loretz (2007) finds a significant
13For a discussion of the international tax system see for example Huizinga and Voget (2006)14The Council Directive 90/435/EEC of 23 July 1990 governs that dividends paid from a
subsidiary to its parent company should be exempted from withholding taxes, and the CouncilDirective 2003/49/EC of 3rd June 2003 governs the withholding taxes on Interest and Royaltiesflows.
15In absolute numbers this signifies an increase - out of a total from 870 country pairs - from441 to 803 country pairs.
16This is more evident for qualified ownership, as most countries only introduce a systemof participation exemption. For anecdotal evidence see Huizinga and Voget (2007) or Loretz(2007).
8
reduction in the bilateral effective tax rates, which is even more pronounced thanfor domestic effective tax rates.
3 Corporate Taxation in Context
The previous section reinforces that there is an discrepancy between corporate taxrates and corporate tax revenues. The possibility that high tax rates might nottranslate into higher revenues has been discussed ever since economic literatureexists, as Smith (1776) remarks ’[h]igh taxes, sometimes by diminishing the con-sumption of the taxed commodities, and sometimes by encouraging smuggling,frequently afford a smaller revenue to government than what be might be drawnfrom more moderate taxation.’ Later on the fact that the relationship betweentax rates and revenues might be parabolic became popularly known as the Laffercurve.17 While the original concept of the Laffer curve aims to explain the taxrevenues from individual income tax, the concept has recently been applied tocorporate taxation as well.18 The main arguments are that corporate tax ratessubstantially different from the rates of other countries induce profit shifting intoor out of the country. Further corporate tax rates below the individual incometax rates lead to a shift into the corporate sector. In either way, this might in-fluence the ability of countries to tax corporate income. Therefore more insightsabout the ability of jurisdictions to tax corporate profits can be gained if thedevelopment of corporate taxation is examined against the background of othertaxes.
Difficulties in taxing corporations potentially manifest themselves in variousways. The most extreme outcome would be that the government might be forcedto reduce the overall tax burden, because it can not raise the revenues in anyother way.19 On a less dramatic note tax competition could induce a general shiftfrom direct taxation, i.e. personal and corporate income to indirect taxation, i.e.consumption or property taxes. Or the shift could take place within the incometaxes between corporate and personal income taxation. The following subsectionsaddress each of these issues.
17The Laffer curve is named after the economist Arthur Laffer, who allegedly sketched theparabolic relationship between tax rates and revenues on a napkin to explain it to a journalist.
18Clausing (2007) finds empirical evidence for a relatively high revenue maximising corporatetax rate, while Brill and Hassett (2007) argue that the Laffer curve moved over time, and therevenue maximising corporate tax rate has fallen over time. Along these lines Devereux (2008)finds only weak evidence for the existence of a Laffer curve.
19This includes scenarios where it would be economically feasible to raise other taxes, it couldbe politically impossible to do so.
9
3.1 Corporate Taxes relative to Total Taxation
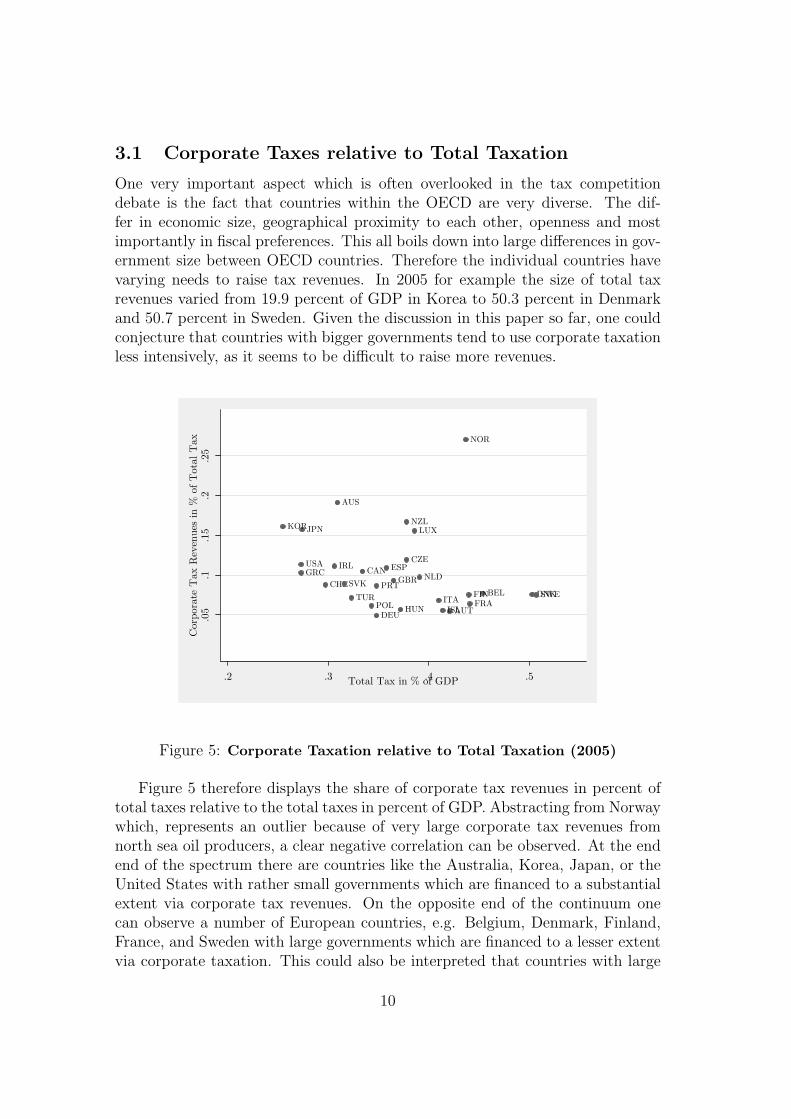
One very important aspect which is often overlooked in the tax competitiondebate is the fact that countries within the OECD are very diverse. The dif-fer in economic size, geographical proximity to each other, openness and mostimportantly in fiscal preferences. This all boils down into large differences in gov-ernment size between OECD countries. Therefore the individual countries havevarying needs to raise tax revenues. In 2005 for example the size of total taxrevenues varied from 19.9 percent of GDP in Korea to 50.3 percent in Denmarkand 50.7 percent in Sweden. Given the discussion in this paper so far, one couldconjecture that countries with bigger governments tend to use corporate taxationless intensively, as it seems to be difficult to raise more revenues.
AUS
AUT
BEL
CAN
CHE
CZE
DEU
DNK
ESP
FINFRA
GBRGRC
HUN
IRL
ISL
ITA
JPNKORLUX
NLD
NOR
NZL
POL
PRTSVK
SWETUR
USA
.05
.1.15
.2.25
Corporate T
ax R
even
ues in %
of Total Tax
.2 .3 .4 .5Total Tax in % of GDP
Figure 5: Corporate Taxation relative to Total Taxation (2005)
Figure 5 therefore displays the share of corporate tax revenues in percent oftotal taxes relative to the total taxes in percent of GDP. Abstracting from Norwaywhich, represents an outlier because of very large corporate tax revenues fromnorth sea oil producers, a clear negative correlation can be observed. At the endend of the spectrum there are countries like the Australia, Korea, Japan, or theUnited States with rather small governments which are financed to a substantialextent via corporate tax revenues. On the opposite end of the continuum onecan observe a number of European countries, e.g. Belgium, Denmark, Finland,France, and Sweden with large governments which are financed to a lesser extentvia corporate taxation. This could also be interpreted that countries with large
10
revenue requirements prefer to rely on sources other then the corporate sector, asthe corporate tax revenues tend to be more volatile. This can neither be directlyinterpreted as evidence for or the result of tax competition but at least pointstowards the direction that countries with different revenue requirements chose adifferent tax mix.
3.2 Corporate Taxation relative to Consumption Taxa-tion
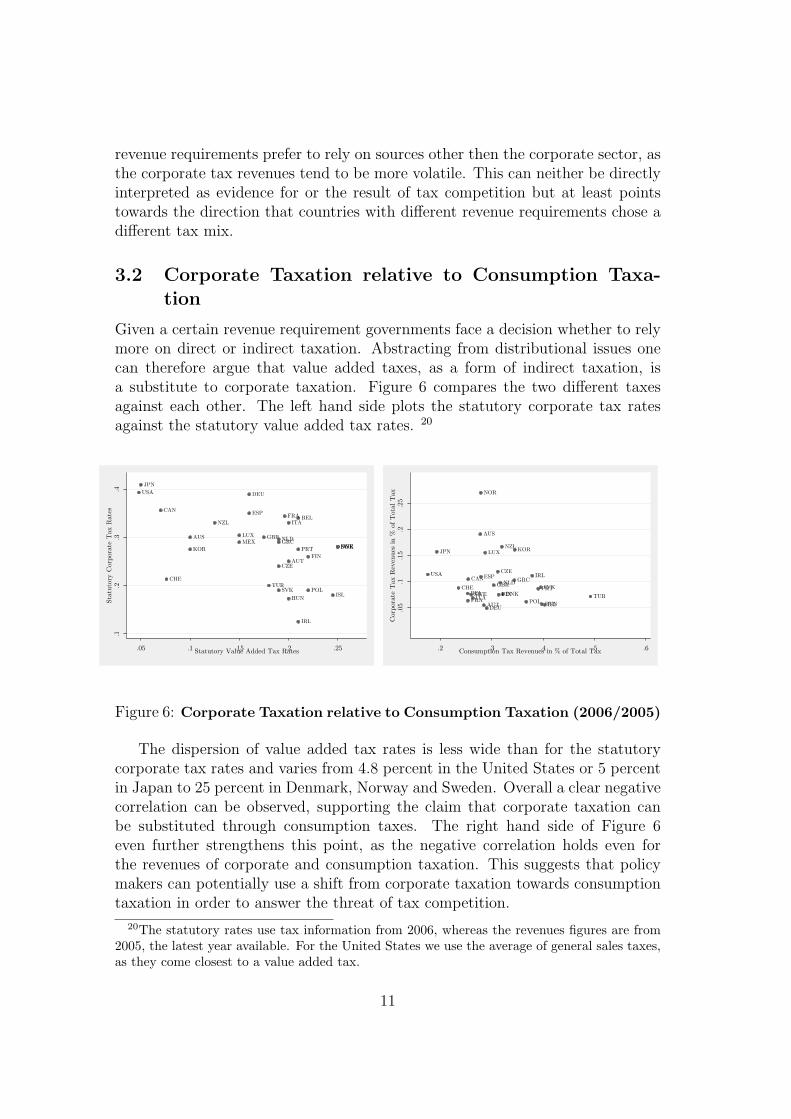
Given a certain revenue requirement governments face a decision whether to relymore on direct or indirect taxation. Abstracting from distributional issues onecan therefore argue that value added taxes, as a form of indirect taxation, isa substitute to corporate taxation. Figure 6 compares the two different taxesagainst each other. The left hand side plots the statutory corporate tax ratesagainst the statutory value added tax rates. 20
AUS
AUT
BEL
CAN
CHE
CZE
DEU
DNK
ESP
FIN
FRA
GBRGRC
HUN
IRL
ISL
ITA
JPN
KOR
LUX
MEXNLD
NOR
NZL
POL
PRT
SVK
SWE
TUR
USA
.1.2
.3.4
Statutory Corporate Tax Rates
.05 .1 .15 .2 .25Statutory Value Added Tax Rates
AUS
AUT
BEL
CAN
CHE
CZE
DEU
DNK
ESP
FINFRA
GBRGRC
HUN
IRL
ISL
ITA
JPN KORLUX
NLD
NOR
NZL
POL
PRTSVK
SWE TUR
USA
.05
.1.15
.2.25
Corporate T
ax R
even
ues in %
of Total Tax
.2 .3 .4 .5 .6Consumption Tax Revenues in % of Total Tax
Figure 6: Corporate Taxation relative to Consumption Taxation (2006/2005)
The dispersion of value added tax rates is less wide than for the statutorycorporate tax rates and varies from 4.8 percent in the United States or 5 percentin Japan to 25 percent in Denmark, Norway and Sweden. Overall a clear negativecorrelation can be observed, supporting the claim that corporate taxation canbe substituted through consumption taxes. The right hand side of Figure 6even further strengthens this point, as the negative correlation holds even forthe revenues of corporate and consumption taxation. This suggests that policymakers can potentially use a shift from corporate taxation towards consumptiontaxation in order to answer the threat of tax competition.
20The statutory rates use tax information from 2006, whereas the revenues figures are from2005, the latest year available. For the United States we use the average of general sales taxes,as they come closest to a value added tax.
11
3.3 Corporate Taxation relative to Personal Taxation
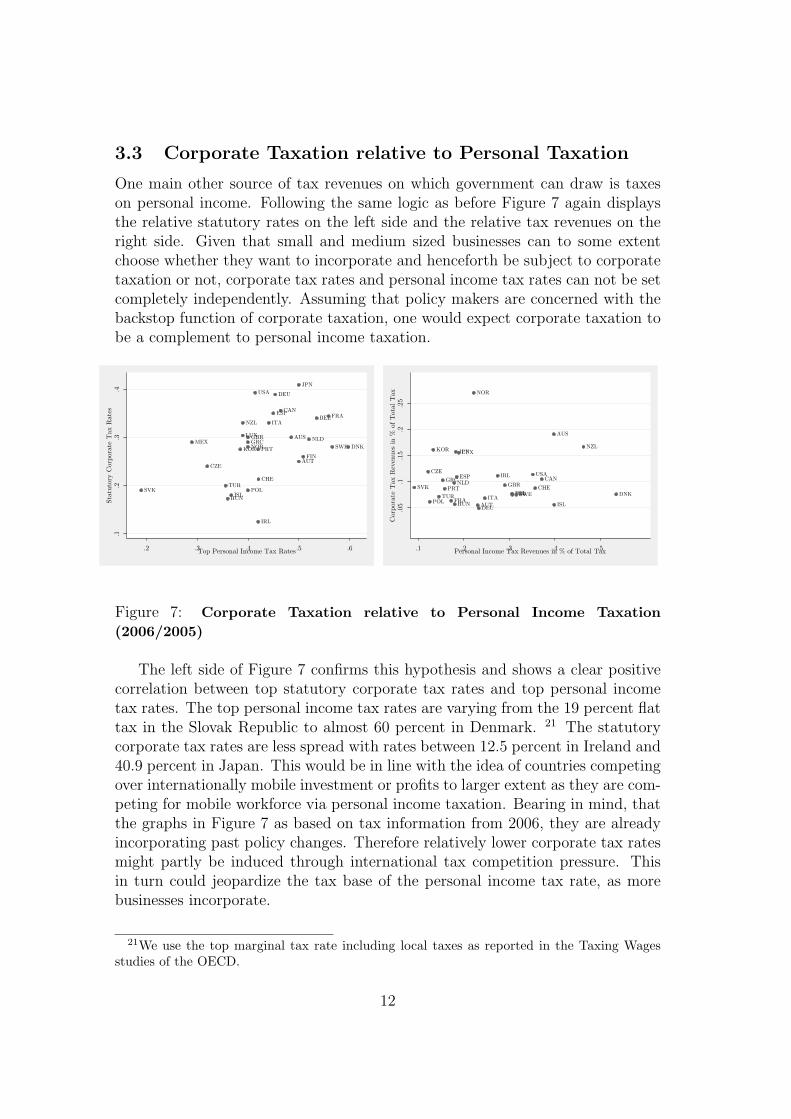
One main other source of tax revenues on which government can draw is taxeson personal income. Following the same logic as before Figure 7 again displaysthe relative statutory rates on the left side and the relative tax revenues on theright side. Given that small and medium sized businesses can to some extentchoose whether they want to incorporate and henceforth be subject to corporatetaxation or not, corporate tax rates and personal income tax rates can not be setcompletely independently. Assuming that policy makers are concerned with thebackstop function of corporate taxation, one would expect corporate taxation tobe a complement to personal income taxation.
AUS
AUT
BEL
CAN
CHE
CZE
DEU
DNK
ESP
FIN
FRA
GBRGRC
HUN
IRL
ISL
ITA
JPN
KOR
LUX
MEXNLD
NOR
NZL
POL
PRT
SVK
SWE
TUR
USA
.1.2
.3.4
Statutory Corporate Tax Rates
.2 .3 .4 .5 .6Top Personal Income Tax Rates
AUS
AUT
BEL
CAN
CHE
CZE
DEU
DNK
ESP
FINFRA
GBRGRC
HUN
IRL
ISL
ITA
JPNKORLUX
NLD
NOR
NZL
POL
PRTSVK
SWETUR
USA
.05
.1.15
.2.25
Corporate T
ax R
even
ues in %
of Total Tax
.1 .2 .3 .4 .5Personal Income Tax Revenues in % of Total Tax
Figure 7: Corporate Taxation relative to Personal Income Taxation(2006/2005)
The left side of Figure 7 confirms this hypothesis and shows a clear positivecorrelation between top statutory corporate tax rates and top personal incometax rates. The top personal income tax rates are varying from the 19 percent flattax in the Slovak Republic to almost 60 percent in Denmark. 21 The statutorycorporate tax rates are less spread with rates between 12.5 percent in Ireland and40.9 percent in Japan. This would be in line with the idea of countries competingover internationally mobile investment or profits to larger extent as they are com-peting for mobile workforce via personal income taxation. Bearing in mind, thatthe graphs in Figure 7 as based on tax information from 2006, they are alreadyincorporating past policy changes. Therefore relatively lower corporate tax ratesmight partly be induced through international tax competition pressure. Thisin turn could jeopardize the tax base of the personal income tax rate, as morebusinesses incorporate.
21We use the top marginal tax rate including local taxes as reported in the Taxing Wagesstudies of the OECD.
12
Therefore right side of Figure 7, displays the other side of the backstop func-tion story. The negative correlation between the tax revenues from personalincome taxes and corporate tax revenues is consistent with the claim that incomeis shifted between the unincorporated sector and the the corporate sector.
The analysis in this section established two stylized facts. Namely, that cor-porate taxation and consumption taxation are likely to be complements whilecorporate taxes are to some extent complementary to personal income taxes.Hence we expect the observed downward trend in statutory corporate tax ratesto be accompanied by changes in consumption and labour taxes. Therefore thenext section sets out to re-examine changes in corporate taxation with these twostylized facts in mind.
4 Trends in Corporate Taxation revisited
The observed downward trend in all measures of corporate tax rates displays asignificant downward trend. However, in either of the Figures 1 or 4 the reductionin corporate taxation is interrupted by a short period of stable tax rates in theearly 90s. Therefore we split our analysis of the changes in tax policy into twoperiods. The underlying ideas is, that tax policy changed markedly over lasttwo decades. The changes in tax policy can stem from a number of differentsources. The paradigms in place could have changed, increased internationalpressure might have driven the tax policy or it could have been a combination ofboth.
The second aspect of corporate taxation, the corporate tax revenues as dis-played in Figure 2, also display a discontinuity in their trend. At least for theunweighted average, the increase in tax revenues only really took place for a timeperiod after 1992. Therefore it might be useful to spilt the development thereinto subperiods. The exact timing of the split is therefore somewhat arbitrary,and in fact we let it dominate by data requirements.
4.1 The Relative Development of Corporate Tax Rates
The previous section suggests substitutability between corporate taxes and con-sumption taxes while there is some complementarity between the personal andcorporate income taxes. Consequently the policy maker with a certain revenuerequirement would tend to raise consumption taxes to compensate the revenueloss of corporate tax reductions. At the same time a reduction in corporate tax-ation should be accompanied by a reduction of the personal income taxes.
To evaluate whether these pattern can be observed we relate the changes in
13

the various tax rates to each other. The way we proceed is as follows. On thevertical axis we have the difference between the statutory corporate tax rate atthe beginning and the end of the observed period, while we vary on the horizon-tal axis between the change in the value added tax rates and the change in toppersonal income tax rates.
Figure 8 plots the change in statutory corporate tax rates against the changesin value added tax rate and top personal income tax rate. The upper left partof Figure 8 depicts the changes in corporate taxes relative to value added taxesfor the time period 1982 to 1991, while the upper right part displays the changesfor the time between 1991 and 2006. In the lower part of Figure 8 the change ofstatutory corporate tax rates is plotted against the change in the top personalincome tax rate. It is noteworthy that the upper and the lower part are only in-completely comparable, as the time period observed is somewhat different. Thelower left part refers to the period between 1984 and 1997 while the lower rightpart displays the changes between 2000 and 2006. This due to the fact, that thereis up to our knowledge no consistent panel of personal tax rate data available.We try to minimize the potential error by choosing subsets which are internallyconsistent.22
Despite these data limitations there some interesting insights to be gainedfrom Figure 8. Starting in the upper left corner, there are five countries whichstand out because of large positive changes in value added taxes. These countries,namely Spain, Greece, New Zealand, Portugal and Iceland introduced value addedtaxes during the period observed, implying a large increase. On the other endof the extreme there are nine countries with no change in statutory value addedtax rates and the Netherlands and Ireland display a slight reduction in valueadded tax rates. In contrast, the corporate tax rates, as already discussed above,dropped in most countries in the time between 1982 and 1991. In sum, for aboutone third of the countries, the fall in corporate tax rates coincided with with anincrease in value added taxes. Comparing this observation with the upper righthand part of Figure 8, which displays the change for the later time period, thepicture changes. Again there are a number of countries with large increases invalue added tax rates, mirroring the fact they only just introduced value addedtaxes. However, all of these moves came at a period of time, which exhibited ageneral fall of corporate tax rates. In total more than two thirds of the OECDcountries had an increase in value added tax rates while lowering corporate taxrates.
22The values for top personal income tax rates for the period between 1984 and 1987 stemfrom the Office of Tax Policy research database. In contrast to the data we use for the period2000 to 2006, originating from the Taxing Wages studies of the OECD, the former does notinclude the local income taxes and the latter does. It is therefore not possible to link these todata sources
14

AUS
AUTBEL
CAN
CHEDEU
DNK
ESP
FIN
FRA
GBR
GRC
IRL
ISL
ITA
JPN
KOR
LUX
MEX
NLD
NOR
NZL
PRT
SWE
USA
-.3-.2-.10.1Change in Statutory Corporate Tax rate 1982-1991
0.05
.1.15
.2.25
Change in Value Added Tax Rate 1982-1991
AUS
AUT
BEL
CAN
CHE
CZE
DEUDNKESP
FIN
FRA
GBR
GRC
HUN
IRL
ISL
ITAJPN
KOR
LUX
MEXNLD
NOR
NZL
POL
PRT
SVK
SWE
TUR
USA
-.4-.3-.2-.10Change in Statutory Corporate Tax rate 1991-2006
-.05
0.05
.1.15
.2Change in Value Added Tax Rate 1991-2006
AUS AUT
BEL
CAN
DEU
ESP
FIN
GBR
GRCIRL
ITA
JPN
KOR
MEX
NLD
NZL
PRT
USA
-.3-.2-.10.1Change in Statutory Corporate Tax rate 1984-1997
-.3
-.2
-.1
0Change in P
erso
nal In
come 1984-1997
AUS
AUT
BEL
CAN
CHE C
ZE
DEU
DNK
ESP
FIN FRA
GBR
GRCHUN
IRL
ISL
ITA
JPN
KOR
LUX
MEX
NLD
NOR
NZL
POL
PRT
SVK
SWE
TUR
USA
-.15-.1-.050.05Change in Statutory Corporate Tax rate 2000-2006
-.15
-.1
-.05
0.05
Change in Personal Income Tax Rate 2000-2006
Fig
ure
8:C
han
ges
ofC
orp
orat
eT
axat
ion
rela
tive
toot
her
Tax
atio
n
15
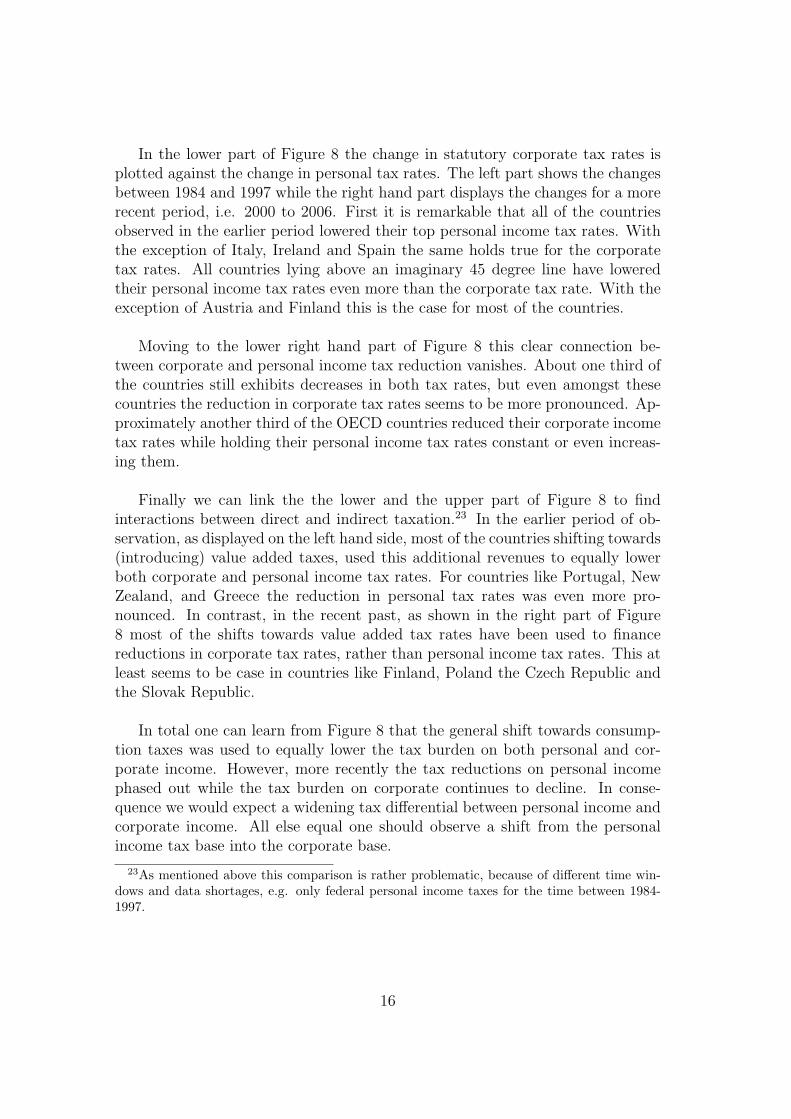
In the lower part of Figure 8 the change in statutory corporate tax rates isplotted against the change in personal tax rates. The left part shows the changesbetween 1984 and 1997 while the right hand part displays the changes for a morerecent period, i.e. 2000 to 2006. First it is remarkable that all of the countriesobserved in the earlier period lowered their top personal income tax rates. Withthe exception of Italy, Ireland and Spain the same holds true for the corporatetax rates. All countries lying above an imaginary 45 degree line have loweredtheir personal income tax rates even more than the corporate tax rate. With theexception of Austria and Finland this is the case for most of the countries.
Moving to the lower right hand part of Figure 8 this clear connection be-tween corporate and personal income tax reduction vanishes. About one third ofthe countries still exhibits decreases in both tax rates, but even amongst thesecountries the reduction in corporate tax rates seems to be more pronounced. Ap-proximately another third of the OECD countries reduced their corporate incometax rates while holding their personal income tax rates constant or even increas-ing them.
Finally we can link the the lower and the upper part of Figure 8 to findinteractions between direct and indirect taxation.23 In the earlier period of ob-servation, as displayed on the left hand side, most of the countries shifting towards(introducing) value added taxes, used this additional revenues to equally lowerboth corporate and personal income tax rates. For countries like Portugal, NewZealand, and Greece the reduction in personal tax rates was even more pro-nounced. In contrast, in the recent past, as shown in the right part of Figure8 most of the shifts towards value added tax rates have been used to financereductions in corporate tax rates, rather than personal income tax rates. This atleast seems to be case in countries like Finland, Poland the Czech Republic andthe Slovak Republic.
In total one can learn from Figure 8 that the general shift towards consump-tion taxes was used to equally lower the tax burden on both personal and cor-porate income. However, more recently the tax reductions on personal incomephased out while the tax burden on corporate continues to decline. In conse-quence we would expect a widening tax differential between personal income andcorporate income. All else equal one should observe a shift from the personalincome tax base into the corporate base.
23As mentioned above this comparison is rather problematic, because of different time win-dows and data shortages, e.g. only federal personal income taxes for the time between 1984-1997.
16

4.2 The Relative Development of the Corporate Tax Bases
The analysis in the previous subsection pointed to the conclusion that the dif-ferential between the corporate tax rate and the personal income tax rate waswidening over the last decade. This should have a direct influence on the corpo-rate tax base as more business tend to incorporate themselves, or more generallyas profits are shifted into the corporate sector.24 Given the fact that we can notobserve the behaviour directly we take an approximation to measure the size ofthe tax base. In line with Devereux (2007) we simply measure the corporate taxbase as the corporate tax revenues divided by the statutory corporate tax rate.25
Tax Differential and Corporate Tax Base
0%
5%
10%
15%
20%
25%
30%
1984 1985 1986 1987 1988 1989 1990 1991 1992 1993 1994 1995 1996 1997 1998 1999 2000 2001 2002 2003 2004 2005 2006
Tax
Diff
eren
tial
(P
IT- C
IT)
0%
2%
4%
6%
8%
10%
12%
14%
16%
Cor
pora
te T
ax B
ase
in %
of G
DP
average Tax Differential Corporate Tax Base
Figure 9: Tax Rate Differentials relative to Corporate Tax Base (1984 -2005)
Figure 9 then relates the trend in the unweighted average corporate tax baseto the tax differential between the personal income tax rates and the corporateincome tax. The latter variable is defined in a way, that positive values imply alower tax rate for corporations.26 The black line in Figure 9 describes the trendfor the tax rate differential. The claims from the previous subsections are con-firmed as the tax differential narrowed substantially from about 13 percent in1984 to just above 5 percent in 1991. Ever since then the tax differential steadily
24See also de Mooij and Nicodeme (2008) for the other side of this phenomenon, i.e. thereduction in personal tax revenues due to reduced corporate tax rates.
25This procedure abstracts from different (e.g. progressive or preferential) tax rates.26This does not account for shareholder taxation, which can overturn the tax advantage into
a tax disadvantage.
17

increased, reaching values as 14.5 percent.27
The grey line depicts the corporate tax base as a percentage of GDP. Thereis an unambiguously positive trend with an increasing corporate tax base from6 percent to 13.5 percent. This is exactly the observation made earlier on, thatgiven the falling corporate tax rates, corporate tax base must have increased toexplain the no falling corporate tax revenues.
Given the data available it is not possible to directly interpret this as evidencefor a shift from the unincorprated sector into the corporate sector. However,as the coinciding trends are definitively in line with the predictions, it seemsreasonable to assume that this can explain a part of the puzzle of persistingcorporate tax revenues.
5 Conclusion
The paper starts from the observation that corporate tax rates display a signif-icant downward trend, which is not mirror in a similar downward trend in thecorresponding tax revenues. As the changes in the legal definition of the corpo-rate tax base seem to fall short in explaining this discrepancy, the paper set outto evaluate the trends in a more holistic perspective.
Analysing the corporate taxation against the background of the overall taxsystem can be observed that corporate taxation and consumption taxes tend to besubstitutes. On the other hand corporate and personal income taxes are likely tobe complements. In consequence, over the last two decades a shift from incometaxation towards consumption taxation can be observed. While the personalincome tax rates were reduced in line with the corporate tax rates until the early90s, only the tax reductions in the corporate tax seem to continued unabated.This resulted in a increasing tax differential between the two forms of incometaxes. The resulting shift from the unincorporated sector into the corporatesector, can be an explanation of the persistent corporate tax revenues despitefalling taxes.
27Please note that the same data limitation as in the previous section apply here.
18
References
Brill, Alex M. and Kevin A. Hassett 2007, Revenue-Maximizing Corporate In-come Taxes: The Laffer Curve in OECD countries, AEI Working PaperNo. 137
Chennells, Lucy and Rachel Griffith 1997, Taxing Profits in a Changing World,Institute for Fiscal Studies, London.
Clausing, Kimberly A., 2007, Corporate Tax Revenues in OECD countries In-ternational Tax and Public Finance, 14, pp. 114-133.
de Mooij, Ruud and Gaetan Nicodeme 2007a, Corporate Tax Policy, En-trepreneurship and Incorporation in the EU, Tinbergen Institute DiscussionPapers 07-030/3.
de Mooij, Ruud and Gaetan Nicodeme 2007b, Corporate Tax Policy, and Incor-poration in the EU, Oxford University Centre for Business Taxation WorkingPaper 07/16.
de Mooij, Ruud and Gaetan Nicodeme 2008, How Corporate Tax CompetitionReduces Personal Tax Revenues, CESifo DICE Report, 6, No.1, pp. 27-31.
Devereux, Michael P., 2007, Developments in the Taxation of Corporate Profitin the OECD since 1965: Rates, Bases and Revenues, Oxford UniversityCentre for Business Taxation Working Paper 07/04.
Devereux, Michael P., Griffith, Rachel and Alexander Klemm 2002, Corporateincome tax: Reforms and tax competition, Economic Policy, October 2002,pp. 450-495.
Devereux, Michael P., and Simon Loretz 2008, What we know about tax compe-tition, Oxford University Centre for Business Taxation, Oxford.
Fuest, Clemens and Alfons Weichenrieder 2002, Tax Competition and ProfitShifting: On the Relationship between Personal and Corporate Tax Rates,CESifo Working Paper No. 781
Hall, R.E. and D.W. Jorgensen 1967, Tax policy and investment behaviour,American Economic Review, 57, 391-414.
Huizinga, Harry and Johannes Voget 2006, International Taxation and the Di-rection and Volume of Cross-border Investment, CEPR Discussion PaperNo. 5974
Jorgensen, Dale W. 1963, Capital theory and investment behaviour, AmericanEconomic Review, 53, pp. 247-259.
19

Loretz, Simon 2007, Determinants of Bilateral Effective Tax Rates: EmpiricalEvidence from OECD countries, Fiscal Studies, 28, pp. 227-249.
Organisation for Economic Co-Operation and Development (OECD) , 2007a,Tax Revenue Statistics, Paris.
Organisation for Economic Co-Operation and Development (OECD) , 2007b,Taxing Wages, Paris.
Smith, Adam 1776, The Wealth of Nations J.N. Dent & Sons, Ltd. London,reprinted 1975.
20