the competitive advantage of greece: moving to the … files/caon_greece_2003.05...athens, greece 8...
TRANSCRIPT

1 Copyright 2003 © Professor Michael E. PorterCAON Greece 2003 05-08-03 CK.ppt
The Competitive Advantage of Greece:Moving to the Next Level
Professor Michael E. PorterInstitute for Strategy and Competitiveness
Harvard Business School
Athens, Greece8 May, 2003
This presentation draws on ideas from Professor Porter’s articles and books, in particular, The Competitive Advantage of Nations (The Free Press, 1990), “Building the Microeconomic Foundations of Competitiveness,” in The Global Competitiveness Report 2002, (World Economic Forum, 2002), “Clusters and the New Competitive Agenda for Companies and Governments” in On Competition (Harvard Business School Press, 1998), and ongoing research on clusters and competitiveness. No part of this publication may be reproduced, stored in a retrieval system, or transmitted in any form or by any means - electronic, mechanical, photocopying, recording, or otherwise - without the permission of Michael E. Porter.Further information on Professor Porter’s work and the Institute for Strategy and Competitiveness is available at www.isc.hbs.edu
2 Copyright 2003 © Professor Michael E. PorterCAON Greece 2003 05-08-03 CK.ppt
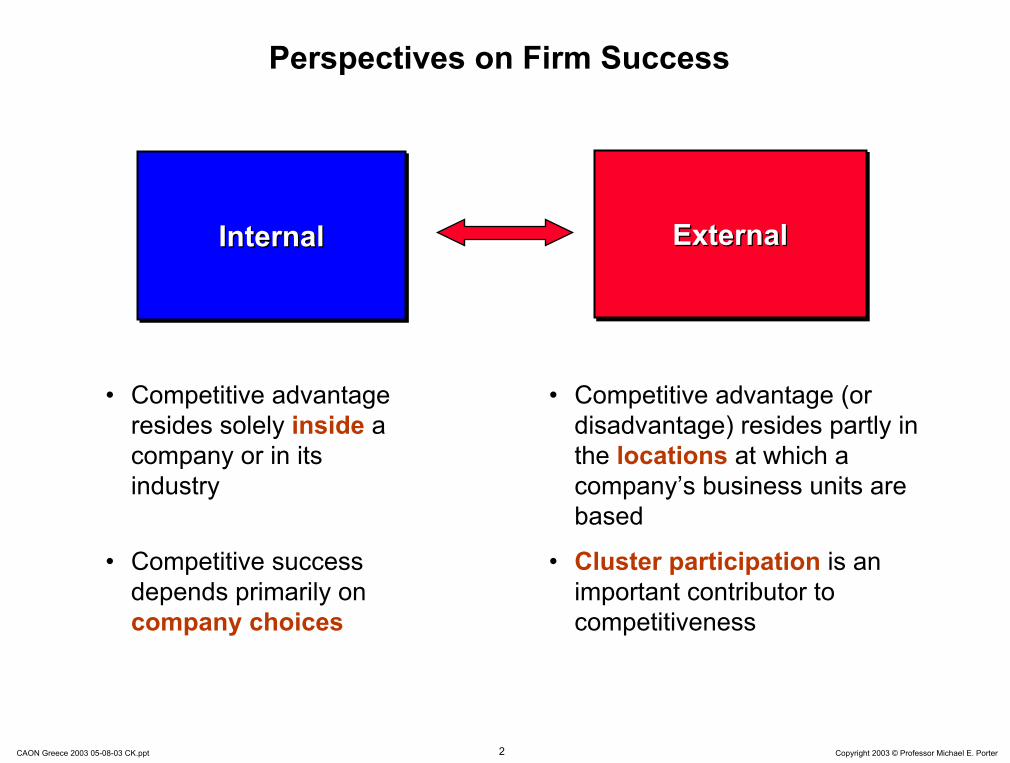
Perspectives on Firm Success
InternalInternalInternal ExternalExternalExternal
• Competitive advantage resides solely inside a company or in its industry
• Competitive success depends primarily on company choices
• Competitive advantage (or disadvantage) resides partly in the locations at which a company’s business units are based
• Cluster participation is an important contributor to competitiveness

3 Copyright 2003 © Professor Michael E. PorterCAON Greece 2003 05-08-03 CK.ppt
What is Competitiveness?
• Competitiveness is determined by the productivity with which a nation uses its human, capital, and natural resources. Productivity sets a nation’s or region’s standard of living (wages, returns to capital, returns to natural resource endowments)
– Productivity depends both on the value of products and services (e.g. uniqueness, quality) as well as the efficiency with which they are produced.
– It is not what industries a nation competes in that matters for prosperity, but howfirms compete in those industries
– Productivity in a nation is a reflection of what both domestic and foreign firms choose to do in that location. The location of ownership is secondary for national prosperity.
– The productivity of “local” industries is of fundamental importance to competitiveness, not just that of traded industries
– Devaluation does not make a country more competitive
• Nations compete in offering the most productive environment for business
• The public and private sectors play different but interrelated roles in creating a productive economy

4 Copyright 2003 © Professor Michael E. PorterCAON Greece 2003 05-08-03 CK.ppt
Innovation and Competitiveness
ProductivityProductivity
Innovative CapacityInnovative CapacityInnovative Capacity
Competitiveness
• Innovation is more than just scientific discovery• There are no low-tech industries, only low-tech firms
ProsperityProsperityProsperity
5 Copyright 2003 © Professor Michael E. PorterCAON Greece 2003 05-08-03 CK.ppt
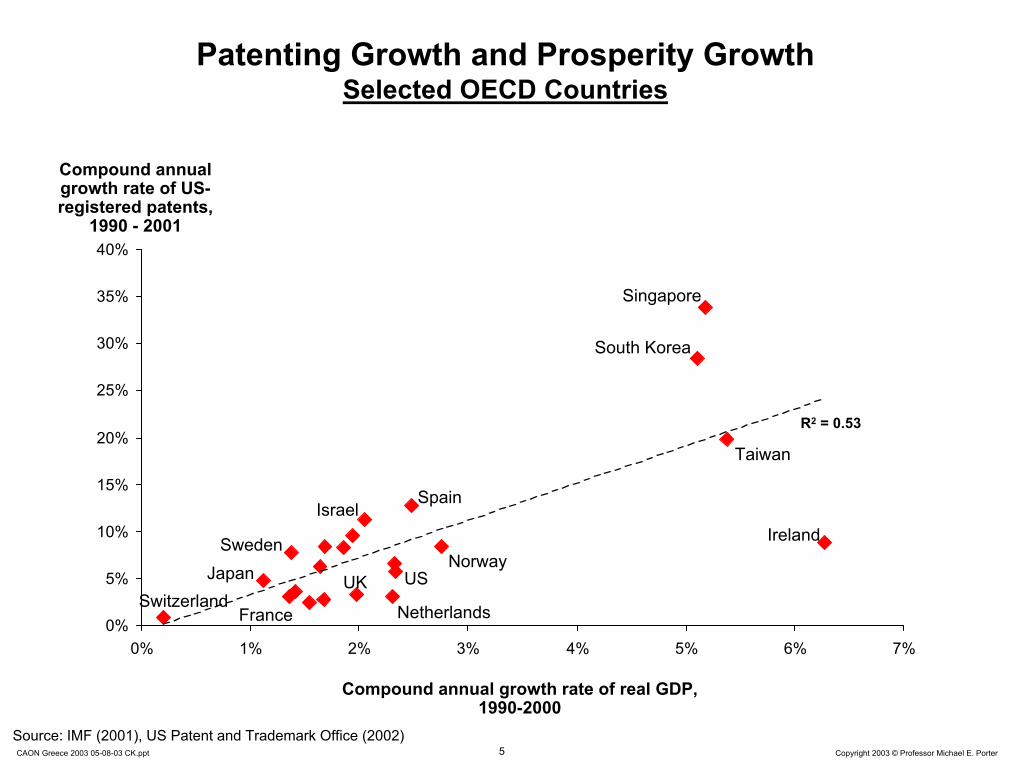
Patenting Growth and Prosperity GrowthSelected OECD Countries
0%
5%
10%
15%
20%
25%
30%
35%
40%
0% 1% 2% 3% 4% 5% 6% 7%
Ireland
Compound annual growth rate of US-registered patents,
1990 - 2001
Compound annual growth rate of real GDP, 1990-2000
USUKJapan
Spain
France Netherlands
Israel
Singapore
Norway
Source: IMF (2001), US Patent and Trademark Office (2002)
R2 = 0.53
Taiwan
Switzerland
Sweden
South Korea

6 Copyright 2003 © Professor Michael E. PorterCAON Greece 2003 05-08-03 CK.ppt
The Greek Economic Situation in 2003
• Greece has been among the leading European Union member countries in terms of GDP growth in the last five years
• Macroeconomic progress has been considerable, and Greece successfully entered the European Monetary Union in the first wave
However
• Much of the recent growth has been fueled by low interest ratesafter entry into the EMU and access to EU structural funds
• Despite some recent progress, Greece is still lagging behind the reforms other countries started much earlier
• Greece will receive reduced EU funding after 2006 and faces increasingly intense competition from EU accession countries in Eastern Europe
• Greece has significant competitiveness challenges that must be addressed if prosperity growth is to be sustainable

7 Copyright 2003 © Professor Michael E. PorterCAON Greece 2003 05-08-03 CK.ppt
-2%
-1%
0%
1%
2%
3%
4%
5%
6%
1990 1991 1992 1993 1994 1995 1996 1997 1998 1999 2000 2001 2002
GreeceSpainAustriaItalyPortugal
Comparative Economic PerformanceGrowth Rate of Real GDP, Selected Economies
Annual Growth Rate of Real GDP
Source: EIU (2002)

8 Copyright 2003 © Professor Michael E. PorterCAON Greece 2003 05-08-03 CK.ppt
30%
40%
50%
60%
70%
80%
90%
100%
-2.0% -1.5% -1.0% -0.5% 0.0% 0.5% 1.0% 1.5% 2.0%
UK
United States
Comparative Economic PerformanceProsperity, Selected Economies
Korea
Netherlands FinlandGermanyJapan
Source: World Development Indicators 2002
Switzerland
GDP per Capita, 2001, US=100
CAGR of GDP per Capita Relative to the US, 1995-2001
Slovenia
Taiwan
France
New Zealand
Italy
Canada
Israel
Hungary
Hong Kong
Argentina
Portugal
Denmark
Greece
Sweden
Spain
Slovak Republic
Singapore
Norway
Czech Republic
BelgiumAustria Australia

9 Copyright 2003 © Professor Michael E. PorterCAON Greece 2003 05-08-03 CK.ppt
Greek Microeconomic Performance
• Greece has registered solid labor productivity growth in the last few years
However
• The overall level of labor productivity is still low
• Greece has a been one of the few middle to high-income countries with increasing unemployment since 1995– The effects of corporate restructuring, labor force inflows from
agriculture, higher participation of women, and immigrants have outweighed positive job creation
• Greece has a weak position in exports. Performance is better in service exports such as tourism and shipping
• Greece innovation performance lags all other EU member countries with the exception of Portugal

10 Copyright 2003 © Professor Michael E. PorterCAON Greece 2003 05-08-03 CK.ppt
Labor Productivity PerformanceSelected OECD Countries, GDP per Hour worked
50
60
70
80
90
100
110
0.0% 0.5% 1.0% 1.5% 2.0% 2.5% 3.0%
Labor Productivity Level, 1999,
US = 100
Labor Productivity Growth, 1995-99
AustraliaFinland
US
GermanyUK
JapanSpain
Canada
France
NetherlandsItaly
Denmark
Note: Total economySource: OECD (2001)
Switzerland
Sweden
Ireland(96%, +4.6%)
GreecePortugal
11 Copyright 2003 © Professor Michael E. PorterCAON Greece 2003 05-08-03 CK.ppt
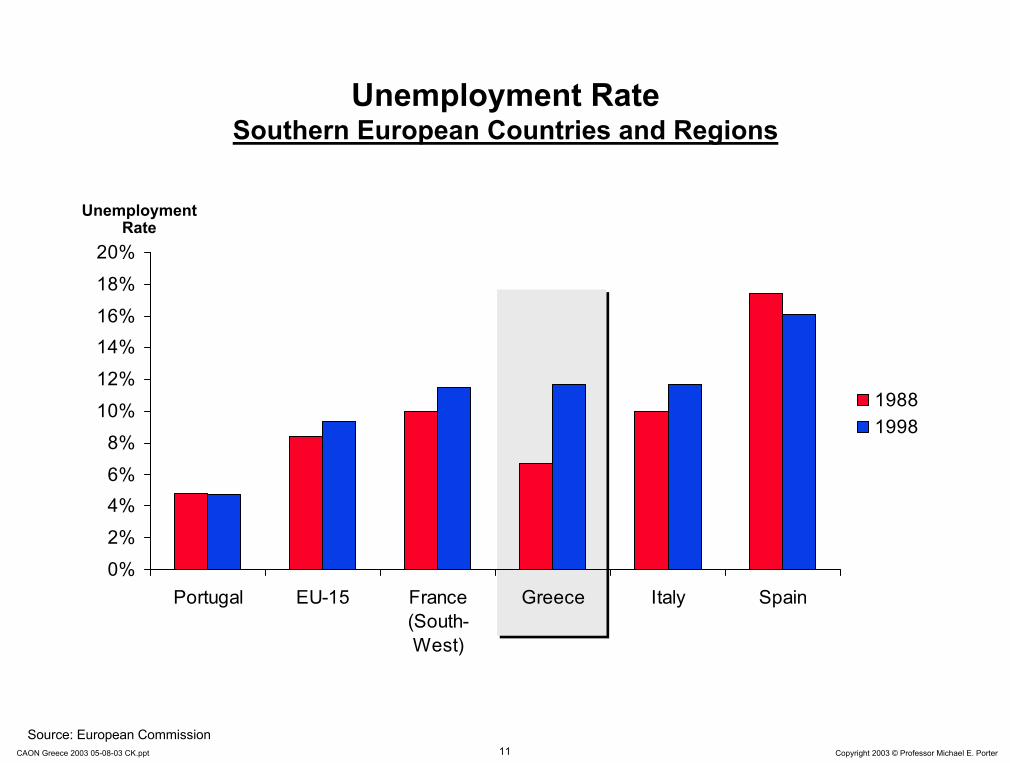
Unemployment RateSouthern European Countries and Regions
0%2%4%6%8%
10%12%14%16%18%20%
Portugal EU-15 France(South-West)
Greece Italy Spain
19881998
Unemployment Rate
Source: European Commission
12 Copyright 2003 © Professor Michael E. PorterCAON Greece 2003 05-08-03 CK.ppt
€ 0
€ 2,000
€ 4,000
€ 6,000
€ 8,000
€ 10,000
€ 12,000
€ 14,000
€ 16,000
Belgium
Netherl
ands
Irelan
dDen
markAus
triaSwed
enFinl
and
German
y UKFran
cePort
ugal
Italy
Spain
Greece
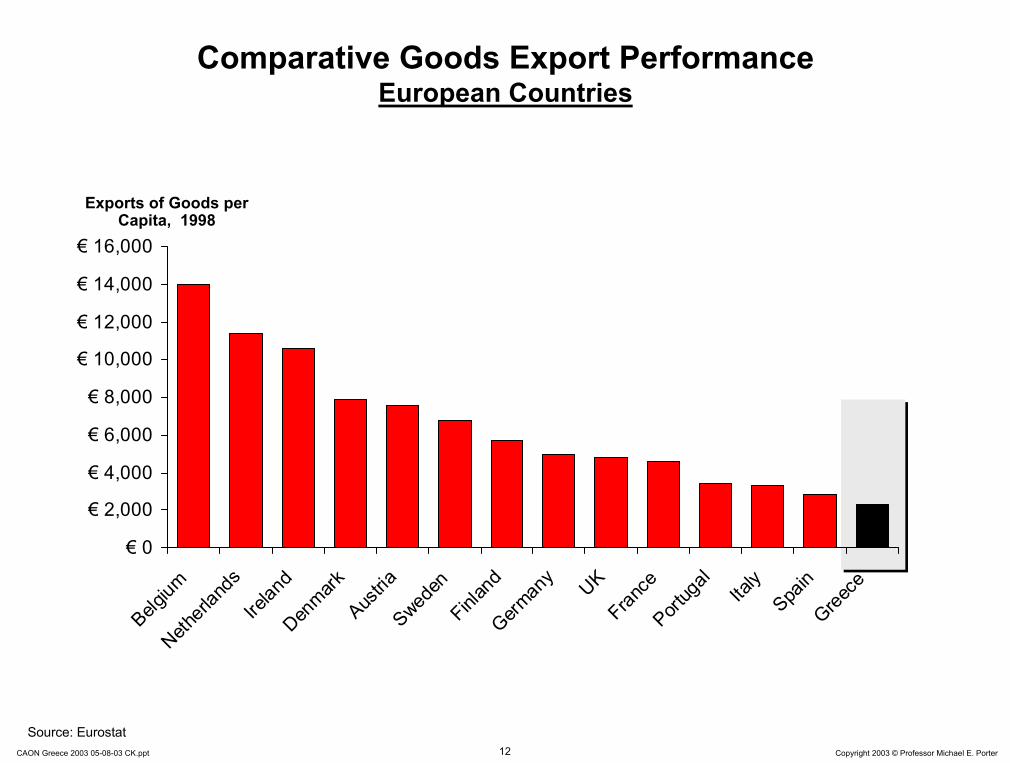
Comparative Goods Export PerformanceEuropean Countries
Exports of Goods per Capita, 1998
Source: Eurostat
13 Copyright 2003 © Professor Michael E. PorterCAON Greece 2003 05-08-03 CK.ppt
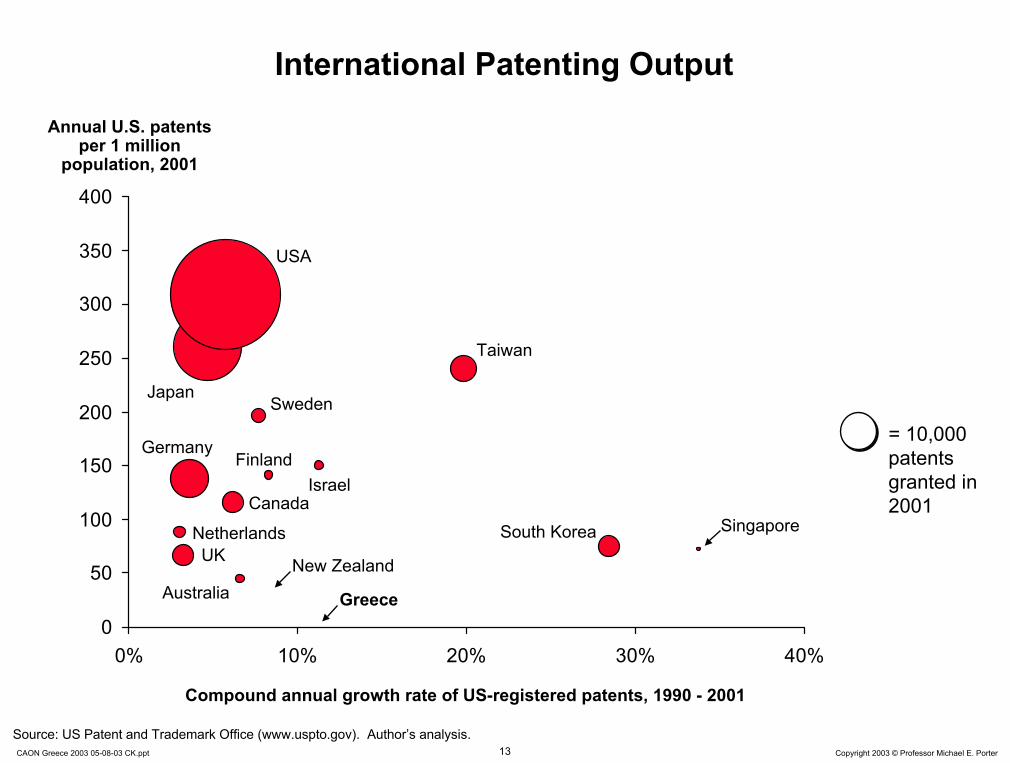
Source: US Patent and Trademark Office (www.uspto.gov). Author’s analysis.
Annual U.S. patents per 1 million
population, 2001
Compound annual growth rate of US-registered patents, 1990 - 2001
International Patenting Output
0
50
100
150
200
250
300
350
400
0% 10% 20% 30% 40%
Australia
Canada
Germany
Japan
South Korea
New Zealand
Singapore
Sweden
Taiwan
UK
Israel
= 10,000 patents granted in 2001
USA
Finland
Netherlands
Greece
14 Copyright 2003 © Professor Michael E. PorterCAON Greece 2003 05-08-03 CK.ppt
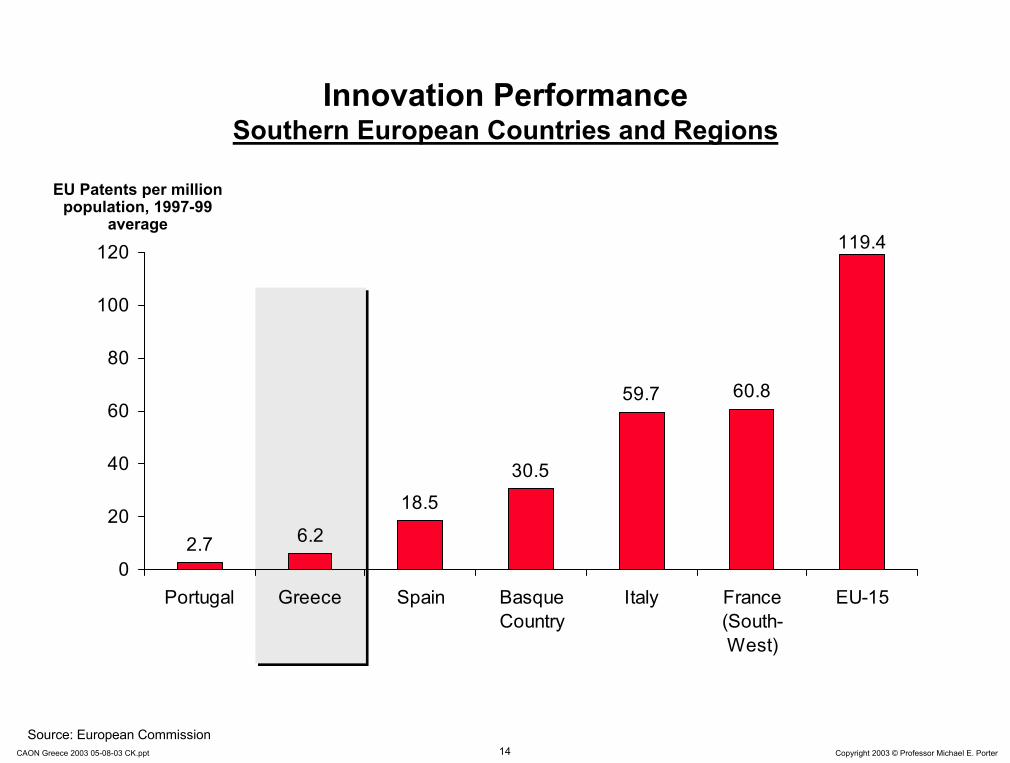
Innovation PerformanceSouthern European Countries and Regions
2.7 6.2
18.530.5
59.7 60.8
119.4
0
20
40
60
80
100
120
Portugal Greece Spain BasqueCountry
Italy France(South-West)
EU-15
EU Patents per million population, 1997-99
average
Source: European Commission

15 Copyright 2003 © Professor Michael E. PorterCAON Greece 2003 05-08-03 CK.ppt
Microeconomic Foundations of DevelopmentMicroeconomic Foundations of Development
Quality of the Microeconomic
BusinessEnvironment
Quality of the Quality of the MicroeconomicMicroeconomic
BusinessBusinessEnvironmentEnvironment
Sophisticationof Company
Operations andStrategy
SophisticationSophisticationof Companyof Company
Operations andOperations andStrategyStrategy
Determinants of Productivity and Productivity Growth
Macroeconomic, Political, Legal, and Social Context for Development
Macroeconomic, Political, Legal, and Social Macroeconomic, Political, Legal, and Social Context for DevelopmentContext for Development
• A sound macroeconomic, political, legal, and social context creates the potential for competitiveness, but is not sufficient
• Competitiveness ultimately depends on improving the microeconomic capability of the economy and the sophistication of local companies and local competition
16 Copyright 2003 © Professor Michael E. PorterCAON Greece 2003 05-08-03 CK.ppt
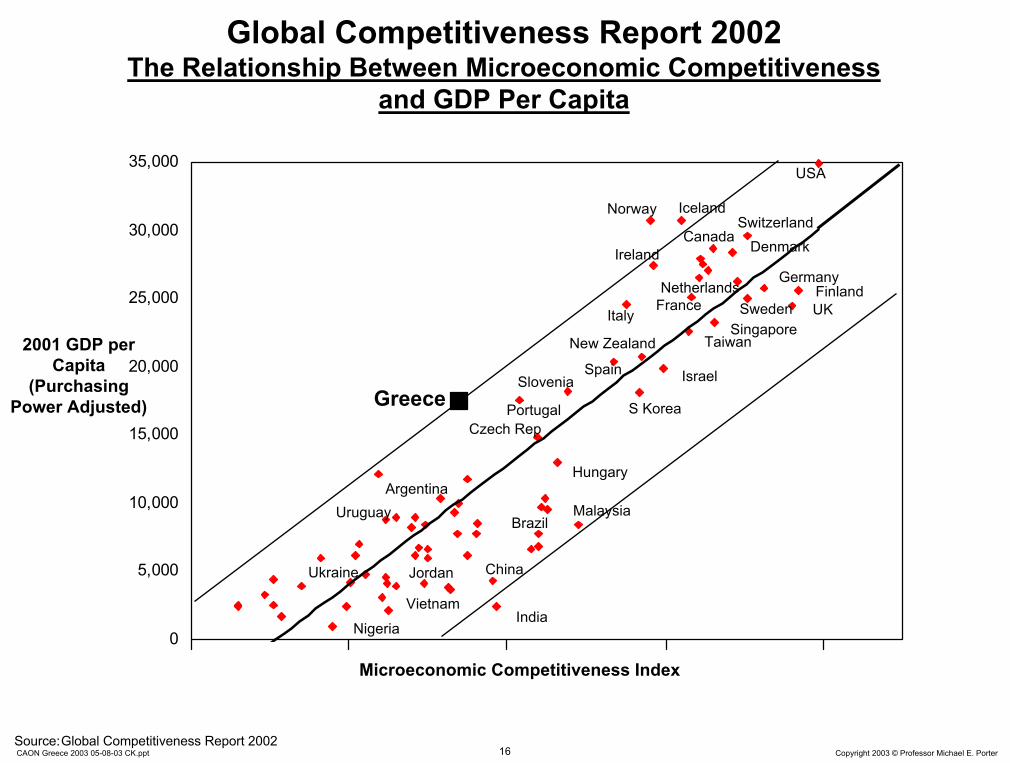
Global Competitiveness Report 2002The Relationship Between Microeconomic Competitiveness
and GDP Per Capita
0
5,000
10,000
15,000
20,000
25,000
30,000
35,000USA
FinlandNetherlandsSweden
Switzerland
Germany
UK
Denmark
SingaporeNew Zealand Taiwan
Norway Iceland
Ireland
GreeceIsrael
Italy
S Korea
Hungary
India
France
Canada
Spain
Czech Rep
Slovenia
Portugal
Microeconomic Competitiveness Index
2001 GDP per Capita
(Purchasing Power Adjusted)
BrazilMalaysia
China
Argentina
Ukraine
Vietnam
Jordan
Uruguay
Nigeria
Source:Global Competitiveness Report 2002

17 Copyright 2003 © Professor Michael E. PorterCAON Greece 2003 05-08-03 CK.ppt
Context for Firm
Strategy and Rivalry
Context for Firm
Strategy and Rivalry
Related and Supporting Industries
Related and Supporting Industries
Factor(Input)
Conditions
Factor(Input)
ConditionsDemand
ConditionsDemand
Conditions
Productivity, Innovation, and the Business Environment
• Successful economic development is a process of successive economic upgrading, in which the business environment in a nation evolves to support and encourage increasingly sophisticated ways of competing
Sophisticated and demandinglocal customer(s)Local customer needs that anticipate those elsewhereUnusual local demand in specialized segments that can be served nationally and globally
Presence of high quality, specialized inputs available to firms
–Human resources–Capital resources–Physical infrastructure–Administrative infrastructure–Information infrastructure–Scientific and technological
infrastructure–Natural resources
Access to capable, locally based suppliersand firms in related fieldsPresence of clusters instead of isolated industries
A local context and rules that encourage investment and sustained upgrading
–e.g., Intellectual property protection
Meritocratic incentive system across institutionsOpen and vigorous competition among locally based rivals

18 Copyright 2003 © Professor Michael E. PorterCAON Greece 2003 05-08-03 CK.ppt
The California Wine Cluster
Educational, Research, & Trade Organizations (e.g. Wine Institute,
UC Davis, Culinary Institutes)
Educational, Research, & Trade Organizations (e.g. Wine Institute,
UC Davis, Culinary Institutes)
Growers/VineyardsGrowers/Vineyards
Sources: California Wine Institute, Internet search, California State Legislature. Based on research by MBA 1997 students R. Alexander, R. Arney, N. Black, E. Frost, and A. Shivananda.
Wineries/ProcessingFacilities
Wineries/ProcessingFacilities
GrapestockGrapestock
Fertilizer, Pesticides, Herbicides
Fertilizer, Pesticides, Herbicides
Grape Harvesting Equipment
Grape Harvesting Equipment
Irrigation TechnologyIrrigation Technology
Winemaking Equipment
Winemaking Equipment
BarrelsBarrels
LabelsLabels
BottlesBottles
Caps and CorksCaps and Corks
Public Relations and Advertising
Public Relations and Advertising
Specialized Publications (e.g., Wine Spectator,
Trade Journal)
Specialized Publications (e.g., Wine Spectator,
Trade Journal)
Food ClusterFood Cluster
Tourism ClusterTourism ClusterCalifornia Agricultural Cluster
California Agricultural Cluster
State Government Agencies(e.g., Select Committee on Wine
Production and Economy)
19 Copyright 2003 © Professor Michael E. PorterCAON Greece 2003 05-08-03 CK.ppt
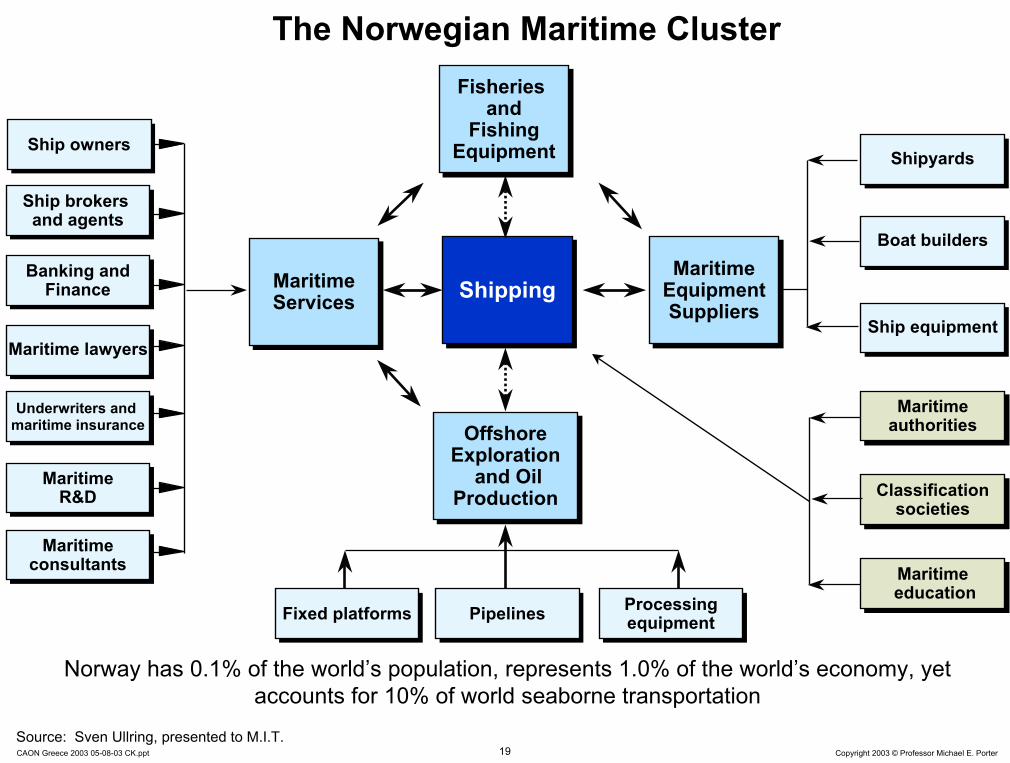
The Norwegian Maritime Cluster
Norway has 0.1% of the world’s population, represents 1.0% of the world’s economy, yet accounts for 10% of world seaborne transportation
MaritimeEquipmentSuppliers
MaritimeEquipmentSuppliers
ShippingShippingMaritimeServicesMaritimeServices
OffshoreExploration
and OilProduction
OffshoreExploration
and OilProduction
ShipyardsShipyards
Boat buildersBoat builders
Ship equipmentShip equipment
Fixed platformsFixed platforms PipelinesPipelines Processingequipment
Processingequipment
Fisheries and
FishingEquipment
Fisheries and
FishingEquipment
Ship brokers and agents
Ship brokers and agents
Banking andFinance
Banking andFinance
MaritimeeducationMaritimeeducation
Underwriters and maritime insuranceUnderwriters and
maritime insurance
Maritime lawyersMaritime lawyers
Classificationsocieties
Classificationsocieties
MaritimeR&D
MaritimeR&D
MaritimeconsultantsMaritime
consultants
Ship ownersShip owners
MaritimeauthoritiesMaritime
authorities
Source: Sven Ullring, presented to M.I.T.
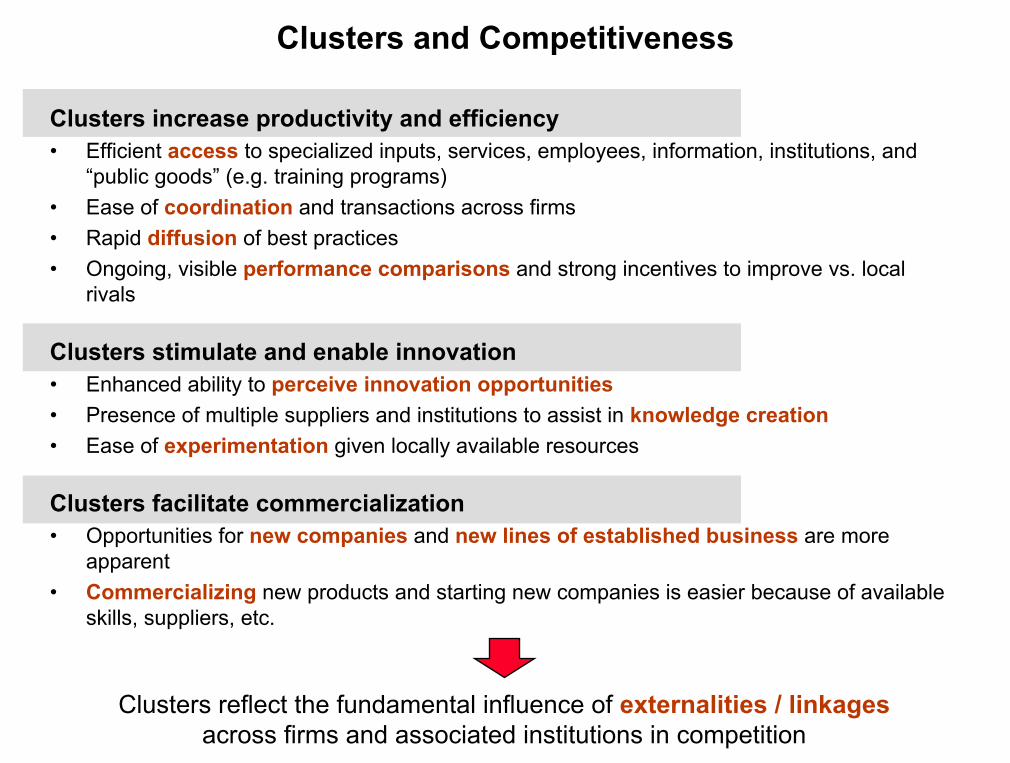
Clusters and Competitiveness
Clusters increase productivity and efficiency• Efficient access to specialized inputs, services, employees, information, institutions, and
“public goods” (e.g. training programs)• Ease of coordination and transactions across firms• Rapid diffusion of best practices• Ongoing, visible performance comparisons and strong incentives to improve vs. local
rivals
Clusters stimulate and enable innovation • Enhanced ability to perceive innovation opportunities• Presence of multiple suppliers and institutions to assist in knowledge creation• Ease of experimentation given locally available resources
Clusters facilitate commercialization• Opportunities for new companies and new lines of established business are more
apparent• Commercializing new products and starting new companies is easier because of available
skills, suppliers, etc.
Clusters reflect the fundamental influence of externalities / linkagesacross firms and associated institutions in competition
21 Copyright 2003 © Professor Michael E. PorterCAON Greece 2003 05-08-03 CK.ppt
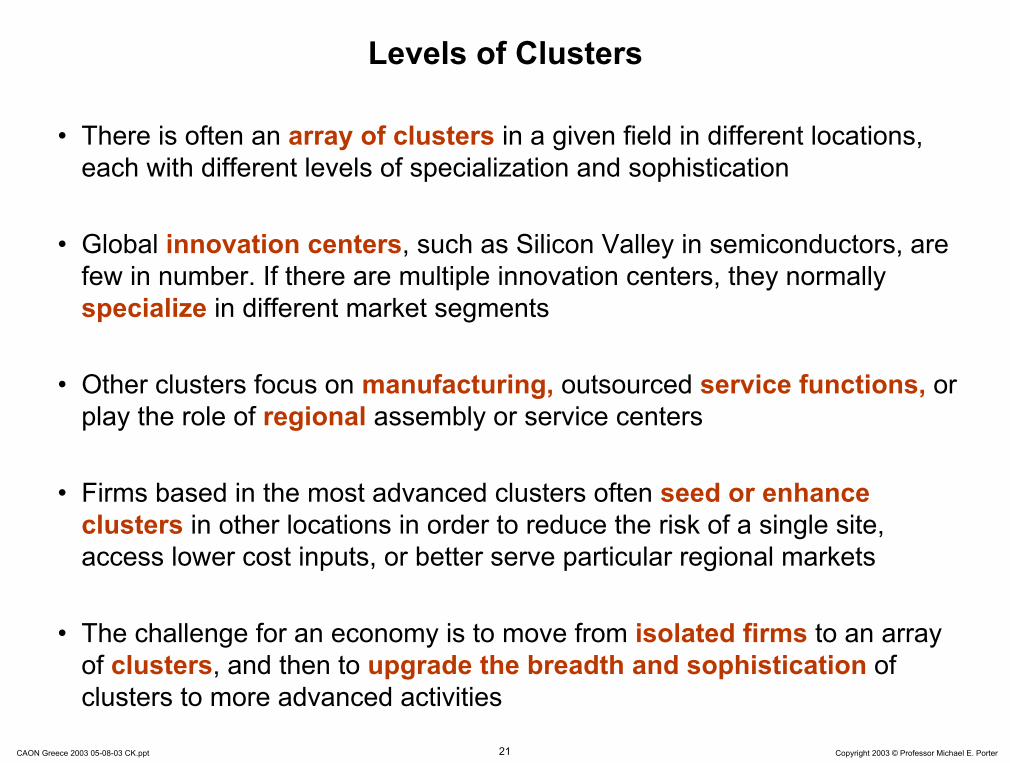
Levels of Clusters
• There is often an array of clusters in a given field in different locations, each with different levels of specialization and sophistication
• Global innovation centers, such as Silicon Valley in semiconductors, are few in number. If there are multiple innovation centers, they normally specialize in different market segments
• Other clusters focus on manufacturing, outsourced service functions, or play the role of regional assembly or service centers
• Firms based in the most advanced clusters often seed or enhance clusters in other locations in order to reduce the risk of a single site, access lower cost inputs, or better serve particular regional markets
• The challenge for an economy is to move from isolated firms to an array of clusters, and then to upgrade the breadth and sophistication of clusters to more advanced activities
22 Copyright 2003 © Professor Michael E. PorterCAON Greece 2003 05-08-03 CK.ppt
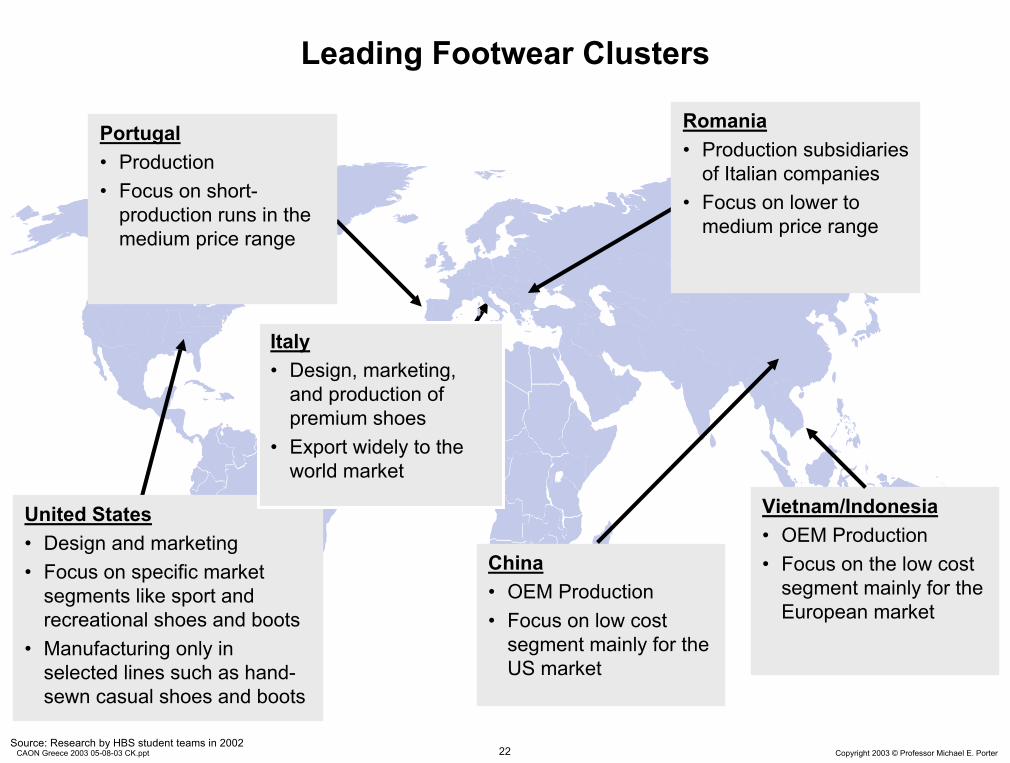
Leading Footwear Clusters
Vietnam/Indonesia• OEM Production • Focus on the low cost
segment mainly for the European market
China• OEM Production• Focus on low cost
segment mainly for the US market
Portugal• Production • Focus on short-
production runs in the medium price range
Romania• Production subsidiaries
of Italian companies• Focus on lower to
medium price range
United States• Design and marketing • Focus on specific market
segments like sport and recreational shoes and boots
• Manufacturing only in selected lines such as hand-sewn casual shoes and boots
Source: Research by HBS student teams in 2002
Italy• Design, marketing,
and production of premium shoes
• Export widely to the world market
23 Copyright 2003 © Professor Michael E. PorterCAON Greece 2003 05-08-03 CK.ppt
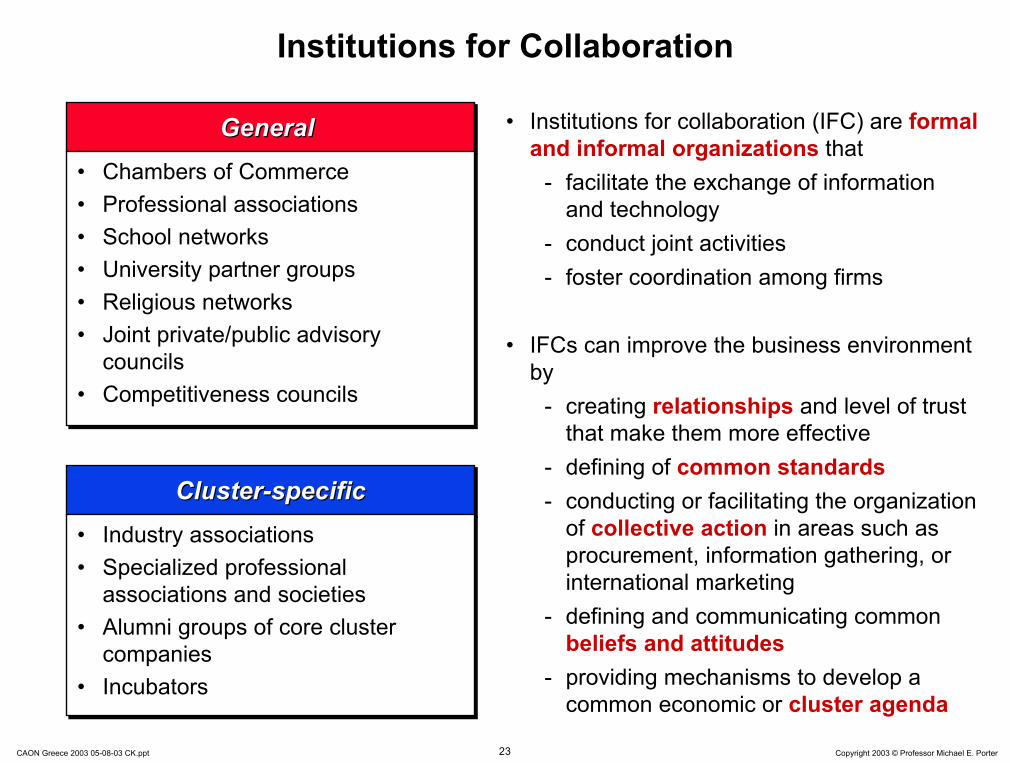
General General General
• Chambers of Commerce• Professional associations• School networks • University partner groups• Religious networks• Joint private/public advisory
councils• Competitiveness councils
• Chambers of Commerce• Professional associations• School networks • University partner groups• Religious networks• Joint private/public advisory
councils• Competitiveness councils
Cluster-specificClusterCluster--specificspecific
• Industry associations• Specialized professional
associations and societies• Alumni groups of core cluster
companies• Incubators
• Industry associations• Specialized professional
associations and societies• Alumni groups of core cluster
companies• Incubators
Institutions for Collaboration
• Institutions for collaboration (IFC) are formal and informal organizations that
- facilitate the exchange of information and technology
- conduct joint activities- foster coordination among firms
• IFCs can improve the business environment by
- creating relationships and level of trust that make them more effective
- defining of common standards- conducting or facilitating the organization
of collective action in areas such as procurement, information gathering, or international marketing
- defining and communicating common beliefs and attitudes
- providing mechanisms to develop a common economic or cluster agenda

Institutions for CollaborationSelected Institutions for Collaboration, San Diego
Source: Clusters of Innovation project (www.compete.org)
GeneralGeneral
San Diego Chamber of Commerce
San Diego MIT Enterprise Forum
Corporate Director’s Forum
San Diego Dialogue
Service Corps of Retired Executives, San Diego
San Diego Regional Economic Development Corporation
Center for Applied Competitive Technologies
San Diego World Trade Center
UCSD Alumni
San Diego Regional Technology Alliance
San Diego Science and Technology Council
Office of Trade and Business Development
Cluster-SpecificCluster-Specific
Telecommunication
Linkabit Alumni
Biotech
Hybritech Alumni
Scripps Research Institute Alumni
BIOCOMM
UCSD Connect
Telecommunication
Linkabit Alumni
Biotech
Hybritech Alumni
Scripps Research Institute Alumni
BIOCOMM
UCSD Connect

25 Copyright 2003 © Professor Michael E. PorterCAON Greece 2003 05-08-03 CK.ppt
Stages Of Competitive Development
Factor-Driven Economy
FactorFactor--Driven Driven EconomyEconomy
Investment-Driven Economy
InvestmentInvestment--Driven EconomyDriven Economy
Innovation-Driven Economy
InnovationInnovation--Driven EconomyDriven Economy
Source: Porter, Michael E., The Competitive Advantage of Nations, The Free Press: New York (1990)
Low InputCost
Efficiency Through Heavy Investment
Unique Value

26 Copyright 2003 © Professor Michael E. PorterCAON Greece 2003 05-08-03 CK.ppt
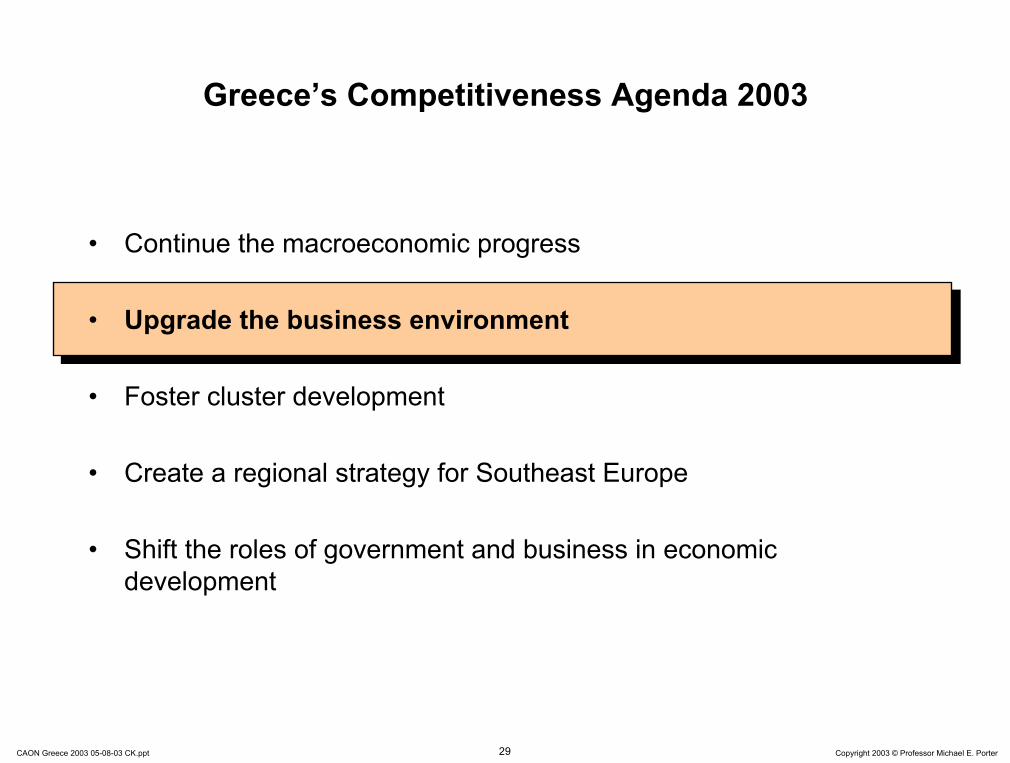
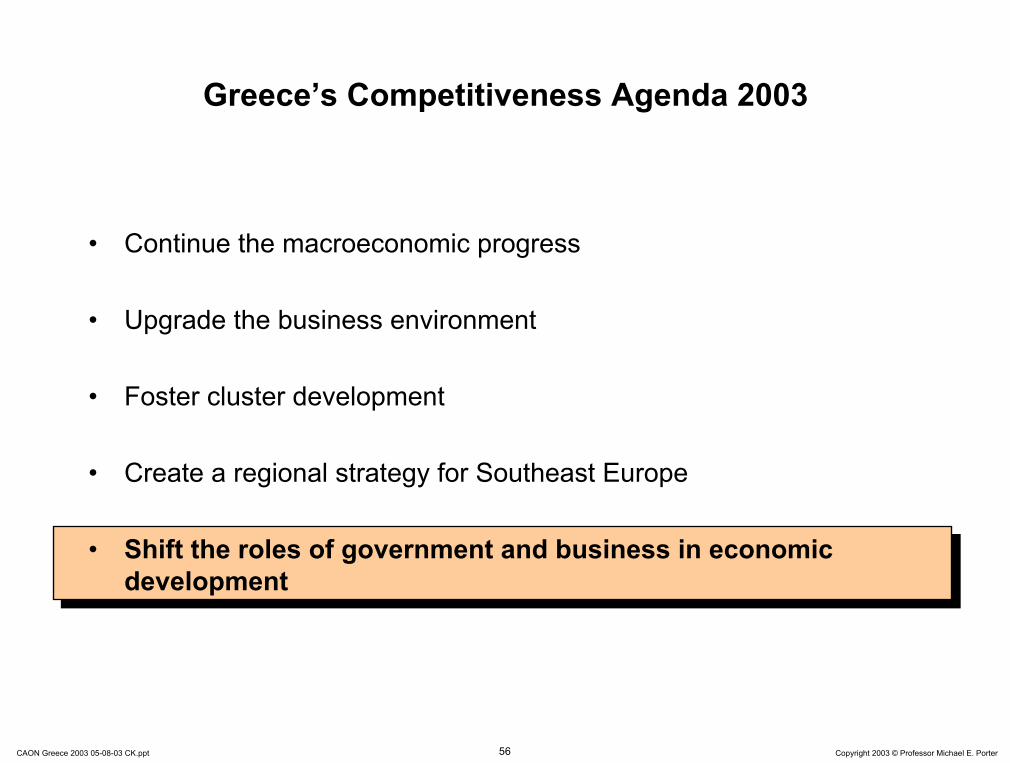
Greece’s Competitiveness Agenda 2003
• Continue the macroeconomic progress
• Upgrade the business environment
• Foster cluster development
• Create a regional strategy for Southeast Europe
• Shift the roles of government and business in economic development
27 Copyright 2003 © Professor Michael E. PorterCAON Greece 2003 05-08-03 CK.ppt
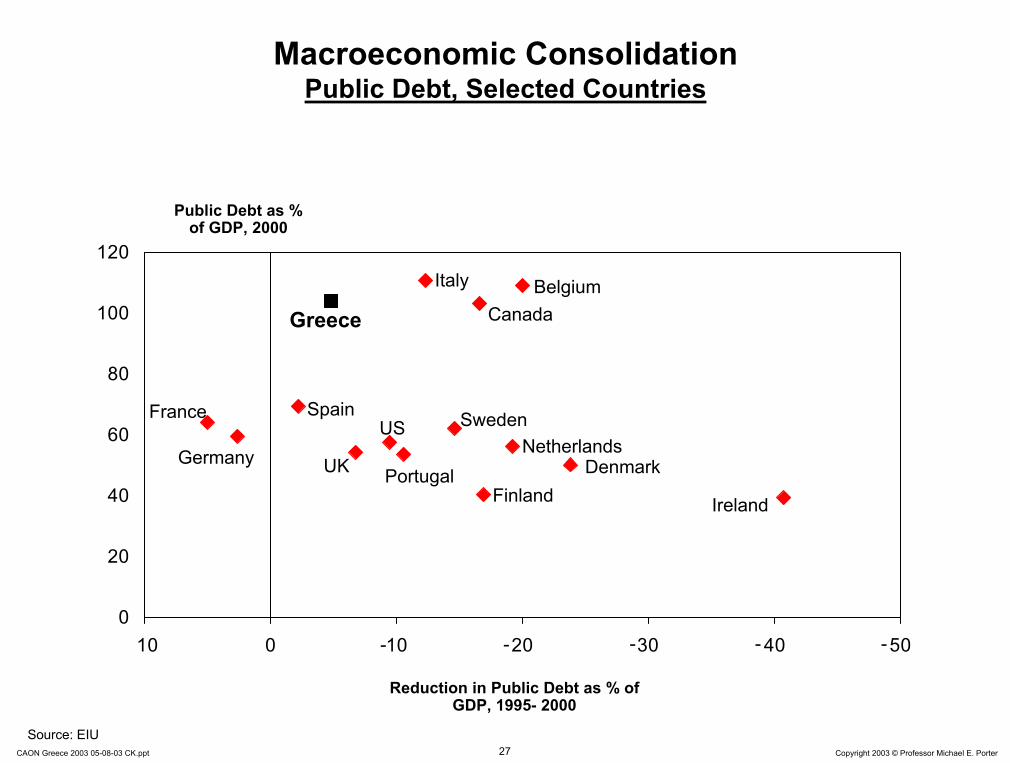
Macroeconomic ConsolidationPublic Debt, Selected Countries
0
20
40
60
80
100
120
-10 0 10 20 30 40 50
Public Debt as % of GDP, 2000
Reduction in Public Debt as % of GDP, 1995- 2000
Portugal
Source: EIU
Ireland
CanadaBelgium
Greece
Italy
SpainFrance SwedenUSGermany Denmark
NetherlandsUK
Finland
- - - - -

28 Copyright 2003 © Professor Michael E. PorterCAON Greece 2003 05-08-03 CK.ppt
Micro reform is impeded
by macro economic
volatility that
reduces company
investment
Macro reform alone leads to short term capital inflows and growth spurts that ultimately are not sustainable
Integration of Macro- and Microeconomic Reforms
Macroeconomic Macroeconomic reformreform
Microeconomic Microeconomic reformreform
Create the opportunityfor productivity
Required to achieveproductivity
Productivity growth allows economic growth and rising incomes without inflation, making macroeconomic
stability easier to achieve
Stability and confidence support investment and upgrading
29 Copyright 2003 © Professor Michael E. PorterCAON Greece 2003 05-08-03 CK.ppt
Greece’s Competitiveness Agenda 2003
• Continue the macroeconomic progress
• Upgrade the business environment
• Foster cluster development
• Create a regional strategy for Southeast Europe
• Shift the roles of government and business in economic development

30 Copyright 2003 © Professor Michael E. PorterCAON Greece 2003 05-08-03 CK.ppt
Factor (Input) ConditionsGreece’s Relative Position
Factor(Input)
Conditions
Factor(Input)
Conditions
Availability of Scientists and Engineers 21
Ease of Access to Loans 31
University/Industry Research Collaboration 34
Judicial Independence 36
Local Equity Market Access 36
Telephone/Fax Infrastructure Quality 38
Venture Capital Availability 38
Financial Market Sophistication 40
Extent of Bureaucratic Red Tape 41
Intellectual Property Protection 41
Competitive Disadvantages Relative to GDP per Capita
Competitive Advantages Relative to GDP per Capita
Quality of Management Schools 62
Administrative Burden for Start-Ups 61
Quality of Public Schools 52
Quality of Scientific Research Institutions 51
Electricity Supply Quality 49
Overall Infrastructure Quality 48
Port Infrastructure Quality 48
Railroad Infrastructure Quality 48
Police Protection of Businesses 47
Adequacy of Public Sector Legal Recourse43
Air Transport Infrastructure Quality 43
Quality of Math and Science Education 42
Note: Rank by countries; overall Greece ranks 43 out of 80 countries (41 on National Business Environment, 28 on GDP pc 2001)Source: Global Competitiveness Report 2002
Country Ranking, Arrows indicate a change of 5 or more
ranks since 1998
Country Ranking, Arrows indicate a change of 5 or more
ranks since 1998

31 Copyright 2003 © Professor Michael E. PorterCAON Greece 2003 05-08-03 CK.ppt
Educational AttainmentSouthern European Countries and Regions
32% 36%49% 52% 54%
62%78%
46% 43%33%
18%
36% 16%
12%22% 21% 18%
30%
10%22%
10%
0%
10%
20%
30%
40%
50%
60%
70%
80%
90%
100%
France(South-West)
EU-15 Greece Basque Italy Spain Portugal
HighMediumLow
Share of 25-59 year old by level of educational attainment
Source: European Commission
Factor(Input)
Conditions
Factor(Input)
Conditions
32 Copyright 2003 © Professor Michael E. PorterCAON Greece 2003 05-08-03 CK.ppt
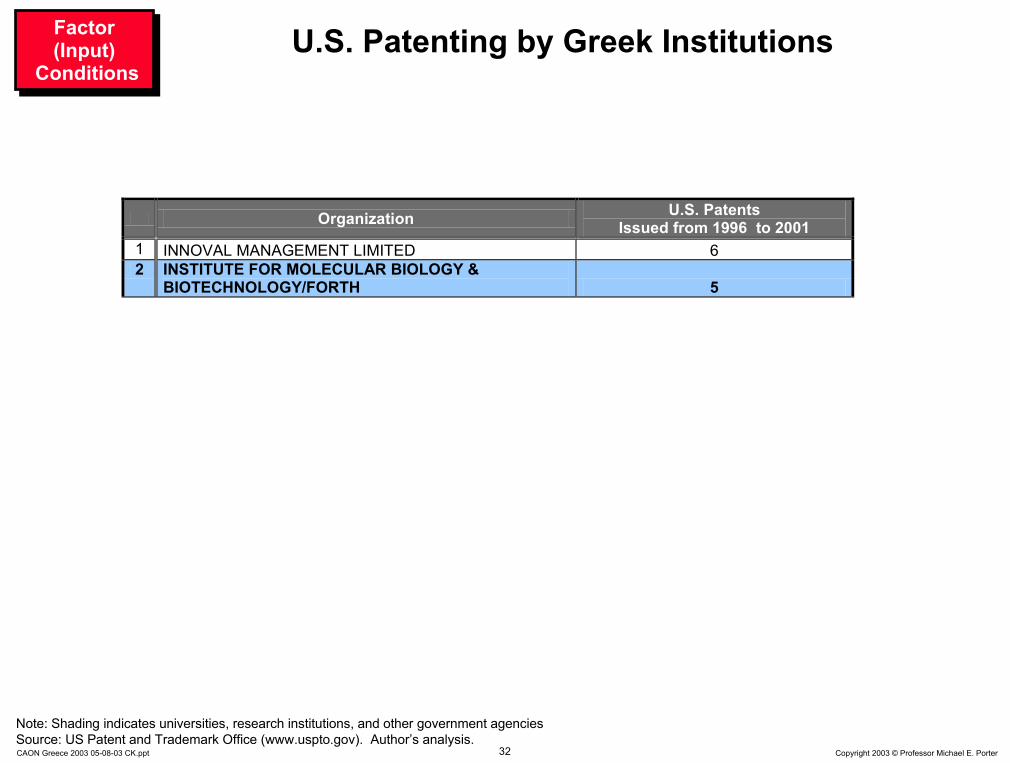
U.S. Patenting by Greek Institutions
Organization U.S. Patents Issued from 1996 to 2001
1 INNOVAL MANAGEMENT LIMITED 6 2 INSTITUTE FOR MOLECULAR BIOLOGY &
BIOTECHNOLOGY/FORTH 5
Note: Shading indicates universities, research institutions, and other government agencies Source: US Patent and Trademark Office (www.uspto.gov). Author’s analysis.
Factor(Input)
Conditions
Factor(Input)
Conditions

33 Copyright 2003 © Professor Michael E. PorterCAON Greece 2003 05-08-03 CK.ppt
Patents by OrganizationCommonwealth of Massachusetts
Organization Patents Issued from 1997 to 2001 1 MASSACHUSETTS INSTITUTE OF TECHNOLOGY 518 2 GENERAL HOSPITAL CORPORATION 296 3 EMC CORPORATION 269 4 DIGITAL EQUIPMENT CORPORATION 261 5 POLAROID CORPORATION 213 6 ANALOG DEVICES, INC. 167 7 MILLENNIUM PHARMACEUTICALS, INC. 165 8 HARVARD UNIVERSITY 150 9 COMPAQ COMPUTER CORPORATION, INC. 147 10 SUN MICROSYSTEMS, INC. 143 11 BOSTON SCIENTIFIC CORPORATION 135 12 ACUSHNET COMPANY 130 13 GENETICS INSTITUTE, INC. 127 14 GILLETTE COMPANY 112 15 BRIGHAM AND WOMEN'S HOSPITAL 107 16 RAYTHEON COMPANY 101 17 GENERAL ELECTRIC COMPANY 99 18 HEWLETT-PACKARD COMPANY 96 19 CHILDREN'S MEDICAL CENTER CORPORATION 93 20 QUANTUM CORP. (CA) 93 21 COGNEX CORPORATION 90 22 DANA-FARBER CANCER INSTITUTE 90 23 JOHNSON & JOHNSON PROFESSIONAL INC. 90 24 BOSTON UNIVERSITY 84 25 SEPRACOR INC. 84
Note: Shading indicates universities, research institutions, and other government agencies Source: US Patent and Trademark Office (www.uspto.gov). Author’s analysis.

34 Copyright 2003 © Professor Michael E. PorterCAON Greece 2003 05-08-03 CK.ppt
Public R&D Spending as % of GDP, 2001 (or last available)
Source: EU Scoreboard
Government R&D Spending Selected European Countries
0.2%
0.3%
0.4%
0.5%
0.6%
0.7%
0.8%
0.9%
1.0%
-10% -5% 0% 5% 10% 15%
Change of Public R&D Spending as % of GDP, last three years
Germany Denmark
Sweden
UK
France
Finland
Netherlands
Slovakia
Greece
LatviaIreland
BulgariaSpain Hungary
Poland
Estonia ItalyLithuania
Czech Rep.Belgium
PortugalSlovenia
Factor(Input)
Conditions
Factor(Input)
Conditions
35 Copyright 2003 © Professor Michael E. PorterCAON Greece 2003 05-08-03 CK.ppt
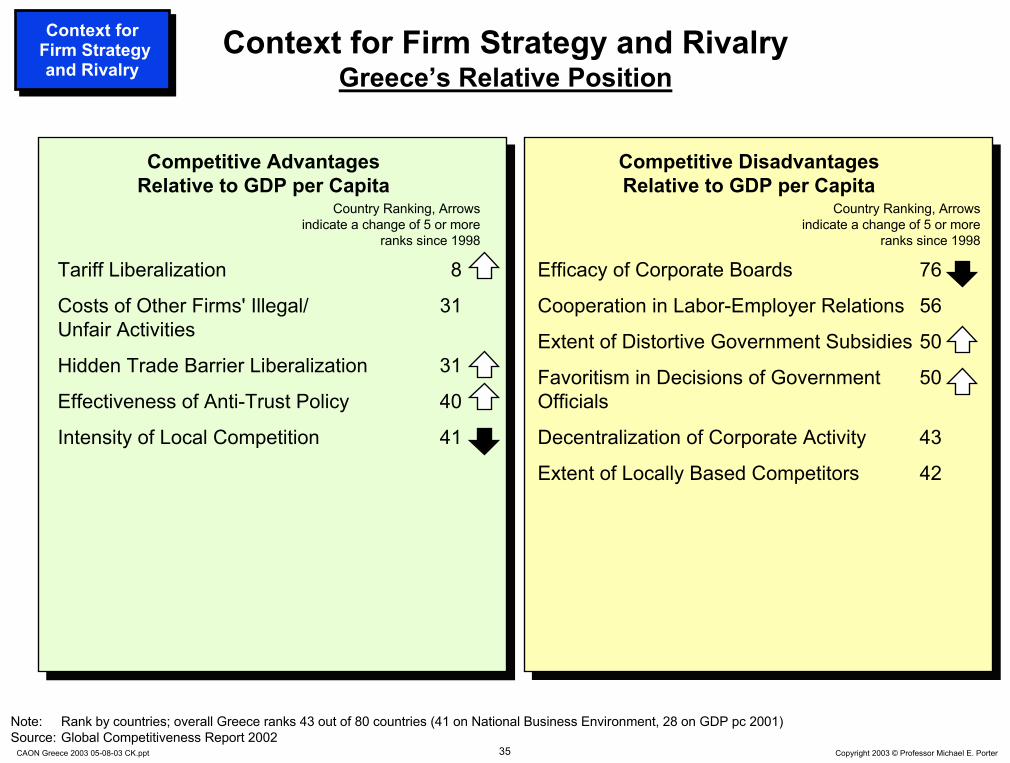
Context for Firm Strategy and RivalryGreece’s Relative Position
Tariff Liberalization 8
Costs of Other Firms' Illegal/ 31Unfair Activities
Hidden Trade Barrier Liberalization 31
Effectiveness of Anti-Trust Policy 40
Intensity of Local Competition 41
Competitive Disadvantages Relative to GDP per Capita
Competitive Advantages Relative to GDP per Capita
Efficacy of Corporate Boards 76
Cooperation in Labor-Employer Relations 56
Extent of Distortive Government Subsidies 50
Favoritism in Decisions of Government 50 Officials
Decentralization of Corporate Activity 43
Extent of Locally Based Competitors 42
Context for Firm Strategy and Rivalry
Context for Firm Strategy and Rivalry
Country Ranking, Arrows indicate a change of 5 or more
ranks since 1998
Country Ranking, Arrows indicate a change of 5 or more
ranks since 1998
Note: Rank by countries; overall Greece ranks 43 out of 80 countries (41 on National Business Environment, 28 on GDP pc 2001)Source: Global Competitiveness Report 2002
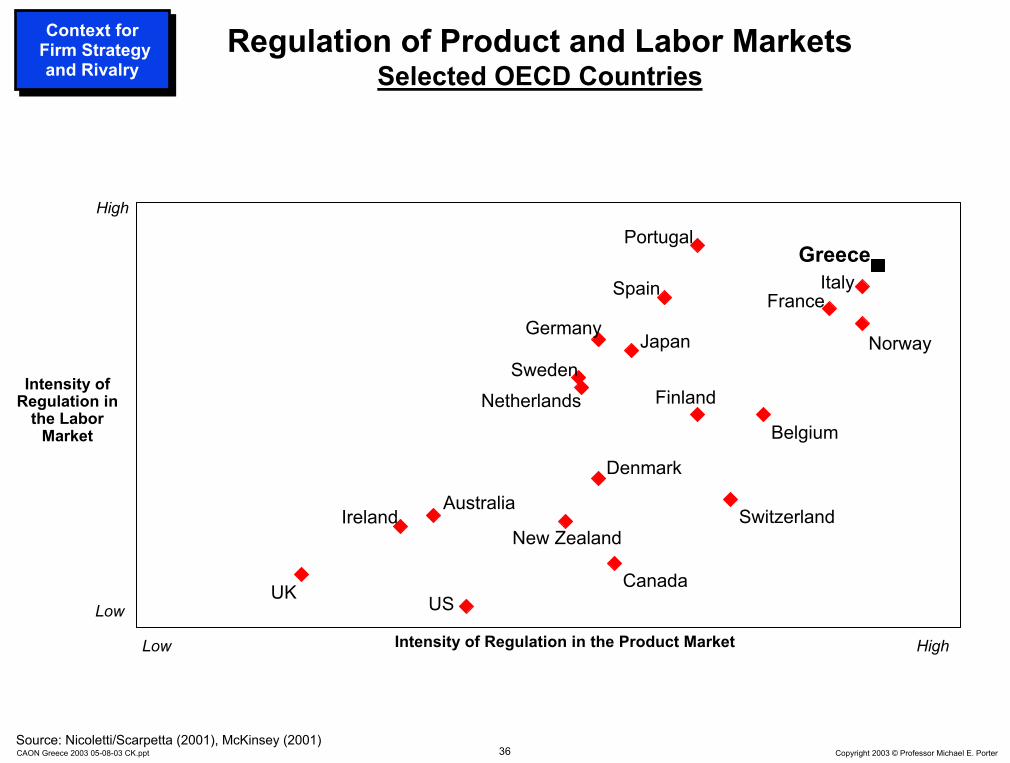
36 Copyright 2003 © Professor Michael E. PorterCAON Greece 2003 05-08-03 CK.ppt
Spain France
Australia
New ZealandIreland
Sweden
UK CanadaUS
Finland
Regulation of Product and Labor MarketsSelected OECD Countries
Denmark
Germany
GreeceItaly
Japan
Netherlands
Norway
Portugal
Switzerland
Intensity of Regulation in the Product Market
Intensity of Regulation in
the Labor Market
Low
Low
High
High
Source: Nicoletti/Scarpetta (2001), McKinsey (2001)
Belgium
Context for Firm Strategy and Rivalry
Context for Firm Strategy and Rivalry
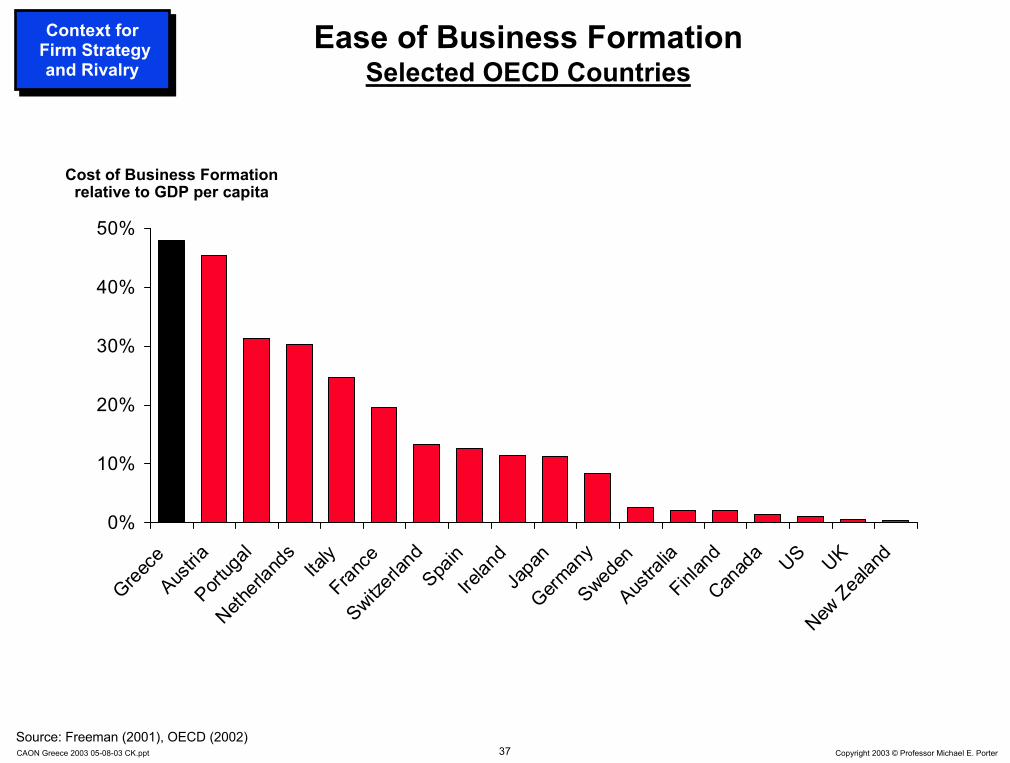
37 Copyright 2003 © Professor Michael E. PorterCAON Greece 2003 05-08-03 CK.ppt
Ease of Business FormationSelected OECD Countries
0%
10%
20%
30%
40%
50%
Greece
Austria
Portug
alNeth
erlan
ds Italy
France
Switzerl
and
Spain
Irelan
dJa
pan
German
ySwed
enAus
tralia
Finlan
dCan
ada US UK
New Zea
land
Cost of Business Formation relative to GDP per capita
Source: Freeman (2001), OECD (2002)
Context for Firm Strategy and Rivalry
Context for Firm Strategy and Rivalry

38 Copyright 2003 © Professor Michael E. PorterCAON Greece 2003 05-08-03 CK.ppt
Demand ConditionsGreece’s Relative Position
Buyer Sophistication 37
Competitive Disadvantages Relative to GDP per Capita
Competitive Advantages Relative to GDP per Capita
Laws Relating to Information Technology 67
Government Procurement of Advanced 56 Technology Products
Consumer Adoption of Latest Products 52
Stringency of Environmental Regulations 50
Demand ConditionsDemand
Conditions
Country Ranking, Arrows indicate a change of 5 or more
ranks since 1998
Country Ranking, Arrows indicate a change of 5 or more
ranks since 1998
Note: Rank by countries; overall Greece ranks 43 out of 80 countries (41 on National Business Environment, 28 on GDP pc 2001)Source: Global Competitiveness Report 2002

39 Copyright 2003 © Professor Michael E. PorterCAON Greece 2003 05-08-03 CK.ppt
Related and Supporting IndustriesGreece’s Relative Position
Competitive Disadvantages Relative to GDP per Capita
Competitive Advantages Relative to GDP per Capita
Related and Supporting Industries
Related and Supporting Industries
State of Cluster Development 67
Extent of Product and Process 65 Collaboration
Local Availability of Components 60and Parts
Local Availability of Specialized 57 Research and Training Services
Local Availability of Process Machinery 54
Local Supplier Quality 49
Local Supplier Quantity 47
Country Ranking, Arrows indicate a change of 5 or more
ranks since 1998
Country Ranking, Arrows indicate a change of 5 or more
ranks since 1998
Note: Rank by countries; overall Greece ranks 43 out of 80 countries (41 on National Business Environment, 28 on GDP pc 2001)Source: Global Competitiveness Report 2002

40 Copyright 2003 © Professor Michael E. PorterCAON Greece 2003 05-08-03 CK.ppt
Company Operations and StrategyGreece’s Relative Position 2002
Extent of Marketing 30
Control of International Distribution 38
Value Chain Presence 40
Production Process Sophistication 42
Competitive Disadvantages Relative to GDP per Capita
Competitive Advantages Relative to GDP per Capita
Note: Rank by countries; overall the Greece ranks 43 out of 80 countries (47 on Company Operations and Strategy, 28 on GDP pc 2001)Source: Global Competitiveness Report 2002
Country Ranking, Arrows indicate a change of 5 or more
ranks since 1998
Country Ranking, Arrows indicate a change of 5 or more
ranks since 1998
Reliance on Professional Management 67
Willingness to Delegate Authority 63
Capacity for Innovation 57
Extent of Staff Training 57
Company Spending on R&D 56
Breadth of International Markets 47
Extent of Branding 47
Extent of Incentive Compensation 47
Degree of Customer Orientation 44
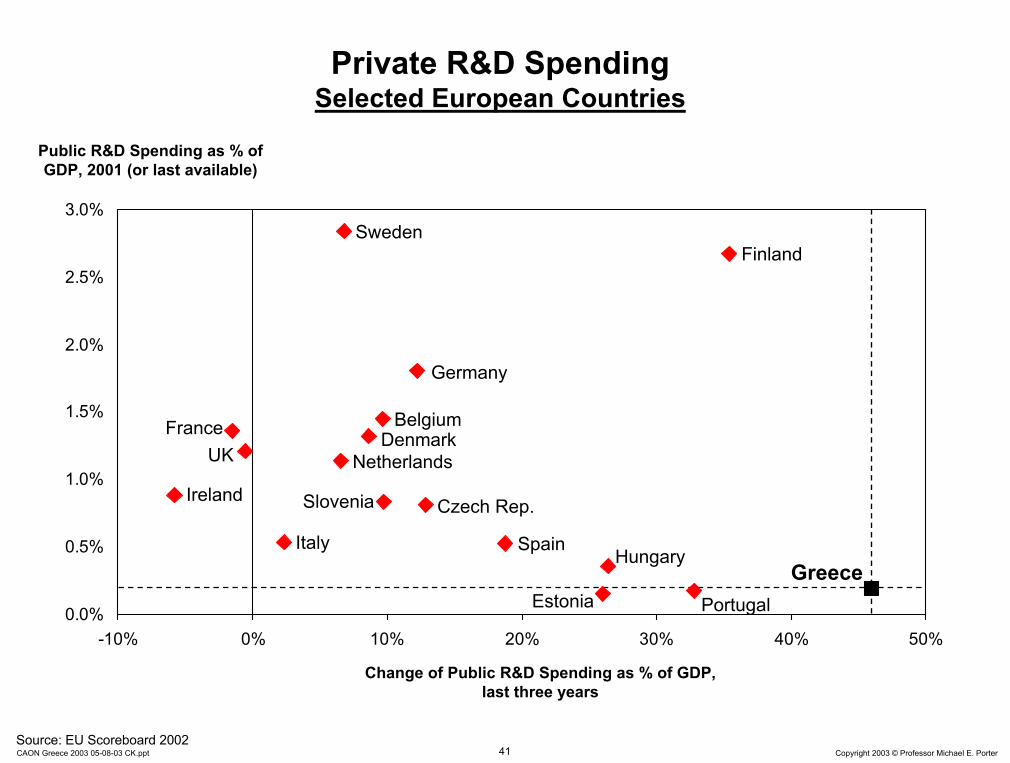
41 Copyright 2003 © Professor Michael E. PorterCAON Greece 2003 05-08-03 CK.ppt
Public R&D Spending as % of GDP, 2001 (or last available)
Source: EU Scoreboard 2002
Private R&D Spending Selected European Countries
0.0%
0.5%
1.0%
1.5%
2.0%
2.5%
3.0%
-10% 0% 10% 20% 30% 40% 50%
Change of Public R&D Spending as % of GDP, last three years
Germany
Denmark
Sweden
UKFrance
Finland
Netherlands
Greece
Ireland
SpainHungary
Estonia
Italy
Czech Rep.
Belgium
Portugal
Slovenia

42 Copyright 2003 © Professor Michael E. PorterCAON Greece 2003 05-08-03 CK.ppt
Greece’s Competitiveness Agenda 2003
• Continue the macroeconomic progress
• Upgrade the business environment
• Foster cluster development
• Create a regional strategy for Southeast Europe
• Shift the roles of government and business in economic development

43 Copyright 2003 © Professor Michael E. PorterCAON Greece 2003 05-08-03 CK.ppt
Greece’s average change in world goods export share:
- 0.03%
Greece’s average goods export share: 0.19%
0.0%
0.1%
0.2%
0.3%
0.4%
0.5%
0.6%
0.7%
-0.3% -0.2% -0.1% 0.0% 0.1% 0.2%
Source: UNCTAD Trade Data. Author’s analysis.
Change in Greece’s World Export Share, 1995 - 2000
Greek Export Performance By Broad Sector1995-2000
Power Health Care
Food/Beverages
EntertainmentOffice
Personal
Textiles/Apparel
Transportation
Multiple Business
DD = $500 million export volume in 2000
+
Petroleum/Chemicals
Materials/Metals
+
World Export Share, 2000
Housing/Household
• Greece is loosing position in some of its largest export clusters
Information Technology
Telecommunications

44 Copyright 2003 © Professor Michael E. PorterCAON Greece 2003 05-08-03 CK.ppt
$0
$200
$400
$600
$800
$1,000
$1,200
$1,400
$1,600
$1,800
$2,000
-15% -10% -5% 0% 5% 10% 15%
Source: World Tourism Organization
Change in %CAGR of Tourism Receipts per Capita, 1997-2000
Tourism Cluster Performance
+++
Tourism Receipts per Capita, 2000
• Greece has a strong tourism cluster that increased revenues per tourists in the last few years
Switzerland
Australia
Germany
United States
France
GreeceItaly
Hong Kong
Turkey
Mexico
UKSpain
China
CanadaAustria
= 2.5% World Market Share

45 Copyright 2003 © Professor Michael E. PorterCAON Greece 2003 05-08-03 CK.ppt
Public / Private Cooperation in Cluster UpgradingMinnesota’s Medical Device Cluster
Context for Firm
Strategy and Rivalry
Context for Firm
Strategy and Rivalry
Related and Supporting Industries
Related and Supporting Industries
Factor(Input)
Conditions
Factor(Input)
ConditionsDemand
ConditionsDemand
Conditions
• Joint development of vocational-technical college curricula with the medical device industry
• Minnesota Project Outreach exposes businesses to resources available at university and state government agencies
• Active medical technology licensing through University of Minnesota
• State-formed Greater Minnesota Corp. to finance applied research, invest in new products, and assist in technology transfer
• State sanctioned reimbursement policiesto enable easier adoption and reimbursement for innovative products
• Aggressive trade associations(Medical Alley Association, High Tech Council)
• Effective global marketing of the cluster and of Minnesota as the “The Great State of Health”
• Full-time “Health Care Industry Specialist” in the department of Trade and Economic Development

46 Copyright 2003 © Professor Michael E. PorterCAON Greece 2003 05-08-03 CK.ppt
$0
$100
$200
$300
$400
$500
$600
$700
$800
$900
$1,000
1995 1996 1997 1998 1999 20000%
1%
2%
3%
4%
5%
6%
7%
8%
ValueMarket Share
The Australian Wine ClusterTrade Performance
Source: UN Trade Statistics
Australian Wine Exports in million US
DollarsAustralian Wine
World Export Market Share

47 Copyright 2003 © Professor Michael E. PorterCAON Greece 2003 05-08-03 CK.ppt
The Australian Wine ClusterHistory
1955
Australian Wine Research Institute founded
1970
Winemaking school at Charles Sturt University founded
1980
Australian Wine and Brandy Corporation established
1965
Australian Wine Bureau established
1930
First oenology course at Roseworthy Agricultural College
1950s
Import of European winery technology
1960s
Recruiting of experienced foreign investors, e.g. Wolf Bass
1990s
Surge in exports and international acquisitions
1980s
Creation of large number of new wineries
1970s
Continued inflow of foreign capital and management
1990
Winemaker’s Federation of Australia established
1991 to 1998
New organizations created for education, research, market information, and export promotions
Source: Michael E. Porter and Örjan Sölvell, The Australian Wine Cluster – Supplement, Harvard Business School Case Study, 2002

48 Copyright 2003 © Professor Michael E. PorterCAON Greece 2003 05-08-03 CK.ppt
The Australian Wine ClusterRecently founded Institutions for Collaboration
Wine Industry National Education and Training Council
Wine Industry National Wine Industry National Education and Training CouncilEducation and Training Council
Established in 1995
Focus: Coordination, integration, and standard maintenance for vocational training and education
Funding: Government; other cluster organizations
Established in 1995
Focus: Coordination, integration, and standard maintenance for vocational training and education
Funding: Government; other cluster organizations
Cooperative Centre for ViticultureCooperative Cooperative Centre Centre for Viticulturefor Viticulture
Established in 1991
Focus: Coordination of research and education policy in viticulture
Funding: other cluster organizations
Established in 1991
Focus: Coordination of research and education policy in viticulture
Funding: other cluster organizations
Australian Wine Export CouncilAustralian Wine Export CouncilAustralian Wine Export Council
Established in 1992
Focus: Wine export promotion through international offices in London and San Francisco
Funding: Government; cluster organizations
Established in 1992
Focus: Wine export promotion through international offices in London and San Francisco
Funding: Government; cluster organizations
Winemakers’ Federation of AustraliaWinemakers’ Federation of AustraliaWinemakers’ Federation of Australia
Established in 1990
Focus: Public policy representation of companies in the wine cluster
Funding: Member companies
Established in 1990
Focus: Public policy representation of companies in the wine cluster
Funding: Member companies
Grape and Wine R&D CorporationGrape and Wine R&D CorporationGrape and Wine R&D Corporation
Established in 1991 as statutory body
Focus: Funding of research and development activities
Funding: Government; statutory levy
Established in 1991 as statutory body
Focus: Funding of research and development activities
Funding: Government; statutory levy
Wine Industry Information ServiceWine Industry Information ServiceWine Industry Information Service
Established in 1998
Focus: Information collection, organization, and dissemination
Funding: Cluster organizations
Established in 1998
Focus: Information collection, organization, and dissemination
Funding: Cluster organizations
Source: Michael E. Porter and Örjan Sölvell, The Australian Wine Cluster – Supplement, Harvard Business School Case Study, 2002

49 Copyright 2003 © Professor Michael E. PorterCAON Greece 2003 05-08-03 CK.ppt
Appropriate Roles of Government in Cluster Development
• A successful cluster policy builds on sound overall economic policies
• Government should support the development of all clusters, not choose among them
• Government policy should reinforce established and emerging clusters rather than attempt to create entirely new ones
• Government’s role in cluster initiatives is as facilitator and participant. The most successful cluster initiatives are a public-private partnership

50 Copyright 2003 © Professor Michael E. PorterCAON Greece 2003 05-08-03 CK.ppt
Cluster Policy versus Industrial Policy
Industrial Policy
Industrial Industrial PolicyPolicy
Cluster-basedPolicy
ClusterCluster--basedbasedPolicyPolicy
• Target desirable industries / sectors
• Focus on domestic companies
• Intervene in competition (e.g., protection, industry promotion, subsidies)
• Centralizes decisions at the national level
• All clusters can contribute to prosperity
• Domestic and foreign companies both enhance productivity
• Relax impediments and constraints to productivity
• Emphasize cross-industry linkages / complementarities
• Encourage initiative at the state and local level
Distort competition Enhance competition

51 Copyright 2003 © Professor Michael E. PorterCAON Greece 2003 05-08-03 CK.ppt
Greece’s Competitiveness Agenda 2003
• Continue the macroeconomic progress
• Upgrade the business environment
• Foster cluster development
• Create a regional strategy for Southeast Europe
• Shift the roles of government and business in economic development

52 Copyright 2003 © Professor Michael E. PorterCAON Greece 2003 05-08-03 CK.ppt
Influences on CompetitivenessMultiple Geographic Levels
Broad Economic AreasBroad Economic Areas
Groups of Neighboring Groups of Neighboring NationsNations
States, ProvincesStates, Provinces
Cities, Metropolitan Cities, Metropolitan AreasAreas
NationsNations
World EconomyWorld Economy

53 Copyright 2003 © Professor Michael E. PorterCAON Greece 2003 05-08-03 CK.ppt
Cross-National Regions and Economic StrategyTraditional Views• Regions as free trade zones; regions as economic unions (e.g., United States,
European Union)
New View• A regional strategy as a powerful tool to enhance competitiveness in autonomous
countries• Internal trade and investment
– Gains from internal trade and investmentAND
• Company operations and strategy– Enhancing the competitive capability of firms– Expanding trade in non-traditional export industries
• Business environment– Mutual benefits to the productivity of the business environment through policy coordination
that captures external economies and the benefits of specialization in institutions and infrastructure across borders
• Cluster development– Cross-border cluster specialization and integration
• Foreign investment– Enhancing interest and investment in the region by the international community
• Economic policy process– Improving economic policy formulation and implementation at the national level

54 Copyright 2003 © Professor Michael E. PorterCAON Greece 2003 05-08-03 CK.ppt
Cross-National Economic CoordinationAlternate Geographic Levels
Broad Economic AreasBroad Economic Areas
Groups of Neighboring Groups of Neighboring NationsNations
States, ProvincesStates, Provinces
Cities, Metropolitan Cities, Metropolitan AreasAreas
NationsNations
World EconomyWorld Economy
e.g. European Union
e.g. South-Eastern Europe
e.g. Greece

55 Copyright 2003 © Professor Michael E. PorterCAON Greece 2003 05-08-03 CK.ppt
• Coordinate macroecono-mic policies
• Eliminate trade and investmentbarriers within the region
• Simplify cross-borderregulations and paperwork
• Guarantee minimum basic investor protections
• Set minimum environmentalstandards
• Set minimum safety standards
• Establish reciprocal consumer protection laws
• Agree on foreign investment promotion guidelines to limit forms of investment promotion that do not enhance productivity
• Coordinatedcompetition policy
• Improve regional transportation infrastructure
• Create an efficient energy network
• Upgrade/link regional communications
• Upgrade/linkfinancial markets
• Upgrade higher education through facilitating specialization and student exchanges
• Expand cross-border business and financial information access and sharing
• Coordinate activities to ensure personal safety
• Establish ongoing upgrading process in clusters that cross national borders, e.g.
– Tourism
– Agribusiness
– Textiles and Apparel
– Information Technology
• Share best practices in government operations
• Improve regional institutions
– Regional development bank
– Dispute resolution mechanisms
– Policy coordination body
• Develop a regional marketing strategy
Factor (Input)
Conditions
Factor Factor (Input)(Input)
ConditionsConditionsRegional
GovernanceRegional
GovernanceContext for
Strategy and Rivalry
Context for Context for Strategy Strategy
and Rivalryand Rivalry
Related and Supporting Industries
Related and Supporting Industries
Demand ConditionsDemand Demand
ConditionsConditions
Cross-National Economic Coordination Illustrative Policy Areas
56 Copyright 2003 © Professor Michael E. PorterCAON Greece 2003 05-08-03 CK.ppt
Greece’s Competitiveness Agenda 2003
• Continue the macroeconomic progress
• Upgrade the business environment
• Foster cluster development
• Create a regional strategy for Southeast Europe
• Shift the roles of government and business in economic development

57 Copyright 2003 © Professor Michael E. PorterCAON Greece 2003 05-08-03 CK.ppt
Shifting Responsibilities for Economic Development
Old ModelOld ModelOld Model
• Government drives economic development through policy decisions and incentives
• Government drives economic development through policy decisions and incentives
New ModelNew ModelNew Model
• Economic development is a collaborative process involving government at multiple levels, companies, teaching and research institutions, and institutions for collaboration
• Economic development is a collaborative process involving government at multiple levels, companies, teaching and research institutions, and institutions for collaboration

58 Copyright 2003 © Professor Michael E. PorterCAON Greece 2003 05-08-03 CK.ppt
• Macroeconomic, political, legal, and social context– Establish a stable and predictable macroeconomic, legal, and political
environment – Improve the social conditions of citizens
• General microeconomic business environment– Improve the availability, quality, and efficiency of cross-cutting or
general purpose inputs, infrastructure, and institutions– Set overall rules and incentives governing competition that encourage
productivity growth
• Clusters– Facilitate cluster development and upgrading
• Process of Economic Change– Create institutions and processes for upgrading competitiveness that
inform citizens and mobilize the private sector, government at all levels, educational and other institutions, and civil society to take action
Roles of Government in Economic Development

59 Copyright 2003 © Professor Michael E. PorterCAON Greece 2003 05-08-03 CK.ppt
Role of the Private Sector in Economic Development
• A company’s competitive advantage is partly the result of the local environment
• Company membership in a cluster offers collective benefits• Private investment in “public goods” is justified
• Take an active role in upgrading the local infrastructure• Nurture local suppliers and attract new supplier investments • Work closely with local educational and research institutions to
upgrade quality and create specialized programs addressing cluster needs
• Provide government with information and substantive input on regulatory issues and constraints bearing on cluster development
• Focus corporate philanthropy on enhancing the local business environment
• An important role for trade associations– Greater influence – Cost sharing

60 Copyright 2003 © Professor Michael E. PorterCAON Greece 2003 05-08-03 CK.ppt
Selected References• The Competitive Advantage of Nations, New York: The Free Press, 1990
• “Clusters and the New Competitive Agenda for Companies and Governments” in On Competition, Boston: Harvard Business School Press, 1998
• “The Microeconomic Foundations of Economic Development,” in The Global Competitiveness Report 1998-99, (World Economic Forum, 1998)
• “The Current Competitiveness Index: Measuring the Microeconomic Foundations of Prosperity” in The Global Competitiveness Report 2000-01, New York: Oxford University Press, 2000
• “Enhancing the Microeconomic Foundations of Prosperity: The Current Competitiveness Index” in The Global Competitiveness Report 2001-02, New York: Oxford University Press, 2001
• “Building the Microeconomic Foundations of Prosperity: Findings from the Microeconomic Competitiveness Index” in The Global Competitiveness Report 2002-03, New York: Oxford University Press, forthcoming 2002
• “Location, Competition, and Economic Development: Local Clusters in a Global Economy,” (Economic Development Quarterly, February 2000, 15-34)
• “Locations, Clusters, and Company Strategy” in The Oxford Handbook of Economic Geography, (G. L. Clark, M.P. Feldman, and M.S. Gertler, eds.), New York: Oxford University Press, 2000
• “Attitudes, Values, Beliefs and the Microeconomics of Prosperity,” in Culture Matters: How Values Shape Human Progress, (L.E. Harrison, S.P. Huntington, eds.), New York: Basic Books, 2000

61 Copyright 2003 © Professor Michael E. PorterCAON Greece 2003 05-08-03 CK.ppt
Web resources
• Institute for Strategy and Competitiveness www.isc.hbs.edu
• ISC Cluster Mapping Data (US) data.isc.hbs.edu/isc/index.jsp
• Cluster of Innovation Initiative– Council on Competitiveness www.compete.org– Monitor Company www.monitor.com