the compensatory interaction between user … · christina serrano department of ... which target...
TRANSCRIPT

RESEARCH ARTICLE
THE COMPENSATORY INTERACTION BETWEEN USERCAPABILITIES AND TECHNOLOGY CAPABILITIES ININFLUENCING TASK PERFORMANCE: AN EMPIRICAL
ASSESSMENT IN TELEMEDICINE CONSULTATIONS
Christina SerranoDepartment of Information Systems, Sam M. Walton College of Business, University of Arkansas,
Fayetteville, AR 72701 U.S.A. {[email protected]}
Elena KarahannaManagement Information Systems Department, Terry College of Business, University of Georgia,
Athens, GA 30602 U.S.A. {[email protected]}
Appendix A
Qualitative Study Data Collection and Analysis
Methodology
We conducted a qualitative field study incorporating semi-structured interviews for the developmental purpose of mixed methods research;in other words, we initially engaged in qualitative research in order to develop the theoretical constructs and hypotheses of our research model,which we subsequently tested using quantitative methods (Venkatesh et al. 2013).
At the outset of our qualitative inquiry, our research questions guided the development of the interview protocol, which targeted factors thatcontributed to successful and unsuccessful e-consultations, asking respondents to share personal or observed experiences. Following a widelyaccepted framework for building theories using qualitative research (Carroll and Swatman 2000; Eisenhardt 1989), we iterated between thesteps of data collection, data analysis, and enfolding literature until we reached theoretical saturation in the development of the constructs andhypotheses that formed our research model.
Data Collection
In order to investigate e-consultations, we grounded our data collection within a telemedicine context because users in this context are motivatedto perform their focal e-consultation task (evaluation and diagnosis of patients), and the context allows for data collection from multiple typesof stakeholders, providing the opportunity to triangulate emergent concepts across the stakeholders. The main stakeholder types were consultingproviders, who assumed the role of consultant and used telemedicine to elicit the relevant information needed to evaluate and diagnose patients;presenting providers, who filled the role of presenter and used telemedicine to communicate the patient’s problems to the consulting provider;healthcare administrators, who coordinated the implementation of the telemedicine systems and scheduling of telemedicine consultations attheir respective sites; and telemedicine consultants, who were responsible for the telemedicine system implementations, training, andmaintenance. In total, we conducted 39 semi-structured interviews with 14 consulting providers, 10 presenting providers, 8 healthcareadministrators, and 7 telemedicine consultants (see Table A1). The telemedicine consultants worked for the same organization, and theremaining respondents represented 22 different healthcare organizations.
MIS Quarterly Vol. 40 No. 3—Appendices/September 2016 A1

Serrano & Karahanna/Compensatory Interaction Between User & Technology Capabilities
Table A1. List of Interviews for Qualitative Study
Consulting Providers
Title Mode Length Interview IDNumber of
Interviewers
Primary Care Physician FTF 1:23:12 1 2
Pediatrician / Clinical Geneticist FTF 1:06:54 2 2
Endocrinologist FTF 2:20:19 3 2
Primary Care Physician/Medical Director
Phone 0:41:18 5 1
FTF 1:26:22 21 1
Mental Health Professional FTF 1:04:37 7 1
Emergency PhysicianFTF 0:54:45 9 1
FTF 0:48:06 27 2
Primary Care Physician/Medical Director
FTF 0:56:50 11 1
FTF 0:54:13 28 2
Primary Care Physician/Medical Director
Phone 0:31:34 32 1
Primary Care Physician/Medical Director
Phone 0:42:16 34 2
Pediatric Psychiatrist FTF 1:01:20 35 1
Primary Care Physician FTF 0:45:59 36 1
Adult/Geriatric Psychiatrist Phone 0:30:00 37 1
Optometrist Phone 0:45:43 38 1
Obstetrician/Gynecologist Phone 0:17:27 39 1
Presenting Providers
Title Mode Length Interview IDNumber of
Interviewers
Primary Care Physician Phone 0:48:51 6 1
Nursing Director FTF 1:29:01 18 3
Nursing DirectorFTF 1:08:38 19 3
FTF 0:22:23 25 2
Phone 0:29:12 33 2
Nursing Director FTF 1:36:11 20 3
Nursing Director FTF 0:54:11 24 3
Nursing Director FTF 0:27:18 29 1
Social Worker FTF 0:54:11 24 3
Nurse FTF 0:41:31 20 3
Nurse FTF 0:41:31 20 3
Nurse FTF 0:40:27 30 1
A2 MIS Quarterly Vol. 40 No. 3—Appendices/September 2016

Serrano & Karahanna/Compensatory Interaction Between User & Technology Capabilities
Table A1. List of Interviews for Qualitative Study (Continued)
Healthcare Administrators
Title Mode Length Interview IDNumber of
Interviewers
Parent Organization AdministratorPhone 0:39:29 4 2
FTF 0:59:42 31 2
Telemedicine Coordinator FTF 0:39:26 10 1
Healthcare Administrator FTF 1:29:01 18 3
Healthcare Administrator
FTF 1:08:38 19 3
FTF 0:22:23 25 2
Phone 0:29:12 33 2
Healthcare Administrator FTF 1:36:11 20 2
Healthcare Administrator FTF 1:00:00 22 2
Healthcare Administrator FTF 0:41:37 23 2
Healthcare Administrator FTF 0:54:11 24 3
Telemedicine Consultants
Title Mode Length Interview IDNumber of
Interviewers
Executive Director FTF 0:21:49 15 1
Scheduling Coordinator FTF 0:47:34 16 1
IT Administrator FTF 0:43:20 14 1
Telemedicine Liaison
FTF 0:44:16 8 1
FTF 1:08:38 19 3
FTF 0:22:23 26 2
Telemedicine Liaison Phone 0:44:10 12 1
FTF 1:29:01 18 3
Telemedicine Liaison Phone 0:37:21 13 1
Telemedicine Liaison Phone 0:32:49 17 1
FTF = Face to FaceLength is presented in H:MM:SS
Data Analysis
All interviews were transcribed, and the interview transcripts were coded using the qualitative data analysis software MAXQDA. Our codingprocess was structured into first-order informant-driven concepts, second-order researcher-induced themes, and aggregate analytical dimensions,which adheres to a bottom-up, inductive analysis of the data (Van Maanen 1979). First-order concepts are derived from the insights expressedby the respondents, and second-order themes are the theoretical concepts that the researchers apply to explain the patterns in the first-order data(Van Maanen 1979). During the coding and analysis process, our research team met continuously to discuss the emergent findings, revise theinterview protocol, and integrate theoretical concepts found in the literature. Any disagreement in the coding and analysis process was resolvedto consensus. Data collection, data analysis, and literature integration ensued in this iterative process until no new concepts emerged(Eisenhardt 1989). Figure A1 portrays the data structure of our findings. These results shaped the theoretical development of the coreconstructs and hypotheses of our research model.
MIS Quarterly Vol. 40 No. 3—Appendices/September 2016 A3

Serrano & Karahanna/Compensatory Interaction Between User & Technology Capabilities
Figure A1. Data Structure of Findings
References
Carroll, J. M., and Swatman, P. A. 2000. “Structured-Case: A Methodological Framework for Building Theory in Information SystemsResearch,” European Journal of Information Systems (9:4), pp. 235-242.
Eisenhardt, K. 1989. “Building Theories from Case Study Research,” Academy of Management Review (14:4), pp. 532-550.Van Maanen, J. 1979. “The Fact of Fiction in Organizational Ethnography,” Administrative Science Quarterly (24:4), pp. 539-550.Venkatesh, V., Brown, S., and Bala, H. 2013. “Bridging the Qualitative-Quantitative Divide: Guidelines for Conducting Mixed Methods
Research in Information Systems,” MIS Quarterly (37:1), pp. 21-54.
A4 MIS Quarterly Vol. 40 No. 3—Appendices/September 2016

Serrano & Karahanna/Compensatory Interaction Between User & Technology Capabilities
Appendix B
Study 1 (Field Survey) Instrument Development
We followed established guidelines to develop scales for constructs in our research model (Mackenzie et al. 2011; Netemeyer et al. 2003; Straub1989). A complete list of items for this study can be found in Table B1. All constructs were measured using a seven-point Likert scale where1 = Strongly Disagree and 7 = Strongly Agree. We measured the constructs using the medical consultation as our level of analysis and, thus, required respondents to recall one of their mostrecent telemedicine consultation experiences and respond to the survey questions based on that one particular telemedicine consultationexperience. Prior to answering survey questions, the respondents were asked to describe (in open ended questions) the patient’s medicalcondition and the particular telemedicine consultation experience, including interactions with the telemedicine participants and technology. This served as a validity check to ensure their telemedicine experience was valid for our research purpose (e.g., not a distance learningexperience or other non-clinical application) and to facilitate the respondents’ anchoring on that one particular experience when answering theremaining survey questions.
For most constructs in our study, we developed new scales because validated scales did not exist. There were no existing scales for presentationand elicitation, and existing scales for representation and perceived diagnosticity were deemed incomplete. Most of the existing items forperceived diagnosticity use language such as “judge” the quality or attribute of a product or “to get a real feel” for the product. Because weare focusing on the process of clinical evaluations of patients rather than products, this language did not seem appropriate and we opted to usewording such as evaluate and assess. Therefore, in reviewing existing scales for perceived diagnosticity, we chose to adapt one item from theliterature that uses the language “carefully evaluate” in operationalizing diagnosticity (Kempf and Laczniak 2001; Pavlou and Fygenson 2006)and developed the remaining items. Similarly, when reviewing existing scales for representation, we found that this construct has beenoperationalized largely in terms of information completeness (Burton-Jones and Grange 2012; Overby and Konsynski 2010), which, in ourcontext, only narrowly captures the construct’s meaning according to our theoretical definition. Consequently, we adapted one informationcompleteness item from Overby and Konsynski (2010) and developed additional items.
The item development process consisted of a prioritization exercise, item sorting, and two phases of pretest. We paid close attention to thecontent validity of the constructs by first ensuring that items represented the full domain of the construct definitions. Content validity wasfurther assessed using a prioritization exercise (Mackenzie et al. 2011; Netemeyer et al. 2003) completed by four judges (doctoral students)who rated the extent to which each item was representative of the overall construct based on the construct’s definition. We next employed itemsorting by eight judges (faculty, doctoral students, and an IT professional) to provide a qualitative assessment of construct validity for the scaleswe created (Mackenzie et al. 2011; Netemeyer et al. 2003). Problematic items were reworded or dropped.
The survey was then pretested in two phases. First, we administered a pen-and-paper version at a practitioner telemedicine conference, wherefive telemedicine clinicians completed the survey and provided feedback. Based on their feedback, we shortened the survey and mademodifications to the wording of some items. Second, we presented the revised instrument to two physicians and specifically requestedsuggestions concerning both the survey design and item wording. As a result of their review, we clarified survey instructions and modifiedthe wording for some additional items.
References
Burton-Jones, A., and Grange, C. 2012. “From Use to Effective Use: A Representation Theory Perspective,” Information Systems Research(24:3), pp. 632-658.
Kempf, D. S., and Laczniak, R. N. 2001. “Advertising’s Influence on Subsequent Product Trial Processing,” Journal of Advertising (30:3),pp. 27-38.
Mackenzie, S. B., Podsakoff, P. M., and Podsakoff, N. P. 2011. “Construct Measurement and Validation Procedures in MIS and BehavioralResearch: Integrating New and Existing Techniques,” MIS Quarterly (35:2), pp. 293-334.
Netemeyer, R., Bearden, W., and Sharma, S. 2003. Scaling Procedures: Issues and Applications, Thousand Oaks, CA: Sage Publications,Inc.
Overby, E., and Konsynski, B. 2010. “Task–Technology Fit and Process Virtualization Theory: An Integrated Model and Empirical Test,”Emory Public Law Research Paper No. 10-96 (available at SSRN: http://ssrn.com/abstract=1567097).
Pavlou, P. A., and Fygenson, M. 2006. “Understanding and Predicting Electronic Commerce Adoption: An Extension of the Theory ofPlanned Behavior,” MIS Quarterly (30:1), pp. 115-143.
Straub, D. 1989. “Validating Instruments in MIS Research,” MIS Quarterly (13:2), pp. 147-169.
MIS Quarterly Vol. 40 No. 3—Appendices/September 2016 A5

Serrano & Karahanna/Compensatory Interaction Between User & Technology Capabilities
Table B1. Construct Definitions and Item Measures
Perceived e-consultation Diagnosticity: the perceived ability of the telemedicine system (including technology and users)to enable consulting clinicians to understand and evaluate the health conditions of remote patientsDuring this particular telemedicine consultation, the telemedicine consultationa allowed me to:DIAG1: Carefully evaluate the health condition of the patientDIAG2: Thoroughly assess the health condition of the patientDIAG3: Accurately evaluate the patient’s health condition
Representation: the perceived capacity of the telemedicine technology to present information relevant to the clinicalevaluation process, including simulations of actors and objects within the physical setting, their properties andcharacteristics, and how process participants interact with them.During this particular telemedicine consultation, the telemedicine technologyb:REP1: Transmitted audio and video feedback that was adequate for the clinical evaluationREP2: Transmitted all of the relevant information I needed for the clinical evaluationREP3: Allowed me to see everything that I needed to see for the clinical evaluation
Presentation: perception of the presenters’ capacity to relay information relevant to the clinical evaluation process, basedon their ability to articulate pertinent information and execute actions that inform the processDuring this particular telemedicine consultation, the presenting provider and/or patient was able to:PRES1: Effectively articulate the information I needed to knowPRES2: Disregard irrelevant information and communicate to me only what was importantPRES3: Execute hands-on tasks in order to give me the clinical information I neededPRES4: Complete the tasks necessary to present me with the information I needed
Elicitation: perception of the consultants’ capacity to solicit information relevant to the clinical evaluation process, based ontheir ability to interview and instruct the presenter(s) in a manner that informs the processDuring this particular telemedicine consultation, I was able to:ELIC1: Effectively ask questions to elicit important information about the patient’s conditionELIC2: Ask questions that were clearly understood by the patient and/or presenting providerELIC3: Provide clear instructions to the patient and/or presenting provider on observing any patient conditions that neededto be communicated to me
Trust Requirements: the perceived need for the client (advice-seeker) to trust the consultant (advice-giver) in a medicalconsultation contextc
In general, when conducting clinical evaluations for medical conditions such as this one, it is necessary that:TRU1: The patient believes he/she can have confidence in my abilitiesTRU2: The patient feels that he/she can trust meTRU3: There is a trusting relationship with the patientTRU4: The patient believes I am acting in his/her best interest
Sensory Requirements: the perceived need for the process participants to be able to enjoy a full sensory experience of theprocess and other process participants and objects in a medical consultation contextc
In general, when conducting clinical evaluations for medical conditions such as this one, it is necessary that:SEN1: I use auscultation techniquesd to evaluate patient organ systems during the clinical evaluationSEN2: I physically examine the patient during the clinical evaluationSEN3: I employ the sense of touch during the clinical evaluationSEN4: I obtain tactile feedback concerning the patient's condition during the clinical evaluationSEN5: I employ palpation and percussion techniquesd during the clinical evaluation
aRespondents were provided with the following definition: telemedicine consultation refers to both the technology and the interactions with peoplevia the technology.bRespondents were provided with the following definition: telemedicine technology refers to the telemedicine equipment, software and networkonly.xcThe control variables of trust requirements and sensory requirements refer to perceptions of the need for trust and sensory experience and notperceptions of whether these needs were met.dThe techniques of auscultation, palpation and percussion refer to physical examination techniques employed during medical consultations.
A6 MIS Quarterly Vol. 40 No. 3—Appendices/September 2016

Serrano & Karahanna/Compensatory Interaction Between User & Technology Capabilities
Appendix C
Study 1 (Field Survey) Sample Characteristics
Table C1. Sample Characteristics (n = 201)
Variable Category Freq. Percent
GenderMale 121 60.2
Female 80 39.8
Age
25–34 years 17 8.5
35–44 years 61 30.3
45–54 years 68 33.8
55–64 years 37 18.4
65+ years 18 9.0
Years of Telemedicine Experience
< 1 year 14 7.0
1–3 years 76 37.8
4–6 years 55 27.4
7–9 years 22 10.9
10+ years 34 16.9
Hours of Telemedicine Use Per Week
< 1 hour 35 17.4
1–10 hours 141 70.1
11–20 hours 15 7.5
21–30 hours 6 3.0
31–40 hours 1 0.5
41–50 hours 2 1.0
50+ hours 1 0.5
Number of Telemedicine Patients Per Week
< 1 patient 34 16.9
1–10 patients 119 59.2
11–20 patients 26 12.9
21–30 patients 15 7.5
31–40 patients 4 2.0
41–50 patients 0 0.0
50+ patients 3 1.5
MIS Quarterly Vol. 40 No. 3—Appendices/September 2016 A7

Serrano & Karahanna/Compensatory Interaction Between User & Technology Capabilities
Table C2. Geographic Location of Survey Respondents
State Freq. Percent State Freq. Percent
Georgia 41 20.4 Washington 3 1.5
Missouri 31 15.4 Maryland 3 1.5
Arkansas 14 7.0 Nebraska 3 1.5
Virginia 11 5.5 Oklahoma 3 1.5
Kentucky 10 5.0 South Carolina 3 1.5
Massachusetts 8 4.0 Arizona 2 1.0
Kansas 6 3.0 Colorado 2 1.0
Texas 5 2.5 Florida 2 1.0
New York 5 2.5 Illinois 2 1.0
Louisiana 4 2.0 Pennsylvania 2 1.0
Michigan 4 2.0 Wyoming 2 1.0
Oregon 4 2.0 Iowa 1 0.5
California 4 2.0 Ohio 1 0.5
Hawaii 4 2.0 Rhode Island 1 0.5
New Mexico 4 2.0 South Dakota 1 0.5
Alaska 3 1.5 Utah 1 0.5
Indiana 3 1.5 West Virginia 1 0.5
Minnesota 3 1.5 Wisconsin 1 0.5
Tennessee 3 1.5
Table C3. Respondents’ Medical Specialties
Medical Specialty Freq. Perc. Medical Specialty Freq. Perc.
Psychiatry 39 19.4 Pulmonology 3 1.5
Pediatrics 38 18.9 Genetics 3 1.5
Neurology 20 10.0 Nutrition 3 1.5
Clinical Psychology 10 5.0 Rheumatology 2 1.5
Obstetrics and Gynecology 9 4.5 Urology 3 1.5
Internal Medicine 9 4.5 Orthopedics 2 1.0
Surgery 8 4.0 Physical Medicine 2 1.0
Emergency Medicine 8 4.0 Speech-Language Pathology 2 1.0
Critical Care 8 4.0 Wound Care 2 1.0
Dermatology 7 3.5 Allergy-Immunology 1 0.5
Primary Care 6 3.0 Gastroenterology 1 0.5
Endocrinology 5 2.5 Hematology 1 0.5
Cardiology 4 2.0 Hepatology 1 0.5
Geriatrics 4 2.0 Oncology 1 0.5
Nephrology 4 2.0 Ophthalmology 1 0.5
Infectious Diseases 4 2.0
Note: Some respondents reported more than one medical specialty. The frequencies reported in this table reflect all reported
medical specialties.
A8 MIS Quarterly Vol. 40 No. 3—Appendices/September 2016

Serrano & Karahanna/Compensatory Interaction Between User & Technology Capabilities
Appendix D
Study 1 (Field Survey) Measurement Validation
Table D1. Inter-Construct Correlation Matrix and AVE
Construct Mean (Std Dev) DIAG ELIC PRES REP SENS TRU
DIAG 5.54 (1.34) 0.94
ELIC 5.94 (1.13) 0.72** 0.93
PRES 5.57 (1.23) 0.64** 0.69** 0.82
REP 5.51 (1.33) 0.69** 0.64** 0.55** 0.81
SENS 3.79 (1.77) -0.03 -0.10 -0.01 -0.09 0.78
TRU 6.19 (1.05) 0.21** 0.14* 0.19** 0.16* 0.03 0.83
Legend: DIAG = e-consultation Diagnosticity; ELIC = Elicitation; PRES = Presentation; REP = Representation; SENS = Sensory Requirements;
TRU = Trust Requirements
All constructs measured on a 1–7 Likert scale. The shaded diagonal is the square root of the AVE. **p < 0.01; *p<0.05.
Table D2. Results of CFA Measurement Model Analysis
Construct Variable NameFactor
LoadingsCronbach’s
AlphaCompositeReliability AVE
e-consultation DiagnosticityDIAG1DIAG2DIAG3
0.940.950.94
0.96 0.97 0.89
Presentation
PRES1PRES2PRES3PRES4
0.900.770.720.88
0.89 0.92 0.67
ElicitationELIC1ELIC2ELIC3
0.950.940.89
0.95 0.96 0.86
RepresentationREP1REP2REP3
0.830.810.80
0.85 0.91 0.66
Sensory Requirements
SEN1SEN2SEN3SEN4SEN5
0.750.720.750.820.84
0.88 0.89 0.61
Trust Requirements
TRU1TRU2TRU3TRU4
0.770.920.750.88
0.89 0.93 0.83
MIS Quarterly Vol. 40 No. 3—Appendices/September 2016 A9

Serrano & Karahanna/Compensatory Interaction Between User & Technology Capabilities
Appendix E
Interaction Effects for Study 1 and Study 2
Study 1: Field Survey
To further interpret the nature of the significant interactions, we employed partial derivative analysis, response surface graphs, and two-wayinteraction plots with simple slope tests.
Partial Derivative Approach
The partial derivative analysis is based on the analysis of the factored coefficients, or partial derivatives, of the latent variables involved in asignificant interaction effect to examine the relationship between the dependent variable and each variable in the interaction effect separatelywhile holding the other variables constant (Ping 2003). In other words, the partial derivative represents the slope of the regression line betweenone of the independent variables and the dependent variable, while holding constant all other independent variables. This allows us to examinethe relationship between the dependent variable and the independent variable at all levels of the “other variable” in the interaction term. Usingthis method, we calculated the partial derivatives of our dependent variable, e-consultation diagnosticity, with respect to the independentvariables involved in the significant interaction effects (presentation × representation and elicitation × representation).
Specifically, given the regression equation for H4, Diag = β0 + β1SensReq + β2TrustReq + β3Pres + β4Elic + β5Rep + β6(Rep × Pres), the partial
derivatives of e-consultation diagnosticity with respect to representation and presentation, respectively, are = (β5 + β6 Pres) and ∂∂Diag
Rep
∂∂
Diag
Pres
= (β3 + β6 Rep). Likewise, given the regression equation for H5, Diag = β0 + β1SensReq + β2TrustReq + β3Pres + β4Elic + β5Rep + β6(Rep ×
Elic), the partial derivatives of e-consultation diagnosticity with respect to representation and elicitation, respectively, are = (β5 + β6 Elic)∂∂Diag
Rep
and = (β4 + β6 Rep). Results of the partial derivative analysis show that the relationship between presentation and e-consultation diag-∂∂Diag
Elic
nosticity is strongest at low levels of representation (see Table E1; significant effects in bold) and nonsignificant at high levels of representation. Likewise, the relationship between representation and e-consultation diagnosticity is strongest at low levels of presentation and nonsignificantat high levels of presentation (see Table E2). In addition, elicitation has its strongest effect on e-consultation diagnosticity at low levels ofrepresentation and no significant effect at high levels of representation (see Table E3). Similarly, representation influences e-consultationdiagnosticity the most at low levels of elicitation and has no significant impact at high levels of elicitation (see Table E4). Altogether, theseresults suggest that the user capabilities of presentation and elicitation matter most when representation is low, and vice versa, supporting H4and H5.
Table E1. Presentation to Diagnosticity Relationship at Different Levels of Representation
Rep Levels (Scale 1–7)MDiagMPres Standard Error T-Statistic
7 -0.02 0.24 -0.09
6 0.09 0.21 0.41
5.51(Rep Mean)
0.14 0.20 0.70
5 0.19 0.18 1.06
4 0.30 0.16 1.92
3 0.41 0.13 3.11
2 0.51 0.11 4.81
1 0.62 0.09 7.23
A10 MIS Quarterly Vol. 40 No. 3—Appendices/September 2016

Serrano & Karahanna/Compensatory Interaction Between User & Technology Capabilities
Table E2. Representation to Diagnosticity Relationship at Different Levels of Presentation
Pres Levels (Scale 1–7)MDiagMRep Standard Error T-Statistic
7 0.18 0.23 0.82
6 0.29 0.20 1.47
5.57(Pres Mean)
0.34 0.19 1.81
5 0.40 0.17 2.34
4 0.50 0.14 3.53
3 0.61 0.12 5.23
2 0.72 0.09 7.75
1 0.83 0.07 11.45
Table E3. Elicitation to Diagnosticity Relationship at Different Levels of Representation
Rep Levels (Scale 1–7)MDiagMElic Standard Error T-Statistic
7 0.11 0.25 0.44
6 0.23 0.22 1.02
5.51(Rep Mean)
0.29 0.21 1.36
5 0.35 0.20 1.77
4 0.46 0.17 2.74
3 0.58 0.14 4.04
2 0.70 0.12 5.80
1 0.82 0.10 8.16
Table E4. Representation to Diagnosticity Relationship at Different Levels of Elicitation
Elic Levels (Scale 1–7)MDiagMRep Standard Error T-Statistic
7 0.21 0.23 0.91
6 0.32 0.20 1.63
5.94(Elic Mean)
0.33 0.20 1.68
5 0.44 0.17 2.58
4 0.56 0.14 3.88
3 0.68 0.12 5.72
2 0.80 0.09 8.44
1 0.91 0.07 12.44
Response Surface Methodology and Interaction Plots
The response surface methodology is an approach that enables three-dimensional visualization of the relationships between independentvariables and dependent variables and is useful for interpreting interaction effects (Titah and Barki 2009). Regarding H4, under low levels ofrepresentation, there is a steeper slope for the relationship between presentation and e-consultation diagnosticity (lower left edge of the surface),whereas the slope for this relationship at high levels of representation is relatively flat (top right edge of the surface) (see Figure E1). This is
MIS Quarterly Vol. 40 No. 3—Appendices/September 2016 A11

Serrano & Karahanna/Compensatory Interaction Between User & Technology Capabilities
H4: Interaction Between Representation and Presentation H5: Interaction Between Representation and Elicitation
Figure E1. Response Surface Visualization of Significant Interaction Effects for Study 1
also evident by the two way interaction plots (see Figure E2) and the simple slope tests, which reveal a strong positive relationship betweenpresentation and e-consultation diagnosticity when representation is low (t = 2.38, p < 0.05) and a nonsignificant relationship betweenpresentation and e-consultation diagnosticity when representation is high (t = 1.16, p = 0.25). This implies that user presentation capabilitiescan compensate for limitations in the technology such that when technology has low representation capabilities, user presentation skills becomean important determinant of the diagnostic process.
In exploring the other side of this interaction, when presentation capabilities are low, the surface plot shows a steeper slope for the relationshipbetween representation and e-consultation diagnosticity (lower right edge of the surface) compared to the slope at high presentation levels (topleft edge of the surface) (Figure E1). Consistent with these results, the two-way interaction plots (Figure E2) and simple slope tests show thatwhen presentation is low, there is a stronger relationship between representation and e-consultation diagnosticity (t = 5.32, p < 0.001) comparedto when presentation is high (t = 4.27, p < 0.001). This indicates that representation capabilities are especially important when presentationcapabilities are low and that the additional information provided by high levels of technology representation can compensate for informationthat a user fails to present or presents poorly. Collectively, these findings support H4.
Regarding H5, under low levels of representation, there is a steeper slope for the relationship between elicitation and e-consultationdiagnosticity (lower left edge of the surface) compared to the slope for this relationship at high levels of representation (top right edge of thesurface) (Figure E1). The two-way interaction plots (Figure E2) and simple slope tests reveal that the relationship between elicitationcapabilities and e-consultation diagnosticity is stronger at low levels of representation (t = 3.74, p < 0.001) than at high levels of representationcapability (t = 3.20, p < 0.01). These findings suggest that elicitation capabilities can compensate for lack of technology representationcapabilities. Likewise, the surface plot shows that there is a steeper slope for the relationship between representation and e-consultationdiagnosticity at low levels of elicitation (lower right edge of the surface) compared to high levels of elicitation (top left edge of the surface)(Figure E1). Consistent with these results, the two-way interaction plots (Figure E2) and the simple slope tests show that when elicitation islow, there is a stronger relationship between representation and e-consultation diagnosticity (t=4.99, p<0.001) compared to when elicitationis high (t = 4.29, p < 0.001). This suggests that representation capabilities matter most when user elicitation capabilities are low and cancompensate for poor elicitation skills. In sum, these findings lend further support for H5.
A12 MIS Quarterly Vol. 40 No. 3—Appendices/September 2016

Serrano & Karahanna/Compensatory Interaction Between User & Technology Capabilities
H4a: Interaction Between Representationand Presentation
H4b: Interaction Between Presentationand Representation
H5a: Interaction Between Representationand Elicitation
H5b: Interaction Between Elicitationand Representation
Figure E2. Interaction Plots: Field Survey (Study 1)
Study 2: Lab Experiment
To explore the nature of the significant interaction effects, we produced surface response graphs (Figure E3) and interaction plots (Figure E4)and performed simple slope tests. With regard to H4, the surface plot (Figure E3) shows that, under low levels of representation, there is asteeper slope for the relationship between presentation and e-consultation diagnosticity as compared to the slope for this relationship at highlevels of representation. Supporting these results, the two-way interaction plots (Figure E4) and simple slope tests show that the relationshipbetween presentation capability and e-consultation diagnosticity is stronger at low levels of representation (t = 5.85, p < .001) as compared tohigh levels of representation (t = 1.67, p < 0.10). Hence, when user presentation skills are poor, technology representation becomes animportant informant in the e-consultation process, compensating for weaknesses in the user’s problem presentation skills. Furthermore, thesurface plot reveals a steeper slope for the relationship between representation and e-consultation diagnosticity at low levels of presentationcompared to the slope for this relationship at high levels of presentation. The two-way interaction plots and simple slope tests are consistentwith these results. When user presentation capabilities are low, there is a significant positive relationship between representation ande-consultation diagnosticity (t = 2.11, p < 0.05), and when presentation capabilities are high, there is a weaker and negative relationship betweenrepresentation and e-consultation diagnosticity (t = -1.88, p < 0.10). This suggests that technology capabilities are able to compensate forweaknesses in user presentation skills. Altogether, these findings support H4.
MIS Quarterly Vol. 40 No. 3—Appendices/September 2016 A13

Serrano & Karahanna/Compensatory Interaction Between User & Technology Capabilities
H4: Interaction Between Representationand Presentation
H5: Interaction Between Representationand Elicitation
Figure E3. Response Surface Visualization of Significant Interaction Effects for Study 2
In terms of H5, the surface plot (Figure E3) illustrates similar results. The relationship between elicitation and e-consultation diagnosticityhas a steeper slope at low levels of representation than at high levels of representation. Moreover, the two-way interaction plots (Figure E4)and simple slope tests show that there is a stronger positive relationship between elicitation and e-consultation diagnosticity when representationis low (t=5.36, p<.001) and a weaker relationship when representation is high (t=1.78, p<0.10). These results imply that strong user elicitationskills can compensate for weaknesses in technology representation capabilities. Additionally, the surface plot depicts a steeper slope for therelationship between representation and e-consultation diagnosticity at low levels of elicitation as compared to the slope for this relationshipat high levels of elicitation. The two-way interaction plots and simple slope tests also reveal a stronger relationship between representationand e-consultation diagnosticity at low levels of elicitation (t = 1.68, p < 0.10) versus high levels of elicitation (t = -1.58, p = 0.12). Thus,technology capabilities can compensate for poor elicitation capabilities. Collectively, these findings provide support for H5.
References
Ping, R. A. 2003. Interactions and Quadratics in Survey Data: A Source Book for Theoretical Model Testing (2nd ed.), Depart-ment of Marketing, Wright State University, Dayton, OH. (online monograph: http://www.wright.edu/~robert.ping/intquad2/toc2.htm).
Titah, R., and Barki, H. 2009. “Nonlinearities Between Attitude and Subjective Norms in Information Technology Acceptance: A Negative Synergy?,” MIS Quarterly (33:4), pp. 827-844.
A14 MIS Quarterly Vol. 40 No. 3—Appendices/September 2016

Serrano & Karahanna/Compensatory Interaction Between User & Technology Capabilities
H4a: Interaction Between Representationand Presentation
H4b: Interaction Between Presentationand Representation
H5a: Interaction Between Representationand Elicitation
H5b: Interaction Between Elicitationand Representation
Figure 4. Interaction Plots: Lab Experiment (Study 2)
MIS Quarterly Vol. 40 No. 3—Appendices/September 2016 A15

Serrano & Karahanna/Compensatory Interaction Between User & Technology Capabilities
Appendix F
Post Hoc Analysis for Study 1
In Study 1, due to the possibility of multicollinearity between the interaction effects (correlation = .60) and the fact that the two interactioneffects are non-significant when entered together in the regression, we combined the two user capabilities into a composite user capabilityconstruct and reran the regression analysis.
Table F1. Results of Post Hoc Hierarchical Regression Analysis (DV = E-Consultation Diagnosticity)
Variable
Model 1 Model 2 Model 3
Beta (S.E.) Beta (S.E.) Beta (S.E.)
Controls
Sens Req -.039 (.070) .028 (.044) .034 (.043)
Trust Req .205** (.070) .055 (.044) .072 (.044)
Main Effects
User Cap .485*** (.062) .439*** (.065)
Representation .378*** (.057) .334*** (.059)
Interaction Effects
Rep × User -.131* (.038)
Sig. F Change .013 .000 .016
R2 .043 .633 .643
R2 diff. .043 .590*** .010*
Standardized coefficients (standard errors), n = 201, ***p < 0.001, **p < 0.01, *p < 0.05
Results (see Table F1) indicate that both user capabilities and technology capabilities (i.e., representation) are significantly related toe-consultation diagnosticity (p < .001) and that the interaction between user capabilities and technology capabilities is significantly related toe-consultation diagnosticity (p < .05). The response surface and interaction plots reveal the same pattern of relationships as depicted inAppendix E, with a stronger positive relationship between composite user capabilities and e-consultation diagnosticity when representationcapability is low (t = 3.54, p < .001) and a weaker relationship when representation capability is high (t = 2.47, p < .05). This suggests thatuser capabilities compensate for limitations in technology capabilities in determining task performance. Furthermore, the simple slope testsalso reveal that there is a significant positive relationship between representation and e-consultation diagnosticity when composite usercapabilities are low (t = 2.51, p < 0.05) and a weaker relationship when composite user capabilities are high (t = 1.84, p < 0.10). This indicatesthat technology capabilities can compensate for limitations in user capabilities in influencing task performance.
A16 MIS Quarterly Vol. 40 No. 3—Appendices/September 2016

Serrano & Karahanna/Compensatory Interaction Between User & Technology Capabilities
Appendix G
Description of Hyperthyroidism (Study 2)
Hyperthyroidism is a condition that results from overproduction of thyroid hormones. The thyroid is a gland located at the front of the neckbelow the voice box (larynx). The most common cause of hyperthyroidism is Graves disease, an autoimmune disorder that causes elevatedactivity in the thyroid gland. This disease is most common among women, with a peak onset of hyperthyroidism signs and symptoms occurringbetween the ages of 20 and 40 years. Evaluation and diagnosis of hyperthyroidism involve history taking, physical examination, and laboratorytesting (Blackwell 2004; Singer et al. 1995; Skugor 2006). However, because the clinical interview only involves history taking and thephysical examination, the experiment only includes these two diagnostic tasks (see Table G1).
Table G1. Evaluation of Hyperthyroidism
Diagnostic Task Description
History Taking
Patients often present with the following medical history and symptoms:nervousness, irritability, sleep disturbance, fatigue, shortness of breath, heart palpitations, finetremors of hands, heat intolerance (often with flushed cheeks and hands), increased perspiration,thinning hair, loose nails, weight loss, increased appetite and thirst, increased frequency of bowelmovements, irregular menstrual cycle in women, joint swelling and pain, bulging eyes(exophthalmos), and enlarged thyroid (goiter).
Physical Exam
A physical exam to evaluate hyperthyroidism entails obtaining the patient’s height, weight, heartrate*, and blood pressure*. Furthermore, the clinician should examine the patient’s thyroid (e.g.,palpate for enlargement), skin (for dryness and flushing), and eyes (for protrusion and visionimpairment).
*Hyperthyroidism is associated with an accelerated heart rate and high blood pressure.
This condition was selected for a variety of reasons. From an experimental design perspective, we were interested in a health disorder thatpresents with visual signs that could be shown via the high representation treatment. However, we did not want the visual signs to be suchobvious indicators of the health disorder that subjects would be able to discern the health condition upon first sight of the patient, therebyprecluding the need for information gathering via an interview. Thus, of the two most conspicuous physical signs of hyperthyroidism, anenlarged thyroid and bulging eyes, we chose to represent only the enlarged thyroid and we displayed moderate swelling of the thyroid. Thiswas deemed appropriate because not all patients with hyperthyroidism present with eye issues or severe enlargement of the thyroid. Furthermore, this condition was selected because all recruited subjects had completed a course on Adult Health and Illness, in which theylearned about hyperthyroidism.
References
Blackwell, J. 2004. “Evaluation and Treatment of Hyperthyroidism and Hypothyroidism,” Journal of the American Academy of NursePractitioners (16:10), pp. 422-425.
Singer, P. A., Cooper, D. S., Levy, E. G., Ladenson, P. W., Braverman, L. E., Daniels, G., Greenspan, F. S., McDougall, I. R., and Nikolai,T. F. 1995. “Treatment Guidelines for Patients with Hyperthyroidism and Hypothyroidism,” JAMA: The Journal of the AmericanMedical Association (273:10), pp. 808-812.
Skugor, M. 2006. “The Overactive Thyroid: Hyperthyroidism,” in Thyroid Disorders: A Cleveland Clinic Guide, Cleveland, OH: ClevelandClinic Press, pp. 40-70.
MIS Quarterly Vol. 40 No. 3—Appendices/September 2016 A17

Serrano & Karahanna/Compensatory Interaction Between User & Technology Capabilities
Appendix H
Summary of Experiment Procedures (Study 2)
Of the 102 students scheduled to participate in the experiment, 9 cancelled, yielding a final sample size of 93 subjects. All subjects werescheduled to participate in the experiment over three consecutive days between semester sessions. This was to maintain consistency in theexperiment procedures, the confederate’s cosmetic makeup in the high representation condition, and the confederate’s performance of the twoscripts. Furthermore, because the experiment took place when no classes were in session, we were able to minimize in-class studentinteractions, which could potentially threaten the internal validity of the study.
When each subject arrived, he/she was checked in by the same research assistant and debriefed on the experimental task of conducting atelemedicine-based interview followed by completing a survey. All subjects were required to sign a confidentiality agreement stating that theywould not discuss any details concerning the experiment to any outsiders to prevent contamination of the study. Each subject received a folderthat contained a cover story explaining his/her role as a nurse who would perform a telemedicine-based assessment of a patient with a healthproblem located at a rural clinic who was contacting him/her via a nursing hotline to obtain triage advice. The subjects were provided witha patient assessment form, which listed basic information about the patient (name: Julie Smith, age: 35 years, gender: female, height: 5'3",and weight: 118 lbs.) and allowed them to take notes about the patient during the telemedicine session. Furthermore, the subjects wereprovided with a lab coat to wear during the telemedicine consultation. These steps were taken to mirror the typical procedures they wouldfollow when conducting a face-to-face health assessment.
After the subjects completed the telemedicine patient assessment, they were directed to a computer where they completed the electronic surveyand were distributed their cash incentive.
Appendix I
Presentation Scripts (Study 2)
Two nursing experts and the primary researchers of this study collaborated on writing the two scripts (high presentation and low presentation)for the confederate. Based on the signs and symptoms of hyperthyroidism, they chose the signs and symptoms the confederate wouldcommunicate in each script and the order in which she would present the symptoms. In addition, they constructed both a medical history andsocial history for the confederate and her fictional family members. See Table I1 for more details regarding the content of the two scripts.
Validity and Reliability of Presentation Scripts
To ensure validity and reliability of the scripts, the confederate engaged in multiple rehearsals with the first author and the nursing expert whoco-wrote the script and also had opportunities to practice the script during two pretests (n = 5) and two pilot tests (n = 13). Furthermore, theexperimental setup on the confederate’s end was configured to facilitate her consistency in performing the two scripts. There was a printoutof her script that was readable from where she sat on the patient exam table. Additionally, during breaks between subjects, she wrote extradetails as needed on a large whiteboard visible to her. Finally, two monitors with a real-time instant messaging window were displayed to her. There was one monitor on each side of the camera, and the text was enlarged to be legible to her. The nursing expert who co-wrote the scriptwas present during the three days of the experiment and observed all telemedicine interactions via a live stream on LifeSize UVC Video Center. This allowed her to use the instant messaging tool to send real-time messages to the confederate as a way of teleprompting the confederate toremain on script. This was especially important regarding the nonverbal communication and any unanticipated questions that arose to whichthere were no scripted answers. The nursing expert or confederate scripted answers to the new questions in real-time, and the nursing expertthen recorded the newly scripted answers and instant messaged them to the confederate when the same questions were asked subsequently. Figure I1 depicts the experimental setup for the confederate.
A18 MIS Quarterly Vol. 40 No. 3—Appendices/September 2016

Serrano & Karahanna/Compensatory Interaction Between User & Technology Capabilities
Table I1. Script Content for Low and High Presentation
Low Presentation High Presentation
Baseline Signs &Symptoms AlwaysPresented, by Order ofPresentation
“I’m just not feeling myself.” “For the past three months, I just have not beenfeeling myself.”
“I have a hard time settling down most of theday but I’m also really sleepy. My eyes looktired.”
“I’m shaky and trembling most of the day. I’m alwaysfidgeting and can’t sit still, even now as I’m talking toyou. I’m also really sleepy. I have these dark circlesunder my eyes because I only sleep about threehours per night.”
“My face and hands are red and flushed. I’m justsweaty and hot all the time.”
“My hair feels different.” “My hair has gotten dry and brittle. In the shower,when I wash my hair, there is a whole gob of hair thatends up in my drain.”
“I’m losing weight. You’d think that’s a good thing,but I’m not trying to lose weight.”
“Every time I swallow, I feel like there is a lump in mythroat, like something is caught in my throat. Itdoesn’t hurt or anything, and I can still eat fine, but ifI touch it, it feels kind of swollen.”
Additional Signs &SymptomsPresented Only ifElicited
Presented with minimum details:Heat intolerance, weight loss, swelling onfront of neck, increased appetite and thirst,shortness of breath, heart palpitations, jointpain in legs, loose stools, irregularmenstruation
Presented in great detail:Increased appetite and thirst, shortness of breath,heart palpitations, joint pain in legs, loose stools,irregular menstruation
PhysicalExecution ofTasks
Does not know how to take her own bloodpressure or read output (132 over 94) fromthe blood pressure machine, needs explicitinstructionsDoes not know how to take her own pulse(112/min.), needs explicit instructions
Knows how to take her own blood pressure (132over 94) and read output from the blood pressuremachine, little instruction needed
Knows how to take her own pulse (112/min.), littleinstruction needed
Medical HistoryPresented Only ifElicited
Takes 500 mg of Tylenol daily for pain in legs. Takes no vitamins or supplements.
Delivered a baby (son named John) three months prior. Healthy pregnancy and vaginal delivery. Baby sleeps through the night and is healthy. Did not breast feed.
Attended six week postpartum visit to OB/GYN physician. No reports from the physician of anythingout of the ordinary medically at this visit.
Father is deceased from a car accident. Mother is alive and healthy. No siblings. No medical historyof chronic illnesses from mother’s or father’s side of the family.
Social HistoryPresented Only ifElicited
Moved in with her mother who lives in a rural town 1½ months ago. Single mother but father of babyis involved in the baby’s life. Used to work as a full-time accountant but is currently unemployed bychoice to spend time with her baby.
MIS Quarterly Vol. 40 No. 3—Appendices/September 2016 A19

Serrano & Karahanna/Compensatory Interaction Between User & Technology Capabilities
Figure I1. Experimental Setup for the Confederate/Patient
Appendix J
Experiment Manipulation Checks (Study 2)
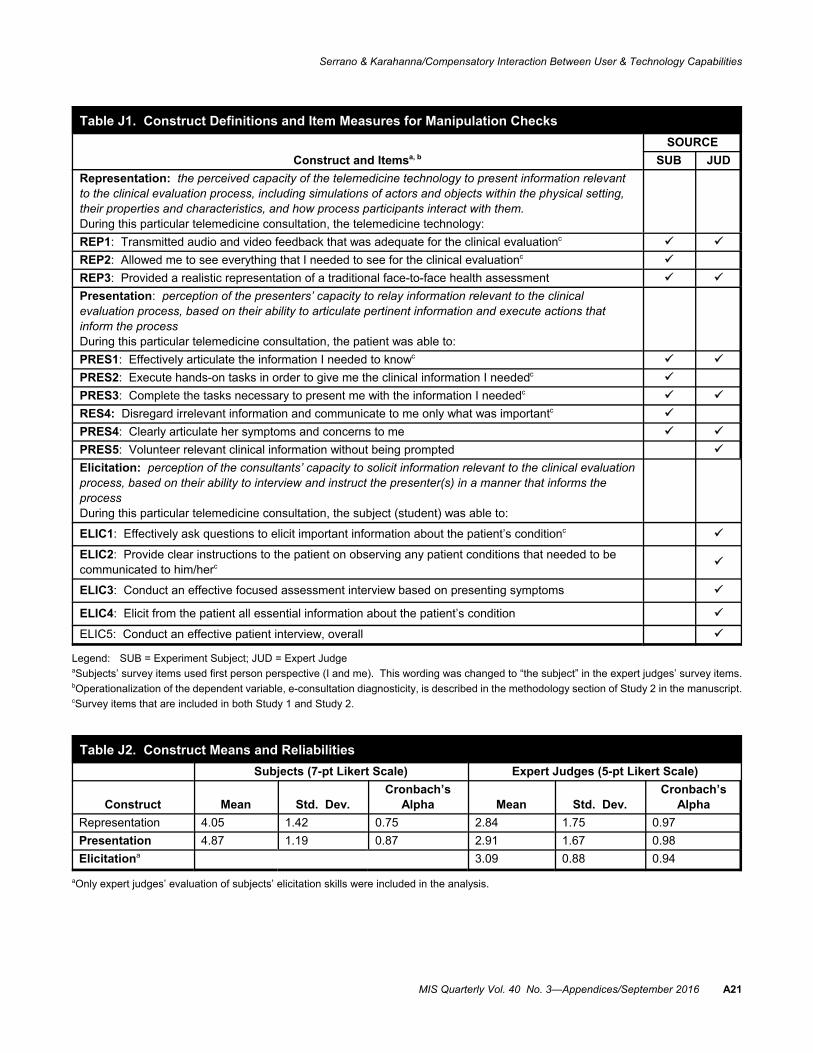
Questions in Table J1 were used to test the manipulations. Responses from both subjects and expert judges were utilized for the manipulationchecks. For subjects, responses were recorded on a seven-point Likert scale, with 1 representing “strongly disagree” and 7 indicating “stronglyagree.” For expert judges, responses were recorded on a five-point Likert scale, with 1 representing “strongly disagree” and 5 indicating“strongly agree.” Construct means and reliabilities are presented in Table J2. Results of manipulation tests are shown in Table J3.
A20 MIS Quarterly Vol. 40 No. 3—Appendices/September 2016
Serrano & Karahanna/Compensatory Interaction Between User & Technology Capabilities
Table J1. Construct Definitions and Item Measures for Manipulation Checks
Construct and Itemsa, b
SOURCE
SUB JUD
Representation: the perceived capacity of the telemedicine technology to present information relevantto the clinical evaluation process, including simulations of actors and objects within the physical setting,their properties and characteristics, and how process participants interact with them.During this particular telemedicine consultation, the telemedicine technology:
REP1: Transmitted audio and video feedback that was adequate for the clinical evaluationc
REP2: Allowed me to see everything that I needed to see for the clinical evaluationc
REP3: Provided a realistic representation of a traditional face-to-face health assessment
Presentation: perception of the presenters’ capacity to relay information relevant to the clinicalevaluation process, based on their ability to articulate pertinent information and execute actions thatinform the processDuring this particular telemedicine consultation, the patient was able to:
PRES1: Effectively articulate the information I needed to knowc
PRES2: Execute hands-on tasks in order to give me the clinical information I neededc
PRES3: Complete the tasks necessary to present me with the information I neededc
RES4: Disregard irrelevant information and communicate to me only what was importantc
PRES4: Clearly articulate her symptoms and concerns to me
PRES5: Volunteer relevant clinical information without being prompted
Elicitation: perception of the consultants’ capacity to solicit information relevant to the clinical evaluationprocess, based on their ability to interview and instruct the presenter(s) in a manner that informs theprocessDuring this particular telemedicine consultation, the subject (student) was able to:
ELIC1: Effectively ask questions to elicit important information about the patient’s conditionc
ELIC2: Provide clear instructions to the patient on observing any patient conditions that needed to becommunicated to him/herc
ELIC3: Conduct an effective focused assessment interview based on presenting symptoms
ELIC4: Elicit from the patient all essential information about the patient’s condition
ELIC5: Conduct an effective patient interview, overall
Legend: SUB = Experiment Subject; JUD = Expert JudgeaSubjects’ survey items used first person perspective (I and me). This wording was changed to “the subject” in the expert judges’ survey items.bOperationalization of the dependent variable, e-consultation diagnosticity, is described in the methodology section of Study 2 in the manuscript.cSurvey items that are included in both Study 1 and Study 2.
Table J2. Construct Means and Reliabilities
Subjects (7-pt Likert Scale) Expert Judges (5-pt Likert Scale)
Construct Mean Std. Dev.Cronbach’s
Alpha Mean Std. Dev.Cronbach’s
Alpha
Representation 4.05 1.42 0.75 2.84 1.75 0.97
Presentation 4.87 1.19 0.87 2.91 1.67 0.98
Elicitationa 3.09 0.88 0.94
aOnly expert judges’ evaluation of subjects’ elicitation skills were included in the analysis.
MIS Quarterly Vol. 40 No. 3—Appendices/September 2016 A21

Serrano & Karahanna/Compensatory Interaction Between User & Technology Capabilities
Table J3. Manipulation Test Results
Subjects (Seven-Point Likert Scale)
Expert Judges(Five-Point Likert Scale)
Low Mean(Std. Dev.)
High Mean(Std. Dev.) F Sig
Low Mean(Std. Dev.)
High Mean(Std. Dev.) F Sig
REP 3.42 (1.33) 4.82 (1.11) 29.40 .000 1.26 (0.17) 4.75 (0.20) 4168.82 .000
PRES 4.24 (1.21) 5.43 (0.85) 30.65 .000 1.18 (0.25) 4.47 (0.26) 3919.82 .000
ELICa 2.34 (0.45) 3.83 (0.49) 236.93 .000
Legend: ELIC = Elicitation; PRES = Presentation; REP = RepresentationaOnly expert judges’ evaluation of subjects’ elicitation skills were included in the analysis.
A22 MIS Quarterly Vol. 40 No. 3—Appendices/September 2016