the community well water testing program: volunteer...
TRANSCRIPT
The Community Well Water Testing Program: Volunteer Groundwater Nitrate Monitoring in the Southern Willamette Valley of Oregon
by Laura E. Moscowitz
A PROJECT PAPER
submitted to
Oregon State University
in partial fulfillment of
the requirements for the
degree of
Master of Science
Presented September 16, 2010
Commencement June 2011

AN ABSTRACT OF THE PROJECT OF
Laura E. Moscowitz for the degree of Master of Science in Water Resources Policy and
Management presented on September 16, 2010.
Title: The Community Well Water Testing Program: Volunteer Groundwater Nitrate
Monitoring in the Southern Willamette Valley of Oregon
In October 2006, the Oregon State University Extension Service Well Water
Program began a groundwater monitoring project to learn more about well water nitrate
levels in the Southern Willamette Valley and increase community involvement in
groundwater management activities. The primary objectives of the program were to
elucidate trends in spatial and temporal variability of nitrate in well derived drinking
water, facilitate understanding of regional groundwater issues through neighbor-to-
neighbor outreach, and assist rural residents in protecting their drinking water supply.
The Community Well Water Testing Program established neighborhood networks in
which volunteer monitors tested their own well and their neighbors’ wells for nitrate on a
monthly basis. Each volunteer monitor was responsible for collecting water samples from
3-9 neighborhood wells, analyzing the samples using a LaMotte nitrate-nitrogen test kit,
and reporting results to both the well owner and program managers. During the 2006-
2007 sampling year, 20 volunteer monitors tested 1,209 well water samples for nitrate.
The mean nitrate concentration for all tested wells over this period was 3.0 mg/L. Annual
mean nitrate values ranged from 0 to 14.1 mg/L with a median of 1.9 mg/L. Eleven wells
had an annual mean nitrate value over 7 mg/L, the Oregon groundwater nitrate action
level, while 6 wells had an annual mean nitrate value over 10 mg/L, the national nitrate
public water supply standard. Results showed considerable regional variability as well as
seasonal variation by well. Monitoring prompted questions, interest, and learning while
initiating conversations and involvement among neighbors. Collectively, monitoring and
neighborhood outreach brought attention to regional groundwater resources and
encouraged increased awareness.

TABLE OF CONTENTS
Page
INTRODUCTION...............................................................................................................1 LITERATURE REVIEW....................................................................................................3
1. Volunteer Environmental Monitoring......................................................................3 2. Volunteer Management............................................................................................5
2.1. Volunteer recruitment..................................................................................5 2.2. Volunteer motivation...................................................................................6 2.3. Volunteer retention......................................................................................7
PROJECT DESCRIPTION..................................................................................................9 3. Designing the monitoring program..........................................................................9
3.1. Program overview........................................................................................9 3.2. Study area boundaries................................................................................10
4. Pre-monitoring phase.............................................................................................11 4.1. Volunteer recruitment................................................................................11 4.2. Development of neighborhood networks...................................................13 4.3. Volunteer training......................................................................................16
5. Monitoring phase...................................................................................................17 5.1. Well water testing protocol........................................................................17 5.2. Data management.......................................................................................19 5.3. Nitrate results.............................................................................................20 5.4. Volunteer support and retention.................................................................21
DISCUSSION and RECOMMENDATIONS...................................................................21 6. Volunteer recruitment............................................................................................21 7. Volunteer motivation.............................................................................................22 8. Volunteer orientation.............................................................................................25 9. Nitrate sampling and analysis................................................................................26 10. Data reporting........................................................................................................28
CONCLUSION..................................................................................................................29 WORKS CITED................................................................................................................31 APPENDICES...................................................................................................................34
Appendix A: Volunteer Recruitment Documents........................................................34 A.1. Program introduction flier..........................................................................35 A.2. Program background for monitors.............................................................36 A.3. Program background for well volunteers...................................................38 A.4. Volunteer job description ..........................................................................40 A.5. Volunteer application.................................................................................41 A.6. Drinking water nitrates and your health factsheet.....................................43 Appendix B: Community Well Water Testing Program Manual................................45 Appendix C: Nitrate Results........................................................................................52
C.1. Data form for nitrate reporting...................................................................53 C.2. Electronic results sample...........................................................................54 C.3. Paper results sample...................................................................................55 C.4. Summary of nitrate results by well............................................................56 C.5. Quarterly monitoring report......................................................................60
1
INTRODUCTION
High nitrate concentrations have been found in groundwater in some parts of the
Southern Willamette Valley as a result of non-point source pollution from fertilizers,
animal waste and septic systems (Lane Council of Governments, 2006). Non-point source
pollution occurs when precipitation moves over the land surface and through the ground,
dissolving pollutants it comes in contact with and depositing them in various water
bodies including aquifers. The Department of Environmental Quality (DEQ) declared a
Groundwater Management Area (GWMA) in this region on May 10, 2004 after
confirming widespread nitrate contamination at levels above 7 milligrams per liter
(mg/L), the Oregon action standard for this type of project. A stakeholder group, the
GWMA Committee, has been formed to address groundwater contamination through the
development of an Action Plan that outlines voluntary strategies to reduce groundwater
nitrate, and protect and manage groundwater supplies. However, the full extent of nitrate
contamination is unknown and additional data is needed to assess the extent and severity
of nitrate contamination, and the risk consumption poses to rural residents (Eldridge,
2004). Supplemental monitoring is needed to develop an accurate picture of nitrate
contamination on the Southern Willamette Valley floor and evaluate changes in
groundwater nitrate in the GWMA over space and time (Lane Council of Governments,
2006).
Unlike municipal water users, rural residents who rely on well water do not
benefit from public health safeguards. The burden of water quality risk assessment and
protection falls on the individual well owner. As a portion of the nitrate has originated
from residential sources, well owners can help protect their water supply by adopting best
management practices and controlling the practices that present a water quality risk
(Simpson, 2004). However, most rural residents are unaware of their drinking water
quality, lack information related to well water management, and are not prepared to make
informed decisions about personal risk from their water (Lane Council of Governments,
2006). By providing citizens with the background necessary to understand their
groundwater resource and the role they have in protecting it, well owners may be more
motivated to support local groundwater management initiatives and implement practices
that reduce nitrate contributions.
2
A volunteer groundwater monitoring network has been established by the Oregon
State University Extension Service Well Water Program in the Southern Willamette
Valley with the dual purpose of supplementing the DEQ’s data from monitoring wells
and increasing community involvement in groundwater management activities. This
program takes a unique approach to assessing groundwater in that it relies solely on
volunteers for groundwater collection, assessment and reporting. While over 50 volunteer
programs have participated in the DEQ’s Volunteer Monitoring Program, this is the only
DEQ approved volunteer monitoring program that examines groundwater quality. A
review of published literature conducted at the time of program establishment found no
other documented volunteer groundwater monitoring programs, further suggesting the
novelty of this program (Parker, 2006).
In the summer of 2006, volunteers were recruited to provide neighbor-to-neighbor
outreach and monthly monitoring of their own and their neighbors’ wells for nitrate.
Volunteer monitors collected water samples from approximately 125 residential drinking
wells each month and performed a simple test for nitrate-nitrogen using a color
comparator field test kit. Volunteers also provided outreach and education to neighbors
and friends to increase awareness of regional groundwater issues, improve community
involvement, and promote changes in behavior that enhanced the safety of drinking water
supplies. The primary objectives of the program were to elucidate trends in spatial and
temporal variability of nitrate in well derived drinking water, facilitate understanding of
regional groundwater issues through neighbor-to-neighbor outreach, and assist rural
residents in protecting their drinking water supply.
This paper documents the establishment of the Community Well Water Testing
Program and focuses on the design of the monitoring program and volunteer
management. The first section is comprised of a literature review of volunteer monitoring
including an overview of volunteer monitoring programs and their value, volunteer
recruitment techniques, volunteer motivation, and volunteer retention. The project
description section describes program design, volunteer recruitment, training, and
management, nitrate testing protocol, data management, and nitrate results. The
discussion section examines the lessons learned from this project and provides

3
recommendations for future volunteer groundwater monitoring programs. Lastly, the
conclusion summarizes the key findings and outcomes of the project.
LITERATURE REVIEW
1. Volunteer Environmental Monitoring
Community-based environmental monitoring networks are increasingly being
looked to as a means to collect cost-effective data while encouraging public involvement.
This approach helps overcome government budget cuts and monitoring gaps by providing
needed data while promoting public involvement, collaborative management, and the
building of community partnerships. While the simpler techniques employed by
community groups do not produce the same accuracy or precision of lab-based testing,
community-based monitoring data can be used as a valuable screening tool to uncover
local and regional trends in water quantity and quality (Mayfield et al., 2001). With
regular training, adequate resources, and validated quality assurance/quality control
protocols, water quality data collected by community volunteers can be comparable to
that collected by professionals (Sharpe and Conrad, 2006).
Community-based research that partners citizen groups with university experts
has grown in response to the need for credible data collection techniques and professional
support. While the community group provides local knowledge, willing volunteers and an
interest in fostering stewardship, the university contributes resources ranging from
training, sample analysis and results interpretation to office space, information access and
advisory input. In response to a reduction in government funding and monitoring,
Citizens’ Environment Watch (CEW) was developed at the University of Toronto to
actively involve schools and community groups in environmental education and
monitoring across Ontario, Canada. From 1996 to 2001, CEW engaged over 20
community groups per year in monitoring the chemical parameters of local lakes and
streams but found wide variation in data quality, a quality control failure rate of 40% and
a resulting decline in volunteer commitment and confidence (Savan et al., 2003). Testing
the chemical parameters was also labor intensive and costly, and put pressure on the
group to fill a regulatory gap left by the government’s withdrawl in the area. As a result,

4
CEW switched their focus to ecological health indicators (benthic invertebrates, lichens,
E. coli) and with proper training, Savan et al. (2003) conclude that volunteers can collect
reliable data and make assessment that are comparable to professionals. Biological
indicators were found to be a simple and reliable tool for assessing water body health,
and the data collected by volunteers is used to both educate the community and warn of
upstream problems that require further investigation and attention. The experiences of
CEW highlight the importance of developing quality assurance and quality control
techniques in building credibility, the benefits of broad partnership building and the
critical role universities can play in community-based monitoring and stewardship (Savan
et al., 2003).
In addition to the sampling data that community-based monitoring networks
provide, volunteers also help educate and inform other community members, and build
the community’s capacity to address environmental problems. Overdest et al. (2004)
completed a survey of 155 experienced and 105 inexperienced Water Action Volunteers
(WAV) to determine whether monitoring programs increase issue understanding,
community networking, and social capacity. The WAV program, created in 1996,
engages volunteers in collecting biological, physical and chemical data, and performing
stewardship on nine river basins across Wisconsin. The results of the questionnaire
showed that experienced volunteers did not have a higher level of knowledge about
stream related topics and further investigation led Overdest et al. (2004) to conclude that
this was due to both sets of volunteers having a high level of subject knowledge at the
time they started volunteering. The study did show that experienced volunteers were
more likely to participate in political action events, provide monitoring information to
friends and neighbors, and engage in issue research and learning. The results also suggest
that the longer a volunteer participates in monitoring activities, the more they engage in
community action and the building of community networks. Overdest et al. (2004)
conclude that participation in volunteer monitoring programs such as WAV contributes to
the generation of denser social networks, the development of local capacity, and the
engagement of citizens in community action.
In their assessment of the effectiveness of the Atlantic Coastal Action Program
(ACAP), McNeil et al. (2006) also found that community-based environmental
5
management helped build local capacity and in turn, influence both local and regional
policies and programs. ACAP was started in 1991 in Atlantic Canada to engage citizens
and communities in becoming actively involved in managing and improving their coastal
resources. Volunteers participate in a range of activities from issue identification,
monitoring, and site cleanups to the development of management plans and community
education projects. Through a general assessment of program outcomes, McNeil et al.
(2006) found that the community-based approach helped build greater attention and
support for issues because the public felt that community groups are less biased than
government agencies and their results are more reliable. Programs like ACAP can
therefore successfully communicate research results and educate communities, and in
doing so, build a community’s capacity to be informed participants in decision-making
and management. McNeil et al. (2006) conclude that ACAP has shown that community-
based initiatives can produce environmental, economic, and social results through their
ability to successfully generate knowledge, advance issue understanding, create
partnerships, build capacity, and direct action.
2. Volunteer Management
2.1 Volunteer Recruitment
In their study of nutritional self-management strategies of rural older adults,
Arcury and Quandt (1999) outline an effective method for recruiting qualitative study
participants that may also be a valuable tool in the recruitment of volunteers. The method
takes a site-based approach that relies heavily on the use of gatekeepers, informed
community members who have access and knowledge of the population of interest. After
defining the population of interest, the researcher generates a list of sites that are used by
this population including religious organizations, community groups and service
providers. A gatekeeper is contacted at each site and this individual acts as a resource for
providing more information about the population, suggesting participants and other
groups to contact, and encouraging participation in the study. The gatekeeper plays an
important role in building community support for the project and helping project staff
gain entry into the community (Arcury and Quandt, 1999). The final steps are then to
recruit participants from each site and secure their participation.
6
The El Paso RSVP National Pilot Project (Madarchik, 1992) took a broader
approach to recruiting volunteers to participate in a wellhead protection program in
Texas. The program specialist identified organizations and individuals whose work or
interests related to the project and sent an information packet to each prospective
volunteer explaining the project. Intense and persistent telephone networking was used by
Madarchick (1992) to explain and “sell” the project, and secure participation. While
strategically placed flyers and media advertising (newspapers, radio, television) were
used to attract volunteers and gain community support, Madarchick (1992) concludes that
persuasive telephone calls were the key to successful recruiting.
2.2 Volunteer Motivation
Volunteer motivation can be used as a practical tool to target, recruit, and
maintain volunteers because it affords volunteer coordinators a better understanding of
volunteer needs and expectations. From a psychological perspective, there are six
motivational functions served by volunteerism: (1) values: opportunities provided to
express values related to helping others and humanity as a whole; (2) understanding:
learning new information, building skills, and exercising abilities; (3) social:
opportunities to build relationships with others or engage in activity that is viewed
positively by others; (4) career: gaining or maintaining skills that benefit career; (5)
protective: reducing guilt or negative feelings by helping others; and (6) esteem or
enhancement: increasing self-worth and personal development, and improving image by
helping (Clary et al., 1998; Allison et al., 2002).
Clary et al. (1998) developed and tested an inventory tool, the Volunteer
Functions Inventory (VFI), to assess the motivations of volunteers. The validated VFI
was then used in a six-part study to determine how the motivational functions of
volunteerism related to volunteer recruitment, satisfaction and commitment. Clary et al.
(1998) found that the functions of greatest importance to volunteers were value
(M=5.37), understanding (M=5.13), and enhancement (M=4.64), expressed as the mean
of six-point Likert scale ratings. Persuasive messages and recruitment techniques were
most effective when the opportunities provide by the volunteer opportunity met the
motivations of potential volunteers. Further, results showed a statistically significant

7
relationship between an individual’s functional motivations being met, and both their
level of satisfaction and their intention to continue volunteering (Clary et al., 1998).
Allison et al. (2002) assessed the motives of volunteers using a mailed survey that
included both open-ended questions and a VFI consisting of a seven-point Likert rating
scale. A total of 195 surveys were completed by Make a Difference Volunteers in
Phoenix, Arizona and the mean value of six-point Likert scale ratings showed
participant’s motivation to volunteer driven by value (M=6.10), followed by
understanding (M=4.76), and esteem (M=4.37)(Allison et al., 2002). While the study had
a low response rate (30.2%) and small sample size, the results did parallel those of Clary
et al. (1998). Based on the findings of these studies, the recruitment, participation and
long-term commitment of volunteers can be enhanced by better matching their
motivations to the benefits that a particular volunteer opportunity provides.
In a review of research on volunteering, Bussell and Forbes (2002) highlight an
additional driving factor, the social-adjustive motive. Individuals are more likely to
volunteer if someone they know asks them because there is less perceived social risk and
more inherent trust in the volunteer organization (Bussell and Forbes, 2002). Social
pressure and the desire to belong also play a role in this type of functional motivation,
and family and friends exert the most influence. In their survey of 392 active and 476
non-active member of the Appalachian Trail Conference, a nonprofit that oversees
management and protection of the Appalachian Trail, Martinez and McMullin (2004)
confirmed the role of social networks. Results showed that efficacy and social networks
were the most important factors in prompting an active member to volunteer and remain
committed to the organization whereas competing commitments drove non-active
members to remain inactive. Martinez and McMullin (2004) found that personal requests
prompted greater participation because they helped develop a more personal connection
to the organization and removed barriers such as perceived lack of efficacy, perceived
inability to perform tasks, and potential costs.
2.3 Volunteer Retention
In addition to satisfying functional motivations, effective volunteer management
requires effective planning, consideration, and support. A review of parks and recreation

8
volunteer programs found several common management strategies that facilitated greater
success and satisfaction. Volunteer coordinators must consider how best to use volunteers
so that volunteer’s time is both effective and meaningful, and they feel as if they are
making a real difference (Henderson and Silverberg, 2002). Volunteers should be given a
realistic estimation of the time and costs associated with volunteering, and the tasks that
they will be expected to perform so that they can make an informed decision about
whether the volunteer match is right for them. Henderson and Silverberg (2002) also
found that providing opportunities for volunteers to participate in activities with family or
friends, and interact with community members improved a program’s success.
Byron and Curtis (2002) examined the potential for burnout in Australia’s
Landcare program and based on their findings, they suggest ways volunteer organizations
can prevent decreases in volunteer participation and productivity. Landcare has been in
operation for over 20 years and has more than 4,000 groups working throughout Australia
to improve natural resource management and watershed health through community
education and field-based activities. A questionnaire based on the Maslach Burnout
Inventory (MBI) was sent out to Landcare participants in two regions of Victoria with
response rates of 71% and 73% respectively (Byron and Curtis, 2002). Burnout related to
emotional exhaustion was reported due to high participation, group leadership issues,
failure to address some issues and lack of acknowledgement whereas burnout due to a
lack of personal accomplishment was linked to factors such as lower participation, lack of
priority-setting, and the perception that the level of volunteer activity is linked to the
level of government support (Byron and Curtis, 2002). Byron and Curtis (2002) suggest
several means of preventing burnout at the organizational level including clear and
realistic expectations, intermediate benchmarks for measuring success, group priority
setting and the provision of technical and financial support. Leaders can reduce burnout
by fostering a sense of community involvement and maintaining open communication so
that issues can be addressed as they arise.
9
PROJECT DESCRIPTION
3. Design of the Monitoring Program
3.1 Program Overview
The Community Well Water Testing Program was developed as part of a
coordinated effort to reduce nitrate contributions, prevent future contamination, and
protect groundwater in the Southern Willamette Valley. It was designed in line with the
residential goals of the GWMA Action Plan to provide groundwater education and
information, perform focused outreach that addressed groundwater quality risks, and
establish a volunteer well monitoring network (Lane Council of Governments, 2006).
The program was created with the dual purpose of supplementing the DEQ’s data from
monitoring wells and increasing community involvement in groundwater activities. The
primary objectives of the program were to elucidate trends in spatial and temporal
variability of nitrate in well derived drinking water, facilitate understanding of regional
groundwater issues through neighbor-to-neighbor outreach, and assist rural residents in
protecting their drinking water supply. The volunteer network and the monitoring
strategy were developed to meet these objectives.
In recognition of the strength of community-based efforts and social networks, the
monitoring program was designed around the concept of neighborhood networks. The
neighborhood network is centered around a single volunteer monitor who collects water
samples from their well and several neighboring wells in their area, and performs simple
nitrate tests on a monthly basis. The monitoring program was designed to include up to
20 monitors who were each responsible for monitoring 3-5 wells including their own. All
wells were within approximately 2 miles of the volunteer monitor’s house. The
monitoring networks were kept small to increase volunteer interaction, assure sampling
convenience, and reduce the travel time and fuel costs incurred by monitors.
The monitoring strategy was to collect monthly well water samples from an
outdoor spigot and to test these samples for nitrate using a LaMotte nitrate-nitrogen test
kit. This color-comparator method was chosen based on the criteria of safety,
affordability and ease of use, necessitating some trade-offs in test kit accuracy. While
LaMotte did not provide any published estimates of test kit accuracy, lab experiments

10
conducted by Parker (2006) found the kit values and the actual values to differ by 1.9
mg/L ± 0.2 mg/L (mean percent error of 35% ± 3%). Kit values were generally less than
the actual nitrate value and error increased with increasing nitrate concentration (Parker,
2006).
Monthly nitrate result reports were sent to both the volunteer program coordinator
and to each of the volunteers whose wells had been tested. The data objectives were to
educate rural well owners about their water quality, increase groundwater awareness,
provide a baseline for trend analysis, and inform local decision makers. A DEQ approved
sampling plan was developed to meet the data objectives and volunteer needs while
ensuring that the data collected by volunteers is of a known and suitable quality (EPA,
1996). The selection of the test kit, development of testing protocol, analytical methods
requirements, quality assurance and quality control measures, and the Sampling and
Analysis Plan have previously been described by Parker (2006).
3.2 Study Area Boundaries
The boundaries of the GWMA were drawn from the DEQ’s original 2000-2001
study area to include known areas of documented high nitrate levels and to follow easily
recognizable geographic boundaries such as state highways and rivers (Aitken et al.,
2003). Because it’s probable that high groundwater nitrate concentrations may also exist
outside of this area, the decision was made to expand the volunteer monitoring network
beyond the GWMA boundaries to encompass a wider portion of the valley floor that is
expected to be vulnerable to nitrate based on topography and soil type. The Community
Well Water Testing Program boundaries roughly correspond to the limits of the shallow
alluvial aquifer in the Southern Willamette Valley, and are based on the study area of the
DEQ’s Southern Willamette Valley Groundwater Assessment 2000-2001 Nitrate Study in
which shallow groundwater nitrate was further characterized (Aitken et al., 2003).
Encompassing approximately 780 square miles, the volunteer study area includes the
cities of Albany, Brownsville, Coburg, Corvallis, Eugene, Harrisburg, Junction City,
Lebanon, Monroe, Tangent and Veneta, and portions of Lane, Linn and Benton Counties
(see Figure 1).
11
4. Pre-Monitoring Phase of Program Implementation
4.1 Volunteer Recruitment
The population of interest was identified as rural homeowners who relied on a
drinking water well and lived in Lane, Linn or Benton Counties, preferably within
GWMA boundaries. Beyond geography and groundwater reliance, the only limitation
placed on the sample population was the ability to commit to monthly well water
sampling for one year. Unlike traditional groundwater studies, the decision was made not
to limit participation based on well characteristics such as depth, screening level,
construction or age because the program aimed to incorporate all residents who may be at
risk from drinking water nitrates.
With assistance from community informants, we generated a list of sites used by
the population of interest: local churches, news sources, community groups, schools,
agricultural societies, environmental organizations, and government agencies. We then
contacted a gatekeeper at each of these sites, either by mail or phone, to introduce the
program and solicit recruitment advice. Based on these suggestions, volunteers were
recruited in June 2006 using mailings, flyers, meeting presentations, media
announcements (both radio and print), and neighborhood word of mouth. Recruitment
material provided a brief explanation of the program, ways in which people could
volunteer, and the benefits participants were expected to receive (see Appendix A). All
interested participants were directed to contact the program managers to learn how they
could get involved and have questions addressed.
Contact information was collected from all interested participants and they were
each sent a packet containing a volunteer application, an information sheet explaining
groundwater nitrate, the GWMA and the aims of the volunteer program, and an invitation
to attend a July community orientation in their area (see Appendix A). In addition to
basic contact information, the volunteer application solicited information on the
volunteer’s well, the most convenient time for monitoring, why they were interested in
volunteering, what they hoped to get out of the experience, and any relevant education,
experience, skills, or interests they possessed. In recognition of the role of social-
adjustive motives, perceived responsibility, positive peer pressure, and communal ties, all
interested volunteers were encouraged to speak with friends, family, and neighbors in
12
their area to encourage them to participate in monitoring efforts. They were provided
with recruitment material including flyers, bookmarks, and application packets to
distribute in their community.
When an application was received, the information provided was entered into a
database and the address of the interested participant was queried in an ArcMap database
to determine whether they resided within the study boundaries. A letter was sent to those
residing outside the program area that included an explanation of study boundaries, a
schedule of upcoming OSU Extension Well Water Program events, a drinking water
nitrate factsheet, and contact information should they have further questions. Those
residing within study boundaries received a post card reminding them of the upcoming
community orientation two weeks prior to the event. Community orientations were held
in Coburg, Covallis, Harrisburg, Junction City, and Monroe the week of July 17, 2006.
The main purpose of these meetings was to establish a connection between volunteers in
each neighborhood and strengthen their commitment to monitoring. The orientations
provide a short water quality training that included an overview of groundwater science,
local nitrate issues, and nitrate testing protocol. Each volunteer was given the opportunity
to practice using the test kit and analyze a water sample. Volunteers were encouraged to
talk with neighbors and recruit 3-5 people who were willing to have their water tested.
Orientation attendees were offered the opportunity to participate in preliminary summer
experiments that would allow them to learn more about their well water while helping to
determine sampling protocol. The orientations were attended by 22 monitors of which 11
volunteered to take part in the summer experiments. These experiments have been
described by Parker (2006).
Recruitment efforts ended in early September to allow sufficient time for training
and the formation of neighborhood networks. Twenty-two volunteers had committed to
be monitors and an additional 104 individuals volunteered to have their well water tested
each month as a part of the monitoring network. Qualitative information gathered from
volunteer applications and personal communications revealed a wide range in age,
education, occupation, income, and other demographic characteristics among volunteer
monitors. Volunteers ranged in age from 20 to greater than 70 years old, 12 monitors
were female and the remaining 10 were male. Monitors exhibited a full range of
13
education levels from less than a high school education to the completion of bachelors,
masters, and PhD degrees. Examples of monitor’s occupations include Oregon State
University botany student, freelance writer, potter, economist, teacher, University of
Oregon department head, scuba instructor, computer programmer, retired career marine,
stay at home parent, blueberry farmer, software engineer, water treatment plant
technician, Walmart manager, and tax consultant. Volunteers represented three counties
and twelve cities including Albany (5), Brownsville (2), Coburg (16), Corvallis (16),
Eugene (18), Halsey (1), Harrisburg (8), Junction City (40), Lebanon (2), Monroe (16),
Tangent (1), and Veneta (1). At least 34 volunteers lived within GWMA boundaries
while the majority of remaining volunteers lived within the larger study area. Several
wells were incorporated into the monitoring network that lay beyond study boundaries.
These exceptions were made when the volunteer monitor lived just outside the study area
or when a volunteer had recruited neighboring wells that lay beyond study boundaries.
An additional 66 individuals expressed interest in volunteering but were determined to be
ineligible either because they lived outside study boundaries or did not rely on a private
well as their drinking water source.
4.2 Development of Neighborhood Networks
All volunteers who met the minimum qualifications of living within study
boundaries, relying on a private well for their drinking water supply, and being willing to
have their water tested on a monthly basis were included in neighborhood networks. All
volunteers were required to fill out a volunteer application and the contact information
submitted on this form was entered into a volunteer database. The address of each
volunteer was imported into an ArcMap database and volunteer monitors were assigned a
list of wells to monitor based on proximity. To reduce fuel costs and driving time, an
effort was made to ensure that all wells were within 2 miles of the volunteer monitors
home. Neighborhood networks ranged in size from 3 to 9 wells with the average network
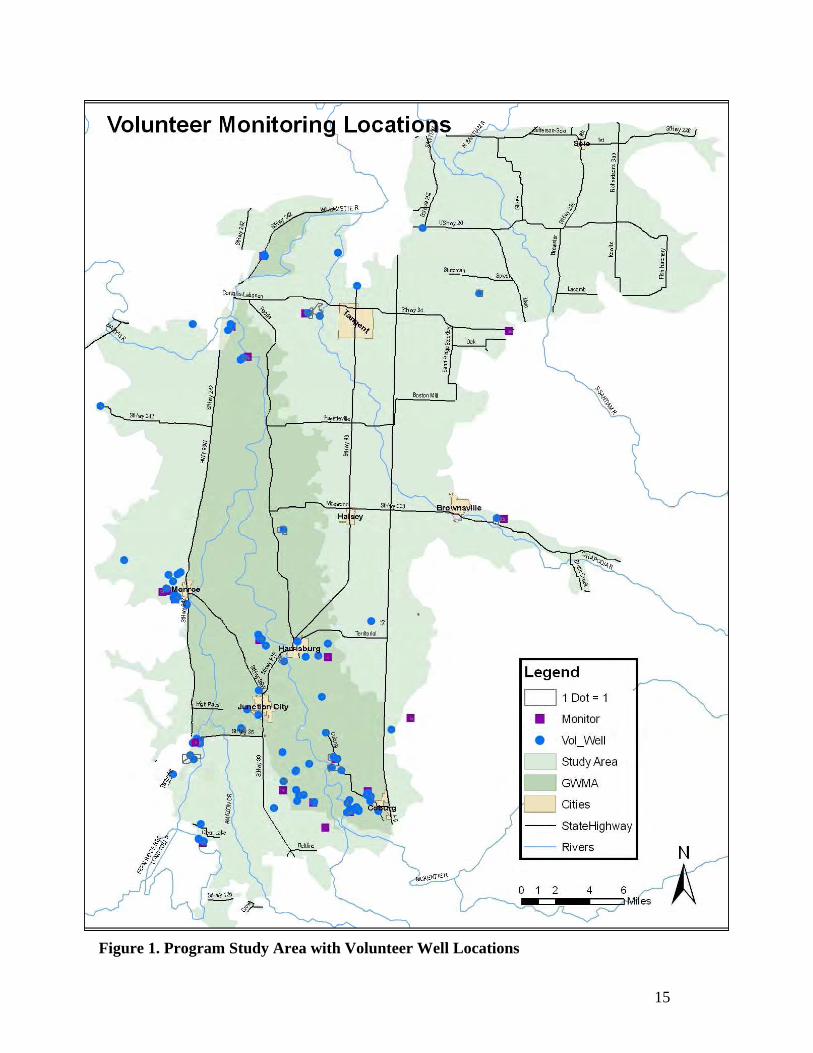
being comprised of 5.6 wells including the monitor’s own well (see Figure 1).
The recruitment efforts of volunteer monitors contributed significantly to the
number of program participants and the size of neighborhood networks. Both well

14
monitors and well volunteers took an active role in talking to neighbors and friends about
the program and encouraging their participation. Each monitor recruited at least 1 well
volunteer with an average recruitment of 3 wells per volunteer monitor. The volunteer
monitor was assigned at least 1 additional well of a neighbor they had not previously
been in contact with or recruited.
15
Figure 1. Program Study Area with Volunteer Well Locations
16
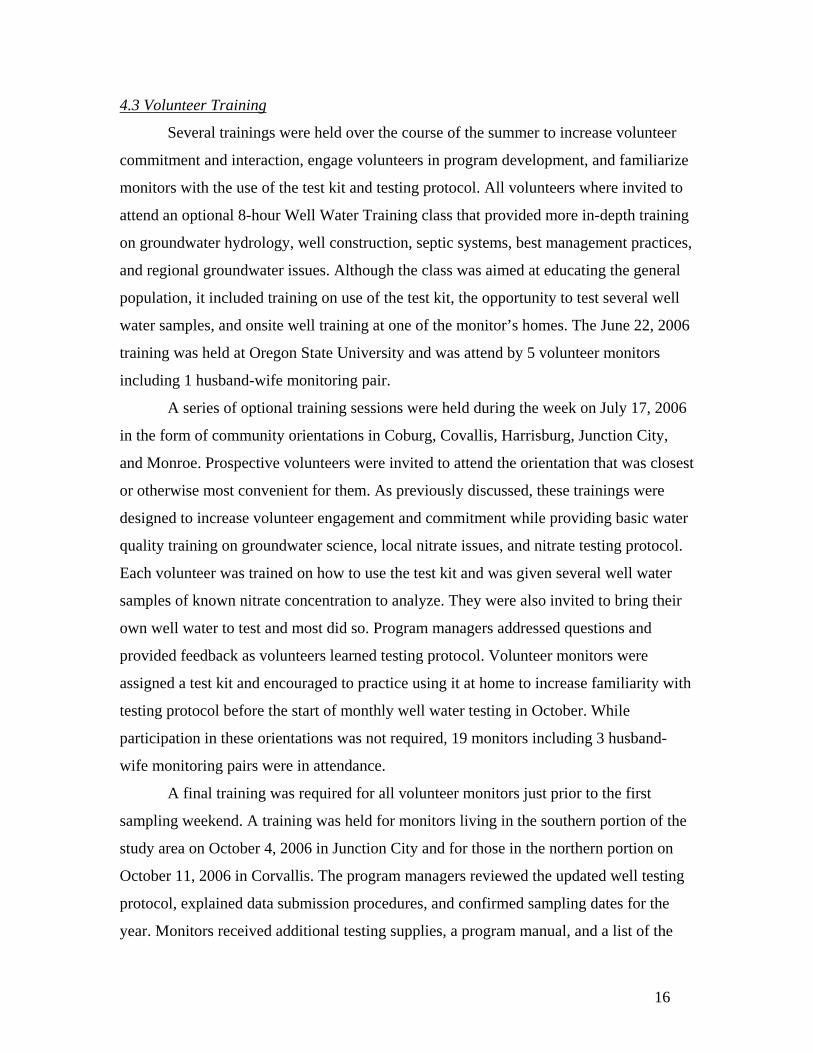
4.3 Volunteer Training
Several trainings were held over the course of the summer to increase volunteer
commitment and interaction, engage volunteers in program development, and familiarize
monitors with the use of the test kit and testing protocol. All volunteers where invited to
attend an optional 8-hour Well Water Training class that provided more in-depth training
on groundwater hydrology, well construction, septic systems, best management practices,
and regional groundwater issues. Although the class was aimed at educating the general
population, it included training on use of the test kit, the opportunity to test several well
water samples, and onsite well training at one of the monitor’s homes. The June 22, 2006
training was held at Oregon State University and was attend by 5 volunteer monitors
including 1 husband-wife monitoring pair.
A series of optional training sessions were held during the week on July 17, 2006
in the form of community orientations in Coburg, Covallis, Harrisburg, Junction City,
and Monroe. Prospective volunteers were invited to attend the orientation that was closest
or otherwise most convenient for them. As previously discussed, these trainings were
designed to increase volunteer engagement and commitment while providing basic water
quality training on groundwater science, local nitrate issues, and nitrate testing protocol.
Each volunteer was trained on how to use the test kit and was given several well water
samples of known nitrate concentration to analyze. They were also invited to bring their
own well water to test and most did so. Program managers addressed questions and
provided feedback as volunteers learned testing protocol. Volunteer monitors were
assigned a test kit and encouraged to practice using it at home to increase familiarity with
testing protocol before the start of monthly well water testing in October. While
participation in these orientations was not required, 19 monitors including 3 husband-
wife monitoring pairs were in attendance.
A final training was required for all volunteer monitors just prior to the first
sampling weekend. A training was held for monitors living in the southern portion of the
study area on October 4, 2006 in Junction City and for those in the northern portion on
October 11, 2006 in Corvallis. The program managers reviewed the updated well testing
protocol, explained data submission procedures, and confirmed sampling dates for the
year. Monitors received additional testing supplies, a program manual, and a list of the

17
neighborhood wells they would be testing, along with an accompanying map and well
volunteer contact information. The monitors were provided with additional hands-on
training in use of the test kit, and practiced testing and reporting nitrate values for several
known samples. Feedback was solicited from the monitors on the testing and reporting
protocol, and any remaining questions and concerns were addressed. The trainings were
attended by 21 volunteer monitors or monitoring pairs. The remaining volunteer monitor
could not attend due to work conflicts and was provided with one-on-one training at his
home on the first sampling day, October 14, 2006.
5. Monitoring Phase of Program Implementation
5.1 Well Water Testing Protocol
All volunteers were sent a postcard at the end of September with the schedule of
sampling days so they could plan accordingly (see Appendix B). Based on feedback
provided on the volunteer application as to which day would be most convenient, the
decision was made to sample on the second Saturday of every month. This avoided any
conflict with major holidays and allowed for sampling days that were consistent from
month to month and from network to network. While volunteer monitors were
encouraged to collect samples on Saturday, some flexibility was incorporated into the
monitoring plan by allowing a one day window before and after the designated sampling
day. This allowed samples to still be collected and tested in the event that the monitor
was out of town, ill or had some other scheduling conflict on the day of testing.
The well testing procedure consisted of four primary steps: sample collection,
sample analysis, clean-up of testing equipment, and reporting of results to well owners
and program managers (Parker, 2006). On the sampling day, the volunteer monitors
visited each well they were responsible for monitoring and collected a sample from each.
The decision was made to collect well water samples directly from an outdoor spigot to
minimize inconvenience to well owners and allow monitors flexibility in scheduling
sample collection. While most samples were taken from an outdoor spigot, monitors
often collected water from an indoor source at their own home and the homes of close
family or friends. With few exceptions, samples were taken from the same source each
month and any deviations were noted on the results form. The samples were collected by

18
turning on the tap, triple rinsing the sampling bottle with the water to be collected, and
filling the bottle with well water. Each 120-milliliter (mL) plastic screw-top sampling
bottle was labeled with a unique identifying number that corresponded to the well
location. This well identification number was recorded on sampling bottles, test tubes,
and results forms rather than the volunteer’s name to avoid any bias and minimize
associations between the well owner, location, and nitrate result.
The nitrate samples were then taken back to the monitor’s home and analyzed
using the LaMotte Nitrate-Nitrogen test kit. A 5-mL water sample was removed from the
sampling bottle using a syringe and placed in the test tube labeled with the corresponding
well identification number. Both the test tube and the syringe were tripled rinsed with the
collected water before the sample was analyzed. One tablet of nitrate #1 reagent was
added to the test tube, the test tube was closed with a rubber stopper, and the test tube
was shaken until the tablet dissolved. One tablet of nitrate #2 reagent was then added to
the test tube, the test tube was closed with a rubber stopper, and the sample was again
shaken until the tablet dissolved. The sample was left to develop for five minutes then the
test tube was inserted into the color comparator and the color of the sample was matched
to the closest color on the color slide which corresponded to the nitrate value. After
sample analysis was complete, the waste was disposed of by simply pouring it down the
sink or on the ground outside, as it was non-toxic. All equipment was rinsed with tap
water and allowed to air dry before returning it to the provided storage container.
Monitors were instructed to store all equipment in a cool, dry place away from direct
sunlight to avoid reagent damage. The program manual provided monitors with step-by-
step testing and clean-up instructions that included corresponding pictures for easy
reference (see Appendix B).
In November 2006 the program managers collected water samples from every
well in the program and tested them for total coliform bacteria and E. coli. Bacteria
sampling was provided free of cost to volunteers as an additional benefit to those
participating in the Community Well Water Testing Program. Sample collection methods
and the bacteria analysis procedure have been previously described by Parker (2006).
19
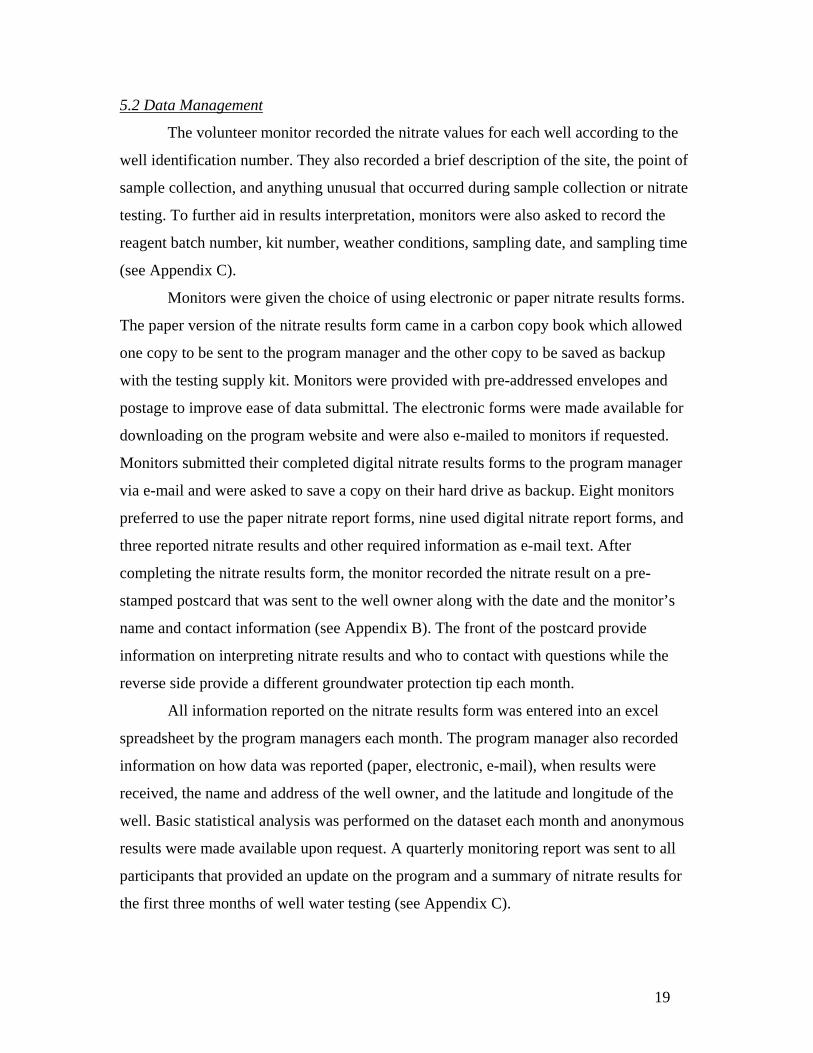
5.2 Data Management
The volunteer monitor recorded the nitrate values for each well according to the
well identification number. They also recorded a brief description of the site, the point of
sample collection, and anything unusual that occurred during sample collection or nitrate
testing. To further aid in results interpretation, monitors were also asked to record the
reagent batch number, kit number, weather conditions, sampling date, and sampling time
(see Appendix C).
Monitors were given the choice of using electronic or paper nitrate results forms.
The paper version of the nitrate results form came in a carbon copy book which allowed
one copy to be sent to the program manager and the other copy to be saved as backup
with the testing supply kit. Monitors were provided with pre-addressed envelopes and
postage to improve ease of data submittal. The electronic forms were made available for
downloading on the program website and were also e-mailed to monitors if requested.
Monitors submitted their completed digital nitrate results forms to the program manager
via e-mail and were asked to save a copy on their hard drive as backup. Eight monitors
preferred to use the paper nitrate report forms, nine used digital nitrate report forms, and
three reported nitrate results and other required information as e-mail text. After
completing the nitrate results form, the monitor recorded the nitrate result on a pre-
stamped postcard that was sent to the well owner along with the date and the monitor’s
name and contact information (see Appendix B). The front of the postcard provide
information on interpreting nitrate results and who to contact with questions while the
reverse side provide a different groundwater protection tip each month.
All information reported on the nitrate results form was entered into an excel
spreadsheet by the program managers each month. The program manager also recorded
information on how data was reported (paper, electronic, e-mail), when results were
received, the name and address of the well owner, and the latitude and longitude of the
well. Basic statistical analysis was performed on the dataset each month and anonymous
results were made available upon request. A quarterly monitoring report was sent to all
participants that provided an update on the program and a summary of nitrate results for
the first three months of well water testing (see Appendix C).
20
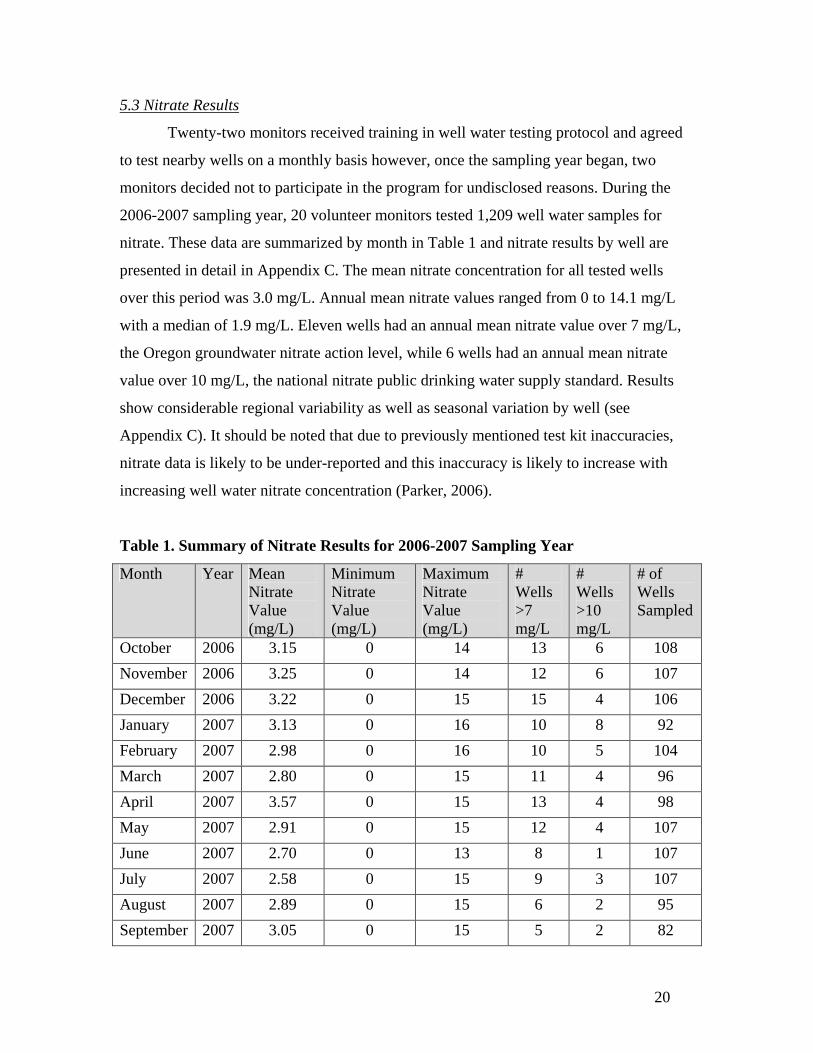
5.3 Nitrate Results
Twenty-two monitors received training in well water testing protocol and agreed
to test nearby wells on a monthly basis however, once the sampling year began, two
monitors decided not to participate in the program for undisclosed reasons. During the
2006-2007 sampling year, 20 volunteer monitors tested 1,209 well water samples for
nitrate. These data are summarized by month in Table 1 and nitrate results by well are
presented in detail in Appendix C. The mean nitrate concentration for all tested wells
over this period was 3.0 mg/L. Annual mean nitrate values ranged from 0 to 14.1 mg/L
with a median of 1.9 mg/L. Eleven wells had an annual mean nitrate value over 7 mg/L,
the Oregon groundwater nitrate action level, while 6 wells had an annual mean nitrate
value over 10 mg/L, the national nitrate public drinking water supply standard. Results
show considerable regional variability as well as seasonal variation by well (see
Appendix C). It should be noted that due to previously mentioned test kit inaccuracies,
nitrate data is likely to be under-reported and this inaccuracy is likely to increase with
increasing well water nitrate concentration (Parker, 2006).
Table 1. Summary of Nitrate Results for 2006-2007 Sampling Year
Month Year Mean Nitrate Value (mg/L)
Minimum Nitrate Value (mg/L)
Maximum Nitrate Value (mg/L)
# Wells >7 mg/L
# Wells >10 mg/L
# of Wells Sampled
October 2006 3.15 0 14 13 6 108
November 2006 3.25 0 14 12 6 107
December 2006 3.22 0 15 15 4 106
January 2007 3.13 0 16 10 8 92
February 2007 2.98 0 16 10 5 104
March 2007 2.80 0 15 11 4 96
April 2007 3.57 0 15 13 4 98
May 2007 2.91 0 15 12 4 107
June 2007 2.70 0 13 8 1 107
July 2007 2.58 0 15 9 3 107
August 2007 2.89 0 15 6 2 95
September 2007 3.05 0 15 5 2 82
21
5.4 Volunteer Support and Retention
The program managers were available to answer questions, address concerns, and
trouble shoots problems with volunteers over the phone and through e-mail. After the
first sampling day, all volunteer monitors were contacted by the program managers to
determine how sampling went and if there were any issues that needed to be addressed.
Follow-up training was provided over the phone and through e-mail, and onsite
assistance was given when requested. In November, program managers visited each well
location and meet with both well monitors and well volunteers to address well, septic
system, drinking water quality, and general program questions and concerns. As
volunteers began to learn more about groundwater in their area and interpret nitrate
results, the program managers provided additional background information on
groundwater hydrology, offered educational resources, and suggested further outreach
opportunities.
Regular contact was maintained with all volunteer monitors to ensure they had the
supplies and support necessary to continue monitoring. Monitors were sent additional
testing reagent when needed and due to additional recruitment, several monitors were
sent more sample bottles, test tubes, and results postcards so they could expand their well
network. The program managers provided follow-up to ensure that all data were reported
and monitors were contacted via phone or e-mail if their results had not been received
two weeks after the sampling date. While most monitors were vigilant about reporting
results in a timely manner, several monitors required monthly reminder e-mails and
repeat contact to deliver requested results.
DISCUSSION AND RECOMMENDATIONS
6. Volunteer Recruitment
Volunteer recruitment efforts confirmed the experience of Madarchick (1992),
identifying and targeting individuals and organizations whose interests were relevant to
the project was an effective means of attracting participants. Media advertising was also
found to be similarly effective. The initial response to the program was more than what
was expected and articles in the Eugene Register-Guard and Corvallis Gazette Times

22
seemed particularly successful in generating interest. We received numerous inquiries
during the first weeks of recruitment in response to media coverage but after this point
nearly all interest was generated through word of mouth. Unlike Madarchick (1992), the
use of an intense telephone campaign was quickly found to be ineffective and was
abandoned during the early stages of recruitment. Due to changes in technology since the
El Paso project, persuasive telephone calls were now seen as an annoyance and an
intrusion rather than a welcome recruitment technique. Volunteers preferred to seek out
information independently either through reading about the program online or in a
newspaper, or speaking to the program managers directly via phone or e-mail.
Though some aspects of the site-based model proposed by Arcury and Quandt
(1999) were helpful, the use of a gatekeeper was found to be largely unproductive. The
exercise of defining the population of interest and then generating a list of sites that were
used by the population prompted us to develop a more detailed picture of who our
potential volunteers were and precisely describe what characteristics that population had.
While this approach helped better define our volunteers, the use of gatekeepers and key
community sites were not an effective means of generating support or recruiting
volunteers. The use of advertising and recruitment materials at the identified sites did not
produce interest in the project or willing participants. Information on message boards and
in newletters did not attract attention and was overlooked by most readers. Contrary to
the findings of Arcury and Quandt (1999), the gatekeeper did not play an important role
in gaining entry to the community, building community support or encouraging
participation in the project. The gatekeepers did not have the personal connection to the
program that would lead them to actively recruit participants, and did not understand the
motivations of potential volunteers thereby leading their message to be less persuasive.
7. Volunteer Motivation
While a formal inventory tool to assess volunteer motivation was not used,
qualitative information provided on the volunteer applications suggests that the
Community Well Water Testing Program served many of the same motivational
functions of other forms of volunteerism (Clary et al., 1998; Allison et al. 2002). When
volunteers were asked why they were interested in volunteering and what they hoped to

23
get from this experience, their responses most commonly fell into the functional category
of understanding, followed by values and social motivations. Volunteers expressed a
desire to be better informed and learn more about their well, their water supply, local
groundwater conditions, and what could be done to improve water quality. The values
function was articulated in the volunteers’ desire to help others, contribute to efforts to
protect water and bring awareness to the community while the social function included
meeting neighbors and being environmentally active. While volunteering with the well
water program served many of the same motivational functions as other forms of
volunteerism, the relative importance of each function differed from previous volunteer
assessment. While our volunteers consistently cited understanding as the most important
functional motivation, both Clary et al. (1998) and Allison et al. (2002) found value to
drive volunteers followed by understanding.
In accordance with the finding that there is a direct correlation between a
volunteer’s functional motivation being met and both their level of satisfaction and their
intention to continue volunteering, opportunities were provided to increase volunteer
knowledge and understanding of well water. An effort was made to offer personalized
groundwater education, and facilitate learning among well water volunteers (Clary et al.,
1998). All volunteers were invited to enroll in free groundwater short courses, attend
GWMA meetings and participate in well water clinics. In addition to the groundwater
basics training provided during the orientation, educational material was distributed to
help facilitate better understanding of well water, and groundwater protection tips were
provided on the monthly results postcards. Through both targeting recruitment material
and volunteer activities to meet the overall functional motivations of the group, we aimed
to enhance the participation, satisfaction and long-term commitment of the volunteers.
While understanding and values were cited as the most important functional
motivations, the role of social motives should not be overlooked. The recruitment efforts
confirmed that family and friends exert a significant amount of influence in prompting
someone to volunteer and social motives played a strong role in an individual agreeing to
participate (Bussell and Forbes, 2002; Martinez and McMullin, 2004). In line with the
findings of Martinez and McMullin (2004), we found that being asked to participate by a
friend, relative, or neighbor seemed to build a more personal connection to the program

24
and lead a potential volunteer to conclude that participation was worthwhile and
beneficial. This was particularly true when a volunteer monitor asked an individual to
volunteer their well to be monitored as part of the program. As found in other volunteer
programs, when the monitor was someone they knew, many of the perceived barriers of
participation were removed and the well owner had a greater sense of trust and efficacy
regarding the volunteer program (Bussell and Forbes, 2002).
The density of many of the neighborhood networks can be attributed directly to
the social-adjustive motive and the recruitment efforts of the volunteers (Bussell and
Forbes, 2002). As an interested and engaged individual, volunteers had a personal
understanding of the opportunities presented by the monitoring program and proved to be
the most effective recruiters. Future recruitment efforts should aim to take advantage of
the positive influence of social pressure and the strength of social networks by further
promoting volunteer led recruitment.
Volunteer managers should incorporate this type of recruitment into their program
plan by developing methods to better encourage and support volunteer led recruitment.
These may include having more orientations during the recruitment period, and providing
training to volunteers on how best to market and recruit for the program. Monitors had
greater success at recruiting when the neighborhoods were dense, houses were in close
proximity, and personal connections to the monitors could readily be made. Therefore
recruitment success may be improved if managers targeted advertising, marketing, and
recruitment to localized areas that contained dense neighborhood clusters. Recruitment
material could be sent to all the residents of a populated street with the aim of actively
recruiting a monitor in the area. Once a monitor has volunteered, a follow-up mailing
could be sent out that introduces the volunteer monitor and directs interested well
volunteers to contact their neighbor to sign up for the program and get more information.
This may help open the door for the monitor by reducing the anxiety associated with
approaching an unfamiliar neighbor and making neighbors more receptive when the
monitor solicits their participation. It will also help build social connections within a
neighborhood network and decrease any perceived risks of participating.
25
8. Volunteer Orientation
The orientations played a vital role in building support for the program and
improving the likelihood of its success. They allowed volunteer monitors to learn more
about the program including what would be required of them, how the testing process
worked, and the potential benefits of participation. It also provided the opportunity to
have questions and concerns addressed before making a commitment to participate. Our
project confirmed that by providing realistic expectations of time, cost and tasks that
would be performed, potential volunteers were able to make a more informed decision as
to whether the program was right for them, and reduce the potential for burnout and
dropout (Henderson and Silverberg, 2002; Byron and Curtis, 2002). The hands-on
experience of learning how to test for nitrate and testing their own water samples
appeared to build confidence in the monitor’s ability to perform nitrate tests, and proved
that the test kit was quick, easy, and user friendly. By building personal connections,
confirming the value and relevance of the program, and fostering volunteer support and
commitment, the orientations built momentum for the program and increased volunteer
led recruitment efforts. Holding the orientations midway through the recruitment
campaign allowed us to use the volunteer’s enthusiasm and support to help drive
recruitment efforts and direct neighborhood network formation.
The community orientations were an effective means for building community
support for the program and removing some of the perceived barriers to participating.
Volunteers developed personal connections with both other participants and the program
managers, and these newly formed social connections strengthened their commitment to
the program and their resolve to participate. Confirming the findings of Henderson and
Silverberg (2002), providing opportunities for social interaction among volunteers and
other community members helped strengthen the program and expand its reach. Being
able to meet fellow volunteers and neighbors improved the perceived value of the
program, and decreased the perceived risk of participating. The orientations helped put a
face to the program and lessened any fears that its underlying purpose was government
regulation or restriction of private water rights. Based on the recommendations of
Henderson and Silverberg (2002), the program was designed to optimize volunteer
retention by ensuring the volunteer’s time was both meaningful and effective. Through
26
both talking to other volunteers and testing well water samples, the orientations helped
confirm that the volunteer work was relevant to their lives, a meaningful use of their
time, and filled a need in their communities.
9. Nitrate Sampling and Analysis
When the sampling year began, volunteers expressed confidence in their ability to
collect and test well water samples. They felt comfortable with the use of the kit after
having had several opportunities to practice using it and test their reading accuracy
against know samples during trainings. Volunteers described the test kit as quick, easy to
use and easy to maintain though one volunteer found it difficult to accurately determine
the nitrate level when the reading fell between two colors on the color slide. Specifically,
she found it “hard to tell” what the most accurate number should be when nitrate levels
fell between 2-4 mg/L and 6-8 mg/L because the colors were relatively similar and there
was no 3 or 7 mg/L on the color comparator to judge the test tube against. At these wells
she performed the test several times as a reassurance that she had made the correct
assessment. We provided follow-up training to this individual and reinforced the
instructions in the volunteer manual to match the color in the test tube to the closest color
on the slide and to record the number which falls in between when the color in the test
tube is between two colors on the slide. With additional practice and testing she became
comfortable making this estimation and more confident in her ability to match the colors.
Future efforts should include additional training on distinguishing between these ranges
of values and include known standards that fall in this spectrum so that volunteers can
gain further experience and gain confidence in making these distinctions.
While we encouraged volunteer monitors to consistently sample on the second
Saturday of each month, we allowed some flexibility so that the program was not
prohibitively restrictive to volunteers. There was a one day window before and after the
designated sampling day and no required sampling time so the monitor could more easily
fit sample collection and analysis into their schedule. This helped reduce scheduling
conflicts, missed sampling months and burnout associated with program rigidity.
However, this flexibility did not prevent lapses in monitoring altogether and future efforts
should include an on-call system which can be activated when a volunteer is unable to
27
participate in monitoring during a given month. Illness prevented monitors from
collecting samples on five occasions and a monitor was out of the country during the
collection period so no samples were taken during that month. Three volunteers with
school-age children had scheduling conflicts and collectively missed monitoring on four
occasions, explaining that samples weren’t taken because they were “too busy”, “didn’t
have time” or “life too hectic”.
While monitors were invited to contact the program manager if they had a conflict
during a given month they weren’t expressly instructed to do so. The program manager
was informed of the missed sampling period when missing data was sought, usually
several weeks after the designated sampling day. Future monitoring efforts should have a
backup plan in place so that wells can still be sampled when the designated monitor is
unavailable. The program manager would be the most appropriate person to assume this
role as they have knowledge of where each well is located and have had personal contact
with each well owner. Sampling instructions should clearly outline the procedure for
contacting the program manager and scheduling an alternate monitor to assume
responsibility for the neighborhood network when a conflict is foreseen.
In addition to sampling conflicts, monitors faced challenges collecting samples
during the winter months, particularly January, because they were unable to access well
water from an outdoor source. For the January sampling date monitors were not able to
collect water from eight wells because the pipes were frozen, at two sites the outside
water had been shut off, and one home had turned their well off completely for several
months while they were living in their winter home in Arizona. Monitors independently
tried to overcome sampling challenges by temporarily removing spigot weatherproofing,
seeking out an alternative outdoor collection site, or gaining access to an indoor tap from
the well owner. Monitors made note of any changes in collection site on the nitrate results
form but when an alternative collection point was not available and no one was home to
provide assistance, the monitor had to forgo sampling and took note of the problem that
was encountered.
While outdoor spigots remain the most appropriate collection point because they
minimize inconvenience to well owners and allow monitors flexibility in scheduling
sample collection, a site-based plan needs to be put in place that allows for the

28
continuation of sampling during winter months. Each well owner should be contacted at
the beginning of the sampling year to determine the best course of action given their
system and the specific modifications they make during winter months. This may include
allowing the monitor to collect a sample from an indoor tap or leaving a sample outside
the front door for the monitor to pickup and test. Winter conditions did not impact the
majority of sites so an alternative sampling plan will only have to be made for those sites
where there is no outside water available. The plan should be developed in advance to
ensure ease of sampling, collection efficiency and mutual understanding by both the well
owner and monitor.
10. Data Reporting
The reporting of results was equally successful in paper and electronic formats
although developing an online submittal system would likely prove beneficial to future
efforts. While the monitors were split nearly equally between their use of paper and
electronic datasheets, those with internet access expressed their desire to use a simple
webpage where they could enter and submit their data. When using the word document to
record the data they found it time consuming to either create a new document or delete
values from the previous month. When time was an issue, volunteers would often send
their results in the form of an e-mail because they found this to be the most efficient
method but details would often be left out such as time, weather, site description, point of
sample collect and comments. An online form would allow volunteers to quickly enter
data and associated information without losing the completeness of information. It may
also help make data submission more timely and reduce the frequency that monitors
forget to submit results.
While many volunteers consistently sent in results within a week of sampling,
there was a group of volunteers who required monthly reminders and follow-up to submit
data. One of these volunteers submitted paper datasheets and a phone call two weeks
after sampling was a sufficient reminder to send in results while the remaining three sent
in results electronically and required several e-mails to prompt data submittal. These
monitors all had school-age children and were trying to balance multiple commitments so
29
the reduction in time and effort required to submit the results online would likely have
prompted more timely results submittal and greater efficiency.
CONCLUSION
One of the primary questions this program sought to answer was would volunteers
readily engage in groundwater monitoring and take an active interest in learning more
about their drinking water supply. While volunteer monitors showed a range of
demographic characteristics, they all seemed to share a sincere interest in learning more
about their groundwater and becoming involved in community testing efforts. The hidden
nature of groundwater didn’t seem to dissuade people but rather sparked a desire to learn
more about a resource they took for granted and knew little about. Many had specific
questions they sought to answer and concerns they wanted to address. The volunteer’s
reliance on groundwater for their drinking water supply helped establish a personal
interest in water quality and a commitment to performing monthly nitrate monitoring.
Both the success of recruitment efforts and the continued participation of volunteers
suggest that groundwater monitoring can attract community interest and an active
volunteer base.
The LaMotte nitrate-nitrogen test kit does not provide the accuracy or precision
needed to use the monitoring data in a professional capacity but the nitrate results can be
used as a screening tool to indicate geographic and seasonal groundwater nitrate trends.
The strength of the data lies in the number of samples volunteers were able to collect, the
frequency of monitoring, and the regional breadth of sampling sites. By having a DEQ
approved Sampling and Analysis Plan in place we are able to ensure that data collected
by volunteers is of a known and suitable quality thereby lending greater credibility to
volunteer efforts and improving the usability of data. If the program is maintained, the
long-term monitoring data it generates could be used to assess groundwater quality trends
and the impact of management strategies on nitrate contamination. The capacity of the
volunteer monitoring program to elucidate nitrate trends in a cost-effective manner may
prove valuable to GWMA efforts. However, at this point it is unclear whether the data
will have a broader use among scientists and decision-makers.

30
While collecting well water nitrate data was the driving activity of the volunteer
program, emphasis was also placed on the building of local capacity and improving
public participation in groundwater management. Through participating in monitoring
activities, volunteers gained a better understanding of regional groundwater conditions
and the level of nitrate contamination in their well. Monitoring brought groundwater to
the conscious of participants, prompting many volunteers to ask questions, seek out more
information, and take an interest in their drinking water supply. Monthly nitrate results
generated conversations among neighbors and provided numerous learning opportunities.
Data were a catalyst for increasing groundwater knowledge and a means for monitors to
help educate their neighbors. Monitoring appears to be a successful outreach tool in
encouraging community involvement, and improving individual and community
groundwater knowledge. While it is uncertain whether this knowledge will facilitate
informed decision-making and the adoption of best management practices, building
awareness is an important first step in supporting local groundwater management efforts.
The hard work, dedication, and enthusiasm of volunteers in the Community Well Water
Testing Program has helped communities take this first step in the Southern Willamette
Valley GWMA.
31
WORKS CITED
Aitken, G., J. Arendt, and A. Eldridge. 2003. Southern Willamette Valley Groundwater
Assessment 2000-2001 Nitrate Study. Oregon Department of Environmental Quality, Portland, OR. Accessed on February 26, 2006 from http://www.deq.state.or.us/wq/groundwater/docs/swvgwma/nitratestudy.pdf.
Allison, L. D., M.A. Okun, and K.S. Dutridge. 2002. Assessing volunteer motives: a comparison of an open-ended probe and Likert rating scales. Journal of Community and Applied Social Psychology 12(4): 243-255. Accessed on March 12, 2006 from http://web.ebscohost.com.proxy.library.oregonstate.edu/ehost/pdfviewer/pdfviewer?vid=4&hid=112&sid=62ed98f5-05c2-48bf-942e-50813f511568%40sessionmgr114.
Arcury, T. A. and S. A. Quandt. 1999. Participant recruitment for qualitative research: A site-based approach to community research in complex societies. Human Organization 58(2): 128-133.
Bussell, H. and D. Forbes. 2002. Understanding the volunteer market: The what, where, who and why of volunteering. International Journal of Nonprofit and Voluntary Sector Marketing 7(3): 244-257. Accessed on February 5, 2006 from http://web.ebscohost.com.proxy.library.oregonstate.edu/ehost/pdfviewer/pdfviewer?vid=3&hid=112&sid=09cdcb3d-005c-4987-97a5-86b42671683a%40sessionmgr111,
Byron, I. and A. Curtis. 2002. Maintaining Volunteer Commitment to Local Watershed Initiatives. Environmental Management 30(1): 59-67. Accessed on March 12, 2006 from http://www.springerlink.com.proxy.library.oregonstate.edu/content/9r8ww8bd3t1cvjgb/fulltext.pdf.
Clary, E. G., M. Snyder, J. Copeland, J. Haugen, and P. Miene. 1998. Understanding and Assessing the Motivations of Volunteers: A Functional Approach. Journal of Personality and Social Psychology 74(6): 1516-1530.
Eldridge, A. 2004. Southern Willamette Valley Groundwater Summary Report. Oregon Department of Environmental Quality, Portland, OR. Accessed on February 26, 2006 from http://www.deq.state.or.us/wq/groundwater/docs/swvgwma/summaryrpt.pdf.
Henderson, K. and K. Silverberg. 2002. Good Work, If You Can Get It. Parks and Recreation 37(11): 26-34. Accessed on February 5, 2006 from http://web.ebscohost.com.proxy.library.oregonstate.edu/ehost/pdfviewer/pdfviewer?vid=3&hid=112&sid=7fc59059-9711-4f2e-909d-b2d341c266ff%40sessionmgr113.

32
Lane Council of Governments. 2006. Southern Willamette Valley Groundwater Management Area Action Plan Draft, Eugene, OR. Accessed on January 22, 2007 from http://www.deq.state.or.us/wq/groundwater/docs/swvgwma/draftactionplan.pdf.
Madarchik, L. S. 1992. How-To Manual For Ground Water Protection Projects. PDX Press, El Paso, Texas.
Martinez, T. A. and S. L. McMullin. 2004. Factors affecting decisions to volunteer in nongovernmental organizations. Environment and Behavior 36(1): 112-126. Accessed on March 12, 2006 from http://eab.sagepub.com/cgi/content/abstract/36/1/112.
Mayfield, C., M. Joliat, and D. Cowan. 2001. The roles of community networks in environmental monitoring and environmental informatics. Advances in Environmental Research 5(4): 385-395.
McNeil, T.C., F.R. Rousseau, and L.P. Hildebrand. 2006. Community-Based Environmental Management in Atlantic Canada: The Impacts and Spheres of Influence of the Atlantic Coastal Action Program. Environmental Monitoring and Assessment 113(1-3): 367-383. Accessed on March 12, 2006 from http://www.springerlink.com.proxy.library.oregonstate.edu/content/8h10673658223870/fulltext.pdf.
Overdest, C., C. H. Orr, and K. Stepenuck. 2004. Volunteer Stream Monitoring and Local Participation in Natural Resource Issues. Human Ecology Review 11(2): 177-185. Accessed on March 8, 2006 from http://www.humanecologyreview.org/pastissues/her112/overdevestorrstepenuck.pdf.
Parker, L. B. 2006. Volunteer Groundwater Monitoring: Implementation of a Community-Based Well Water Monitoring Network. M.S. Thesis, Oregon State University, Corvallis, OR.
Savan, B., A. J. Morgan, and C. Gore. 2003. Volunteer Environmental Monitoring and
the Role of the Universities: The Case of Citizens' Environment Watch. Environmental Management 31(5): 561-568. Accessed on March 8, 2006 from http://www.springerlink.com.proxy.library.oregonstate.edu/content/mnqcpw2m3ggh2x89/fulltext.pdf.
Sharpe, A. and C. Conrad. 2006. Community Based Ecological Monitoring in Nova Scotia: Challenges and Opportunities. Environmental Monitoring and Assessment, 113(1-3): 395-409. Accessed on October 8, 2006 from http://www.springerlink.com.proxy.library.oregonstate.edu/content/146253304113q778/fulltext.pdf.
33
Simpson, H. 2004. Promoting the Management and Protection of Private Water Wells. Journal of Toxicology and Environmental Health, Part A, 67: 1679-1704. Accessed on March 7, 2006 from http://web.ebscohost.com.proxy.library.oregonstate.edu/ehost/pdfviewer/pdfviewer?vid=4&hid=112&sid=d4c4e366-8245-4da8-82bb-2eb6c52e05fa%40sessionmgr111.
US Environmental Protection Agency (EPA). 1996. The Volunteer Monitor's Guide To Quality Assurance Project Plans. EPA 841-B-96-003.
34
APPENDIX A: Volunteer Recruitment Documents

35
Community Well Water Testing Program
HELP OSU SCIENTISTS GATHER INFORMATION ABOUT GROUNDWATER IN THE SOUTHERN WILLAMETTE VALLEY
� Work with your neighbors to learn more about your groundwater resource. � Be trained to collect water samples at your well and a few other nearby wells. � Perform simple nitrate tests and record the data monthly.
The OSU Extension Service Well Water Program is starting a groundwater monitoring program to learn more about well water nitrate in the Southern Willamette Valley. This is a unique
opportunity for homeowners with wells to participate in a groundwater study while learning more about their own drinking water. We are recruiting volunteers—individuals or teams—who can commit to a few hours once a month for at least one year. Training is provided and all expenses are covered. We will customize our support services to meet your needs.
Families, youth groups, service organizations, teachers and individual residents are all encouraged to consider this opportunity for hands-on learning and community involvement.
Three ways to volunteer—Pick the combination that is right for you
1. Become a Well Water Monitor Volunteers will be trained to collect well water samples and perform simple nitrate tests; a test kit and lab supplies will be provided. During the summer of 2006 we will be conducting a series of trainings and performing a variety of experiments in preparation for monthly data collection to begin in the fall. Ideally you would also offer your well as a sampling point, but exceptions can be made.
2. Offer your well as a monitoring location All wells that are part of the monitoring network will receive a complimentary test for bacteria at the beginning of the study and monthly testing for nitrate. Well locations will be recorded, but your name will not be used. We are looking for wells that will be convenient for the volunteer monitors, so consider checking with neighbors to see if they are also willing to have their well included.
3. Join the Well Water Outreach Team The OSU Extension Service Well Water Program offers programs to educate rural residents about their wells, septic systems, and the groundwater supplying their drinking water. Our aim is to protect your family’s health, your homestead investment, and the safety of the local groundwater resources. Well Water Outreach volunteers are needed to help us with water testing at community events and classes, assist with school and community activities, and simply to share accurate information with friends and neighbors. An 8-training is required. Well Water Monitors are strongly encouraged to take the Outreach Team training, but it isn’t required.
Well Monitoring Project
Laura Moscowitz, OSU Graduate Student, at (541) 207-7472 or e-mail: [email protected]
These service provided by
OSU Extension Service Well Water Program http://wellwater.oregonstate.edu
Southern Willamette Groundwater Project http://groundwater.oregonstate.edu/willamette
This project focuses on the Southern Willamette Valley Groundwater Management Area but other rural neighborhoods in Lane, Linn and Benton Counties will be considered.

36
Community Well Water Testing Program
What’s the big idea?
� Nitrate in Groundwater High nitrate concentrations have been found in some parts of the Southern Willamette Valley as a result of pollution from fertilizers, animal waste and septic systems. Nitrate has been linked to a variety of health concerns, although there is still no medical consensus that defines the specific risk from drinking nitrate-contaminated water. In addition to posing a health threat, the presence of groundwater nitrate may also indicate that other pollutants are contaminating the water supply. Thus, by addressing issues associated with observed high nitrate levels, we may be able to reduce current pollution and prevent future groundwater contamination. � Goals of the Community Well Water Testing program The program is designed to help residents, researchers and water quality managers learn more about well water quality in the Southern Willamette Valley. The information from the program should help those who have a stake in the Valley’s groundwater quality in making management decisions which affect our personal drinking water supply. Efforts will be focused on the Southern Willamette Valley Groundwater Management Area (see below) but will include other rural neighborhoods in Lane, Linn and Benton counties. Through this project we intend to:
o Increase community awareness and participation in protecting groundwater o Provide residents with information and resources for groundwater protection o Better describe the extent of nitrate contamination o Detect seasonal trends and regional changes in nitrate concentration o Provide information for decision makers o Eventually turn the reins over to you, the volunteers
* Goals may change in response to the communities’ needs and we welcome your suggestions. � The Southern Willamette Valley Groundwater Management Area In May 2004, the Oregon Department of Environmental Quality designated a portion of the
Southern Willamette Valley as a Groundwater Management Area after groundwater sampling
confirmed widespread nitrate contamination. Along with this designation, an action plan has
been developed which suggests changes in practices which add nitrate to groundwater, and calls
for the establishment of a volunteer monitoring network for nitrate. The boundaries of the area
were drawn both to include areas where high levels of nitrate had been reported and follow
known geographic boundaries, such as state highways and rivers. Because it is probable that
high groundwater nitrate concentrations may also exist outside of the area, this volunteer
monitoring network will encompass a wider portion of the valley floor.
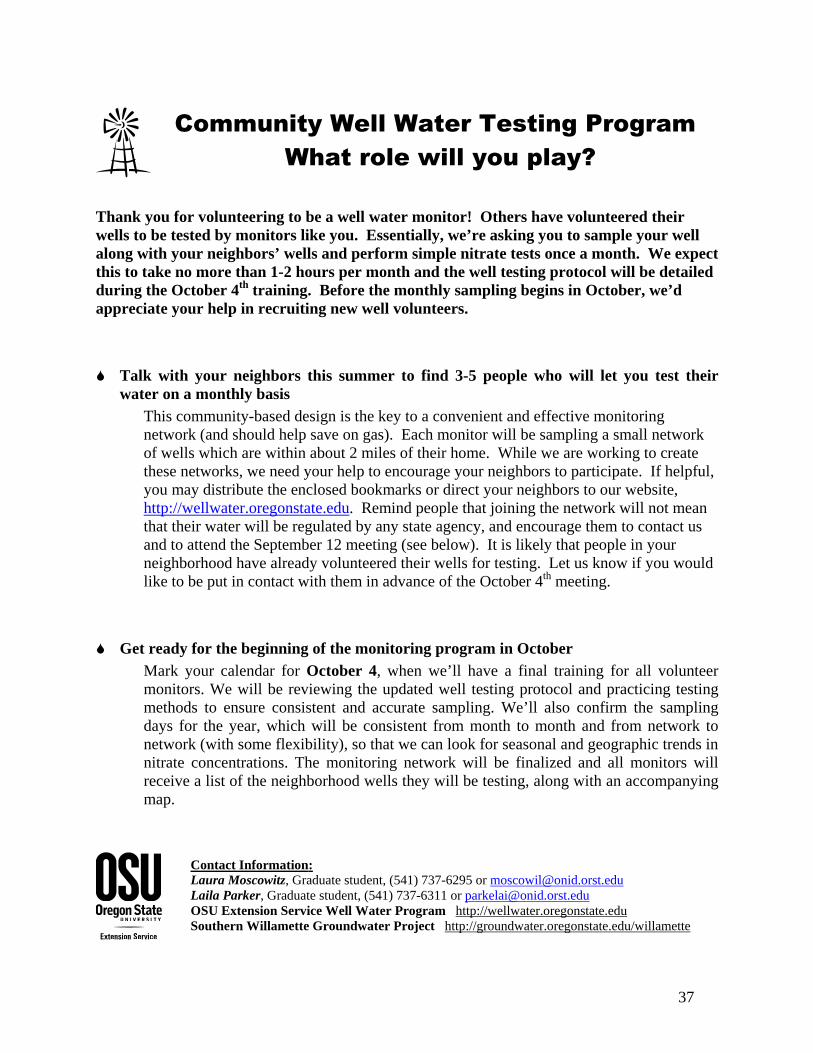
37
Community Well Water Testing Program
What role will you play?
Thank you for volunteering to be a well water monitor! Others have volunteered their wells to be tested by monitors like you. Essentially, we’re asking you to sample your well along with your neighbors’ wells and perform simple nitrate tests once a month. We expect this to take no more than 1-2 hours per month and the well testing protocol will be detailed during the October 4th training. Before the monthly sampling begins in October, we’d appreciate your help in recruiting new well volunteers.
� Talk with your neighbors this summer to find 3-5 people who will let you test their
water on a monthly basis This community-based design is the key to a convenient and effective monitoring network (and should help save on gas). Each monitor will be sampling a small network of wells which are within about 2 miles of their home. While we are working to create these networks, we need your help to encourage your neighbors to participate. If helpful, you may distribute the enclosed bookmarks or direct your neighbors to our website, http://wellwater.oregonstate.edu. Remind people that joining the network will not mean that their water will be regulated by any state agency, and encourage them to contact us and to attend the September 12 meeting (see below). It is likely that people in your neighborhood have already volunteered their wells for testing. Let us know if you would like to be put in contact with them in advance of the October 4th meeting.
� Get ready for the beginning of the monitoring program in October
Mark your calendar for October 4, when we’ll have a final training for all volunteer monitors. We will be reviewing the updated well testing protocol and practicing testing methods to ensure consistent and accurate sampling. We’ll also confirm the sampling days for the year, which will be consistent from month to month and from network to network (with some flexibility), so that we can look for seasonal and geographic trends in nitrate concentrations. The monitoring network will be finalized and all monitors will receive a list of the neighborhood wells they will be testing, along with an accompanying map.
Contact Information: Laura Moscowitz, Graduate student, (541) 737-6295 or [email protected] Laila Parker, Graduate student, (541) 737-6311 or [email protected] OSU Extension Service Well Water Program http://wellwater.oregonstate.edu Southern Willamette Groundwater Project http://groundwater.oregonstate.edu/willamette

38
Community Well Water Testing Program
What’s the big idea?
� Nitrate in Groundwater High nitrate concentrations have been found in some parts of the Southern Willamette Valley as a result of pollution from fertilizers, animal waste and septic systems. Nitrate has been linked to a variety of health concerns, although there is still no medical consensus that defines the specific risk from drinking nitrate-contaminated water. In addition to posing a health threat, the presence of groundwater nitrate may also indicate that other pollutants are contaminating the water supply. Thus, by addressing issues associated with observed high nitrate levels, we may be able to reduce current pollution and prevent future groundwater contamination. � Goals of the Community Well Water Testing program The program is designed to help residents, researchers and water quality managers learn more about well water quality in the Southern Willamette Valley. The information from the program should help those who have a stake in the Valley’s groundwater quality in making management decisions which affect our personal drinking water supply. Efforts will be focused on the Southern Willamette Valley Groundwater Management Area (see below) but will include other rural neighborhoods in Lane, Linn and Benton counties. Through this project we intend to:
o Increase community awareness and participation in protecting groundwater o Provide residents with information and resources for groundwater protection o Better describe the extent of nitrate contamination o Detect seasonal trends and regional changes in nitrate concentration o Provide information for decision makers o Eventually turn the reins over to you, the volunteers
* Goals may change in response to the communities’ needs and we welcome your suggestions.
� The Southern Willamette Valley Groundwater Management Area
In May 2004, the Oregon Department of Environmental Quality designated a portion of the Southern Willamette Valley as a Groundwater Management Area after groundwater sampling confirmed widespread nitrate contamination. Along with this designation, an action plan has been developed which suggests changes in practices which add nitrate to groundwater, and calls for the establishment of a volunteer monitoring network for nitrate. The boundaries of the area were drawn both to include areas where high levels of nitrate had been reported and follow known geographic boundaries, such as state highways and rivers. Because it is probable that high groundwater nitrate concentrations may also exist outside of the area, this volunteer monitoring network will encompass a wider portion of the valley floor.

39
Community Well Water Testing Program
What role will you play?
Thank you for volunteering your well for the monitoring network! Others have volunteered to become monitors and test a number of their neighbors’ wells, including yours. By participating in this program, you will be allowing a monitor to visit your property and test your well water for nitrate once a month. Before the monthly sampling begins in October, we’d appreciate your help in recruiting new well volunteers.
� Talk with your neighbors and encourage them to become part of your neighborhood
well water testing network Each monitor will be sampling a small network of wells which are within about 2 miles of their home. This community-based design is the key to a convenient and effective monitoring network. It is likely that someone in your neighborhood has already volunteered to be a monitor – let us know if you would like to be put in contact with them. In the meantime, we need your help to encourage your neighbors to participate. You may distribute the enclosed bookmarks or direct your neighbors to our website, http://wellwater.oregonstate.edu. If you are able to recruit any of your neighbors, please let us know so that we can mail them more information and an application.
� Provide as much information as possible about your well location and construction. For each well that is included in the network, we will be accessing publicly available well records through the Department of Water Resources. This information should help in the interpretation of the nitrate data. The more information you provide about your well, the easier it will be for us to locate this record. Please include information on well depth, location, age, previous landowners, and whether your taxlot number has been changed since the well was drilled, if this is readily available. This data can be recorded on the enclosed application.
Contact Information: Laura Moscowitz, Graduate student, (541) 737-6295 or [email protected] Laila Parker, Graduate student, (541) 737-6311 or [email protected] OSU Extension Service Well Water Program http://wellwater.oregonstate.edu Southern Willamette Groundwater Project http://groundwater.oregonstate.edu/willamette

40
Volunteer Monitor Job Description OSU Community Well Water Testing Program
Date: June 28, 2006 Job Title: Volunteer Monitor Name of Agency: OSU Extension Services Well Water Program Job description: Volunteer monitors, working individually or in teams, will sample their well and a few other nearby wells. Ideally each monitor will offer their well as a sampling point, but exceptions will be made. A LaMotte Nitrate-Nitrogen Test Kit will be used to test for groundwater nitrate and is provided to all monitoring teams. This kit uses a zinc-based method that is safe for the user, provides an accurate screening and generates no hazardous waste. During the summer of 2006 we will be conducting a series of trainings and performing a variety of experiments in preparation for monthly data collection to begin in the fall. Interested monitors also have the opportunity to become part of the Well Water Outreach Team and provide important groundwater education and assistance in the community.
Position responsibilities:
• Collect well water samples and screen for nitrate on a monthly basis
• Follow established sampling protocols and testing guidelines when monitoring
• Submit nitrate data to be entered into an online water quality database
• Serve as a community resource for well water information
Skills and qualifications: Interest in learning more about your drinking water supply and the desire to become more involved in regional groundwater protection efforts. The ability to commit to regular sampling and established program guidelines. Basic computer skills are desirable but not required. No monitoring experience necessary, all training will be provided. All participants must rely on a private well for their drinking water and live within the Southern Willamette Valley Groundwater Management Study Area.
Training available: Participants will be trained to collect well water samples, perform simple nitrate tests and follow established quality assurance and quality control (QAQC) protocols. Optional training will cover related topics including basic hydrology, regional groundwater issues, drinking water safety, septic and well maintenance, and effectively working with the public. Field sessions will also be held that address well construction issues, groundwater protection and proper field sampling techniques. OSU Extension Well Water Program staff will provide all training and on-going job support for the monitoring teams.
Benefits of participating include: • Learning first hand about your well and water quality. • Receiving free nitrate screening, bacteria test, and a report of your well water results. • Training in groundwater basics, water testing and well and septic system care. • Contributing to an improved scientific understanding of local groundwater. • Getting involved in your neighborhood and community.
Time commitment: Approximately 1-2 hours, once a month, for at least one year.
Job site: In your neighborhood.
For more information on this and other OSU Extension well water programs, contact:
Laila Parker - Laura Moscowitz Program Coordinators (541) 737-6311 [email protected]
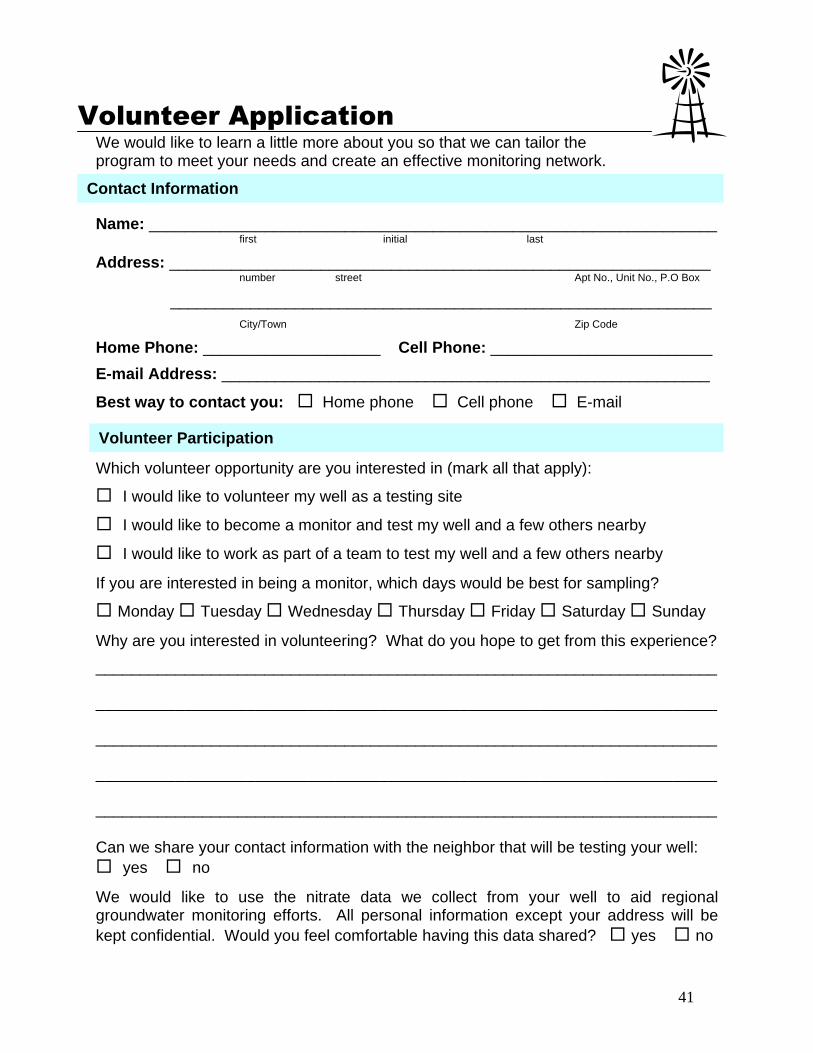
41
Volunteer Application We would like to learn a little more about you so that we can tailor the program to meet your needs and create an effective monitoring network.
Name: ________________________________________________________________ first initial last
Address: _____________________________________________________________ number street Apt No., Unit No., P.O Box
_____________________________________________________________ City/Town Zip Code
Home Phone: ____________________ Cell Phone: _________________________
E-mail Address: _______________________________________________________
Best way to contact you: � Home phone � Cell phone � E-mail
Which volunteer opportunity are you interested in (mark all that apply):
� I would like to volunteer my well as a testing site
� I would like to become a monitor and test my well and a few others nearby
� I would like to work as part of a team to test my well and a few others nearby
If you are interested in being a monitor, which days would be best for sampling?
� Monday � Tuesday � Wednesday � Thursday � Friday � Saturday � Sunday
Why are you interested in volunteering? What do you hope to get from this experience?
______________________________________________________________________
______________________________________________________________________
______________________________________________________________________
______________________________________________________________________
______________________________________________________________________
Can we share your contact information with the neighbor that will be testing your well: � yes � no
We would like to use the nitrate data we collect from your well to aid regional groundwater monitoring efforts. All personal information except your address will be kept confidential. Would you feel comfortable having this data shared? � yes � no
Contact Information
Volunteer Participation

42
Do you rely on well water for your drinking water? � yes � no
Do you know where your well is located? � yes � no
Do you have an outside spigot? � yes � no
Approximate well depth (if known): _____ feet Approximate well age: _____ years
No special skills are needed but you are welcome to detail your related talents below. Relevant education, volunteer and work experience: ____________________________
______________________________________________________________________
______________________________________________________________________
Skills, interests, hobbies, or qualifications that you would like to bring to this program: ______________________________________________________________________
______________________________________________________________________
______________________________________________________________________
Do you have experience with (mark all that apply):
� Working in the outdoors � Participating in scientific research
� Entering data on the internet � Working with computers
� Working with the public � Environmental data collection
Do you have any questions or concerns regarding your participation?
______________________________________________________________________
______________________________________________________________________
______________________________________________________________________
Thank you for your interest and time. We look forward to working with you.
Signature: _______________________________________ Date: ______________
Please return the completed application in the enclosed envelope by July 13th.
If you have questions or would like more information contact: Laila Parker / Laura Moscowitz
Program Coordinators (541) 737-6311
Special skills or qualifications
Signature of Agreement
Well Information

43
Drinking Water Nitrates and Your Health LAURA MOSCOWITZ, Program Coordinator, SWV Community Well Water Testing Program What are nitrates? Nitrates are inorganic compounds that naturally occur at low levels in soil, air, and water. Human activities can increase nitrate levels and cause contamination of water supplies. The most common sources of nitrates are fertilizers, animal manure, and septic systems. What is the difference between nitrates and nitrites? Nitrogen is present in many forms in our environment. It undergoes a variety of chemical reactions and changes that result in the production of nitrogenous compounds, two of which are nitrate and nitrite. Nitrate is the form that is most commonly found and measured in water. Nitrates and nitrites can be converted to carcinogenic nitrosamines by bacteria in the body. How much nitrate am I exposed to? The amount of nitrate that enters the body depends on personal habits and environmental conditions. Nitrate can be acquired through ingestion of drinking water, food, or medication but not during bathing. Vegetables have been found to account for more than 70% of nitrates in the typical diet with the remaining 21% coming from drinking water and 6% from meat products. Root vegetables, celery, collard greens, lettuce, spinach, cauliflower, and broccoli have especially high nitrate content. Nitrites conversely are found in the highest concentrations in cured or smoked meats and are not typically found in water. Why should I worry about nitrates? Groundwater that has become contaminated by nitrates may pose a threat to public health. Private wells are particularly at risk because they are not regulated by the government and do not have to follow water quality guidelines; monitoring is the
responsibility of the owner. Shallow, private wells are more prone to contamination and tend to have higher nitrate levels than public water supplies. The US Environmental Protection Agency regulates public drinking water supplies to a health standard of 10 milligrams per liter. These standards have been adopted to protect the public and prevent water related illness. Can nitrates cause health problems? There is a potential health risk involved in drinking water that is high in nitrates. Scientific studies have found nitrates to be associated with methemoglobinemia, diabetes, negative reproductive outcomes, and various forms of cancer. Research findings have been mixed though and evidence is not conclusive. A limited number of studies have also found links to thyroid dysfunction, impaired immune response, decreased liver function, and respiratory infection; results have not been well confirmed. What is methemoglobinemia? Methemoglobinemia is the illness most commonly linked to elevated nitrate levels and is the basis of the federal health standards. Also known as “blue-baby syndrome”, this is a blood disorder that primarily affects infants younger than 6 months. When nitrate is consumed it is converted by bacteria in the body to another chemical form, nitrite. Nitrite then interacts with the hemoglobin in red blood cells and reduces their ability to carry oxygen. If the blood cannot deliver enough oxygen to the body’s tissues, cells begin to die and the skin takes on a blue tinge. The majority of cases do not result in death and are completed resolved when the source of nitrate is removed.
Fact Sheet
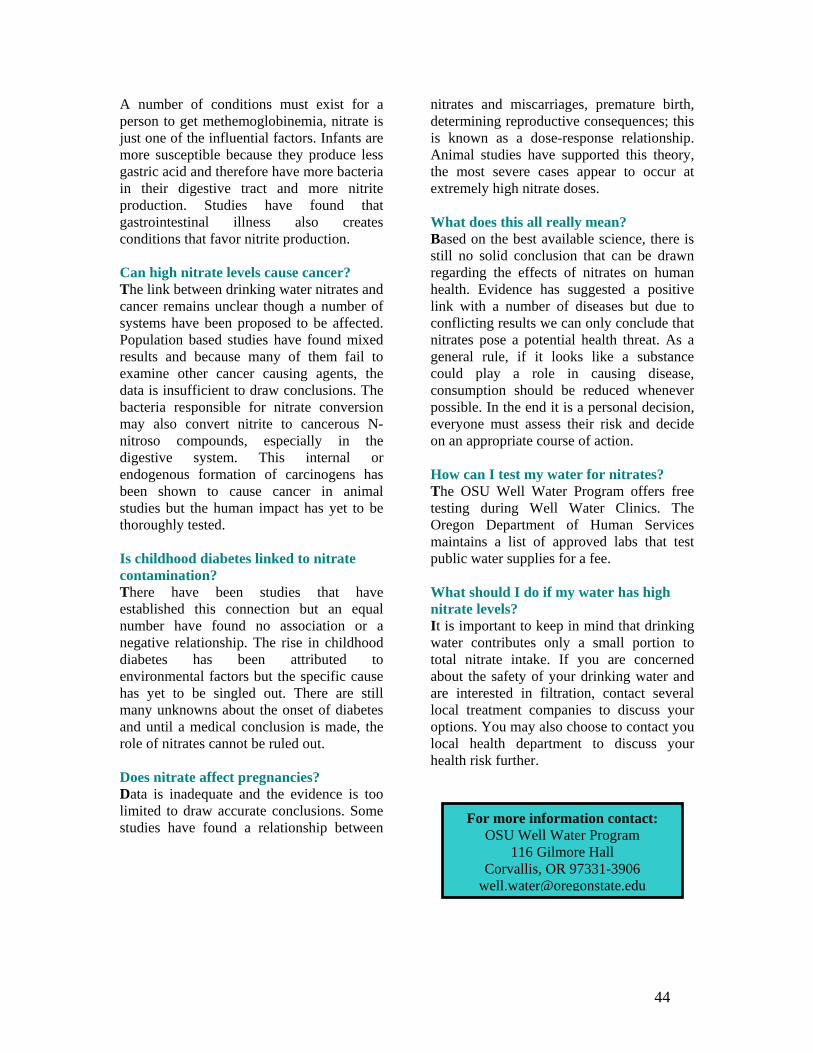
44
A number of conditions must exist for a person to get methemoglobinemia, nitrate is just one of the influential factors. Infants are more susceptible because they produce less gastric acid and therefore have more bacteria in their digestive tract and more nitrite production. Studies have found that gastrointestinal illness also creates conditions that favor nitrite production. Can high nitrate levels cause cancer? The link between drinking water nitrates and cancer remains unclear though a number of systems have been proposed to be affected. Population based studies have found mixed results and because many of them fail to examine other cancer causing agents, the data is insufficient to draw conclusions. The bacteria responsible for nitrate conversion may also convert nitrite to cancerous N-nitroso compounds, especially in the digestive system. This internal or endogenous formation of carcinogens has been shown to cause cancer in animal studies but the human impact has yet to be thoroughly tested. Is childhood diabetes linked to nitrate contamination? There have been studies that have established this connection but an equal number have found no association or a negative relationship. The rise in childhood diabetes has been attributed to environmental factors but the specific cause has yet to be singled out. There are still many unknowns about the onset of diabetes and until a medical conclusion is made, the role of nitrates cannot be ruled out. Does nitrate affect pregnancies? Data is inadequate and the evidence is too limited to draw accurate conclusions. Some studies have found a relationship between
nitrates and miscarriages, premature birth, determining reproductive consequences; this is known as a dose-response relationship. Animal studies have supported this theory, the most severe cases appear to occur at extremely high nitrate doses. What does this all really mean? Based on the best available science, there is still no solid conclusion that can be drawn regarding the effects of nitrates on human health. Evidence has suggested a positive link with a number of diseases but due to conflicting results we can only conclude that nitrates pose a potential health threat. As a general rule, if it looks like a substance could play a role in causing disease, consumption should be reduced whenever possible. In the end it is a personal decision, everyone must assess their risk and decide on an appropriate course of action. How can I test my water for nitrates? The OSU Well Water Program offers free testing during Well Water Clinics. The Oregon Department of Human Services maintains a list of approved labs that test public water supplies for a fee. What should I do if my water has high nitrate levels? It is important to keep in mind that drinking water contributes only a small portion to total nitrate intake. If you are concerned about the safety of your drinking water and are interested in filtration, contact several local treatment companies to discuss your options. You may also choose to contact you local health department to discuss your health risk further.
For more information contact: OSU Well Water Program
116 Gilmore Hall Corvallis, OR 97331-3906
45
APPENDIX B: Community Well Water Testing Program Manual
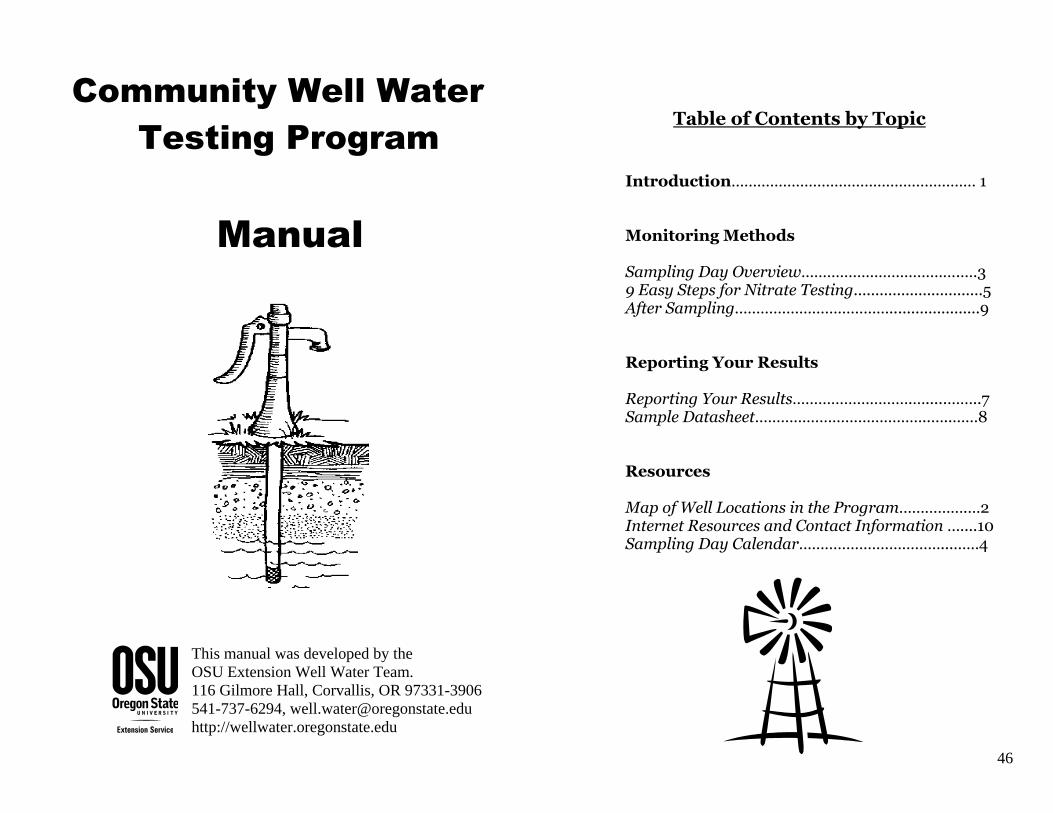
46
Community Well Water
Testing Program
Manual
This manual was developed by the OSU Extension Well Water Team. 116 Gilmore Hall, Corvallis, OR 97331-3906 541-737-6294, [email protected] http://wellwater.oregonstate.edu
Table of Contents by Topic
Introduction………………………………………………… 1
Monitoring Methods
Sampling Day Overview……………………………….….3 9 Easy Steps for Nitrate Testing..............................5
After Sampling……………………………….....................9
Reporting Your Results Reporting Your Results……………………….….....……..7 Sample Datasheet…………………………………..…..……8
Resources Map of Well Locations in the Program…………….…2 Internet Resources and Contact Information …....10 Sampling Day Calendar……………………………...……4

47
Introduction
As a volunteer well monitor, you play a key
role in assessing and managing groundwater
quality in the Willamette Valley. Maybe you
became a volunteer because you are concerned
about nitrate levels in your own well, or maybe you
are interested in protecting groundwater quality
across the Willamette Valley. By becoming a well
monitor, you are helping to collect region-wide
information about well-water nitrate levels, and
raising awareness about well water issues. This
manual is designed to help with your monthly
sampling and data reporting. Resources for more
information about groundwater issues can be found
on page 10. You may always contact the OSU
Well Water Extension program with any questions
you may have about groundwater, well water,
septic systems or monitoring.
Thanks for volunteering!
Map of Well Locations in the Program
LegendGWMAWell Program extentState HighwayVolunteer Well Locations
LegendGWMAWell Program extentState HighwayVolunteer Well Locations
LegendGWMAWell Program extentState HighwayVolunteer Well Locations
Each month, the nitrate level at each of the wells marked on the map will be tested by a volunteer. The grey region encompasses the geographic extent of the community well water testing program. The darker region within the project boundaries is the Southern Willamette Valley Groundwater Management Area (GWMA) – see the related website on page 9. Locations will be added as wells are volunteered.

48
Sampling Day Calendar for 2006-2007
If you cannot sample on the designated day, please try to sample on the day before or after.
Thank you for volunteering!
Southern Willamette Valley
Community Well Water Testing Program
Sampling Day Overview
� Visit the wells on your list and collect a sample at each, using a labeled sample bottle, as described on page 3.
� Analyze each sample using the nitrate test kit
following the protocol on pages 5-6. � After sampling, follow the clean-up procedure on
page 9. � Report your results to the well owner and to the
project managers as described on pages 7 & 8. Before heading out, check your kit to make sure that you
have:
o Sampling bottles, labeled with station ID# o Test tubes, labeled with station ID# o Test tube rack o Syringe o LaMotte nitrate test kit with:
� Reader � Adequate reagents (Nitrate 1 & 2)
o Datasheet o Pen or pencil o Watch or timer o Umbrella for rainy days o Clipboard (optional) o Safety glasses (optional) o Gloves (optional)
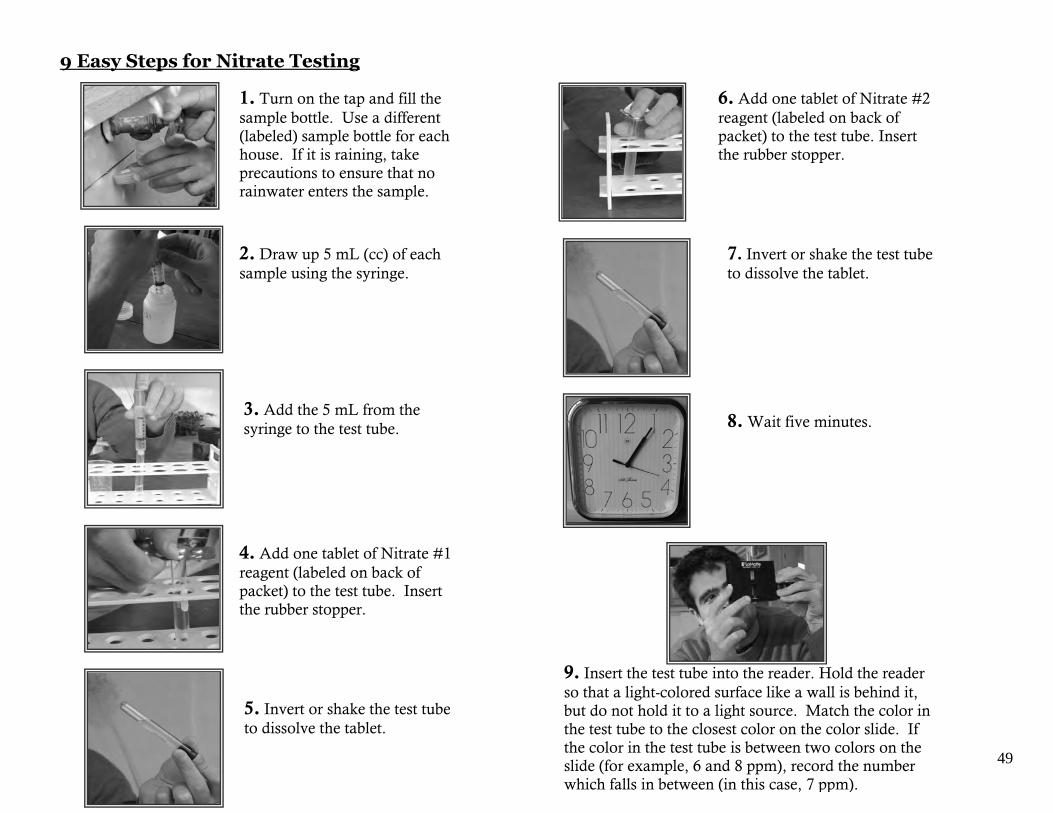
49
1. Turn on the tap and fill the
sample bottle. Use a different (labeled) sample bottle for each house. If it is raining, take precautions to ensure that no rainwater enters the sample.
2. Draw up 5 mL (cc) of each
sample using the syringe.
5. Invert or shake the test tube
to dissolve the tablet.
6. Add one tablet of Nitrate #2
reagent (labeled on back of packet) to the test tube. Insert the rubber stopper.
9 Easy Steps for Nitrate Testing
7. Invert or shake the test tube
to dissolve the tablet.
3. Add the 5 mL from the
syringe to the test tube. 8. Wait five minutes.
9. Insert the test tube into the reader. Hold the reader
so that a light-colored surface like a wall is behind it, but do not hold it to a light source. Match the color in the test tube to the closest color on the color slide. If the color in the test tube is between two colors on the slide (for example, 6 and 8 ppm), record the number which falls in between (in this case, 7 ppm).
4. Add one tablet of Nitrate #1
reagent (labeled on back of packet) to the test tube. Insert the rubber stopper.

50
Reporting your results
You’ll n
eed to
record
each
readin
g o
n tw
o fo
rms: a
postca
rd a
nd a
data
sheet.
Postca
rds (sa
mple b
elow
) should
be m
ailed
or
deliv
ered to
each
well o
wner ev
ery m
onth
. The sid
e sh
ow
n is w
here y
ou w
ill enter y
our in
form
atio
n a
nd
the m
onth
ly rea
din
g. E
ach
month
’s postca
rd h
as a
differen
t gro
undw
ater p
rotectio
n tip
on th
e reverse
(mailin
g) sid
e. If a w
ell’s nitra
te readin
g in
tersects tw
o ca
tegories, fill o
ut th
e postca
rd a
s show
n b
elow
.
Sample Datasheet
ID numbers will be
assigned before the
first sampling date.
These will be used to
protect each person’s
privacy.
Back-up anonymous
identification which will
jog your memory, such as
house color, in case the
ID # is unclear or
incorrect.
Should be the
same at each
house every
time.
Always fill out the datasheet completely, and save a copy of the
data form in case it gets lost in transit. Digital forms can be saved
on your hard drive, paper forms in the envelope in your kit.
Digital forms may be downloaded from:
http://wellwater.oregonstate.edu/volunteer.php
Record in
whole
numbers.
For example,
5, not 5.3.
Anything unusual about
the sample or sampling
process, such as a
downpour during
sampling, or if you waited
more than 5 minutes to
read the sample.
NITRATE RESULTS - SOUTHERN WILLAMETTE VALLEY COMMUNITY WELL WATER TESTING PROGRAM Sampling date:_____10/4/06______________________ Time: ___2:00 pm__ Weather: ___partly cloudy, no rain_____________ Monitor name(s): ___Laila Parker_____________________________________ Kit #:___12_________ Contact info:_______541-737-6311__________________________________ Reagent 1 Batch #:_2345A Reagent 2 Batch #:__4798
Well ID # Site Description Point of Sample Collection Sample Result Comments
SWV12.2 Green house with blueberries Spigot next to garage 5 ppm Water cloudy
A sa
mple d
ata
sheet is sh
ow
n o
n p
age 8
. Alw
ays fill o
ut
the d
ata
sheet co
mpletely
. Rea
din
gs o
f less than 1
ppm
nitra
te are still in
teresting, a
nd th
e acco
mpanyin
g
info
rmatio
n (w
eath
er, reagen
t batch
num
ber) m
ay h
elp in
in
terpretin
g th
e results. Y
ou m
ay su
bm
it your d
ata
sheet
usin
g eith
er U.S
. mail o
r e-mail (see p
age 9
).

51
After Sampling DISPOSING OF WASTE You may pour any and all wastes produced during the sampling process down your sink or on the ground, as the test kit reagents are non-toxic. CLEANING YOUR EQUIPMENT Clean your equipment between samples and after the entire sampling process to improve the accuracy of your readings. o Before collecting each sample:
� Triple rinse the sample bottle with the water to be collected
o Before analyzing each sample: � Triple rinse the test tube and the syringe (pull up
and squirt out water) with the collected water. o After sampling:
� Rinse everything with tap water and air dry. STORING YOUR EQUIPMENT Once all of your equipment is dry, store it in the provided box in a cool dry place (e.g. not in your car). Reagents in the test kit may be damaged if exposed to prolonged light, heat or cold. MAILING YOUR DATA
Regular mail (using provided postage & envelopes):
Well Water Monitoring Program 116 Gilmore Hall , OSU Corvallis, OR 97333
E-mail: [email protected]. Please save a copy of each completed data form in the envelope in your monitoring kit or on your hard drive.
Internet Resources & Contact Information Groundwater-specific resources:
S. Willamette Valley Groundwater Management Area: http://groundwater.oregonstate.edu/willamette/
The Oregon Well Water Program: http://wellwater.oregonstate.edu/
Oregon Water Resources – Well Log Look-up page: http://apps2.wrd.state.or.us/apps/gw/well_log/Default.aspx
Oregon Department of Environmental Quality – Groundwater: http://www.deq.state.or.us/wq/groundwa/wqgw.htm Volunteer programs:
This program: http://wellwater.oregonstate.edu/volunteer.php
Volunteer Water Quality Monitoring: http://www.usawaterquality.org/volunteer/
U.S. Environmental Protection Agency Volunteer Monitors: http://www.epa.gov/ow`ow/monitoring/volunteer/
Groundwater Guardian: http://www.groundwater.org/gg/learnmore.html No web access? Call Gail Glick Andrews for a wealth of groundwater-related information: 541-737-6295 Run out of postage? Datasheets? Questions? Concerns? Call Laura Moscowitz at 541-737-6294. This manual was developed by the Oregon State University Extension Well Water Team. Thanks to the 2005 Weeds Watch Out! Manual (Oswego River Basin, NY) which was used for guidance.

52
APPENDIX C: Nitrate Results
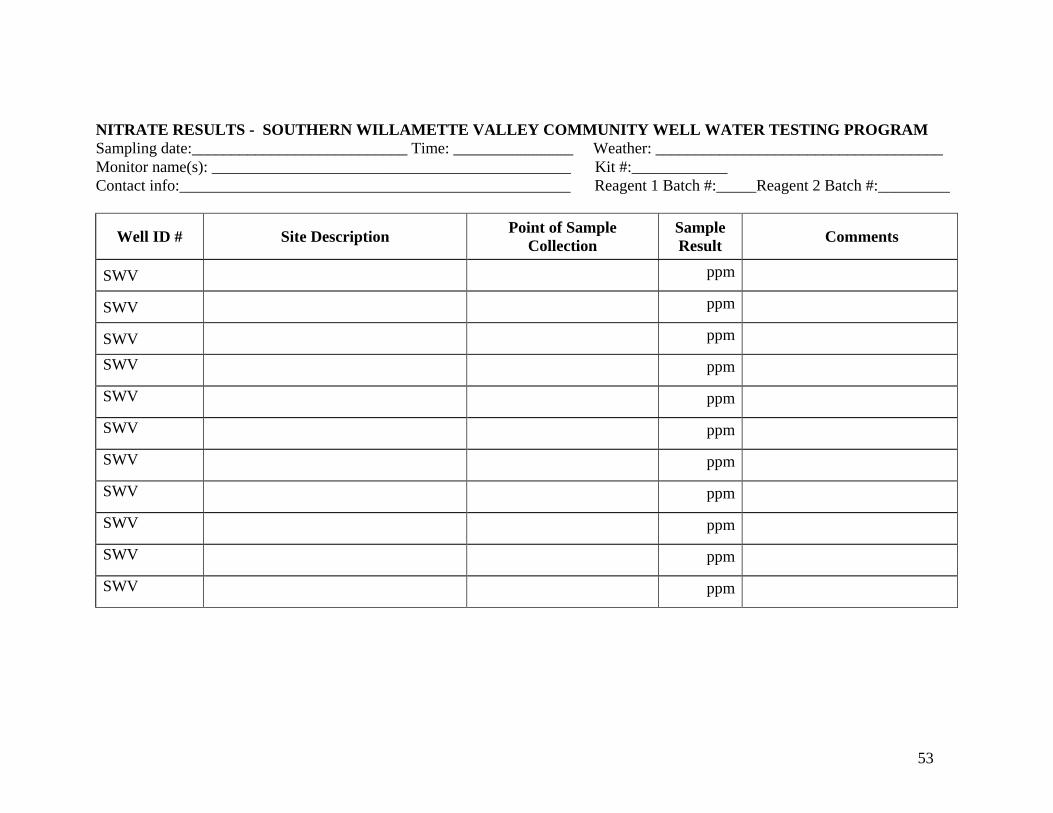
53
NITRATE RESULTS - SOUTHERN WILLAMETTE VALLEY COMMUNITY WELL WATER TESTING PROGRAM Sampling date:___________________________ Time: _______________ Weather: ____________________________________ Monitor name(s): _____________________________________________ Kit #:____________ Contact info:_________________________________________________ Reagent 1 Batch #:_____Reagent 2 Batch #:_________
Well ID # Site Description Point of Sample Collection
Sample Result Comments
SWV ppm
SWV ppm
SWV ppm
SWV ppm
SWV ppm
SWV ppm
SWV ppm
SWV ppm
SWV ppm
SWV ppm
SWV ppm
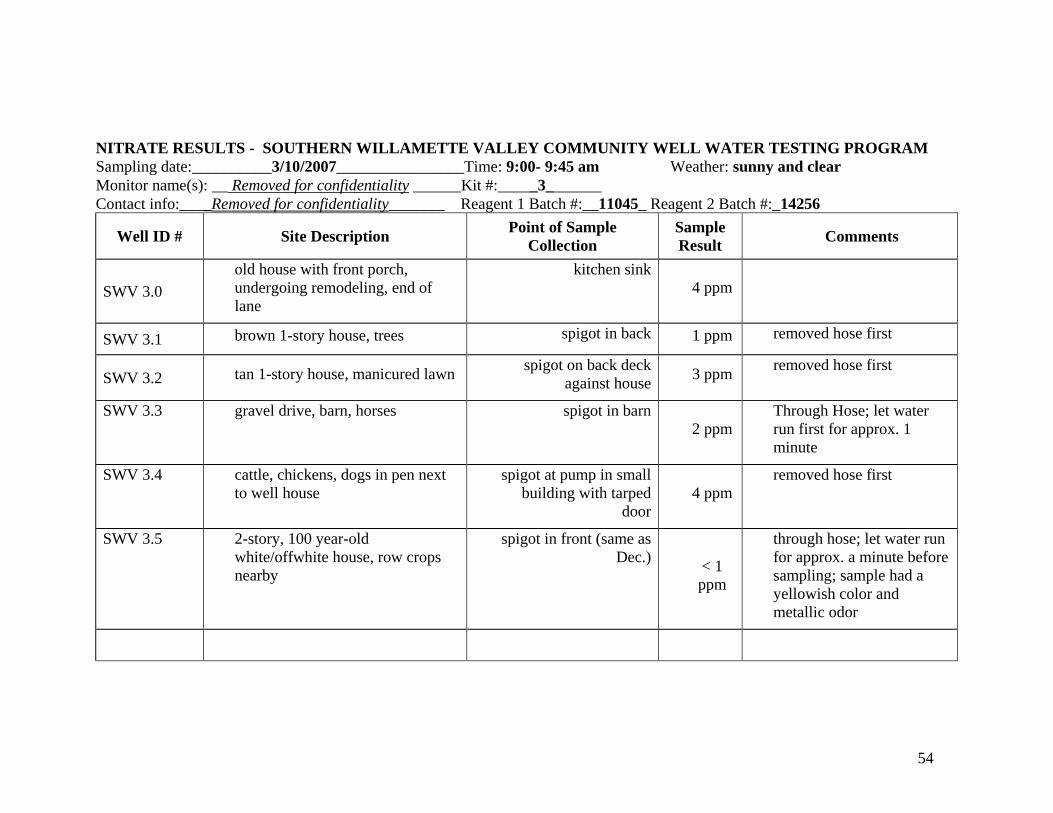
54
NITRATE RESULTS - SOUTHERN WILLAMETTE VALLEY COMMUNITY WELL WATER TESTING PROGRAM Sampling date:__________3/10/2007________________Time: 9:00- 9:45 am Weather: sunny and clear Monitor name(s): __ Removed for confidentiality ______Kit #:_____3_______ Contact info:____Removed for confidentiality_______ Reagent 1 Batch #:__11045_ Reagent 2 Batch #:_14256
Well ID # Site Description Point of Sample Collection
Sample Result Comments
SWV 3.0 old house with front porch,
undergoing remodeling, end of lane
kitchen sink 4 ppm
SWV 3.1 brown 1-story house, trees spigot in back 1 ppm removed hose first
SWV 3.2 tan 1-story house, manicured lawn spigot on back deck
against house 3 ppm
removed hose first
SWV 3.3 gravel drive, barn, horses spigot in barn 2 ppm
Through Hose; let water run first for approx. 1 minute
SWV 3.4 cattle, chickens, dogs in pen next to well house
spigot at pump in small building with tarped
door 4 ppm
removed hose first
SWV 3.5 2-story, 100 year-old white/offwhite house, row crops nearby
spigot in front (same as Dec.) < 1
ppm
through hose; let water run for approx. a minute before sampling; sample had a yellowish color and metallic odor

55
Removed for confidentiality
Removed for confidentiality

56
Southern Willamette Valley Community Well Water Testing Program- Nitrate Results by Well for 2006-2007 Sampling Year All nitrate values are expressed in parts per million (ppm). ND= no data.
Well ID # Location Oct-06 Nov-06 Dec-06 Jan-07 Feb-07 Mar-07 Apr-07 May-07 Jun-07 Jul-07 Aug-07 Sep-07 Average Nitrate
SWV1.0 Junction City SWV1.1 Junction City SWV1.2 Junction City SWV1.3 Junction City SWV1.4 Junction City SWV1.5 Junction City SWV1.6 Junction City SWV1.7 Junction City SWV1.8 Junction City SWV1.9 Junction City
MONITOR DROPOUT- monitor received all training and supplies but decided not to participate for undisclosed reasons
SWV2.0 Eugene 0 0 0 0 1 1 1 0 0 0 0 0 0.3 SWV2.1 Eugene 0 0 0 0 0 1 1 0 0 0 0 0 0.2 SWV2.2 Eugene 0 0 0 0 0 1 1 1 0 0 0 0 0.3 SWV2.3 Eugene 0 0 0 0 0 1 1 0 0 0 0 0 0.2 SWV2.4 Junction City 0 0 0 0 1 1 1 0 0 0 0 0 0.3 SWV3.0 Junction City 3 3 3 3 6 4 3 3 3 3 2 3 3.3 SWV3.1 Junction City 2 2 3 1 1 1 2 1 2 1 1 2 1.6 SWV3.2 Junction City 7 7 7 7 3 3 3 5 6 6 5 7 5.5 SWV3.3 Junction City 3 3 3 3 3 2 2 2 3 3 3 3 2.8 SWV3.4 Junction City 6 7 3 6 3 4 3 5 5 6 5 4 4.8 SWV3.5 Junction City 0 0 1 1 0 0 0 2 1 1 0 0 0.5 SWV4.0 Brownsville 1 2 3 1 0 4 5 0 4 2 ND- Monitor sick 2.2 SWV4.1 Halsey 1 4 1 3 2 3 2 0 0 1 ND- Monitor sick 1.7 SWV4.2 Brownsville 3 3 2 ND ND 0 3 0 2 2 ND- Monitor sick 1.9 SWV5.0 Junction City 2 2 2 2 3 0 3 2 3 3 2 2 2.2 SWV5.1 Junction City 2 1 2 2 2 2 1 2 2 2 2 2 1.8 SWV5.2 Harrisburg ND ND 1 3 4 0 0 0 1 1 2 3 1.5 SWV5.3 Harrisburg ND ND 9 7 4 2 8 8 7 9 8 9 7.1 SWV5.4 Harrisburg 4 7 6 4 3 2 4 0 4 0 5 6 3.8

57
SWV6.0 Eugene 1 1 0 1 0 0 1 0 0 1 1 0 0.5 SWV6.1 Eugene 1 2 2 ND 1 2 2 1 1 4 0 4 1.8 SWV6.2 Eugene 2 3 1 2 0 2 1 2 2 0 2 1 1.5 SWV6.3 Eugene 4 6 3 8 1 8 3 2 2 4 4 6 4.3 SWV6.4 Eugene 1 0 0 0 0 0 0 0 0 0 0 0 0.1 SWV6.5 Eugene 4 2 2 2 1 3 3 2 2 4 4 4 2.8 SWV7.0 Junction City 8 8 6 5 5 5 6 5 5 5 6 7 5.9 SWV7.1 Junction City 0 5 5 9 9 9 9 8 6 5 7 7 6.6 SWV7.2 Harrisburg 4 3 3 3 4 7 5 5 4 4 4 1 3.9 SWV7.3 Junction City 4 5 4 ND 5 8 7 4 1 0 0 0 3.5 SWV7.4 Junction City 2 7 2 1 1 1 4 0 4 2 1 3 2.3 SWV7.5 Harrisburg 7 6 7 ND 6 6 6 7 4 5 6 3 5.7 SWV7.6 Junction City 0 0 0 ND 0 0 0 0 0 0 0 0 0.0 SWV7.7 Junction City 8 6 6 5 6 6 9 7 8 8 6 4 6.6 SWV8.0 Eugene SWV8.1 Eugene
MONITOR DROPOUT- monitor received all training and supplies but decided not to participate for undisclosed reasons
SWV9.0 Coburg 7 6 7 7 7 7 7 6 7 8 6 6 6.8 SWV9.1 Coburg 14 12 13 13 10 13 12 8 10 10 9 9 11.1 SWV9.2 Coburg 7 7 7 7 7 8 8 6 7 6 6 4 6.7 SWV9.3 Coburg 14 DROPOUT- not interested in participating after first test 14.0 SWV9.4 Coburg 14 14 13 13 11 13 13 12 8 7 9 7 11.2 SWV9.5 Coburg 13 13 8 13 9 8 10 10 8 9 8 7 9.7 SWV9.6 Coburg 7 10 10 12 11 10 8 DROPOUT- participant decided not to continue 9.7 SWV9.7 Coburg 14 12 9 13 13 13 14 13 9 13 4 6 11.1 SWV10.0 Junction City 6 0 6 4 6 2 6 6 4 4 4 4 4.3 SWV10.1 Junction City 2 0 2 2 4 0 2 4 2 2 2 1 1.9 SWV10.2 Junction City 6 8 8 4 6 4 6 8 4 1 4 6 5.4 SWV10.3 Junction City 6 6 6 2 4 2 4 6 4 0 1 6 3.9 SWV10.4 Eugene 10 10 10 2 4 4 6 8 4 8 6 1 6.1 SWV10.5 Junction City 8 6 8 4 4 4 2 6 4 0 6 8 5.0 SWV10.6 Junction City 8 8 10 WELL OFF FOR WINTER 4 2 6 6 6 6.3 SWV11.0 Coburg 3 5 6 ND 6 5 5 4 4 3 3 ND 4.4 SWV11.1 Coburg 3 7 8 ND 6 5 5 4 4 3 3 ND 4.8 SWV11.2 Coburg 1 0 0 ND ND 0 0 0 1 2 2 ND 0.7
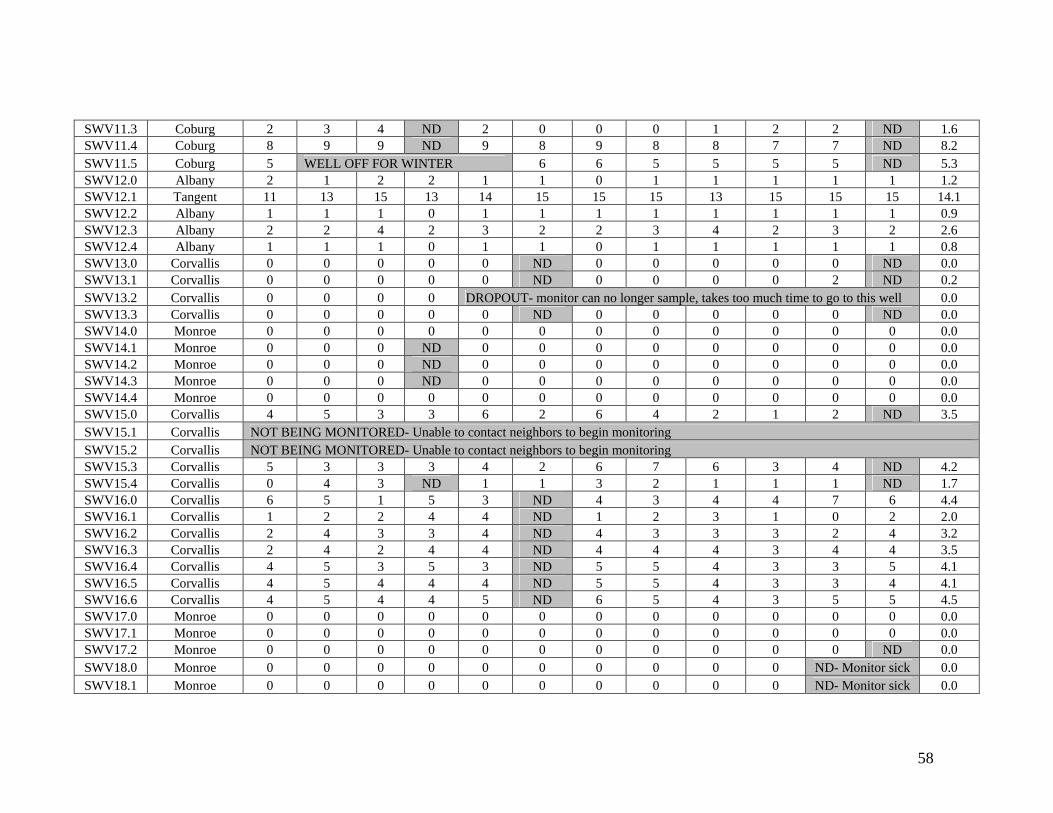
58
SWV11.3 Coburg 2 3 4 ND 2 0 0 0 1 2 2 ND 1.6 SWV11.4 Coburg 8 9 9 ND 9 8 9 8 8 7 7 ND 8.2 SWV11.5 Coburg 5 WELL OFF FOR WINTER 6 6 5 5 5 5 ND 5.3 SWV12.0 Albany 2 1 2 2 1 1 0 1 1 1 1 1 1.2 SWV12.1 Tangent 11 13 15 13 14 15 15 15 13 15 15 15 14.1 SWV12.2 Albany 1 1 1 0 1 1 1 1 1 1 1 1 0.9 SWV12.3 Albany 2 2 4 2 3 2 2 3 4 2 3 2 2.6 SWV12.4 Albany 1 1 1 0 1 1 0 1 1 1 1 1 0.8 SWV13.0 Corvallis 0 0 0 0 0 ND 0 0 0 0 0 ND 0.0 SWV13.1 Corvallis 0 0 0 0 0 ND 0 0 0 0 2 ND 0.2 SWV13.2 Corvallis 0 0 0 0 DROPOUT- monitor can no longer sample, takes too much time to go to this well 0.0 SWV13.3 Corvallis 0 0 0 0 0 ND 0 0 0 0 0 ND 0.0 SWV14.0 Monroe 0 0 0 0 0 0 0 0 0 0 0 0 0.0 SWV14.1 Monroe 0 0 0 ND 0 0 0 0 0 0 0 0 0.0 SWV14.2 Monroe 0 0 0 ND 0 0 0 0 0 0 0 0 0.0 SWV14.3 Monroe 0 0 0 ND 0 0 0 0 0 0 0 0 0.0 SWV14.4 Monroe 0 0 0 0 0 0 0 0 0 0 0 0 0.0 SWV15.0 Corvallis 4 5 3 3 6 2 6 4 2 1 2 ND 3.5 SWV15.1 Corvallis NOT BEING MONITORED- Unable to contact neighbors to begin monitoring SWV15.2 Corvallis NOT BEING MONITORED- Unable to contact neighbors to begin monitoring SWV15.3 Corvallis 5 3 3 3 4 2 6 7 6 3 4 ND 4.2 SWV15.4 Corvallis 0 4 3 ND 1 1 3 2 1 1 1 ND 1.7 SWV16.0 Corvallis 6 5 1 5 3 ND 4 3 4 4 7 6 4.4 SWV16.1 Corvallis 1 2 2 4 4 ND 1 2 3 1 0 2 2.0 SWV16.2 Corvallis 2 4 3 3 4 ND 4 3 3 3 2 4 3.2 SWV16.3 Corvallis 2 4 2 4 4 ND 4 4 4 3 4 4 3.5 SWV16.4 Corvallis 4 5 3 5 3 ND 5 5 4 3 3 5 4.1 SWV16.5 Corvallis 4 5 4 4 4 ND 5 5 4 3 3 4 4.1 SWV16.6 Corvallis 4 5 4 4 5 ND 6 5 4 3 5 5 4.5 SWV17.0 Monroe 0 0 0 0 0 0 0 0 0 0 0 0 0.0 SWV17.1 Monroe 0 0 0 0 0 0 0 0 0 0 0 0 0.0 SWV17.2 Monroe 0 0 0 0 0 0 0 0 0 0 0 ND 0.0 SWV18.0 Monroe 0 0 0 0 0 0 0 0 0 0 ND- Monitor sick 0.0 SWV18.1 Monroe 0 0 0 0 0 0 0 0 0 0 ND- Monitor sick 0.0

59
SWV18.2 Monroe 2 2 0 0 1 1 1 1 0 1 ND- Monitor sick 0.9 SWV18.3 Monroe 0 0 0 0 0 0 0 0 0 0 ND- Monitor sick 0.0 SWV18.4 Monroe 0 0 0 0 0 0 0 0 0 0 ND- Monitor sick 0.0 SWV18.5 Monroe 0 0 0 0 0 0 0 0 0 0 ND- Monitor sick 0.0 SWV18.6 Monroe 0 0 0 0 0 0 0 0 0 0 ND- Monitor sick 0.0 SWV18.7 Veneta ND 0 ND 0 0 0 0 0 0 0 ND- Monitor sick 0.0 SWV18.8 Monroe 0 0 2 0 0 0 0 0 0 0 ND- Monitor sick 0.2 SWV19.1 Harrisburg 5 3 4 3 2 3 3 2 2 0 3 3 2.8 SWV19.2 Harrisburg 0 0 DROPOUT- participant decided not to continue after receiving unexpected bacteria result 0.0 SWV19.3 Harrisburg 0 0 0 ND 0 0 0 0 0 0 0 0 0.0 SWV20.0 Junction City 1 1 1 1 1 2 2 2 2 2 1 1 1.4 SWV20.1 Junction City 7 4 6 4 5 5 7 5 5 5 3 5 5.1 SWV20.2 Junction City 1 1 1 1 1 1 1 2 2 1 1 1 1.2 SWV20.3 Junction City 4 3 4 3 3 3 3 3 2 3 3 1 2.9 SWV20.4 Junction City 4 4 4 5 2 3 5 2 5 5 3 3 3.8 SWV20.5 Junction City 1 1 1 1 1 1 1 2 2 2 1 2 1.3 SWV20.6 Junction City 1 1 1 1 1 1 2 2 2 2 1 1 1.3 SWV20.7 Junction City 1 1 1 1 1 2 2 2 2 2 1 1 1.4 SWV20.8 Junction City 1 1 1 1 1 1 2 2 2 2 1 1 1.3 SWV21.0 Eugene PUMP BROKEN- Old well, sample not taken, pump on the fritz SWV21.1 Eugene 3 2 2 5 2 3 3 2 1 1 2 2 2.3 SWV21.2 Eugene 7 7 8 12 16 7 9 8 6 6 5 4 7.9 SWV21.3 Coburg 10 12 12 16 10 ND 9 11 10 11 11 11 11.2 SWV21.4 Coburg 2 3 2 1 3 4 3 4 3 4 3 3 2.9 SWV21.5 Eugene 1 2 0 0 0 0 0 0 0 0 0 0 0.3 SWV21.6 Eugene 8 7 7 5 6 6 6 6 6 6 6 2 5.9 SWV22.0 Lebanon 0 0 1 0 2 0 2 1 1 0 3 1 0.9 SWV22.1 Lebanon 0 1 0 0 0 0 2 1 1 0 1 3 0.8 SWV22.2 Albany 2 1 1 2 2 0 3 2 2 0 3 3 1.8

60
Volunteer Monitoring In October 2006, the OSU Extension Service Well Water Program began a groundwater monitoring project to learn more about well water nitrate levels in the Southern Willamette Valley. Volunteer monitors have been working in neighborhood networks to test their own and their neighbors’ wells for nitrate on a monthly basis.
Through this one year pilot project we hope to better identify areas at risk and determine how nitrate levels vary throughout the year.
Volunteer monitors participate in a training session in the use of the nitrate test kit and sampling protocol.
The Mission of the Community Well Water Testing Programs is to:
� Assess the extent and severity of the nitrate problem
� Improve public participation in groundwater management
� Assist residents in protecting their drinking water supply
This report presents an overview of the Community Well Water Testing Program and nitrate screening results to date.
Nitrate in the Willamette Valley High nitrate concentrations have been found in groundwater in some parts of the Southern Willamette Valley as a result of non-point source pollution from fertilizers, animal waste and septic systems. The Department of Environmental Quality (DEQ) declared a Groundwater Management Area in this region in 2004 after confirming widespread nitrate contamination at levels above 7 ppm. Groundwater that has become contaminated by nitrate may pose a threat to public health and can indicate the presence of other contaminants.
Community Well Water Testing The Community Well Water Testing Program is designed to actively involve rural residents in monitoring and managing their drinking water supply. Volunteers participate by either becoming well water monitors or offering their well as a testing site.
Twenty volunteer monitors are responsible for testing 2-10 wells, including their own, for a total of 111 wells. Well water samples are collected from an outdoor spigot or convenient indoor location the second weekend of each month. Monitors analyze the samples using a LaMotte nitrate-nitrogen test kit and report results both to the well owner and program coordinator.
All monitors have attended a training session and follow quality assurance protocols outlined in a DEQ approved sampling analysis plan. Nitrate screening results are being used to inform participants of their water quality and build community awareness. The dataset is available for use by other interested parties as well.
Nitrate Sampling Results During the first three months of sampling, volunteer monitors tested 321 well water samples. The mean nitrate concentration over this period was 3.3 ppm. Nitrate values ranged from 0 to >15 ppm with a median of 2.3 ppm. Results show considerable regional variability.
INTERPRETING NITRATE TESTING RESULTS: 0-2 ppm No or very little impact from human activities. 2-4 ppm A small impact is seen from human activities. 4-7 ppm Obvious impact from human activities. Monitor nitrate levels. 7-10 ppm Close to public health limit. Determine if water is safe to drink. >10 ppm Above public health limit. Not considered safe for some people.
Distribution of Mean Nitrate Values Sampling Period: October 2006 - December 2006
7
10
16
23
55
0
10
20
30
40
50
60
0.0-2.0 2.1-4.0 4.1-7.0 7.1-10.0 >10.1
Mean Nitrate Value (ppm)
More information available at: http://wellwater.oregonstate.edu/
Community Well Water Testing Program Contact us: Quarterly Water Quality Report Laura Moscowitz, Program Coordinator
January 2007 E-mail: [email protected]