the commitment to development index: 2020 edition
TRANSCRIPT

The Commitment to Development Index: 2020 Edition
Methodological Overview Paper
June 2020
Authors: Lee Robinson, Beata Cichocka, Euan Ritchie, Ian Mitchell
Affiliation
Center for Global Development (Europe)
Contact [email protected]

i
Table of Contents
TABLE OF CONTENTS ............................................................................................................................. I
INTRODUCTION ........................................................................................................................................ 1
THE COMMITMENT TO DEVELOPMENT INDEX................................................................... 1
The CDI Approach ....................................................................................................................................................... 1
The Conceptual Evolution of the CDI ......................................................................................................................... 2
CDI REVIEW: WHAT’S NEW IN 2020? ................................................................................................ 3
Broader Country Coverage ........................................................................................................................................... 3
A New Structure ............................................................................................................................................................ 5
Income weighting: Giving Credit for Policies That Benefit the Poorest .................................................................... 7
Simpler .......................................................................................................................................................................... 8
New Measures .............................................................................................................................................................. 9
Income-Adjusted Scores ............................................................................................................................................... 9
New Website ............................................................................................................................................................... 10
APPROACHES TO MISSING DATA ................................................................................................... 10
Data Sources and Cut-Off Year .................................................................................................................................. 11
Three Standard Approaches to Data Gaps................................................................................................................. 11
Note on Landlocked Countries .................................................................................................................................. 12
Which Countries Fare Worst on Transparency? ........................................................................................................ 12
ISSUES ACROSS COMPONENTS ....................................................................................................... 13
Terminology ................................................................................................................................................................ 13
Weighting and Scaling ................................................................................................................................................ 14
Time Series and Back-Calculation ............................................................................................................................. 14
DEVELOPMENT FINANCE COMPONENT ................................................................................. 15
Why Is Development Finance Important for Development? .................................................................................... 15
Structure ...................................................................................................................................................................... 15
Development Finance ................................................................................................................................................. 16 Development Finance Quantity ....................................................................................................................................... 16 Development Finance Quality ......................................................................................................................................... 18
Further Reading .......................................................................................................................................................... 23

ii
INVESTMENT COMPONENT ............................................................................................................ 24
Why Are Investment and Financial Transparency Important for Development? .................................................... 24
Structure ...................................................................................................................................................................... 24
Investment Standards ................................................................................................................................................. 24 Anti-corruption ................................................................................................................................................................ 25 Business and Human Rights ............................................................................................................................................ 25 Natural Resource Governance ......................................................................................................................................... 25
Financial Secrecy ........................................................................................................................................................ 26 Limiting Banking Secrecy ................................................................................................................................................. 26 Extractive Country-by-Country Reporting ....................................................................................................................... 27 Public Statistics ................................................................................................................................................................ 27 Anti–Money Laundering .................................................................................................................................................. 27 Automatic Exchange of Information ............................................................................................................................... 27 Bilateral Treaties ............................................................................................................................................................... 28 International Legal Cooperation ...................................................................................................................................... 28 Beneficial Ownership ....................................................................................................................................................... 28
Investment Agreements .............................................................................................................................................. 29 International Investment Agreements .............................................................................................................................. 29
Further Reading .......................................................................................................................................................... 30
MIGRATION COMPONENT ................................................................................................................ 31
Why Is Migration Important for Development? ........................................................................................................ 31
Structure ...................................................................................................................................................................... 31
Migrants ...................................................................................................................................................................... 32 Immigrant Inflow ............................................................................................................................................................. 32 Female Immigrants .......................................................................................................................................................... 32
Refugees ...................................................................................................................................................................... 33 Refugee Hosting .............................................................................................................................................................. 33
Integration and Protection ......................................................................................................................................... 33 Integration Policies .......................................................................................................................................................... 33 International Migration Conventions ............................................................................................................................... 33
Further Reading .......................................................................................................................................................... 34
TRADE COMPONENT ........................................................................................................................... 35
Why Is Trade Important for Development, and for All of Us? .................................................................................. 35
Structure ...................................................................................................................................................................... 35
Tariffs .......................................................................................................................................................................... 35 Tariff Averages................................................................................................................................................................. 36 Poverty-Weight Average Tariffs ....................................................................................................................................... 36 Average of All Trading Partners ....................................................................................................................................... 36 Tariff Peaks ...................................................................................................................................................................... 36
Agriculture .................................................................................................................................................................. 37 Agricultural Subsidies ....................................................................................................................................................... 37

iii
Services ........................................................................................................................................................................ 38 Services Trade Restrictiveness .......................................................................................................................................... 38
Logistics ...................................................................................................................................................................... 38 Trade Logistics ................................................................................................................................................................. 38
Further Reading .......................................................................................................................................................... 38
ENVIRONMENT COMPONENT ....................................................................................................... 40
Why Is Protection of the Environment Important for Development, and for All of Us? .......................................... 40
Structure ...................................................................................................................................................................... 40
Climate Action ............................................................................................................................................................ 41 Greenhouse Gas Emissions ............................................................................................................................................. 41 Fossil Fuel Production ..................................................................................................................................................... 41 Fossil Fuel Support .......................................................................................................................................................... 42 Carbon Pricing ................................................................................................................................................................. 42
Sustainable Fisheries .................................................................................................................................................. 43 Fishing Subsidies .............................................................................................................................................................. 43
International Conventions .......................................................................................................................................... 43 International Environmental Conventions ....................................................................................................................... 43
Further Reading .......................................................................................................................................................... 43
SECURITY COMPONENT .................................................................................................................... 45
Why Is Security Important for Development? ........................................................................................................... 45
Structure ...................................................................................................................................................................... 45
Peacekeeping .............................................................................................................................................................. 45 Peacekeeping Contributions ............................................................................................................................................. 46 Female Peacekeepers ........................................................................................................................................................ 47 Sea Lanes Protection ........................................................................................................................................................ 47
Arms Trade ................................................................................................................................................................. 47 Arms Trade Value ............................................................................................................................................................ 47 Conflict Potential of Arms Exports ................................................................................................................................. 48
Participation in Security Conventions ........................................................................................................................ 50 International Security Conventions .................................................................................................................................. 50
Health Security ........................................................................................................................................................... 50 Antimicrobial Resistance .................................................................................................................................................. 51 Global Health Security ..................................................................................................................................................... 52
Further Reading .......................................................................................................................................................... 52
TECHNOLOGY COMPONENT .......................................................................................................... 53
Why Is Technology Creation and Access Important for Development? ................................................................... 53
Structure ...................................................................................................................................................................... 53
Government Support for R&D ................................................................................................................................... 53 Government R&D ........................................................................................................................................................... 54

iv
Tax Incentives for Business R&D .................................................................................................................................... 54
Technology Transfers and Diffusion ......................................................................................................................... 54 Foreign Students .............................................................................................................................................................. 54 Female Students ............................................................................................................................................................... 55 Research Collaboration .................................................................................................................................................... 55 Intellectual Property Rights .............................................................................................................................................. 56
Limitations and Issues ............................................................................................................................................... 56
Further Reading .......................................................................................................................................................... 56

1
Introduction This document describes the methodology used to calculate the Commitment to Development Index (CDI). The Index comprises seven components – Development Finance, Investment, Migration, Trade, Environment, Security and Technology. Each component is underpinned by a series of indicators of policy effectiveness in these areas, which are standardised and weighted according to their importance in development. The CDI aims to provide comparable information to policymakers on how their countries’ policies can accelerate development. It provides a comparable quantitative measure of effort in policies that support or inhibit development, especially in areas beyond ‘aid’. This methodology of the CDI should enable users to understand how the Index is calculated, and can be used alongside the workbooks which make the calculations publicly available. After a fuller description of the Index, including an explanation of some of the overarching principles it uses, this document describes why each component is important to development, then sets out how that component is calculated. The Commitment to Development Index The Center for Global Development (CGD) launched the 16th edition of the Commitment to Development Index (CDI) in September 2018. Begun in 2003, the CDI is CGD’s ‘flagship’ product. The Index was created by Nancy Birdsall and David Roodman and is based on evidence on what matters to development. It uses quantitative measures to assess and compare the policy efforts of high-income countries to promote the development of poorer countries. Its aim is to start a discussion about how policies in these areas affect and can do more for development, especially for the poorest countries, and it has been successful in getting governments to think more broadly about development.
For example, the Index has recently featured in development strategies in the UK and the Netherlands; has formed the basis of a number of discussions at ministerial level and also attracts widespread media coverage, in 2018 featuring in more than 180 media outlets in 18 countries; and was seen by more than 1.85 million readers online. The CDI Approach The CDI has a structure with four levels of increasing detail. At the top level, countries get an overall CDI score, which is composed of the country’s scores across seven policy areas, which we term components. Components are the level at which most discussion and scoring becomes policy relevant, as these represent the policy areas we identify as mattering most to development. Each component, in turn, has its score determined by scores in a number of subcomponents, and these are underpinned by indicators. The seven components are as follows:
• Development Finance (including ‘aid’ and concessional lending) • Investment • Migration • Trade • Environment • Security • Technology
Where appropriate, scores on a component are adjusted by different measures, such as population or economy size (using GDP/GNI) in order to discern policy effort relative to each country’s capabilities. In other words,

2
the CDI rates countries in ways that allow normative comparisons, which usually means adjusting for size. Denmark cannot be expected to give as much foreign aid as Japan, whose economy is 25 times larger. Similarly, Switzerland cannot be expected to import as much from developing countries as the United States, but it could have trade barriers as low, which is one of the things the trade component measures. The CDI focuses on measuring policy effort to enable policymakers to act, though in some places it captures policy outcomes, such as the amount of greenhouse gases emitted. The CDI aims to assess the most current policies but, in practice, because of lags in official data, most information used is lagged by one or two years. While we collect only publicly available data and are unable to provide data ourselves, we are committed to collecting the most recent data. The Conceptual Evolution of the CDI This paper describes the latest CDI methodology. It builds on background research done originally for each of the seven policy areas:
• Trade: Roodman 20071; Cline 20042; Moran 20073
• Migration: Grieco and Hamilton 20044; Lowell 20065
• Security: O’Hanlon and de Albuquerque 20036
• Technology: Maskus 20057
• Environment: Cassara and Prager 20058
• Finance (now renamed Investment): Janský 20139
This methodology has been refined over the years with recurrent updates including with a series in 2012 on Europe’s commitment to development. The latest edition reflects a substantial review, which included numerous discussions with policymakers, and three independent academic reviews.
1 ‘Production-Weighted Estimates of Aggregate Protection in Rich Countries toward Developing Countries’, 1 Jun. 2007, https://econpapers.repec.org/paper/cgdwpaper/66.htm. Accessed 4 Sep. 2017. 2 Trade Policy and Global Poverty, 1 Jun. 2004, https://www.cgdev.org/publication/9780881323573-trade-policy-and-global-poverty. Accessed 4 Sep. 2017. 3 ‘Rationale for Components of a Scoring System of Developed-Country Support for International Investment Flows to Developing Countries: Summary of Changes in the Index of Developed-Country Support for International Investment Flows to Developing Countries’, https://www.researchgate.net/publication/267717528_Rationale_for_Components_of_a_Scoring_System_of_Developed_Country_Support_for_International_Investment_Flows_to_Developing_Countries_Summary_of_Changes_in_the_Index_of_Developed_Country_Support_for_In. Accessed 4 Sep. 2017. 4 ‘Migration Component – Center for Global Development’, 20 Feb. 2004, https://www.researchgate.net/publication/242085980_Realizing_the_Potential_of_Migrant_Earn_Learn_and_Return_Strategies_Does_Policy_Matter. Accessed 17 June 2020. 5 ‘An Evaluation of an Extended Index on Pro-development Migration Policies’, https://www.cgdev.org/doc/cdi/2006/lowellMigration.pdf. Accessed 4 Sep. 2017. 6 O’Hanlon, Michael and Adriana Lins de Albuquerque (2004), “Note on the Security Component of the 2004 CDI,” Center for Global Development, Apr 7 ‘Components of a Proposed Technology Transfer Index: Background Note’ 8 ‘An Index of Rich-Country Environmental Performance’. http://citeseerx.ist.psu.edu/viewdoc/download?doi=10.1.1.501.4871&rep=rep1&type=pdf Accessed 17 June 2017. 9 ‘Illicit Financial Flows and the 2013 Commitment to Development Index’, 16 Dec. 2013, https://www.cgdev.org/publication/illicit-financial-flows-and-2013-commitment-development-index Accessed 4 Sep. 2017.

3
CDI Review: What’s New in 2020? The CDI has continuously evolved with small methodological changes and the inclusion of additional countries. But starting after the previous publication in 2018, there has been a holistic review process to look fundamentally at how the CDI could be updated to reflect current development thinking. This has been an extensive process of consultation, research, and modelling. The first stage of this process was to commission the expertise of three expert reviewers: Pierre Jacquet, president of the Global Development Network; Stephany Griffith-Jones, financial markets director at the Initiative for Policy Dialogue at Columbia University; and Ravi Kanbur, T.H. Lee Professor of World Affairs, international professor of applied economics, and professor of economics at Cornell University. We asked these experts to review the Index and provide recommendations on how they thought it could be improved. Specifically, CGD asked the experts these questions:
• Are we measuring the policies that matter most to development, and how can we improve the CDI in terms of measured actors and policies?
• If you were to create your own index of high-income countries’ policy efforts and their spillover effects on other countries, what would this index look like?
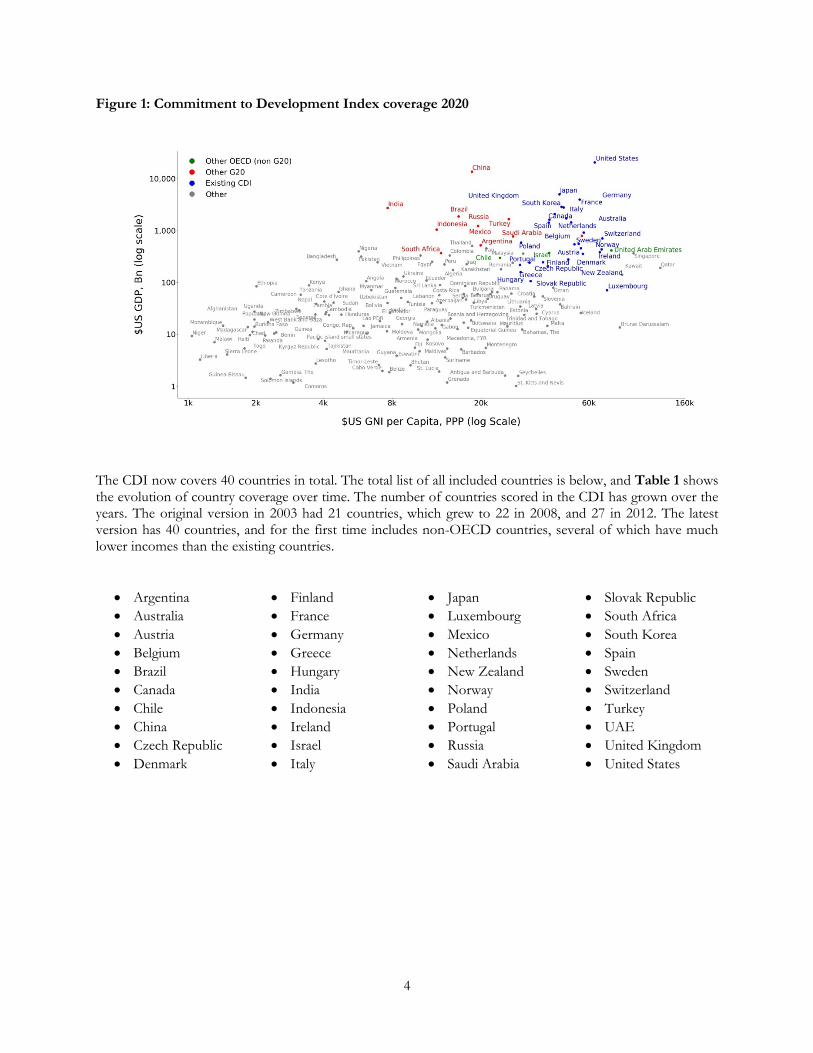
The reviews are linked to here (from Griffith-Jones, Jacquet, and Kanbur), along with our own summary of their recommendations and a blog outlining how we responded. We also consulted extensively with policymakers (including the OECD Development Assistance Committee and officials in the countries newly included), CGD colleagues and experts, and we engaged in in-depth research on how to capture the latest thinking, how to modify existing elements to accommodate new countries (see section on new countries below) and where we can find data to achieve these goals. The main changes of the review are outlined below. Broader Country Coverage The strongest message of the review was that the CDI should capture new development actors – especially China and other G20 members – to reflect both their economic importance and their increased activity in actively promoting development. We therefore added the remaining 10 G20 members to the 27 OECD countries that we already include. We also added the United Arab Emirates (UAE), reflecting its large economy size, high income, and significant reported aid. OECD members are easier for us to add, as their data is more readily available, so we’ve added two (Chile and Israel) whose economies were bigger than existing CDI members (in 2017 data, not shown). The countries which achieve the economic size and wealth combination to be included can be seen in Figure 1. The blue dots are existing CDI countries, red are new G20 additions, and green are other countries added.
4
Figure 1: Commitment to Development Index coverage 2020
The CDI now covers 40 countries in total. The total list of all included countries is below, and Table 1 shows the evolution of country coverage over time. The number of countries scored in the CDI has grown over the years. The original version in 2003 had 21 countries, which grew to 22 in 2008, and 27 in 2012. The latest version has 40 countries, and for the first time includes non-OECD countries, several of which have much lower incomes than the existing countries.
• Argentina • Australia • Austria • Belgium • Brazil • Canada • Chile • China • Czech Republic • Denmark
• Finland • France • Germany • Greece • Hungary • India • Indonesia • Ireland • Israel • Italy
• Japan • Luxembourg • Mexico • Netherlands • New Zealand • Norway • Poland • Portugal • Russia • Saudi Arabia
• Slovak Republic • South Africa • South Korea • Spain • Sweden • Switzerland • Turkey • UAE • United Kingdom • United States

5
Working with such a varied set of countries has generated data challenges that did not exist in previous versions, produced when all countries were well-documented OECD members. Thus, we have had to adopt systematic policies about missing data that we outline (see page 10). Also, because some of these countries themselves have substantially lower income per head than those previously included in the CDI, we had to contend with whether to include policies aimed at domestic poverty reduction. We decided against that approach, as the CDI’s approach has always been to measure the policies that cause positive international spillovers. This means that only where domestic policies are felt abroad, such as in the cases of tariff setting or instituting strong disease controls, are they included among the otherwise outwardly focused policy set we cover. Table 1: CDI coverage over time
Original CDI (2003) Additional (2008)
Additional (2012) Revised CDI (2020)
Australia Japan South Korea Czech Republic Argentina South Africa
Austria Netherlands Hungary Brazil Turkey Belgium New Zealand Luxembourg Chile UAE Canada Norway Poland China Denmark Portugal Slovakia India Finland Spain Indonesia France Sweden Israel Germany Switzerland Mexico Greece United Kingdom Russia Ireland United States Saudi Arabia Italy 21 Countries 1 (22 total) 5 (27 total) 13 (40 total)
A New Structure We have adopted the recommendation to structure the CDI to capture the broad themes of development. We retain the seven components (although with changes, as we will outline), but we have now grouped them into three overarching themes. First, there is Development Finance, which stands as its own category. This is no longer simply ‘aid’; rather, we have developed a new measure – Finance for International Development – which is more comparable across traditional and emerging providers (in particular, it includes all cross-border concessional loans). We will also assess the ‘quality’ of that finance, including measures of transparency, poverty focus, and support for the multilateral system. Then there are Policies on Exchange, covering capital (Investment component), goods and services (Trade component), and people (Migration component). Through investment and trading opportunities, countries can develop their economies, and through opportunities for migration, their citizens can obtain skills, contacts, and capital. Finally, the CDI reflects the growing interest in Global Public Goods (GPGs): resources that benefit all countries. CDI countries are rewarded for contributing to the provision and maintenance of the GPGs of Environment, Security and Technology.

6
Figure 2: Commitment to Development Index Organigram

7
Income weighting: Giving Credit for Policies That Benefit the Poorest As the CDI is concerned with development, several of its measures give greater credit for commitments which benefit countries with lower incomes per head and higher poverty levels. We include indicators of concessional development finance; migration; tariffs, international students and research collaboration which give greater credit where those actions relate to a lower-income-country partner. We have revised and made more consistent the approach to this weighting across indicators, and this section sets out the method we use for this ‘poverty weighting’. The basic concept here is grounded in the idea that a person’s welfare is more sensitive to income at lower levels. This has been a core concept in economics, for example, see Layard et al 200810. In practical terms, we are unable to monitor the income level of individual beneficiaries, but we are able to identify country-level beneficiaries. Whilst we are measuring at the country level rather than the individual level, if the benefits of any policy are spread across the population, then the concept can extend to country-level analysis. The economic literature suggests that the welfare benefits of an incremental increase in income are diminishing and can be represented by a logarithmic function. A typical assumption is that welfare or utility is a function of the logarithm of income. That is, utility = log (income). It follows that the marginal utility of an increment in income is inversely proportional to income (that is, $1,000 of income is worth less to you the more you already earn). This can be expressed in a function where income is defined as Y, and marginal utility = 1/Y. So, in this form, marginal utility is inversely proportional to income: an additional dollar received by someone with an income of $1,000 has 10 times the marginal utility of someone with an income of $10,000 receiving it, who in turn, derives from it 10 times the marginal utility of someone who earns $100,000. We use this approach to determine how to weight policies as they benefit partner countries with different income levels. To make the weighting more intuitive, we set the weight equal to 1 for a country with the same income as the average of low-income countries (LICs), higher than 1 if it was poorer than that, and lower than 1 if it was richer. Specifically, we calculate the weight for any given partner country by scaling the inverse of a its income to the inverse of average income for LICs. So for country X, this is
𝑊𝑊𝑊𝑊𝑊𝑊𝑊𝑊ℎ𝑡𝑡𝑋𝑋 = 1
𝐺𝐺𝐺𝐺𝐺𝐺𝑋𝑋/
1𝐺𝐺𝐺𝐺𝐺𝐺𝐿𝐿
= 𝐺𝐺𝐺𝐺𝐺𝐺𝐿𝐿𝐺𝐺𝐺𝐺𝐺𝐺𝑋𝑋
,
where
• GNIX = GNI per capita (PPP) of country X, and • GNIL = Average GNI per capita (PPP) of LICs.
As an example, the average income (GNI per capita) among LICs in 2017 was US$2,361,11 and that of Mozambique was $1,430. Therefore, the income weight of Mozambique would be (2,361/1,430) = 1.7. Kenya, with an income of $3,230, has a weight of (2,246/3,230) = 0.7. The chart of income weights, with some example countries, is in Figure 3.
10Layard, Nickel & Mayraz, The Marginal Utility of Income (2008) http://darp.lse.ac.uk/papersdb/Layard_etal_(JPubEcon08).pdf, accessed June 17, 2020 11 Figures are in US dollars.

8
Figure 3: Income weights, with example countries
Whilst GNI per head is a partial and incomplete measure of a country’s poverty or need, we are combining the weights over a large number of partner countries (for example, consider average tariff levels, which we weight by the income level of some 150 countries). In this way, whilst an individual weight may not be accurate, the weighted average measure we produce likely provides a good guide to how policies affect LICs in general. One particular example of this relates to ‘micro’ states where we do not have reliable income data, and we therefore exclude them from the weighting. But for the most part, they would have insignificant impact on aggregated measures, so the loss in terms of measurement is not material. Simpler With any index, or any form of abstraction, there is a trade-off of rich and nuanced versus simple and streamlined. A key message from the review papers and discussions is that the CDI had become overly complex and should be simplified, using fewer indicators and showing scores in a more intuitive way. As well as organising the CDI into three broad themes (see page 5), we have reduced the number of data points and simplified their weighting in producing overall scores. We have also simplified the presentation of these scores. Previously, we showed the ‘standardised Z scores’. This is useful: standardising is necessary to combine data on hugely different scales (e.g., from fractional percentages of GNI to tonnes of greenhouse gas). But it is not a great tool for presenting scores in a way that tells a story or is intuitive. For this, we have converted the standard scores of each component and subcomponent into percentiles, with the top performer on that measure scoring 100 and the worst, 0. This can be seen in the layout of the ranking tables in the CDI workbooks, in Security for example (Figure 4).
Burundi, 3.1
Benin, 1.0
Pakistan, 0.40
China, 0.13 United States, 0.04
0.00
0.50
1.00
1.50
2.00
2.50
3.00
3.50
0 10,000 20,000 30,000 40,000 50,000 60,000 70,000 80,000 90,000 100,000
Inco
me
Wei
ght
GNI per Capita, PPP

9
Figure 4: Security ranking table
New Measures Despite the overall reduction and simplification, we also include new measures – including several measures on gender and measures on global health security, research collaboration, and technology in trade – and a more comprehensive approach on climate. Income-Adjusted Scores As we have introduced new countries into the CDI with lower incomes, we wish to find a way to measure their performance on a more level playing field. The CDI is primarily concerned with measuring policy effort relative to a country’s population or economy. However, as we will be adding the remaining G20 countries, some of whom have incomes at the level of the United States in the 1930s (India, South Africa) and 1960s (China), we provide an additional set of results which are adjusted by a country’s average income per head. These are known as ‘income-adjusted’ scores.
Rank Country Score as % of best Raw Score1 United Kingdom 100% 0.862 Austria 96% 0.743 United States 96% 0.734 Netherlands 94% 0.695 Denmark 94% 0.686 Ireland 94% 0.687 France 93% 0.668 Sweden 93% 0.669 Australia 93% 0.66
10 Norway 88% 0.5211 Finland 88% 0.5212 Switzerland 84% 0.4013 Hungary 83% 0.3914 Germany 77% 0.2215 South Africa 76% 0.1916 Czechia 76% 0.1917 Portugal 75% 0.1618 Greece 75% 0.1619 Slovak Republic 75% 0.1520 Canada 74% 0.1221 Italy 74% 0.1222 New Zealand 73% 0.1023 Spain 70% 0.0224 Belgium 70% 0.0025 Japan 69% -0.0326 Luxembourg 67% -0.0927 Poland 65% -0.1328 South Korea 62% -0.2229 Brazil 57% -0.3530 Indonesia 57% -0.3731 Mexico 54% -0.4432 Argentina 54% -0.4533 Chile 53% -0.4834 Turkey 45% -0.6935 India 45% -0.6936 China 45% -0.7037 Russia 36% -0.9538 UAE 36% -0.9539 Saudi Arabia 30% -1.1140 Israel 0% -1.97

10
In order to calculate an income-adjusted score for a component, we first calculate an ‘expected’ CDI score based on the relationship between all countries’ scores on that component and their incomes. We then calculate a country’s income-adjusted score as the difference between the country’s actual and expected scores. To obtain the ‘expected CDI’ score we use a line of best fit between CDI score and GNI per head using ordinary least squares regression. The income-adjusted score is then the (positive or negative) deviation from that expected score. For example, in Figure 5 we provide a stylised example of development finance score against income, where the line is the expected score. Luxembourg’s score is 1.88 higher than its income would predict, so its income-adjusted score on this component is 1.88. Israel, however, has a difference of -1.10 between its actual and expected scores. That figure (-1.10) would be Israel’s income-adjusted score. Figure 5: Example development finance score against income
It is important to note that income adjusting and income weighting, discussed previously (page 7), are not to be confused. Income weighting, discussed here, is the process of adjusting a CDI country’s score based on its income. Income weighting, on the other hand, relates to partner countries’ levels of income and the extent to which a CDI country’s policies benefit poorer or richer recipients. New Website To improve users’ ability to access and understand the CDI’s results we have commissioned a new, interactive website. It displays the new meta-structure and enables the user to examine detailed country and component results, to define which groups of countries to include in a comparison (e.g., G7, OECD, BRICS, G20), and also to consider scores adjusted for CDI country income level.
Approaches to Missing Data The CDI measures are in relation to policy areas that matter to other countries and, as such, we hope that countries will make data on these areas available, ideally in some consistent form. Indeed, one of the objectives of the CDI is to highlight data gaps to policymakers and create incentives to improve reporting and transparency.

11
Across the CDI, there are some indicators which are not reported for all years in each of the 40 ranked countries. While missing data always poses a challenge for composite indices such as the CDI, in previous versions of the CDI only OECD countries were included and thus we were able to mainly consult datasets in which these countries were well represented. The revised CDI adds 13 new countries, many of which are not OECD members. We have substantially revised our data sources wherever possible in response to ensure a fair and consistent comparison, but data gaps have become more common, and we have taken a consistent approach to these gaps, as follows. Data Sources and Cut-Off Year We employed some generalised strategies for handling missing data:
• If the data for a given year is unavailable, we use the most recent available data up to a point, extending to no earlier than 2010. If a country only has data for prior to 2010, it is treated as though it has no data. Where data for any given year is scaled to a denominator (e.g., GNI), as far as possible, we attempt to use the same year for the denominator.
• For indicators where we rely on data provided by any international organisation to which a CDI country does not report by virtue of not being a member (e.g., the OECD), we made every reasonable attempt to use other data sources of a similar nature (e.g., UN data).
• In cases where there appeared to be no publicly available data, we directly contacted the government of each ranked country in order to give them a chance to rectify the gap.
Three Standard Approaches to Data Gaps Failing the above approaches to rectify the gap, the way missing data is handled depends on the type of data gap. There are three general approaches we employed, based on the type of data gap:
• When the country does not report any data to an international organisation it is a part of such as the OECD (or the last available data is older than 2010), or when that organisation collects data on all countries (such as is often true of the UN), a country is given the score of the worst-scoring country for that year. The rationale is that it is always better to report your data than to not report it.
• When we use a source in which a country is not responsible for reporting its data, and that data is missing, we give it the average. This effectively eliminates this country from the ranking in that measure.
• In cases where we observe a significant and strong relationship between income and scores on an indicator, and when the data gap is not deemed to be caused by deficient reporting by the ranked country, we interpolate the score based on GNI per capita.

12
Table 2: Number of data gaps per CDI country No Data Gaps 1–5 Data Gaps Over 5 Data Gaps Austria Australia 1 India 6 Belgium Finland 1 Argentina 9 Canada Japan 1 Saudi Arabia 10 Czech Republic Greece 2 UAE 10 Denmark Poland 2 France China 3 Germany Israel 3 Hungary Indonesia 4 Ireland Mexico 4 Italy Brazil 5 Luxembourg Chile 5 Netherlands Russia 5 New Zealand South Africa 5 Norway Portugal Slovak Republic South Korea Spain Sweden Switzerland Turkey United Kingdom United States
There is one exception to this approach, and that is arms exports value (see page 47). In our arms exports measure, one country’s exports (Israel) are a significant outlier and assigning non-publishing countries an equivalent score seemed excessively punitive and had the effect of compressing all the other scores closely together. For countries that have not published this data, therefore, we assign a score of the mean plus two standard deviations, to effectively put them at around the 97.5th percentile of export volume.
Note on Landlocked Countries Landlocked countries, by nature of their geography, cannot report data on issues relating to the seas in the two relevant subcomponents (sea lanes protection in the Security component and fishing subsidies in the Environment component). This means that they effectively cannot have a contribution – this is not scored as missing data. This gives them the best score on fishing subsidies, and the worst score on sea lanes protection. Meanwhile, non-landlocked countries which do not report their data are scored with the equivalent worst score for these two indicators. Which Countries Fare Worst on Transparency? In its current iteration, the CDI is composed of 53 indicators within 39 subcomponents, across 7 components. The score of most countries is based on a nearly full set of data. However, some countries fare noticeably worse on transparency than others. The effect of this missing data on CDI scores is substantial – if countries do not report data on several important areas of policies with international impacts, it materially undermines their commitment to development. Similarly, at least in terms of the CDI score, it provides strong incentives to report this data.

13
Issues across Components Terminology This section briefly outlines some key terms the CDI uses. The CDI draws on thousands of data points and hundreds of indicators, and as such consistent use of terminology can be helpful. In the hierarchy of measures the CDI, it is helpful to distinguish between the following terms: Components: There are seven components in the CDI – Development Finance, Investment, Migration, Trade, Environment, Security and Technology. Each component’s score is a composite of the scores in the subcomponents, which are themselves made up of indicators.
Categories: Although these are at a higher level than subcomponents, they are not a unit of measurement, and serve simply as a way to group similar subcomponents. For example, in the Security component, the subcomponents Peacekeeping Contributions, Female Peacekeepers and Sea Lanes Protection are grouped under the category Peacekeeping and Security.
Subcomponents: Each component is made up of subcomponents; for example, the Development Finance component is made up of subcomponents on Development Finance Quantity and Development Finance Quality. Indicators: These are measures used to calculate subcomponents. For example, the Greenhouse Gas Emissions subcomponent has three indicators: emissions per head, emissions from land use and forestry per head, and emissions embodied in imports per head. Scores: This refers to the score assigned to a country’s performance after it has been ‘standardised’. Scores are assigned for country performance: overall, at the component level, or at the subcomponent level. In addition, ‘scores’ are sometimes used to combine scores across multiple indicators, as in the Development Finance Quality measure above. A country’s component score is a weighted average of its scores on that component’s subcomponents. Scores in the CDI are ‘standardised’ – that is, adjusted to have a mean of 0 and a standard deviation of 1. In this way, ‘scores’ can be combined across measures or subcomponents which would otherwise have very different units and distributions. Taking an example, consider indicators in their original measurement terms (e.g., percentage of carbon emissions reduction over 10 years, dollar value of public research subsidies, refugees per capita). Given the very different scales, standardising is necessary to enable comparison across indicators and calculation of performance and ranking. Each country’s score is therefore standardised as a Z score, with a mean of 0 and standard deviation of 1 (so the vast majority of scores are between -2 and 2). For example, in the Peacekeeping Contributions subcomponent, a country’s three raw indicator scores are all calculated as monetary equivalents of a percentage of GNI, and are on the thousandth of a percent scale. They are summed to give total peacekeeping contributions, which is in the region of hundredths of a percent. This subcomponent score must be combined with, for example, the Female Peacekeepers subcomponent, whose raw score is measured on a scale of 1%–18%. These scores must therefore be standardised to a common scale. Also, the standardising process leads all subcomponents to have the same variance. This is also important because if variable a has a higher variance than variable b, then variable a will have a greater influence when the two are combined. Figure 6 outlines the different scoring levels and how they are displayed in the component workbooks.

14
Figure 6: Different levels of Scores in the CDI
Finally, note that some indicators’ scores are standardised negatively, which means a lower raw score translates into a higher standardised score. This is true of ‘bads’, such as arms exports or greenhouse gas emissions. Rankings: These are the relative positions of countries according to their overall score, or a score on one of the CDI’s seven components. A country’s rank is the position of its standardised score within those of the cohort (i.e., all CDI countries). There are 40 countries in this edition, so a country’s rank on the overall CDI, or the rank of one of its components, subcomponents, or indicators, ranges from 1 (best) to 40 (worst). Weighting and Scaling The CDI is a quantitative and indicator-based index. It combines readings on thousands of data points and more than a hundred indicators. Since the indicators are not perfectly correlated, countries’ standings on the final results are affected by the relative importance the formulas give to the various indicators. In mathematical terms, the results are affected by choices of both functional form and parameters. Both the CDI designers and commentators have naturally asked whether the CDI makes the best choices. Our intention is to weight indicators according to the evidence, and our judgment, on their contribution to development. We also try to keep the weights simple – in 5% increments – and try to avoid changing them incrementally. In practice, the CDI designers choose to weight some indicators more than others. The weights are backed by many years of expertise and experience in the relevant fields, but in the spirit of dialogue, are nevertheless open to challenge. At the top level of the CDI hierarchy, where the seven CDI components merge into a single index, the components are equally weighted.12 In other words, we do not weigh the environment or trade more highly than, say, migration based on their perceived relative importance. Because of the prominence of this choice, and its importance for the final results, this decision has provoked some discussion. For a detailed discussion, please refer to the 2013 methodology paper’s section on weighting and scaling (on page 5). Whilst these seven areas are very unlikely to have an equal weight on development, it’s clear they are all important and giving them an equal weight helps the Index and policymakers to be focussed on policies, rather than component weights. Time Series and Back-Calculation We use the CDI to compare rich countries’ latest policy performance relative to that of their peers using the most up-to-date data. The rankings and scores in previous versions of the CDI are not directly comparable to those of the latest version as the method of calculation evolves with improvements and data availability.
12 Note that, in line with best practice on indices, in compiling the overall component the seven individual components are first standardised to have equal mean (of 0) and variance (of 1), the practical effect is that this gives less weight to those components with high variance so that outliers in one area do not dominate the index results.

15
Within the calculation sheets, where possible, we do make the historical data available, but the absence of historical data, especially for the newly added countries, means that back-calculating scores is not possible. As we update this version of the CDI, we hope to make time-series data available on the underlying indicators.
Development Finance Component The development finance component is composed of two subcomponents which assess a) the quantity of development finance assistance of each donor country and b) the quality of that assistance. These two subcomponents are weighted equally. Why Is Development Finance Important for Development? Development finance is likely the first policy that comes to mind when considering how countries help to promote development beyond their borders. It remains an important source of assistance for many developing countries. The OECD report on fragile states concludes that aid has been the largest and most reliable source of finance for the least developed fragile states over the past decade. In 1969, the Pearson Commission proposed that rich countries should spend 0.7% of their gross national product (GNI) on foreign aid, for which the definition of official development assistance (ODA) was provided by the Development Assistance Committee (DAC) of the OECD in the same year. This 0.7% target was enshrined in a UN resolution on October 24, 1970. In 1993, following the revision to the UN System of National Accounts, GNI replaced GNP as the denominator for the target. More than 50 years after it was set, only a handful of countries are meeting this target. Quantity is not the only aspect that matters in the provision of development finance. How it is provided can have a significant impact on achieving development results. This has been acknowledged by donors in a series of High Level Fora on Aid Effectiveness, the last one taking place in Busan in 2011. These fora contributed to establishing key principles for improving the effectiveness of development cooperation. Today, ownership, focus on results, inclusive development partnerships, and transparency and mutual accountability are standard criteria which donors and recipients use to implement development assistance interventions. These criteria were agreed upon by 160 countries, including new and emerging cooperation providers.
Related CGD work: Aid effectiveness Structure The Development Finance component’s subcomponents and their weights in the overall component score are as follows: Development Finance Quantity (50%)
Development Finance Quality (50%)
• Bilateral – share of finance provided bilaterally scored by five indicators o Poverty focus of finance (40% of bilateral quality) o Fragility focus – share of finance to fragile states (10% of bilateral quality) o Transparency of development finance data (20% of bilateral quality) o Share of untied development finance (20% of bilateral quality) o Ownership (10% of bilateral quality)
• Multilateral – share of finance towards core multilateral contribution; quality set at 67th percentile of bilateral

16
Development Finance We measure the quantity using a measure of finance for international development (FID) expressed as a proportion of GNI. In order to assess quality, we use a weighted average of bilateral and multilateral quality. For bilateral, we use the limited available data on finance provided bilaterally with an even weight on the focus of aid on poorer and fragile countries alongside indicators of provider effectiveness. Development Finance Quantity To measure development finance quantity, we use a measure of FID expressed as a percentage share of GNI. This is a measure of officially provided, cross-border, concessional development finance on a grant-equivalent basis. Traditionally, development finance has been measured by ODA – a concept created by the DAC. However, not all countries recognise ODA as a concept, and it is not calculated for countries outside the DAC. With the introduction of new countries to the CDI, that are not part of the DAC, we have developed a new measure which is more consistent between the countries we assess in that it includes only cross-border support and includes all concessional lending rather than that exceeding a certain threshold, as in ODA. Full details of the new measure are contained in the FID working paper, and here we present a briefer overview of its structure, sources and coverage. Finance for International Development Structure and Approach FID is split into three ‘pillars’:
• Grants and other non-reimbursable assistance: This includes items such as technical cooperation and training (so long as not hosted in-country), as well as pure financial assistance.
• Grant equivalent of concessional loans: We calculate these using the discount rates provided by the DAC – 9% for least developed countries (LDCs) and LICs, 7% for lower middle-income countries (LMICs), and 6% for upper middle-income countries (UMICs) – but do not use the thresholds for concessionality. This is because as new countries have no incentive to meet them, it would bias the measure against them (DAC countries are unlikely to lend with grant elements of 44% to LDCs – just below the threshold – because they would not receive ODA credit. However, this is not a consideration for new countries). There are different formulas used to calculate the grant equivalent according to how the loan is repaid; variants can be found here.13 For non-DAC countries we assume equal principal repayments, as this is the most common repayment type (although generally the difference between repayment plans is small). The formula for equal principal payments is
13 In this document, some variables appear to mislabelled.

17
,
where
, where
• r = interest rate, • n = number of repayments per interval, • D = discount rate, • m = duration, and • g = grace period.
Where information on the grace period and number of repayments per year are not available, we assume that g = 0 and n = 1.
• Core multilateral: These estimates are usually in the form of the difference between stocks of paid-
in capital between years. For some organisations, we have needed to estimate the annual amount paid by dividing a multi-year pledge by the number of years to which it pertains.
Finance for International Development Sources and Coverage The process of obtaining FID estimates for non-DAC countries does not follow a single methodology, and has relied on assumptions and estimates particular to each country. These are too numerous and detailed to list here but are described in the FID working paper. To construct FID, for the DAC-reporting countries we used the OECD’s DAC creditor reporting system (CRS) but excluded the parts of ODA (listed below) not included in our measure. For countries that do not report to the DAC we consult official country documents, mainly from finance ministries or development agencies, to find the information they provide on development assistance provided. This process left several gaps that had to be filled by assumptions and estimates from other sources (including academic literature in the case of China). For multilateral estimates for newly added countries, we consulted the financial statements, annual reports and replenishment documents of the largest multilateral organisations. Where necessary, we supplement this with information on multilaterals that we know to be important for new countries even if not significant in size (for example, South Africa’s contribution to the ODA-eligible African Union represents about 4% of the country’s FID, even if the contribution of $15 million is tiny in relation to the entire multilateral system). The following items are counted in ODA, but not in FID (CRS aid type code in brackets):
• In-donor refugee costs (H02–H05) • Promotion of development awareness (H01) • Administrative costs not elsewhere included (G01) • Debt relief (F01) • Scholarships (E01) • R&D where we are sure it is spent in the donor country (channel code between 11000 and 12000,
denoting public-sector institution as donor, and purpose code 43082, denoting ‘Research / Scientific Institution’)

18
There are three points to note in considering the new measure’s coverage:
• Consistency: Many of the new countries do not report the information required to construct ODA. All newly added countries report some form of assistance provided to other (mainly poorer) countries, but these figures do not include things like refugee costs or ‘promotion of development awareness’ that are included in ODA. Overlooking this difference would bias the ranking in favour of DAC countries.
• Coverage: Most of the items that we remove from ODA are counted elsewhere in some form. For example, refugee costs have been removed from ODA for our measure, but the number of refugees hosted is included in the Migration component. Similarly, scholarships and R&D are also measured elsewhere in the CDI.
• Definition: The DAC definition of ODA was the result of a series of compromises between the DAC members, and the value of inclusion of some elements is contested. Focusing specifically on cross-border flows is more likely to capture assistance that is of direct assistance to developing countries in its entirety. This is also relevant for debt relief: the discount rates used to calculate the grant element of loans (above) take into account the risk of default, and so including debt relief as well is effectively double counting.
Development Finance Quality The Development Finance Quality subcomponent calculates a quality score (QS) that combines five indicators of bilateral development finance quality with a measure of multilateral quality, weighted by the percentage of total finance accounted for by each. The bilateral indicators are weighted as follows:
• Poverty and fragility focus: o Focus of allocation to poorer countries (40%) o Share of finance to fragile states (10%)
• Effective practice:
o Transparency of development finance data (20%) o Share of untied development finance (20%) o Ownership – measure of projects aligning with recipient objectives (10%)
The multilateral aid quality score is set at the 67th percentile of bilateral quality and weighted according to its share of the total. This reflects that multilateral aid is untied, is more transparent, has the potential to be coordinated across providers and is not designed to also achieve provider objectives. Poverty Focus This indicator measures the extent to which development cooperation is allocated towards the poorest countries. We weight cooperation flows according to the shares that go to lower-income countries. In particular, we weight each bilateral finance contribution using the inverse of the income level in the recipient country (so that countries with a high income have a very small weight). This mirrors the concept of diminishing marginal utility of income: the benefits, or ‘utility’, a recipient enjoys from a dollar of income reduces as the income rises. The approach to income weighting is outlined earlier in this methodology (page 7).

19
For each CDI country, we multiply the share of its total aid that it sends to a particular country by the ‘income weighting’ of that country. We sum these across all recipient countries to give its poverty focus score. For non-DAC cooperation providers, inconsistencies in reporting on development finance mean that it is not always possible to identify flows by recipient country. In such cases, we use estimates of flows by country grouping and calculate the score using the average income of those groups.14 Data on development cooperation flows is sourced from our FID dataset. For more on the FID methodology, please see the FID working paper. Income data is taken from the World Bank’s DataBank. Fragility Focus This indicator measures the percentage of bilateral aid that is given to fragile countries. To determine which countries are fragile we use the Harmonized List of Fragile Situations produced the World Bank. We use the list for 2017 as this is the same year for which FID is measured. The incidence of poverty in the world is increasingly concentrated in fragile states, and these countries are recognised as posing a particular challenge for development, not least the difficulty in raising their own domestic resources.15 However, it is also generally regarded to be more difficult to spend effectively in fragile states: costs are higher, the concept of ownership is not always meaningful, and it can be difficult to ensure that money reaches the poorest. To reflect these difficulties, we give this indicator a relatively low weight, at 10%. Transparency This indicator assesses the degree to which cooperation providers regularly publish development finance data. In alignment with the Busan Agreement, countries are assessed on the timeliness, openness and comprehensiveness of their reporting on development spending. Countries receive a score out of a maximum 8 points. The scoring is based on a qualitative assessment of reporting documents (including government reports and websites, as well as reporting through traditional platforms such as the International Aid Transparency Initiative [IATI] or the OECD’s CRS), conducted by CGD staff.16 This methodology allows us to assess the transparency of DAC and non-DAC donors on a consistent scale and to capture reporting by non-DACs, much of which is presented outside of traditional reporting channels. Timely and current Countries are awarded up to 2 points based on the year for which the latest data available, as of 31 December 2019, was published.
• A score of 2 is awarded for 2017 data • A score of 1 is awarded for 2016 data • A score of 0 is awarded for 2015 data or older
14 Because 1/x is a convex function, this potentially reduces the score of countries that only report country groupings. To see this, consider the two countries in the earlier example on poverty weighting, Mozambique (income $2,246) and Kenya (income $3,230), scaled to the LIC average income of $2,246. The average income of these two countries is 0.5 * (1,380 + 3,230) = $2,305, which would mean a score of (2,246/2,305) = 0.97. However, the average of their individual scores = 0.5 * (2,246/1,380 + 2,246/3,230) = 1.16. Also note that we are using PPP incomes, whereas country income categories are denoted in current US dollars. This explains why the ‘average income’ figure we use for LICs is higher than the threshold for becoming an LMIC. 15 See, for example, Marcus Manuel et al. (2018) ‘Financing the End of Extreme Poverty’, Overseas Development Institute, https://www.odi.org/publications/11187-financing-end-extreme-poverty. 16 To reduce potential challenges related to subjective scoring, two researchers reviewed the data and scored performance against this measure.

20
Open and comparable Countries are awarded up to 2 points for publishing their latest data on a platform that allows for comparison across providers.
• A score of 2 is awarded if data is publicly reported on an outlet that allows for comparison, such as the
IATI or the OECD’s CRS. • A score of 1 is awarded if data is publicly reported but is not available via an outlet that allows for
comparison (for example, when providers report flows through their own reporting publications or on government websites).
• A score of 0 is awarded if data is not publicly reported.
Comprehensive Countries are awarded up to 4 points (1 point each) for reporting that includes the components listed below. In each case, we allocate half a point (0.5 point) for the publication of financial data and a further 0.5 point for descriptive information on development cooperation programmes:
• Main aggregate figures for development finance (total spending on development cooperation) • Main aggregate figures for development finance, by instrument (grants, loans, etc.) • Flows by recipient country • Project-specific information
Tied Status This indicator measures the share of development finance that is provided under the condition that the goods and services they fund be procured from suppliers based in the provider country. The same goods and services may be available at lower cost from other countries, so tying aid potentially deprives recipients of access to the most efficient service providers and thereby reduces its de facto value relative to the development impacts it could have purchased if aid were untied. Countries are awarded a score out of 4 points based on the share of aid that is untied, using the following groupings:
• 1 point is awarded in cases where less than 50% of providers’ cooperation is untied. • 2 points are awarded in cases where between 50% and 69% of providers’ cooperation is untied. • 3 points are awarded in cases where between 70% and 89% of providers’ cooperation is untied. • 4 points are awarded in cases where 90% or more of providers’ cooperation is untied.
For DAC providers, we use data reported in the DAC CRS on the tying status of aid to compute the share of total aid that is untied for each donor. Partially tied aid is given a weight of 0.5 in calculating the share of untied aid. While donors receive guidance on how to classify which aid is tied, partially tied, or untied,17 this status is self-reported by donors and not always consistent. The EU is the only multilateral institution that ties a portion of its aid. This means that donors that provide core support to the EU have a portion of their spending tied via EU allocations. We account for this by multiplying the share of EU cooperation that is tied, as calculated using the methodology above, by each
17 See ‘Converged Statistical Reporting Directives for the Creditor Reporting System (CRS) and the Annual DAC Questionnaire – Addendum 1’, Annex 11, ‘Types of Aid and Tying Status’ (p. 63): https://www.oecd.org/dac/stats/documentupload/DCD-DAC(2013)15-ADD1-FINAL-ENG.pdf.

21
provider’s core contributions to EU institutions.18 The resulting figure is added to the volume of tied bilateral resources (in the numerator), while total core contributions to EU institutions are included in the denominator. For non-DAC providers, we searched for evidence of untying across official sources. In cases where data was not available, we assigned countries a score of 1 point and assumed that aid was tied.19 In our 2020 publication, three of our sample countries – Argentina, Chile and Indonesia – only provide development cooperation as technical cooperation or humanitarian assistance. As these types of cooperation are excluded from the DAC recommendation on untying ODA, we award these countries a score of 4 points. Country Ownership This indicator measures the degree to which development cooperation providers promote country ownership over development interventions by aligning project objectives to recipient-country priorities or national planning tools. To so do, we use data from Indicator 1.a1, reported in the Global Partnership for Effective Development Cooperation (GPEDC) 2018 monitoring round, which measures the proportion of new development interventions that draw their objectives from country-led results frameworks. For this indicator, recipient countries report to GPEDC on up to six development interventions of significant size ($100,000 and above) approved during the year of reference.20 Specifically, this indicator measures the number of times recipients state that objectives are drawn from their own priorities (a ‘yes’ response), divided by the number of projects reported. More detail on the GPEDC indicators are available in the technical companion. One challenge with GPEDC data is that differences in response rates across donors raise questions about the reliability of high scores attained from only a few respondents. To account for this issue, we assume that each recipient that does not report to GPEDC would have awarded donors a score of 0.4 (or 40%) on this measure, had they responded.21 This score is equivalent to the lowest score reported in our sample of countries in the 2018 reporting round.22 To do so, we need to estimate, for each CDI country, the number of non-respondents so that we can impute the number of assumed ‘yes’ responses equivalent to 40% of reported projects. Non-respondents To assess the number of recipients that do not respond, we subtract the number of recipients that report scores on Indicator 1.a1 (per donor) from the total number of recipients supported by each provider. For providers that report to the DAC, we count the total number of countries that received ODA (excluding humanitarian and food aid, debt relief and in-donor refugee costs) in 2017, per donor.23 This data is sourced from the OECD’s CRS. For other providers, we use own-reporting documents (annual reports and websites) to derive
18 Data on core contributions to EU institutions is sourced from OECD members’ total use of the multilateral system dataset. 19 We would be happy to change these scores if evidence of untying is provided. 20 Please see the GPEDC’s 2018 Monitoring Guide for more information on reporting parameters. 21 This is equivalent to two ‘yes’ responses for every five projects reported. 22 Belgium received a score of 0.4 on Indicator 1.a1. 23 We subtract humanitarian and food aid on the basis that ‘ownership’ is typically prioritized in cases of long-term developmental planning and transfers rather than for humanitarian interventions, which are often responsive, unplanned and intended to meet immediate needs. We exclude debt relief and in-donor refugee costs on the basis that this support does not involve a transfer of funds to the recipient country, so there can be no expectation of ‘ownership’ over such funds.

22
the total number of recipients.24 In all cases, we exclude from the total number of recipients any ODA-eligible partner that reports to the GPEDC as a ‘provider’.25 Imputed number of projects We assume that recipients that did not respond to GPEDC Indicator 1.a1 would have reported a positive response rate of 40% – two ‘yes’ responses out of five projects – if they responded.26 We impute this response rate for each non-respondent by multiplying the number of non-respondents by a score of 2 to mimic the assumed ‘yes’ response share and by 5 to capture the total number of projects we assume non-respondents would have reported:
Estimated ‘yes’ responses = non-respondents x 2 Estimated projects = non-respondents x 5
We add estimated ‘yes’ responses to actual ‘yes’ responses. We divide the result by actual projects reported on plus estimated projects to derive a ‘yes’ rate that accounts for non-respondents:
𝑂𝑂𝑂𝑂𝑂𝑂𝑊𝑊𝑂𝑂𝑂𝑂ℎ𝑊𝑊𝑖𝑖 = # ′yes′ responses + (# of non − respondent recipients ∙ 2)
# projects + (# of non − respondent recipients ∙ 5)
We exclude fragile and conflict-affected countries with active peacekeeping or peacebuilding missions from both the numerator and the denominator in our calculation. Using the World Bank’s definition of fragility, which underlies its World Bank’s Harmonized List of Fragile Situations for 2017, we distinguish between countries considered fragile due to poor institutional capacity and those that are fragile due to active or recent conflict.27 In the former, cooperation providers are encouraged to work with and through recipient institutions to support sustainable capacity and state-building; in the latter, efforts to meet immediate needs may require providers to engage with nongovernmental channels to support service delivery.28 By excluding states with peacekeeping and peacebuilding missions, we ensure that donors are not penalised for working beyond the government in such contexts. Multilateral Quality We provide a separate quality score for the share of finance provided as core contributions within FID.29 It is frequently stated that multilateral channels have certain advantages over bilateral channels – they are less politicised than bilateral channels and preferred by aid recipients, and they provide less fragmented spending (Gulrajani 2016). In addition, it is untied (with the exception of the European Union; see above on tied aid, page 20) and generally more transparent. In light of this evidence indicating advantages of the multilateral
24 For Mexico, the number of partner countries was assessed using reporting by SEGIB’s 2018 Report on South-South Cooperation in Ibero-America as well as countries’ own reporting documents. For China, we used data from AidDATA’s Global Chinese Official Finance Dataset 2000–2014 and took the average number of recipients of ‘ODA-like’ flows between 2012 and 2014. For Chile, we counted the number of recipients listed in AGCID’s Annual Report, although we recognise that this might be an underestimation as cooperation with Africa and Asia is not reported by recipient. For India, we counted the number of recipients of lines of credit and technical cooperation based on data from India’s Export-Import Bank and its Ministry of External Affairs. 25The GPEDC methodology allows respondents to select how they participate. Countries that are ODA-eligible and opt to participate only as ‘providers’ have chosen not to respond to indicators measured by recipient, including Indicator 1.a1. By removing these countries from the total number of recipients, we do not penalize donors for the non-responses of countries that participate as ‘providers’ only, despite being ODA recipients. Practically, this applies to 11 ODA-eligible countries in the 2018 monitoring round: Brazil, Chile, China, Colombia, Cuba, India, Mexico, Morocco, South Africa, Thailand and Turkey. 26 This is the minimum number of responses that could yield a 40% rate of ‘yes’ responses and is also similar to the average number of projects reported by countries that did respond for the CDI countries. 27 The World Bank’s list of fragile states considers a country to be fragile if it has either a) an average country rating of 3.2 or less on the Country Policy and Institutional Assessments conducted by the World Bank Group, African Development Bank and Asian Development Bank, or b) the presence of a UN or regional peacekeeping or peacebuilding mission over the last three years. 28 See Grävingholt, Leininger and von Haldenwang for a review of evidence on state-building support in fragile states. 29 A workbook that contains the names of the multilateral agency channels that can be reported to the DAC can be found at http://www.oecd.org/dac/stats/annex2.htm.

23
system, we argue that providers who allocate greater core contributions (rather than earmarked resources) to multilaterals are playing a key role in strengthening the international development cooperation system as a whole, which is demonstrative of higher-quality aid.30 To reflect this, we assign a quality score to multilateral contributions set at the 67th percentile of all countries’ bilateral aid quality. To measure multilateral contributions for DAC providers, we use core multilateral tables (DAC Data, Table 1). For non-DAC providers, we analyse UN system financial data and the annual reports of the 15 largest multilaterals in terms of ODA provided.31 This is supplemented with a list of additional multilaterals that we know are important for non-DAC providers. While methodology omits some multilateral contributions, they are not significant.32 More information on how we calculate core multilateral contributions from non-DACs is available in the FID working paper. We exclude any contributions to multilateral agencies that are earmarked for spending in the provider country. This is the case of some contributions to UN agencies made by providers from Latin America.33 Within the multilateral contributions provided, there is likely to be a variation in the effectiveness of approach. For example, in recent Quality of ODA (QuODA) results, there is a wider variation in multilateral effectiveness than in the past. It would be possible to take a more granular approach to scoring multilateral allocations, which we may pursue in future editions. Further Reading
• QuODA Working Paper • How Much and How Well: Revisiting the Aid Component of the Commitment to Development
Index • Europe Beyond Aid: Assessing Europe’s Commitment to Development Assistance • Development Finance Workbook
30 Non-core funds are earmarked for specific sectors, themes, countries or regions. 31 This methodology is similar to that of McArthur and Rasmussen. 32 See Annex 2 of the FID working paper for a full discussion of the methodology and omissions. 33 For instance, the Mexican government provides funding to the UNDP, which is then spent in Mexico to deploy contractors within Mexico’s development cooperation agency (see Calleja and Prizzon).

24
Investment Component Why Are Investment and Financial Transparency Important for Development? Foreign direct investment (FDI) is an important catalyst of economic growth in many developing countries, in many cases constituting a significant part of capital formation. Rich countries’ policies that either support or impede investment beyond their borders can have a substantive effect on the well-being of many developing-country citizens. Foreign investment can contribute to the development of infrastructure, housing, transport, energy supply and many other areas. However, the quantity of investment is not the only important dimension of investment as a development tool. It is also important that measures be in place which ensure that the environment and the general welfare of those affected by the investment are properly safeguarded. International financial flows can also be used to facilitate crime, money laundering, tax evasion, international bribery, corruption and tax evasion. Ultimately, illicit financial flows from developing countries may end up as assets held in the financial institutions and property markets of rich countries instead of contributing to developing countries’ own development. In this way, illicit financial flows deprive the concerned country of urgently needed resources for private and public investment, thereby hampering infrastructure building and economic growth. States now have legal duties to screen, trace, freeze, seize and return illicit wealth, and to detect, prevent and punish foreign bribery. This supports the integrity of investment, public accountability and revenue raising in developing countries. So, we consider whether countries are making and meeting effective commitments on financial integrity and combating illicit financial flows as part of the CDI. Related CGD work: Finance and investment Structure The Investment component’s subcomponents and their weights in the overall component score are as follows: Investment Standards
• Anti-corruption (20%) • Business and Human Rights (10%) • Natural Resource Governance (10%)
Financial Secrecy
• Financial Secrecy (35%) o Limiting banking secrecy o Extractive country-by-country reporting o Public statistics o Anti–money laundering o Automatic exchange of information o Bilateral treaties o International legal cooperation o Beneficial ownership
Investment Agreements
• International Investment Agreements (25%)
Investment Standards Policy inputs towards higher investment standards are measured by the international commitments a developed country takes on. This category looks at three important areas of investment standards: commitments on

25
business and human rights, commitments to better governance of natural resources, and commitments to criminalise bribery of foreign officials. Anti-corruption This subcomponent assesses the degree to which countries adopt and enforce the OECD’s Anti-bribery Convention, as measured by Transparency International in its Exporting Corruption Report. The convention requires parties to criminalise bribery of foreign public officials and to introduce related measures. The convention is a key instrument for curbing global corruption because the 44 signatory countries are responsible for approximately 65% of world exports and more than 75% of total FDI outflows. The scores, from 0 to 3 points, are taken directly from the Transparency International report. They are assessments of the enforcement status of the OECD’s Anti-bribery Convention. As with all CDI subcomponents, these raw scores are then standardised to mean 0, standard deviation 1. As the convention is not exclusive to OECD members, any countries which have not signed on are given 0 points. Business and Human Rights This subcomponent scores countries, from 0 to 3 points, for their engagement with OECD’s responsible business conduct (RBC) principles. These standards set out the expectation that businesses – regardless of their legal status, size, ownership or sector – contribute to sustainable development, while avoiding and addressing adverse impacts of their operations, including any throughout their supply chains and business relationships. Countries are assessed on three aspects, for a total raw score of 6 points possible:
1. Whether the government has responded to a survey on business and human rights (0–1 points) 2. Whether a national action plan on business and human rights is being drafted (1 point) or is already
adopted (full 2 points) 3. Whether a multinational National Contact Point (NCP) has been set up. For any given year, a
country receives 1 point each for meeting the following criteria: • Adherence to the OECD Declaration • Formation of NCP • Active participation in NCP peer reviews
Natural Resource Governance This subcomponent assesses countries’ engagement with certain initiatives designed to limit the problems that natural resource–rich developing countries can face. The Extractive Industries Transparency Initiative (EITI) promotes transparency in the management of natural resources. If a country participates in EITI, its extractive companies (oil, gas, mining) are required to publish what they pay to the governments of countries they operate in, and governments that sign on to EITI are obliged to disclose what they receive from such companies. A multistakeholder group monitors the process in each participating country. A list of participating countries and institutions can be found here. The Kimberley Process Certification Scheme is a joint initiative of governments, industry, and civil society that aims to eliminate the trade of conflict diamonds. Conflict diamonds are those whose sales contribute to funding armed conflicts. A full list of participating countries is available here. A total of 7 points are possible for the raw score:

26
• EITI: A country gets 2 points for being a formal supporter of the EITI initiative; it also gets points for progress towards implementing the EITI standard: Satisfactory = 3, Meaningful = 2, Yet to Be Assessed = 1, Inadequate or Suspended = 0.
• Kimberley: A country gets 2 points for participating in the Kimberley Process.
Financial Secrecy The Financial Secrecy subcomponent of the CDI is based on a subset of indicators drawn from the Financial Secrecy Index (FSI) and directly from OECD and Financial Action Task Force (FATF) peer reviews and mutual evaluations. The FSI is published biannually by the Tax Justice Network. It scores jurisdictions based on information on their laws, regulations and cooperation with information exchange processes, and it is used to calculate a secrecy score for each country. The FSI was developed to provide a means to assess the extent to which jurisdictions provide harmful financial and legal secrecy to non-residents, providing a ‘criminogenic environment’, which enables illicit financial flows (including tax evasion). The current iteration of the FSI has expanded to include 20 indicators, but they do not all relate to secrecy and illicit activities. In adapting the FSI indicators for the CDI we have considered whether each indicator relates to financial secrecy or illicit financial flows, whether the criteria are well supported by international norms or measure good practice in relation to preventing illicit financial flows, and whether the data appear to be reliable. On this basis we have selected eight indicators (including two which are modified from the FSI). While the FSI indicators are rated on a scale of 0 to 1, where 0 is low secrecy and 1 is high secrecy, this direction is reversed for the CDI in keeping with the CDI’s general approach, so that a low score relates to high secrecy (i.e., poor policy effort on financial integrity) and a high score relates to low secrecy (i.e., high policy effort on financial integrity). For all countries except the UK, the raw score for the financial secrecy subcomponent is the simple average of that country’s score on the 8 indicators. The UK’s score is arrived at somewhat differently. Each of the UK’s overseas territories34 and the UK itself are scored independently, and then weighted according to the amount of British territory they comprise. The weighted scores are then summed to give the UK’s final score. Although in principle this should apply to other countries with overseas territories, data is available for the UK only for beneficial ownership, and the weights for non-UK external territories are insubstantial. Note that there are two aspects to the scores that the FSI uses to assess countries: the Key Financial Secrecy Indicators as measures of secrecy and the Global Scale Weight, a measure of jurisdictions’ importance in the total global trade in financial services. In order to make financial secrecy policies comparable across all countries in the CDI regardless of scale, we use only the former, the scores on the individual indices of secrecy. The following indicators of financial secrecy are used: Limiting Banking Secrecy This indicator assesses whether a jurisdiction enables banking secrecy, where absence or inaccessibility of banking information is also considered a form of banking secrecy. For a country to obtain a full score on this indicator, the jurisdiction must ensure that banking data exists and that competent authorities (i.e., the government authority designated as being competent to exchange information with other jurisdictions under double tax conventions or tax information exchange agreements) have effective access to this data. This means that tax authorities can obtain account information without the need for authorisation from a separate institution, such as a court, for example, and that there are no undue notification requirements or appeal rights against obtaining or sharing such information.
34 Anguilla, Bermuda, British Virgin Islands, Cayman Islands, Gibraltar, Guernsey, Isle of Man, Jersey, Montserrat, Turks and Caicos Islands.

27
For further details on this indicator, please consult the FSI methodology. Extractive Country-by-Country Reporting Another area where a modified indicator has been adopted is country-by-country reporting. Under the G20/OECD-led Base Erosion and Profit Shifting programme, large multinational companies are required to submit an annual country-by-country report to their home tax authority, giving headline figures on revenues, profits, assets, employees and taxes paid in each jurisdiction. It is intended as a risk assessment tool for revenue authorities. The international agreement is for this information to be kept confidential and shared between revenue authorities using exchange-of-information protocols. A number of campaigning organisations argue that companies should be required to publish these country-by-country reports. The FSI includes criteria that countries should require full annual public country-by-country reporting by corporations of all sectors. However, this has not been adopted by the CDI since it is not the basis of current international agreement or expert consensus, and it is not clear that this is relevant to illicit financial flows. The FSI does offer a partial score for countries that have these requirements for public country-by-country reporting in particular sectors. There is also specific justification for publication of country-by-country reports on extractive-sector revenues, to enable public and parliamentary scrutiny of natural resource revenues, which are often linked to corruption. The CDI therefore adopts this part of the relevant FSI indicator, and makes this into a full indicator. It also rounds down the score so that only those countries with the worst score are punished. For further details on this indicator, please consult the CGD financial secrecy methods paper. Public Statistics This indicator measures the degree to which a jurisdiction makes publicly available 10 relevant statistical datasets about the jurisdiction’s economic and financial engagement with the wider world through trade, investment and taxes. Crucially, bilateral disaggregation ensures that the data offers valuable insights to every partner jurisdiction. For further details on this indicator, please consult the FSI methodology. Anti–Money Laundering This indicator examines the extent to which the anti–money laundering regime of a country is considered effective by the FATF, the international body dedicated to tackling money laundering, and evaluates countries’ compliance with FATF recommendations. The assessment is based on peer reviews evaluating the implementation of FATF recommendations concerning the laws, institutional structures and policies deemed necessary to counter money laundering and terrorist financing. Peer reviews are carried out in five-year cycles. The third round of mutual evaluations was completed in 2012. Each recommendation taken from the FATF’s 40 recommendations concerning the laws, institutional structures and policies considered necessary to address money laundering and terrorist financing is given an equal weight in this methodology. A 100% rating indicates full compliance, whereas a 0% rating indicates a country is deemed wholly non-compliant. For further details on this indicator, please consult the FSI methodology. Automatic Exchange of Information The indicator assesses whether a country has signed the Multilateral Competent Authority Agreement (MCAA), which provides the legal framework to engage in automatic exchange of information. Under the MCAA, jurisdictions agree to automatically provide information to their home jurisdictions about the bank accounts (and other reportable accounts) held by foreign tax residents in their countries. This includes details of the owner of the account, the account number, balance at the end of the year, and any income received. A score of 1 is given if a country has signed the MCAA and has committed to start exchanging information in 2017. A score of 0.50 is given if a country has signed the MCAA and committed to start exchanging information in 2018. A score of 0.25 is given if a country has not yet signed the MCAA but has committed to start exchanging

28
information in 2017. A score of 0.10 is given if a country has not signed the MCAA but has committed to start exchanging information in 2018. No score is awarded if a country has neither signed the MCAA nor committed to start exchanging information. For further details on this indicator, please consult the FSI methodology. Bilateral Treaties This indicator assesses the extent to which a jurisdiction has signed and ratified bilateral treaties conforming to the ‘upon request’ information exchange standard developed by the OECD and the Global Forum with 53 other countries, and/or whether the jurisdiction has signed and ratified the Council of Europe / OECD Convention on Mutual Administrative Assistance in Tax Matters (amended). This is important because tax authorities around the world face immense difficulties when trying to secure foreign country–based evidence relating to suspected domestic tax evasion or tax avoidance. Exchange-of-information provisions allow jurisdictions to obtain information from tax authorities in other countries. The ‘upon request’ provisions can either be tax information exchange agreements or full double taxation agreements, whose scope extends far beyond information exchange. For further details on this indicator, please consult the FSI methodology. International Legal Cooperation The indicator measures the degree to which a country engages in international judicial cooperation on money laundering and other criminal matters. The indicator assesses the level of a country’s compliance with recommendations of the FATF, the international body dedicated to counter money laundering. In 2003, the FATF established its 40 recommendations concerning the laws, institutional structures and policies considered necessary to address money laundering and terrorist financing. For further details on this indicator, please consult the FSI methodology. Beneficial Ownership A key issue in achieving meaningful financial transparency is how readily beneficial owners (i.e., the natural person or persons who ultimately own or control a company, trust or partnership, or on whose behalf a transaction is being conducted) can be identified. This is a foundation for anti–money laundering and anti–tax evasion efforts, since anonymously owned shell companies can be used to launder illicit proceeds of corruption, tax evasion and crime. Legal and beneficial ownership information can assist law enforcement and other competent authorities by identifying those natural persons who may be responsible for the underlying activity of concern, or who may have relevant information to further an investigation. This allows the authorities to ‘follow the money’ in financial investigations. Relevant international agreements on this are FATF recommendation 24 (or 33 in previous numbering) and the Global Forum on Transparency and Exchange of Information for Tax Purposes. The CDI does not use the FSI indicator for beneficial ownership for a few reasons. The FSI criteria on beneficial ownership go considerably beyond the FATF and Global Forum recommendations in terms of defining the threshold for beneficial ownership (down to the level of one share). It is not clear whether the ‘no threshold’ approach advocated by the FSI would be proportionate in administrative and enforceability terms. At the same time, the criteria do not consider the reliability of the information (i.e., in self-declared versus verified systems). The FSI’s measurement on this issue also allows fairly benign practices (such as the existence in theory of historical ‘bearer shares’) to deliver the highest secrecy score. The CDI therefore uses an indicator more directly based on compliance with internationally agreed-upon standards. The schedule of peer reviews means that there is no single rating which can be used.

29
The CDI’s solution is to use the most recent compliance rating from one of four alternative sources, in order of preference: a) the FATF, b) the OECD Global Forum on Transparency, c) OECD Illicit Flows from Developing Countries and d) the Global Forum Overall Reviews. The compliance rating is converted into a numerical score as follows: Compliant = 3, Largely Compliant = 2, Partially Compliant = 1, Not Compliant = 0. Because this is combined with other FSI indicators as part of the Financial Secrecy subcomponent, we convert this numerical score to the same scale, by dividing by 3 and subtracting from 1, so it ranges from 0 (best score) to 1 (worst score). For further details on this indicator, please consult the CGD financial secrecy methods paper. Investment Agreements While the benefits of investment have long been acknowledged, countries are increasingly worried about the economic and social costs of unregulated market forces. International investment agreements (IIAs) can help to ensure that investment is not harmful for the environment, brings social benefits and promotes gender equality, which can help developing countries to move up the global value chain. International Investment Agreements This subcomponent assesses the development-friendliness of the IIAs a CDI country has signed. IIAs in the scope of our measure include bilateral investment treaties and some free trade agreements between CDI countries and any ODA-eligible country. IIAs contain legal measures designed to protect the investments made by investors (parties) of one state in the territory of another state under international law. To attract and facilitate FDI, IIAs therefore offer foreign investors legal security and protection against most of the risks that may occur. However, there are concerns that these agreements protect the interests of the investors as opposed to the general interests of the recipient countries, with weaknesses in protections for human rights and the environment. Therefore, IIAs need to find an equilibrium of ensuring that countries retain their right to regulate for pursuing public policy interests (including sustainable development objectives) while contributing to a favourable investment climate and protecting foreign investors from unjustified discrimination measures by the host state. Data on IIAs was analysed by the Center for Research and Studies on Coherence and Development (CIECODE). The IIAs analysed were those in which the parties were, on one side, one of the CDI countries and, on the other, a developing country (according to the OECD’s list of ODA recipient countries). For each of the 40 CDI countries, the analysis includes the latest three IIAs with a developing country signed in each of four time periods (2014–present, 2008–2014, 2004–2008, and pre-2004) and still in force. The most recent updates of all agreements have been considered. When analysing regional agreements, the score is extended to all the parties involved as though the agreement were an IIA. For assessing the ‘sustainable quality’ of the IIA, the preamble, the fair and equitable treatment clause, and the investor-state dispute settlement system were analysed. Any other general clause in the treaty that extends its application to these three clauses was also analysed. Each of the three dispositions analysed was given a score ranging from 0 to 2 depending on how much its content contributes to the capacity of the agreement to promote sustainable development and foreign investments. The analysis also assessed whether the IIA protects the state’s right to regulate for pursuing legitimate sustainable development objectives. You can read more about our methodology in CIECODE’s methodological note on IIAs.

30
Further Reading • Europe Beyond Aid: The Role of European Countries in Fostering Development through
International Investment • Europe Beyond Aid: Illicit Financial Flows – Policy Responses in Europe and Implications for
Developing Countries • Illicit Financial Flows and the 2013 Commitment to Development Index • Section on finance in the CDI methodology paper from 2013 • CGD financial secrecy methods paper • Investment workbook

31
Migration Component Why Is Migration Important for Development? International mobility of workers is a source of opportunities for people to improve their lives, as well as those of their families. The available evidence suggests that gains to development from lowering barriers to emigration appear much larger than gains from further reductions in barriers to goods or capital flows, and may be much larger than those available through any other shift in a single class of global economic policy. When workers migrate from poor to rich countries, they often broaden their opportunities to earn higher incomes, access knowledge and gain valuable skills. Meanwhile, returning migrants may often bring technical know-how back to their home countries, contributing to the wider knowledge base in their societies. What’s more, migrant workers from low- and middle-income countries collectively sent over $550 billion back in 2019, helping increase incomes and smooth consumption in their countries of origin. This flow exceeds official aid by a factor of 3 and is similar to levels of FDI. In addition to the economic aspects of migration, social remittance effects have often been observed. Returning migrants may contribute to changing social norms at home, pushing for better political accountability, transparency and more equal gender norms. In particular, when women have more opportunities for migration, there may be even larger social remittance impacts. Therefore, the stronger the opportunities for migrants to integrate into their host societies, and the better their rights are protected, the more they are able to enjoy the opportunities available to them, and the better their life chances are. Related CGD work: Migration, displacement and humanitarian policy Structure The Migration component’s subcomponents and their weights in the overall component score are as follows: Migrants
• Immigrant Inflow (30%) • Female Immigrants (10%)
Refugees • Refugee Hosting (30%)
Integration and Protection
• Integration Policies (20%) • International Conventions (10%)

32
Migrants Migration is a powerful poverty reduction tool for migrants, their families and wider communities, and can contribute to delivering the Sustainable Development Goals (SDGs). Emigrants contribute to the development of their home countries by sending remittances, investing, and transferring knowledge and ideas. Immigrant Inflow This subcomponent measures the inflow of migrants to CDI countries. We take the view that a migrant arriving into a rich country from a poor one gains a much greater relative increase in wealth, opportunities and overall standard of living than does a migrant worker arriving from a wealthier country. The former migrant’s remittances are also likely to be a much more important component of income in the home country than is true for a wealthier migrant. For this reason, we give higher scores to CDI countries for accepting migrants from poorer countries; that is, we apply the income weighting outlined above (page 7) when calculating CDI countries’ scores on this subcomponent. With these weights assigned to origin countries, country j’s score on this subcomponent is calculated as
𝑊𝑊𝑊𝑊𝑊𝑊𝑊𝑊ℎ𝑡𝑡𝑊𝑊𝑡𝑡 𝑀𝑀𝑊𝑊𝑊𝑊𝑂𝑂𝑀𝑀𝑂𝑂𝑡𝑡𝑂𝑂 𝑆𝑆𝑆𝑆𝑆𝑆𝑂𝑂𝑊𝑊𝑗𝑗 =∑ 𝑊𝑊𝑊𝑊𝑊𝑊𝑊𝑊ℎ𝑡𝑡𝑊𝑊𝑡𝑡 𝑀𝑀𝑊𝑊𝑊𝑊𝑂𝑂𝑀𝑀𝑂𝑂𝑡𝑡𝑂𝑂𝑗𝑗𝑗𝑗𝑛𝑛𝑗𝑗
𝑃𝑃𝑆𝑆𝑖𝑖𝑜𝑜𝑜𝑜𝑀𝑀𝑡𝑡𝑊𝑊𝑆𝑆𝑂𝑂𝑗𝑗,
where
• Weighted Migrantsji = the number of migrants arriving in country j from country i, multiplied by country i’s income weight, and
• Populationj = the population of country j in thousands. Migrant data come from the OECD International Migration Database, and population and GNI per capita, PPP, data come from the World Bank’s World Development Indicators. If we could not find data for a given year, we used the most recent year, up to a point (2010, see missing data section, page 10) and depending on the measure. For instance, when income weighting migrant inflows to developed countries, Syria’s GDP was unavailable for recent years. In this case we used the most recently available GDP data. Generally, when estimating or relying on different data sources, we take a conservative approach. Consider again Syria’s GDP data: actual GDP currently is likely to be much lower than that of previous years. That means that the scores of CDI countries that took in Syrians in recent years likely underestimates the true value of their contributions. Female Immigrants This subcomponent measures the percentage of immigrants into the CDI country who are female. Female migrants are viewed as important not only because of the equality of opportunity hosting them provides for migrants of both sexes, but because when women have more opportunities for migration, there may be even larger social remittance impacts on gender equality in their home countries. Country j’s score on the Female Migrants subcomponent is
𝐹𝐹𝑊𝑊𝐹𝐹𝑀𝑀𝑜𝑜𝑊𝑊 𝑀𝑀𝑊𝑊𝑊𝑊𝑂𝑂𝑀𝑀𝑂𝑂𝑡𝑡𝑂𝑂 𝑆𝑆𝑆𝑆𝑆𝑆𝑂𝑂𝑊𝑊𝑗𝑗 =∑𝐹𝐹𝑊𝑊𝐹𝐹𝑀𝑀𝑜𝑜𝑊𝑊 𝑀𝑀𝑊𝑊𝑊𝑊𝑂𝑂𝑀𝑀𝑂𝑂𝑡𝑡𝑂𝑂𝑡𝑡𝑗𝑗∑𝑇𝑇𝑆𝑆𝑡𝑡𝑀𝑀𝑜𝑜 𝑀𝑀𝑊𝑊𝑊𝑊𝑂𝑂𝑀𝑀𝑂𝑂𝑡𝑡𝑂𝑂𝑡𝑡𝑗𝑗
,
where
• (Female / Total) Migrantstj = (female / total) migrants arriving at time t in country j.

33
Refugees The 1951 Refugee Convention defines a refugee as “‘someone who, owing to a well-founded fear of being persecuted for reasons of race, religion, nationality, membership of a particular social group or political opinion, is outside the country of his nationality and is unable or, owing to such fear, is unwilling to avail himself of the protection of that country; or who, not having a nationality and being outside the country of his former habitual residence as a result of such events, is unable or, owing to such fear, is unwilling to return to it.”’. Countries which contribute to host refugees are therefore given due credit in the CDI. Refugee Hosting This subcomponent measures the degree to which the CDI country welcomes refugees. Countries are scored on the number of refugees and people in refugee-like situations that they take in.35 Refugee data come from UN High Commissioner for Refugees (UNHCR) global trends reports, and population data come from the World Bank’s World Development Indicators. Integration and Protection Public policies have a significant impact on the way migration contributes to the development of both countries of origin and those of destination. When migrants and refugees settle in new communities, they will have more opportunities if they are protected by legal rights. The full benefits of migration for both migrants and host countries can also be better realised if migrants are well integrated. Studies suggest that better integration of migrants also leads to higher long-term economic, social and fiscal gains for the country where they settle. Integration Policies This subcomponent uses the data from the Migrant Integration Policy Index (MIPEX), which assesses how effective host-country policies are at helping to integrate migrants. MIPEX consists of eight categories, which together assess 50+ policy indicators. The eight dimensions of MIPEX are the following:
1. Labour market mobility 2. Education 3. Political participation 4. Family reunion 5. Antidiscrimination 6. Access to nationality (i.e., naturalisation) 7. Permanent residence 8. Health ( this stand is not included in the CDI score, as MIPEX fieldwork is ongoing at the time of
CDI publication) International Migration Conventions This indicator assesses the extent to which countries have ratified international conventions aiming to protect migrants. Three conventions are considered:
• 1949 Convention Concerning Migration for Employment (No. 97)
35 Except some 4.9 million Palestinian refugees residing in areas of operation of the United Nations Relief and Works Agency for Palestinian Refugees in the Near East (UNRWA).

34
• 1975 Convention Concerning Migrations in Abusive Conditions and the Promotion of Equality of Opportunity and Treatment of Migrant Workers (No. 143)
• 2000 Protocol to Prevent, Suppress and Punish Trafficking in Persons, Especially Women and Children
Countries receive 10 points for ratifying each treaty, 5 points if the convention was ratified but with excluded provisions, and 0 points if the treaty was not ratified. A country’s score on this subcomponent is the sum of its points across the three treaties.
Further Reading • An Evaluation of an Extended Index on Pro-development Migration Policies • Europe Beyond Aid: Assessing European Commitment to Migration • Section on migration in the CDI methodology paper from 2013 • Migration workbook

35
Trade Component The trade component assesses countries’ policies facilitating international trade in goods by lowering tariffs, reducing agricultural subsidies to their farmers, enabling trade in services and minimising red tape.
Why Is Trade Important for Development, and for All of Us? International trade and trading relationships are changing very rapidly. According to a 2015 UN Conference on Trade and Development (UNCTAD) report, international trade grew by $20 trillion from 1990 to 2014 (from $4 trillion to $24 trillion). Rich countries’ trade policies have a significant impact on the trading prospects of developing countries. Trade provides important opportunities for countries to develop dynamic export sectors, tap into global supply chains, attract investment, create jobs and reduce poverty. The human impacts of these benefits are very real. One study, for instance, suggests that the introduction of the African Growth and Opportunity Act, the US trade agreement with sub-Saharan African countries, has reduced infant mortality in the latter group of countries by about 9% of the sample mean. It is therefore critical for such development prospects that rich countries open themselves to trade with developing-country partners. But despite a wide consensus on the positive effects of trade, many goods for which poor countries have a relative production advantage, such as agricultural goods or textiles,36 still face tariffs and other trade barriers in rich countries. Rich countries also affect the development prospects of trading partners beyond their borders when they subsidise domestic agricultural production. This lowers production costs for those countries that can afford to subsidise, which causes overproduction and the ‘dumping’ of the excess supply onto world markets. This in turn lowers the global prices of agricultural produce and thus hurts poor-country farmers. Also, trade in services is becoming increasingly important for development, with about 17% value share of total exports from developing economies, but regulatory barriers remain. Besides these direct measures, there are also high administrative or logistical costs to trading with some countries, which is a particular disadvantage to poorer trading partners, exporting low value-added items, and less able to absorb additional costs. Related CGD Work: Trade Structure The trade component’s subcomponents (and indicators) and their weights in the overall component score are as follows:
• Lower-income weighted Tariffs (30%) • Tariff Peaks (10%) • Agricultural Subsidies (20%) • Services Trade Restrictions (20%) • Logistics Performance (20%)
Tariffs Trade is important to development, but many nations protect their domestic industries with tariffs, often in sectors where developing countries are trying to develop their own industries, such as agriculture, textiles and manufacturing. In this subcomponent, we measure the average level of tariffs and the number of tariff ‘peaks’, giving a greater weight to tariffs against lower-income countries. This subcomponent scores countries negatively on the ad valorem equivalent of duties on imports from all trading partners. Tariffs are also income weighted
36 Note that a ‘relative’ production advantage in this sense refers to the economic theory of comparative advantage. It does not mean these countries produce these things absolutely more efficiently than their trading partners do, but that their producing them incurs lower opportunity costs – the forgone production of other goods. Classical trade theory holds that everyone is better off if they produce and export goods in which they have a comparative advantage and import other goods.

36
so that a high score on this indicator indicates relatively low tariffs, or that tariffs against poorer countries are lower than those against richer countries. We also score countries on the number of tariff peaks, that is, tariffs over 15%, and similarly income weight these. For tariff data, we use Global Trade Analysis Project data from the Market Access Map (MAcMap) produced by the International Trade Centre (ITC). The process in brief is to take an average of an importer’s tariffs against a trading partner (in particular, those that apply after trade preferences), weight those by the partner’s income, and take the average of these scores across all partners. The detailed steps are outlined below. Tariff Averages This data is summarised so that each CDI country has an average tariff score for each of its trading partners. This is the simple average of all the tariff lines against that trading partner, after any preferences, and is calculated for all trading partners. It does not weight for the volume or value of exports in each tariff line, as this would give a disproportionate weight to products with lower tariffs (known as an ‘endogeneity’ problem). Poverty-Weight Average Tariffs We take the view that a tariff against a poorer country is more detrimental to development than a tariff against a rich one, and it is poverty within the country that matters so we weight tariffs of a CDI country by the GDP per capita, Purchasing Power Parity (PPP) of the of the trading partner against whom the tariff is levied, as the PPP adjustment measures the country’s average income scaled to what it can buy within the country, and is therefore a real purchasing power measure. Then each of these CDI country-versus-trading partner tariff averages is adjusted by a weighting formula:
𝑊𝑊𝑊𝑊𝑊𝑊𝑊𝑊ℎ𝑡𝑡𝑊𝑊𝑡𝑡 𝑇𝑇𝑀𝑀𝑂𝑂𝑊𝑊𝑇𝑇𝑇𝑇𝑗𝑗𝑗𝑗 = �𝑇𝑇𝑀𝑀𝑂𝑂𝑊𝑊𝑇𝑇𝑇𝑇𝑗𝑗𝑗𝑗 × 𝑊𝑊𝑊𝑊𝑊𝑊𝑊𝑊ℎ𝑡𝑡𝑗𝑗�, where
• Tariffjji = the average tariff rate across all tariff lines implemented by country j against trading partner i,
• j ≠ i, and • Weighti = the income weight given to trading partner i.
The income weighting approach and its rationale are outlined in the income weighting section (page 7). In brief, it weights the tariff according to the inverse of partner-country income and scales it relative to the income of the typical LIC. In this way, tariffs against the richest country are given a weight approaching 0, while those against an average LIC get a weight of 1, and those against the poorest countries are weighted greater than 1. Average of All Trading Partners The weighted tariffs score for country j is calculated as the average of all the weighted tariffs across all of its trading partners:
𝑊𝑊𝑊𝑊𝑊𝑊𝑊𝑊ℎ𝑡𝑡𝑊𝑊𝑡𝑡 𝑇𝑇𝑀𝑀𝑂𝑂𝑊𝑊𝑇𝑇𝑇𝑇𝑂𝑂 𝑆𝑆𝑆𝑆𝑆𝑆𝑂𝑂𝑊𝑊𝑗𝑗 =∑ 𝑊𝑊𝑊𝑊𝑊𝑊𝑊𝑊ℎ𝑡𝑡𝑊𝑊𝑡𝑡 𝑇𝑇𝑀𝑀𝑂𝑂𝑊𝑊𝑇𝑇𝑇𝑇𝑗𝑗𝑗𝑗𝑛𝑛𝑗𝑗=1
𝑂𝑂
Tariff Peaks Whilst average tariffs inhibit trade, very high tariffs – or prohibitive tariffs – can often stifle trade completely. We therefore measure the number of tariff peaks (measured at the six-digit level within our MAcMap source) where the tariff level meets or exceed a threshold. In line with the WTO-ITC-UNCTAD tariff profiles, we set

37
that threshold at 15%. For each bilateral relationship, we sum the tariff peaks and weight them by income in the same way as is done for tariff averages:
𝑇𝑇𝑀𝑀𝑂𝑂𝑊𝑊𝑇𝑇𝑇𝑇 𝑃𝑃𝑊𝑊𝑀𝑀𝑃𝑃𝑂𝑂𝑗𝑗𝑗𝑗 = �𝑃𝑃𝑊𝑊𝑀𝑀𝑃𝑃𝑂𝑂𝑗𝑗𝑗𝑗 ×𝑊𝑊𝑊𝑊𝑊𝑊𝑊𝑊ℎ𝑡𝑡𝑗𝑗�, where
• Peaksji = the number of tariff peaks of country j against trading partner i, j ≠ i, and • Weighti = the income weight of trading partner i.
The score for country j is then simply the average number of tariff peaks across all of its trading partners:
𝑊𝑊𝑊𝑊𝑊𝑊𝑊𝑊ℎ𝑡𝑡𝑊𝑊𝑡𝑡 𝑇𝑇𝑀𝑀𝑂𝑂𝑊𝑊𝑇𝑇𝑇𝑇𝑂𝑂 𝑆𝑆𝑆𝑆𝑆𝑆𝑂𝑂𝑊𝑊𝑗𝑗 =∑ 𝑇𝑇𝑀𝑀𝑂𝑂𝑊𝑊𝑇𝑇𝑇𝑇 𝑃𝑃𝑊𝑊𝑀𝑀𝑃𝑃𝑂𝑂𝑗𝑗𝑗𝑗𝑛𝑛𝑗𝑗=1
𝑂𝑂
Agriculture Agriculture is an important part of developing-country economies, accounting for over a quarter of economic output across LICs. Subsidies in more advanced economies create a highly uneven playing field, and this subcomponent assesses the support to agriculture outside that provided by tariffs (which is assessed separately). Agricultural Subsidies This indicator assesses the extent to which a country pays its farmers trade-distorting agricultural subsidies. The raw score is the sum of such subsidies a country pays as a proportion of its total agricultural output. To avoid double counting, the level of agricultural subsidy is calculated without including subsidies which relate mainly to tariffs and which are captured by the tariff indicator. The remaining agricultural subsidies are then divided by agricultural output in the country, to calculate a subsidy ‘rate’. This is used as the CDI’s agricultural subsidy measure. The data on types and levels of subsidies comes from elements of the OECD’s Producer Support Estimate (PSE), which contains detail about types of subsidies, allowing us to remove those which relate mainly to tariffs. Specifically, we remove the ‘market price support’ element of the PSE but retain the other elements. However, in the OECD data, the EU is treated as a single unit. This aggregation has two disadvantages for the CDI. First, it fails to reflect differences among EU members in how much they subsidise agriculture (which the results show are significant). Second, it includes EU countries that are not (yet) in the CDI. To obtain individual EU country subsidy rates, therefore, we allocate the EU’s total of direct subsidies across EU member states according to proportions provided in data from the European Commission, which records total EU subsidies and their shares between members. The subsidy rates for non-EU countries and the EU block are calculated as being the average of the dollar values of total direct subsidies (i.e., the PSE excluding market price support), for the three most recent years for which there is data, as a proportion of total farm gate production. The complete list of assessed subsidies includes payments based on the following factors:
a) Commodity output b) Input use c) Current production d) Non-current production, production required e) Non-current production, production not required
The less intuitive of these are c, d, and e (see OECD’s explanations):

38
• c = Transfers from taxpayers to agricultural producers arising from policy measures based on current
area, animal numbers, receipts or income, with current production of any commodity required • d = Transfers from taxpayers to agricultural producers arising from policy measures based on non-
current (i.e., historical or fixed) area, animal numbers, receipts or income, with current production of any commodity required
• e = Transfers from taxpayers to agricultural producers arising from policy measures based on non-current (i.e., historical or fixed) area, animal numbers, receipts or income, with current production of any commodity not required but optional
Services Trade in services is an increasingly important sector for developing economies. In 2018, according to UNCTAD statistics, services trade in developing economies was worth $5.8 trillion, or around one quarter of the value of total exports and 7 percent of world GDP Services Trade Restrictiveness This indicator assesses countries’ level of restrictiveness on trade in services. It is based on the Services Trade Restrictiveness Index published by the OECD. The raw score on this subcomponent is the simple average of the scores given by the OECD for restrictiveness in all sectors: • Accounting • Air transport • Architecture • Broadcasting • Commercial banking • Computer • Construction • Courier
• Distribution • Engineering • Insurance • Legal • Logistics: cargo handling • Logistics: customs
brokerage • Logistics: freight
forwarding
• Logistics: storage and warehouse
• Maritime transport • Motion pictures • Rail freight transport • Road freight transport • Sound recording • Telecom
Logistics Non-tariff barriers are increasingly seen as an important impediment to trade, and this indicator seeks to measure the administrative burden faced by developing countries. Trade Logistics The costs of moving goods across borders are assessed using two indicators, Customs and Infrastructure, from the World Bank’s Logistics Performance Index. These elements were chosen to provide consistency with the measures of cost, time and documents required to import used in previous editions of the CDI (see links below). The new measures are based on surveys of importers administered by the World Bank, in which participants score ‘the efficiency of customs and border clearance’ and ‘the quality of trade and transport infrastructure’ for the relevant country on a range of 1 to 5 (where higher is better). These two indicators are weighted equally to give the country’s raw logistics performance score. Further Reading
• Trade and Commitment to Development: Which Is More Damaging to Development, Agricultural Subsidies or Trade Tariffs?
• Europe Beyond Aid: Assessing Europe’s Commitment to International Trade • Section on trade in the CDI methodology paper from 2013

39
• Trade Component Workbook

40
Environment Component Why Is Protection of the Environment Important for Development, and for All of Us? Several elements of the environment are true global public goods. No country can be prevented from consuming the atmosphere, the air, or its forests. Conversely, though many countries have contributed to global environmental problems, no individual country can effectively address these by acting alone. This presents a huge and rising challenge for policymakers and industry alike, as countries must act collectively to address issues like climate change. Though all must act, the main contributors to environmental problems are not equally distributed across the globe. As countries develop economically, they consume more resources – adding CO2 and other pollutants to the atmosphere, cutting down forests to make way for agricultural activities and paving over natural habitats. Historically, it is the economically more developed nations which have contributed most to global environmental issues. This apparent marriage between economic growth and a larger environmental footprint is being re-evaluated as policymakers and academics focus on possibilities for decoupling and green growth in industrialised countries, and on avoiding the high‐carbon development pathway established by industrialised countries through low-emissions development strategies in emerging economies. Meanwhile, it is the poorest countries – who have contributed least to global environmental challenges – which bear the brunt of their impacts. Climate change – arguably the key global environmental challenge – will raise sea levels, threatening island economies and low-lying countries the most. Likewise, while climate change will affect agricultural outputs in all countries, it will disproportionately affect farms in lower latitudes, where many developing countries are located. The health risks resulting from changing climatic conditions (chiefly malaria, waterborne diseases and other diseases transmitted through insects) are also likely to also be higher there. Rising temperatures in lower latitudes are not the only worrying factor: evidence shows that the poor rely disproportionately on ecosystem services for their security and livelihoods. Agriculture forms the bedrock of employment in the world’s poorest regions. Biodiversity plays a central role in sustaining food security. Healthy ecosystems are a source of clean water and energy, provide income opportunities and shelter, and are a source of treatment and protection. Global oceans are also under threat. Rapid depletion of global fish stocks is a particular problem, as these are increasingly overexploited, partly because demand remains high in rich countries. As 10%–12% of the world’s population relies on aquaculture for their employment, this directly affects livelihoods. Fishing subsidies provided by rich countries often result in overfishing, which has a negative impact not only on the ocean’s decreasing biodiversity, but also on the livelihoods of communities dependent on these resources. As in most situations where collective action is required, global treaties can help to set binding norms and standards for international collaboration. This is the case for the Paris Agreement, as well as a number of other treaties on species conservation, logging and forestry, as well as biodiversity. For more information on why rich countries’ policies matter for the environment, please see our paper with the Ecologic Institute. Related CGD Work: Climate Change Structure This component measures countries’ contributions to helping (or limiting harm to) the global climate and the world’s oceans, and their support of multilateral efforts to contain harm to the environment. The subcomponents and their weights in the overall component score are as follows:
41
Climate Action
• Greenhouse Gas Emissions (40%) • Fossil Fuel Production (10%) • Fossil Fuel Support (10%) • Carbon Pricing (10%)
Sustainable Fisheries
• Fishing Subsidies (10%) International Environmental Conventions
• Environment Treaties and Participation in Organisations (20%) Climate Action Climate change represents a major threat to development, with the World Bank estimating that climate change could push 100 million people into extreme poverty by 2030. The vast majority of historical and current emissions arise from higher-income countries, with LICs producing less than 2% of the global carbon emissions – around one-20th of the per-head emissions in the major economies. The subcomponents here focus on CDI countries’ emissions per head, their production of and support for fossil fuels, and their efforts to price carbon. The Climate Action category is made up of four subcomponents: Greenhouse gas emissions (40%); fossil fuel production (10%); fossil fuel support (10%); and carbon pricing (10%). Greenhouse Gas Emissions This subcomponent comprehensively measures the level of greenhouse gas emissions attributable to each ranked country. Each country’s emissions are divided by its population to give a per capita figure. This indicator is standardised negatively – lower greenhouse gas emissions result in a better score. We measure three indicators: self-reported domestic industrial greenhouse gas emissions; emissions from the land use, land use change and forestry (LULUCF); and greenhouse gas emissions embodied in international imports. While most discussions of climate action focus on energy, industry and transport, we recognise that land use is critically important as well – both as a source of greenhouse gas emissions and as a climate change solution. Additionally, we measure emissions embodied in imports, as evidence suggests that countries at certain levels of development may displace a significant portion of their emissions to other countries while still driving global demand. For industrial greenhouse gas emissions, country self-reported figures are prioritised, with thanks to the Potsdam Institute for Climate Impact Research for its analysis (the data are described here). For net emissions and removals in the LULUCF sector, data is taken from the Food and Agriculture Organization of the United Nations (FAO). For emissions embodied in imports, data come from the OECD. Population data come from the World Bank’s World Development Indicators. Fossil Fuel Production This subcomponent captures the idea that responsibility for greenhouse gas emissions lies not only with consumers, but also with the producer countries who allow fossil fuels to be supplied to global markets. It comprises three indicators: coal production, oil production and natural gas production, with each volume of production being scaled by its relative CO2 intensity. Data on production of each fossil fuel type comes from the US Energy Information Administration. Volumes of production are converted to oil-equivalent calorific values, and then multiplied by their CO2 emissions

42
factors (given by BP) to ultimately give a raw score for emissions (in tonnes of CO2 equivalent) from each type of fossil fuel produced per capita. Population data comes from the World Bank’s World Development Indicators. Fossil Fuel Support This subcomponent assesses the level of government support to the domestic consumption and production of fossil fuels, through both taxes and subsidies. We find that fossil fuel support measures were worth 0.4% of the collective GNI of the 38 countries with existing data – a total of around $276 billion in 2017. As well as artificially boosting demand for fossil fuels at home, in the face of subsidies, low-carbon alternatives may encounter comparative disadvantages due to relative price changes on world markets. Support is measured for subsidies to coal, oil, gas and electricity, with each scaled to the CO2 intensity of the fuel. Support to electricity is scaled differently for each country, as each country has a different CO2 intensity per kilowatt-hour, based on the fuels it uses in its electricity mix and other factors. The raw score on this subcomponent is expressed as the CO2-scaled dollar support as a percentage of a country’s GNI. These scores are then standardised negatively, meaning that more support for fossil fuel production results in a lower score. Data on fossil fuel support measures and amounts come from the OECD Inventory of Support Measures for Fossil Fuels and is taken for the latest available year, 2017. Data on the relative CO2 intensity of each country’s electricity production per kilowatt-hour comes from the International Energy Agency via the OECD. Carbon Pricing Putting a price on carbon is widely believed to be one of the most effective economic and policy tools for meeting the Paris targets, as it can achieve emissions reductions at a low cost, compared with alternative policies. Currently, markets are failing to internalise the costs and risks of emissions-intensive economic activities – emitting carbon is simply too cheap. The two main carbon pricing instruments, emissions trading schemes (ETSs) and direct carbon taxes, serve to put an additional price on emissions, thereby lowering demand. A carbon tax directly puts an additional cost on emitting greenhouse gases by setting a fixed price on each unit of covered emissions. Meanwhile, by setting a subnational, national or regional cap, an ETS (also called a ‘cap-and-trade’ system) determines the total amount of allowed emissions, which may then be traded to generate revenue. The actual carbon price of emissions in an ETS fluctuates depending on the demand of participating entities for allowances and the number of allowances the authorities make available through either free allocation or auction. Revenues raised by carbon pricing are a direct measure of the increased costs of emissions (the additional cost of a tax for carbon pricing and the additional cost of purchasing emissions through auction or trade from an ETS). These additional costs on emissions are controlled by participating jurisdictions by increasing the carbon tax rate, increasing the scope of emissions covered by carbon pricing or further reducing available allowances in an ETS. The value of carbon pricing measures among the 40 CDI countries was $90 billion in 2018, or around 0.125% of their collective GNIs. Currently, about 20% of global greenhouse gas emissions are covered by a carbon price, 14.9% of which are covered by the carbon pricing mechanisms in CDI-ranked countries alone. Currently, carbon pricing policies vary greatly in ambition, and most prices are below the $40–$80 per tonne of CO2 range which is likely needed to achieve the goals of the Paris Agreement. A country’s score on this subcomponent is measured as this extra cost imposed per unit of all domestic emissions (i.e., the total value of carbon pricing as a proportion of a country’s total carbon emissions). We

43
obtain data on the dollar value of all carbon pricing schemes from the World Bank’s carbon pricing dashboard. Data on overall domestic emissions comes from the Potsdam Institute for Climate Impact Research and excludes LULUCF. Additionally, as the EU ETS is a regional scheme covering EU member states as well as some European Environment Agency (EEA) states, the value must be distributed among participating countries. As with agricultural subsidies (see page 37), we take an extra calculation step and distribute the total EU ETS figure to each participating country according to data from the EEA on how allowances were allocated to EU member states. The proportion of the total value of the EU ETS is then allocated based on the share of the country’s allocations. Sustainable Fisheries Fishing Subsidies Fishing subsidies are a direct cause of overfishing, which leads to depleting transboundary fishing stocks and has a negative impact on the livelihoods of communities dependent on these resources. The raw score for this indicator is expressed as a percentage share of fishing-sector output. This is obtained by measuring the OECD’s Fisheries Support Estimate, which is expressed in US dollars, as a proportion of the dollar value of total fisheries output (obtained from the OECD – national landings in domestic ports plus national landings in foreign ports). This indicator is standardised negatively, meaning that more subsidies result in a lower score. Landlocked countries are given the average score, effectively eliminating them from the ranking. Meanwhile, non-landlocked countries with missing data are penalised by being given the maximum (worst) score, in accordance with the general methodology for missing data. International Conventions International Environmental Conventions This subcomponent evaluates which countries sign, and subsequently fulfil their monitoring and reporting requirements under, key international climate and environmental agreements. Six agreements are considered, with the following weights towards the subcomponent score:
• The Paris Agreement (25%) • Convention on Biological Diversity (15%) • Convention on International Trade in Endangered Species of Wild Fauna and Flora (15%) • Ramsar Convention on Wetlands of International Importance (15%) • Convention on Migratory Species (15%) • International Tropical Timber Organization (15%)
CDI countries’ participation in all international environmental treaties and organisations is measured from 1 to 3 for each treaty. Signature or accession is awarded 1 point, whereas ratification or acceptance into domestic law is awarded the full 3 points. Further Reading
• Europe Beyond Aid: Assessing European Commitment to Global Environment • Section on environment in the CDI methodology paper from 2013 • Evaluating the Environment as a Global Public Good (Uitto 2016) • Report of the High-Level Commission on Carbon Prices • WHO: Climate Change and Health • UNCTAD: 90% of Fish Stocks Are Used Up

44
• Environment workbook • The PRIMAP-hist National Historical Emissions Time Series

45
Security Component Why Is Security Important for Development? Security and development are closely interlinked. War and political violence devastate government infrastructure and public resources, and harm civilians and their homes and livelihoods. War decimates public capacities and political institutions, and devastates citizens’ lives. This causal link also works in reverse: poverty and institutional weakness make it easier for both challengers and incumbents to gain support for political violence and war. It is unsurprising that fragile and conflict-afflicted states are the most behind on the SDGs. Within security we consider both the traditional security aspects outlined above and, for the first time, nontraditional, ‘human’ security approaches. Specifically, in 2020 we add a health subcomponent to the security component. The COVID-19 pandemic and ensuing global crisis have brought into sharp focus the transboundary nature of threats to human health. However, it is not only viruses which we should guard ourselves against. Likewise, the risks posed by antimicrobial resistance threaten human health beyond any domestic borders. We measure a country’s commitment to global security by focusing on four categories: contributions to international peacekeeping efforts, participation in international security treaties, avoiding damaging arms sales and efforts in global health. Structure The Security component’s subcomponents and indicators and their weights in the overall component score are as follows: Peacekeeping Contributions
• Contributions to Peacekeeping Efforts (20%) o Financial contributions o Troops contributed to UN operations o Troops contributed to non-UN operations
• Female Peacekeepers (10%) • Sea Lanes Protection (10%)
Arms Trade
• Arms Trade Volume (15%) • Conflict Potential of Arms Exports (10%)
Treaties
• Ratified Security Treaties (10%)
Health Security • Antimicrobial Resistance (10%) • Global Health Security (10%)
Peacekeeping Peacekeeping contributions have a direct impact on security. Providing money and troops to UN-approved interventions helps safeguard human rights and assists countries in navigating the difficult path from conflict to peace. Likewise, contributions to protect major sea lanes in ungoverned maritime spaces help to combat illicit activities which may affect all countries.

46
Peacekeeping Contributions This subcomponent considers three aspects of peacekeeping contributions: financial contributions to the UN Department of Peacekeeping Operations (DPKO) budget, both the direct costs and the indirect costs incurred from personnel contributions to UN operations, and costs incurred for personnel contributions to non-UN (but internationally approved) humanitarian operations. All of these contributions are calculated as a percentage of a country’s GNI. Data on GNI (in national currency units) come from the World Bank’s World Development Indicators. Financial Contributions Data on financial contributions are sourced directly from the UN, and count all contributions towards the DPKO. The latest available data year is 2018, and the formula is as follows:
Financial Contributions = Donations to UN DPKO / GNI Peacekeeper Contributions The dollar-value equivalent of troop and police contributions is the sum of direct costs and indirect costs incurred for the deployment of these personnel. The way these costs are calculated is similar for both UN and non-UN missions. As the data for personnel contributions may be lumpy, an average of the most recent available four years is taken. Direct costs of personnel contributions are measured by taking average yearly active police and troop numbers multiplied by direct deployment costs. As troop and police contribution data is reported monthly by the UN, troop and police numbers are measured as the monthly average active personnel during the given year. The data on UN peacekeepers come from UN DPKO, and the data on non-UN peacekeepers come from a bespoke data package from the Stockholm Peace Research Institute (SIPRI). The direct deployment cost is taken as $10,000 per month per peacekeeper in the US (based on both RAND’s analysis and Pentagon data underpinning the original 2003 CDI methodology. That figure has been inflated at 2% per annum for subsequent years). To account for the likely differing costs of troop deployment across CDI countries, this figure is multiplied by the PPP market exchange rate (from World Bank data)37. For UN peacekeeper contributions, we subtract the UN reimbursement per troop from this cost, which according to the UN website, is set at $1,428 as of 2019 (note that this reimbursement is not multiplied by the PPP exchange rate). Non-UN peacekeepers do not receive any such reimbursements and the full cost is incurred (with PPP adjustments). Thus the formula for peacekeeper contributions is as follows:
Direct Costs = (# of Peacekeepers * (PPP Deployment Costs – Reimbursements)) / GNI Indirect personnel contributions include costs such as training soldiers and providing equipment and uniforms. These costs have already been incurred by the contributing countries in maintaining their armies and are thus separate from direct deployment costs. These are calculated by taking the annual contributions of peacekeepers (obtained from an average over the past four years) as a proportion of a country’s total active service personnel to find a rough value for the proportion of domestic military personnel directed to the UN. This proportional figure is then multiplied by the country’s military expenditure to calculate the dollar value of these indirect costs of troop contributions. As with all other forms of peacekeeping contributions, this is then scaled by the country’s GNI. Data on total military personnel come from the World Bank’s World Development Indicators, as do data on total military expenditure. The formula is the following:
37 The PPP exchange rate is the one that converts one currency to another in a way that captures the different costs of goods and services between the two countries. The conversion factor ‘is the number of units of a country's currency required to buy the same amounts of goods and services in the domestic market as U.S. dollar would buy in the United States’ (from the World Development Indicators data series).

47
Indirect Costs = ((# of peacekeepers / total military personnel) * total military expenditure) / GNI Female Peacekeepers We include this measure because higher female participation in peacekeeping missions has been shown to increase reporting of sexual and gender-based violence, as well as leading to lower incidents of sexual exploitation and abuse (UN 2019). Female peacekeepers are crucial in making the peacekeeping force approachable to women in various communities, mentoring female cadets at police and military academies, and interacting with women in societies where women are prohibited from speaking to men. Despite this, the percentage of deployed military women currently hovers at 4%, and has not increased significantly since the end of 2009; as for police women, the percentage has stayed at around the 10% since 2011 (DCAF 2020). Therefore, we reward countries for higher proportions of female peacekeepers. Data come from UN Department of Peacekeeping Operations (2019) Sea Lanes Protection Ungoverned maritime spaces along major sea lanes are a major threat, providing refuge for armed maritime groups and a haven for illicit activities. This subcomponent assesses countries’ contribution to the protection of sea lanes based on the quantity of major ships in the navy, the naval budget and the number of ships devoted to sea lanes protection. It is calculated in a similar way to indirect costs of peacekeepers, outlined above. We divide the number of vessels devoted to sea lanes protection by the total number of vessels in a country’s navy. Then, we multiply this proportion by the total naval budget to obtain the dollar equivalent of sea lanes protection contributions. As with other peacekeeping contributions, we then divide this by the country’s GNI:
Sea Lanes Protection = ((Sea Lanes Protection Vessels / Total Vessels) * Naval Budget) / GNI The data on naval budgets and maritime deployments is collected by an independent defence economist using sources such as the United Nations and individual countries’ ministries of defence. Arms Trade Countries can affect peace and security beyond their borders if they supply arms to other countries. The effects might be especially detrimental in certain cases. For example, arms exports may be more likely to fuel conflicts if sent to countries which do not respect citizens‘ freedom of expression (some research shows that non-consolidated democracies may be more prone to both intra- and inter-state conflicts); or if the importing country is already spending a large amount of its GDP on arms (potentially implying a militaristic policy stance as well as a diversion of funds away from other basic services); or if the country is poor (the aforementioned research also shows that slow economic growth can be a driver, particularly of intra-state conflict). The Arms Trade category comprises two indicators. The first, named Arms Trade Value, measures the annual dollar amount of arms exports as a percentage of each CDI country’s GNI in the last five years. Meanwhile, the second indicator attempts to measure the relative likelihood that arms exports from a CDI country will incite or fuel conflicts worldwide. This is done based on the relative weighing of importing countries based on their income, militarism and poor governance. Arms Trade Value This indicator measures the dollar amount of arms that CDI countries exported over the previous five years, scaled by each country’s GNI. Half (50%) of the score for this indicator is taken from the most recent available year, as this best reflects the current policy stance. However, as arms exports data are quite lumpy, whenever possible we also use some historical data. This means that the other 50% of the score is taken from an average of exports from up to the previous four available years (though if the only data is from prior to 2014, we mark the data as missing).

48
Data on the volume of arms exports are provided by an independent security economist who uses a wide range of nationally provided statistics and data from SIPRI exporter-importer tables. As countries provide varying levels of detail in their reporting, ranging from fully available data on export volumes to each importer to only aggregate yearly volumes of exports, we use various techniques to arrive at a full dataset, detailed below. Methods for Handling Incomplete National Data on Arms Whenever possible, a country’s nationally reported statistics are prioritised. If government-reported statistics are not available, SIPRI data are used and scaled up based either on a historical, country-specific multiplier or, as a last resort if no national data are available, on the highest observed multiplier. Full nationally reported and disaggregated data is available for 25 of the 40 countries. However, if a country has no disaggregated data on exports to each importer country, but does provide an aggregate yearly figure, we compare the aggregate national statistics to the sum of all exports reported by SIPRI. Because SIPRI’s trend-indicator values (TIVs) routinely underestimate the absolute scale of arms exports, when disaggregated national sources are not available, we scale the SIPRI TIV value by a multiplier to reach the total nationally reported figure for each country. This multiplier is derived from a multi-year average of underreported percentages of the sum of a country’s TIV exports as compared with aggregate national statistics. This method is used for Australia, India, Indonesia, Israel, Russia and South Korea, who belong to the second category. As a last resort to fill data gaps, if a country has no aggregate statistics but does have enough data for SIPRI to produce exporter-importer tables, we scale that country’s TIV values for each importer by the highest multiplier for any of the countries in the second category. This is the case for Brazil, China, Japan, New Zealand and UAE. Finally, if a country fails to make its detailed arms export data publicly available and SIPRI is not available as a last resort, the country is scored punitively, as outlined in the missing data approaches section (page 10). But as outlined there, arms export volume is the one exception to the approach of assigning the worst score to non-publishing countries. Because Israel is such a large outlier on this subcomponent, assigning non-publishing countries the worst score both was excessively punitive and had the effect of compressing all the other scores closely together. For countries that have not published this data, therefore, we assign a score of the mean plus 2 standard deviations, to effectively put such countries at around the 97.5th percentile of export volume. This means that such a country’s final arms score is calculated as being equivalent to that of the worst-performing country. Moreover, in previous CDIs, export values between some OECD countries were not captured in data collected for the years 2014–2017. As the CDI now measures arms exports between all countries, in cases where data was previously not reported, we have assumed that the level of OECD exports was the same as in the most recent, 2018 data, and added that amount for the 2014 to 2017 data. Conflict Potential of Arms Exports Although the causal link between arms sales and conflict emergence in general is still a matter of great debate, numerous case studies as well as growing body of statistical analysis suggest that arms sales may significantly increase the probability of an onset of intra-state conflict or enable governments to unleash more violence against their own citizens. The likelihood that arms sales will be used for conflict onset or escalation is not equal among importing countries. Therefore, we have devised a method for establishing a relative weight between 1 (lowest conflict potential) and 10 (highest) for each importer, detailed below.

49
These importer weights are then used to multiply the share of actual dollar amounts of arms exports from each CDI country in each year. The final score on this indicator is the sum of a CDI country’s annual weighted arms exports divided by its unweighted arms exports in the most recent available year (either 2017 or 2018), to give a relative weight across all its arms exports. Method for Deriving Importer Weights To account for differences between different importers, we weigh arms exports from CDI countries by a) the importing country’s level of voice and accountability (V&A), b) its military expenditure as a proportion of GDP, and c) its level of poverty. Each of these weighting components takes equal weight. The scale of these effective weights is adjusted to range from 1 to 10, with highest-scoring Libya taking a weight of 10, and lowest-scoring Luxembourg taking a weight of 1. The first weighting component is on how democratic and accountable to its citizens the recipient government is, according to the V&A subcomponent of the Kaufmann-Kraay index, taken from World Bank data. The second weighting component is the recipient country’s military expenditure as a percentage of its GDP. We use data from both SIPRI and the World Bank. As SIPRI personnel are specialists in this field, we use their data as the first choice, but if SIPRI lacks data for a country, we use World Bank data. The ratio of World Bank figures to SIPRI figures on average is 1.008, so the discrepancies, if any, are tiny. The last weighting component is based on the recipient’s GNI per capita, PPP, from the World Bank’s World Development Indicators. Because these three indicators are all measured on different scales, we convert them to a unit-free measure for comparability (i.e., we standardise each of them to have a mean of 0 and a standard deviation of 1). For V&A and GNI, we invert this standardisation so that a higher raw score translates into a lower standardised score. This means that the highest standardised scores are recorded by countries that have low V&A, high military expenditure, and low GNI raw scores. Finally, we distribute the 160 arms importers, according to these scores, uniformly between 1 and 10. This gives a clear score to each importer, avoiding outliers or big differences between the weights given to countries with similar characteristics. We rank the 160 importers from best to worst based on the average of the three standardised scores (from 1 to 160). Then, we distribute weights from 1 to 10 evenly, with each increment between ranks worth 1/160. This is equivalent to normalising the ranks. In practice, this means the ‘best’ country has a weight of 1, the next best a weight of 1.057, and the ‘worst’ country to export to has a weight of 10. The weight of each importing country is thus calculated as
𝑊𝑊𝑊𝑊𝑊𝑊𝑊𝑊ℎ𝑡𝑡𝑗𝑗 = 𝐺𝐺𝑆𝑆𝑂𝑂𝐹𝐹 1 𝑡𝑡𝑆𝑆 10 ��𝑅𝑅𝑅𝑅𝑛𝑛𝑅𝑅𝑗𝑗
160�
∗ �𝐴𝐴𝐴𝐴𝑊𝑊𝑂𝑂𝑀𝑀𝑊𝑊𝑊𝑊 �𝑂𝑂𝑡𝑡𝑡𝑡�𝑉𝑉𝐴𝐴𝑗𝑗�, 𝑂𝑂𝑡𝑡𝑡𝑡�𝐹𝐹𝑊𝑊𝑜𝑜𝑊𝑊𝑚𝑚𝑖𝑖𝑗𝑗�, 𝑂𝑂𝑡𝑡𝑡𝑡�𝐺𝐺𝐺𝐺𝐺𝐺𝑗𝑗���� ,
where
• std(x) = variable x standardised to mean 0, standard deviation 1, based on the mean and standard deviation of its series;
• Rankj = Rank of the importer country out of 160 countries ranked; • VAj = V&A measure of country j; • milexpj = military expenditure as a percentage of GDP of country j; and • gnij = GNI per capita, PPP, of country j.
50
The result of this process is a country weight, which is lower for countries that are less problematic to export arms to, and higher for those that are more problematic to export arms to. These weights are then used to scale the arms exports a CDI country makes to each of its customer countries, so that the weighted arms export total of country i would be 𝑊𝑊𝐴𝐴𝑊𝑊𝑗𝑗 = ∑ ($ 𝑉𝑉𝑀𝑀𝑜𝑜𝑜𝑜𝑊𝑊 𝑆𝑆𝑇𝑇 𝐴𝐴𝑂𝑂𝐹𝐹𝑂𝑂 𝑊𝑊𝑚𝑚𝑖𝑖𝑆𝑆𝑂𝑂𝑡𝑡𝑂𝑂 𝑡𝑡𝑆𝑆 𝑗𝑗 ∙ 𝑊𝑊𝑊𝑊𝑊𝑊𝑊𝑊ℎ𝑡𝑡𝑊𝑊𝑂𝑂𝑊𝑊 𝑆𝑆𝑇𝑇 𝑗𝑗)𝑛𝑛
𝑗𝑗=1 , where
• j – n = country i’s arms-importing customer countries. We refer to this measure of the distribution of arms sales across importing countries as their ‘conflict potential’. Participation in Security Conventions Security conventions establish important global standards and set the basis for international cooperation. When countries ratify international conventions, they become part of domestic law, and countries become legally accountable for upholding these standards. International Security Conventions This subcomponent assesses the level of countries’ participation in 10 important international security regimes. Countries receive 1 point for ratifying each of the following 10 treaties:
• Non-proliferation Treaty • Chemical Weapons Convention • Biological Weapons Convention • Comprehensive Nuclear Test Ban Treaty • Mine Ban Treaty • Convention on Certain Conventional Weapons (with points assigned for each of the 7 articles and
amendments, for a total of up to 1 point) • Convention on Cluster Munitions • Rome Statute of the International Criminal Court • Arms Trade Treaty • UN Resolution 1325 on Women, Peace and Security
Countries get a point for ratifying the agreement but get a reduced score for not ratifying all additional protocols of the Convention on Certain Conventional Weapons. A country’s raw score on this subcomponent is simply the sum of its scores across all of the conventions, which thus has a maximum of 10. Health Security Even before the emergence and rapid spread of COVID-19, it was clear that one country’s approach to health could have major implications for the rest of the world. The current global pandemic has highlighted the low capacities and capabilities of most countries with regard to disease preparedness. Even as the world grappled with previous crises such as the West Africa Ebola crisis in 2014/2015 or SARS in 2003, governments still failed to take sufficient action to prepare. Viruses are not the only threat to human health which does not respect borders. Antimicrobial resistance is also a global threat as the use (and overuse) of antibiotics leads to resistance to microbes, which is already leading to many thousands of deaths annually and could lead to tens of millions of deaths each year by mid-century (see source below).

51
Countries need to develop better capacities and legal frameworks to prevent, detect and respond to a multitude of global health challenges – not only for the sake of their own citizens, but for the sake of all countries. Antimicrobial Resistance This subcomponent assesses countries’ relative efforts to curb antimicrobial resistance and is made up of two indicators: antibiotic use per capita and strength of national antimicrobial resistance governance. Antimicrobial resistance poses a significant and growing health and financial threat to countries at all income levels. Using (and especially misusing) antibiotics gives bacteria the opportunity to evolve antibiotic-resistant strains. As the drugs kill off the more susceptible bacteria, those that are left are the ones more capable of resisting the treatment. If they go on to infect another victim, those bacteria will not respond as readily to antibiotics. The death toll in Europe and the United States from antimicrobial resistance is already around 50,000 a year. As many as 58,000 infants died in India in 2013 because antibiotic treatments failed due to resistance. If no action is taken, the UN warns that drug-resistant diseases could cause 10 million deaths each year by 2050 and cause damage to the economy as catastrophic as the 2008–2009 global financial crisis. Considering the higher burden of infectious disease and restricted access to new antibiotics in lower- and middle-income countries, the burden is likely to be even higher there. Antibiotics are used in both human and animal health, and both uses contribute to resistance. Currently, we are not aware of a recent internationally comparable source on animal health antibiotic consumption but hope to add this to future editions. We therefore use the following indicators. Human Antibiotic Consumption The first indicator measures daily antibiotic consumption per capita. Units are given in daily defined doses of all classes of antibiotics per calendar day per 1,000 population. Data comes from the Center for Disease Dynamics, Economics and Policy’s Resistance Map. Where countries are using a high level of antibiotics per capita, they are contributing disproportionately to resistance. Antimicrobial Resistance Governance The second indicator measures the strength of countries’ governance on antimicrobial resistance. Legislation, surveillance, monitoring and optimisation are all taken as crucial elements of holistic antimicrobial resistance governance. As antimicrobial resistance arises not solely through irresponsible human use, but also through use in livestock production as well as environmental pollution with antibiotics, we cover these aspects in the following seven data points. Each is scored on a scale from 0 to 1.
1. Is there a national antimicrobial resistance action plan on surveillance, detection and reporting? 2. Is there a national laboratory system which tests for priority antimicrobial resistance pathogens? 3. Does the government conduct environmental detection or surveillance activities (e.g., in soil,
waterways) for antimicrobial residues or antimicrobial-resistant organisms? 4. Is there a monitoring system for consumption and use in human health? 5. Is there legislation on optimising use in human health? 6. Is there monitoring of consumption and use of antibiotics in animal health? 7. Is there legislation on optimising use for animal health?
The data for the first three indicators are taken from indicators 1.1.1a to 1.1.1c of the Global Health Security Index, where experts from the Economist Intelligence Unit (EIU) and the Nuclear Threat Initiative (NTI) externally assess countries’ antimicrobial resistance capabilities. The data for the last four indicators are taken from country self-assessment responses to a joint WHO, World Organisation for Animal Health and FAO questionnaire on antimicrobial resistance, with scores from A to E being converted to 0–1 in even increments.

52
Global Health Security This subcomponent measures a country’s capabilities to prevent, detect, and respond to epidemics and pandemics. It also measures countries’ commitment to improving their legal and normative framework around disease preparedness. Much of current media interest in COVID-19 relates to how countries cope with controlling the disease within their own country. However, our primary interest in the CDI is in how policy affects other countries and, as such, our measures focus on those areas most relevant to preparing for and preventing global disease spread; thus our indicators may not align with perceptions of responding well domestically. There are a number of other measures in the CDI that are highly relevant to global health and pandemics – not least, contributions to multilateral organisations such as the WHO and Gavi in the development finance component; R&D spending in technology; and limiting trade restrictions in the trade component. So, although the indicators have a relatively small weight in the Index, countries’ wider contributions on health are recognised. This subcomponent is made up of one composite indicator. We use the NTI and Economist Intelligence Unit’s Global Health Security Index as a proxy for how prepared a country is to handle an incoming epidemic and stop its international spread. From the Excel model of the Global Health Security Index, we include only the categories Prevent, Detect, Respond and Norms. We neglect the categories Health and Risk as they pertain to the wider risk environment, rather than to direct policy effort relevant to international spillovers. We also exclude any antimicrobial resistance–related indicators, as these are covered in the previous subcomponent. Each of the four categories we include carries an equal weight of 25%.
Further Reading • Europe Beyond Aid: Europe’s Commitment to International Security • Section on security in the CDI methodology paper from 2013 • The Security-Development Nexus, International Peace Academy • Council on Foreign Relations: Increasing Female Participation in Peacekeeping Operations • Global Health Security Index • CGD Policy Paper: Global Treaty to Reduce Antimicrobial Use in Livestock • WHO 2018 Report on Surveillance of Antibiotic Consumption • Global Increase and Geographic Convergence in Antibiotic Consumption between 2000 and 2015 • Security workbook

53
Technology Component Why Is Technology Creation and Access Important for Development? While technology may be embodied in physical products, the broader definition of technology includes knowledge, techniques, processes, skills and methods. Seen this way, it is a critical factor in economic and human development, and not just for the poor. New technologies reduce the prices of goods and services, making them more accessible to everyone. Advances in medicines, information and communication technology, and sustainable energy contribute to raising the quality of life worldwide. Rich countries, which have strong research networks and technological bases, have an important role to play in both new knowledge creation and its diffusion worldwide. The internet, mobile phones, vaccines and high-yielding grains were all invented by rich-country researchers and exported elsewhere, where they have improved – and saved – many lives. Promoting both the transfer and the diffusion of such knowledge is key to addressing many of the persistent and emergent challenges that developing countries face. Governments can contribute to global innovation and technological development by stimulating the production of new technologies through direct funding or through granting tax incentives to stimulate private-sector research. They can encourage technology diffusion beyond their borders in various ways: international academic collaborations allow developing-country researchers to gain skills and gives exposure to their ideas; opening the doors to foreign students allows them to gain new knowledge, skills and often economic and intellectual capital, which they can employ or share back home or in international innovator networks. This process can be particularly empowering for female students, who are so often underrepresented. But governments can also impede the diffusion of their technologies through imposing excessively restrictive intellectual property rights (IPR) terms on foreign trade and investment partners, which can limit developing countries’ access to vital technologies. Related CGD work: Technology and development Structure This component is structured to reflect the idea that countries’ contributions can be both in technology production and in technology diffusion, with the latter weighted more heavily. This is because the production of technology mainly benefits the producer, but sharing it has a broader developmental benefit. The technology component’s subcomponents and their weights in the overall component score are as follows: Government Support to Knowledge Production
• Government Technology Expenditure (25%) • Tax Incentives (10%)
Government Support to Knowledge Diffusion
• Foreign Students (25%) • Female Foreign Students (10%) • Research Collaborations (10%) • Intellectual Property (20%)
Government Support for R&D The two following subcomponents comprise the measure of technology production, which in total accounts for 30% of the weight of the Technology component.

54
Government R&D This subcomponent measures government expenditures on R&D. Government support is measured in budgetary expenditure on research as a share of national income (GNI). We use data from UNESCO. We include total government expenditure on R&D (GERD) on all sectors and socioeconomic objectives. In previous CDI versions, we discounted expenditure on defence by 50% with the rationale that such technologies are not developmental in scope. Several countries’ R&D has a substantial defence component – notably, the United States, which spends around 45% of its R&D budget on defence, and the UK, South Korea and Turkey, which spend between 10% and 20% (OECD Government Budget Allocations for R&D, 2017 data). Ideally, we would have liked to continue to discount defence R&D but the only data that is disaggregated sufficiently to permit this (from the OECD) excludes eight of the CDI countries. And for most countries, the share is relatively small. Therefore, we have included all R&D spending for now. Tax Incentives for Business R&D This subcomponent measures the level of government support for private R&D through tax incentives. It is expressed as an ‘implied subsidy rate’ based on the B-index, published by the OECD. As explained by the OECD, the B-index is a measure of the level of pre-tax profit a ‘representative’ company needs to generate to break even on a marginal, unitary outlay on R&D, considering provisions in the tax system that allow for special treatment of R&D expenditures. We give this subcomponent a lower weight than public R&D, given that commercial technologies are less likely to generate positive public spillovers, and access to them may also be restricted by IPR. The raw score for tax incentives is expressed as the realised value of R&D tax incentives as a percentage of GNI, and the formula for calculating it is
𝑅𝑅𝑊𝑊𝑀𝑀𝑜𝑜𝑊𝑊𝑂𝑂𝑊𝑊𝑡𝑡 𝑆𝑆𝑜𝑜𝑆𝑆𝑂𝑂𝑊𝑊𝑡𝑡𝑊𝑊𝑊𝑊𝑂𝑂 𝑀𝑀𝑂𝑂 % 𝑆𝑆𝑇𝑇 𝐺𝐺𝐺𝐺𝐺𝐺 = 𝑆𝑆𝑜𝑜𝑆𝑆𝑂𝑂𝑊𝑊𝑡𝑡𝑆𝑆 𝑅𝑅𝑀𝑀𝑡𝑡𝑊𝑊 ∗ 𝐵𝐵𝑊𝑊𝑅𝑅𝐵𝐵 𝑀𝑀𝑂𝑂 % 𝑆𝑆𝑇𝑇 𝐺𝐺𝐺𝐺𝐺𝐺, where
• Subsidy Rate is the average of the OECD-calculated implied subsidy rates on R&D for medium and large enterprises, and
• BERD as percentage of GNI is business R&D expenditures expressed as a share of GNI (BERD in local currency units from a UNESCO dataset, with gaps filled by the OECD; GNI data from World Development Indicators), multiplied by the average level of tax subsidies for profitable small and large enterprises (from this OECD dataset).
Technology Transfers and Diffusion Technology production creates a global public good of new knowledge, but the tangible benefits of that good can elude poorer countries. Their citizens and governments often lack the income to pay the high monopoly prices that patents can cause, and they are usually prevented, by international law and bilateral treaties, from developing more affordable equivalents. CDI countries are therefore scored positively for taking efforts to let the benefits of their knowledge and technologies diffuse to developing countries, and they are punished for requiring excessive restrictions on such flows. Technology diffusion is measured by four subcomponents, collectively accounting for 65% of the total technology component: Foreign Students, Female Students, Research Collaboration and IPR. Foreign Students This subcomponent measures the inflow of tertiary students to CDI countries. As with some other CDI measures (namely, poverty focus of development finance, inflow of migrants, trade tariffs and university collaborations) we give proportionally higher scores to the beneficiaries of CDI countries’ policies that come

55
from lower-income countries. To do so, we apply a weight according to the income of students’ country of origin. The method for calculating income weights for each origin country is are outlined earlier in this document (page 7). In brief, they are designed to be 1 for a country with an income equal to the low-income country average, declining (increasing) rapidly as the country’s income rises (falls). With these weights assigned to origin countries, country j’s score on this subcomponent is calculated as
𝑊𝑊𝑊𝑊𝑊𝑊𝑊𝑊ℎ𝑡𝑡𝑊𝑊𝑡𝑡 𝐹𝐹𝑆𝑆𝑂𝑂𝑊𝑊𝑊𝑊𝑊𝑊𝑂𝑂 𝑆𝑆𝑡𝑡𝑜𝑜𝑡𝑡𝑊𝑊𝑂𝑂𝑡𝑡𝑂𝑂 𝑆𝑆𝑆𝑆𝑆𝑆𝑂𝑂𝑊𝑊𝑗𝑗 =∑ 𝑊𝑊𝑊𝑊𝑗𝑗𝑊𝑊ℎ𝑡𝑡𝑊𝑊𝑡𝑡 𝑆𝑆𝑡𝑡𝑆𝑆𝑡𝑡𝑊𝑊𝑛𝑛𝑡𝑡𝑆𝑆𝑗𝑗𝑗𝑗𝑛𝑛𝑗𝑗
𝑇𝑇𝑊𝑊𝑇𝑇𝑡𝑡𝑗𝑗𝑅𝑅𝑇𝑇𝑇𝑇 𝑆𝑆𝑡𝑡𝑆𝑆𝑡𝑡𝑊𝑊𝑛𝑛𝑡𝑡 𝐵𝐵𝐵𝐵𝑡𝑡𝑇𝑇𝑗𝑗,
where • Weighted Studentsji = The numbers of tertiary students arriving in country j from country i, multiplied by
country i’s income weight, and • Tertiary Student Bodyj = The total number of tertiary-level students of country j (in thousands).
Student data come from the OECD International migration database and Population and GNI per capita, PPP, data come from the World Bank’s World Development Indicators. Female Students This subcomponent measures the ratio of female to male foreign students. Admitting female foreign students is especially important for development, as it frequently has large social remittance impacts on gender equality in their home countries. , and can promote gender equality in students’ home countries. Therefore, countries are rewarded for having a higher proportion of female foreign students. Data on students’ gender breakdown was taken from the OECD. The detailed calculations can be found here (in the sheet named ‘Female Migrants’). The score of a given CDI country, say country j, on the female foreign students subcomponent is calculated thus:
𝐹𝐹𝑊𝑊𝐹𝐹𝑀𝑀𝑜𝑜𝑊𝑊 𝐹𝐹𝑆𝑆𝑂𝑂𝑊𝑊𝑊𝑊𝑊𝑊𝑂𝑂 𝑆𝑆𝑡𝑡𝑜𝑜𝑡𝑡𝑊𝑊𝑂𝑂𝑡𝑡𝑂𝑂 𝑆𝑆𝑆𝑆𝑆𝑆𝑂𝑂𝑊𝑊𝑗𝑗 =𝑇𝑇𝑆𝑆𝑡𝑡𝑀𝑀𝑜𝑜 𝐹𝐹𝑊𝑊𝐹𝐹𝑀𝑀𝑜𝑜𝑊𝑊 𝐹𝐹𝑆𝑆𝑂𝑂𝑊𝑊𝑊𝑊𝑊𝑊𝑂𝑂 𝑆𝑆𝑡𝑡𝑜𝑜𝑡𝑡𝑊𝑊𝑂𝑂𝑡𝑡s
𝑇𝑇𝑆𝑆𝑡𝑡𝑀𝑀𝑜𝑜 𝐹𝐹𝑆𝑆𝑂𝑂𝑊𝑊𝑊𝑊𝑊𝑊𝑂𝑂 𝑆𝑆𝑡𝑡𝑜𝑜𝑡𝑡𝑊𝑊𝑂𝑂𝑡𝑡𝑂𝑂
Research Collaboration This subcomponent considers the low-income weighted share of a CDI country’s research outputs (as measured by journal publications) which are co-published by authors affiliated with third countries, as a proportion of all internationally co-authored outputs. Scientific collaboration is an important mechanism enabling spillovers through the integration of developing countries into research activities, thereby promoting both knowledge transfers and diffusion (González-Alcaide et al. 2017). More widely, co-authorship across multiple countries is associated with higher-quality knowledge generation. Through collaborating, global researchers can integrate a wide range of competences and skills to attack difficult problems with an enhanced chance of success. For these reasons, co-authored papers tend to have a higher citation impact (Pan et al. 2012). To smooth the data, publications with international co-authors in the past three years (2016–2019) are considered. Data were taken from Scopus, Elsevier’s abstract and citation database, and accessed through the SciVal platform. Scopus covers nearly 36,377 titles from approximately 11,678 publishers, with a particular focus on science and technology. The nationality used to assess collaboration was determined by the country of the author’s institutional affiliation. Any research output published with a CDI country–affiliated author with at least one foreign co-author is counted towards a country’s score. If a publication has co-authors from more than one country, it is counted as a collaborative research output separately for each co-authoring country.

56
To understand the relative share of outputs which are co-authored with lower-income countries, we poverty-weight research outputs by international institution co-authors in the same way we weight development finance (poverty focus), migration, student inflow and tariffs: we give a higher score for research outputs co-published with poorer countries. The income weights for each co-authoring country are outlined earlier in this document (page 7). With these weights, the indicator is calculated as
𝑅𝑅𝑊𝑊𝑂𝑂𝑊𝑊𝑀𝑀𝑂𝑂𝑆𝑆ℎ 𝐶𝐶𝑆𝑆𝑜𝑜𝑜𝑜𝑀𝑀𝑆𝑆𝑆𝑆𝑂𝑂𝑀𝑀𝑡𝑡𝑊𝑊𝑆𝑆𝑂𝑂 𝑆𝑆𝑆𝑆𝑆𝑆𝑂𝑂𝑊𝑊𝑗𝑗 =∑ 𝑊𝑊𝑊𝑊𝑗𝑗𝑊𝑊ℎ𝑡𝑡𝑊𝑊𝑡𝑡 𝐶𝐶𝐵𝐵−𝑅𝑅𝑆𝑆𝑡𝑡ℎ𝐵𝐵𝑇𝑇𝑊𝑊𝑡𝑡 𝑂𝑂𝑆𝑆𝑡𝑡𝑂𝑂𝑆𝑆𝑡𝑡𝑆𝑆𝑗𝑗𝑗𝑗𝑛𝑛𝑗𝑗
𝐶𝐶𝐵𝐵−𝑅𝑅𝑆𝑆𝑡𝑡ℎ𝐵𝐵𝑇𝑇𝑊𝑊𝑡𝑡 𝑂𝑂𝑆𝑆𝑡𝑡𝑂𝑂𝑆𝑆𝑡𝑡𝑆𝑆𝑗𝑗 ,
where
• Weighted Co-authored Outputsji = The numbers of publications co-authored by country j with co-authors in country i, multiplied by country i’s income weight; and
• Co-authored Outputsj = The total sum of publications with international co-authorship including country j.
Intellectual Property Rights This subcomponent measures the restrictiveness of IPR provisions in free trade agreements between CDI countries and developing countries. IPR provisions aim to incentivise research and innovation by granting producers of new technologies a monopoly over their inventions for a specified period. But a developmental IPR regime needs to balance this incentive with the need to sufficiently enable others to make use of technologies in order to assist developing countries in accessing important technologies and contribute to the advancement of human knowledge. Our data for this subcomponent was compiled by CIECODE, whose full methodology can be accessed here. The CIECODE team analysed the legal provisions in a sample of the most recent free trade agreements between CDI countries and developing countries for the restrictiveness of their IPR provisions on content relating to a) patent term length, b) patent opposition and revocation systems, c) compulsory licensing, d) parallel imports, and e) counterfeiting. Any provisions which are more restrictive than the WTO Trade-Related Aspects of Intellectual Property Rights (TRIPS+) agreement result in no points. Limitations and Issues In this component we mainly attempt to reflect the relative effort of a country to increase its existing research capacities and to share the technology and knowledge it has with others. This is an important distinction to make, as we are ranking the relative contribution to technological development of 40 countries at various stages in their own development, ranging from the United States to India. The technology component focuses on the strength of a country’s domestic innovation base, not as an end in itself, but as a contributor to the global public good of technological advancement. And because we focus on policy effort, many of our production measures mostly assess early-stage research, or so-called lab coat innovation, rather than direct commercial uses. We also outline some potential future methodological extensions in section B of our 2017 technology component methodological note, notably on measuring IPR restrictions in free trade agreements. Further Reading
• 2017 IPR methodological description

57
• Europe Beyond Aid: Evaluating Europe's Contribution to the Transfer of Technology and Knowledge to Developing Nations
• Section on technology in the CDI methodology paper from 2013 • Brain Gain or Brain Drain? • Measuring the International Mobility of Inventors, World Intellectual Property Organization
working paper, 2013 • Technology workbook