the coming of energy democracy - midwest renewable energy fair
TRANSCRIPT

T H E C O M I N G O F E N E R G Y D E M O C R A C Y
TA K I N G C H A R G E O F O U R E N E R G Y F U T U R E
John Farrell Director of Energy DemocracyJune 17, 2016
Presentation to the Midwest Energy Fair

A Q U E S T I O N

S M A R T P H O N E I M A G E Did you get one of these…
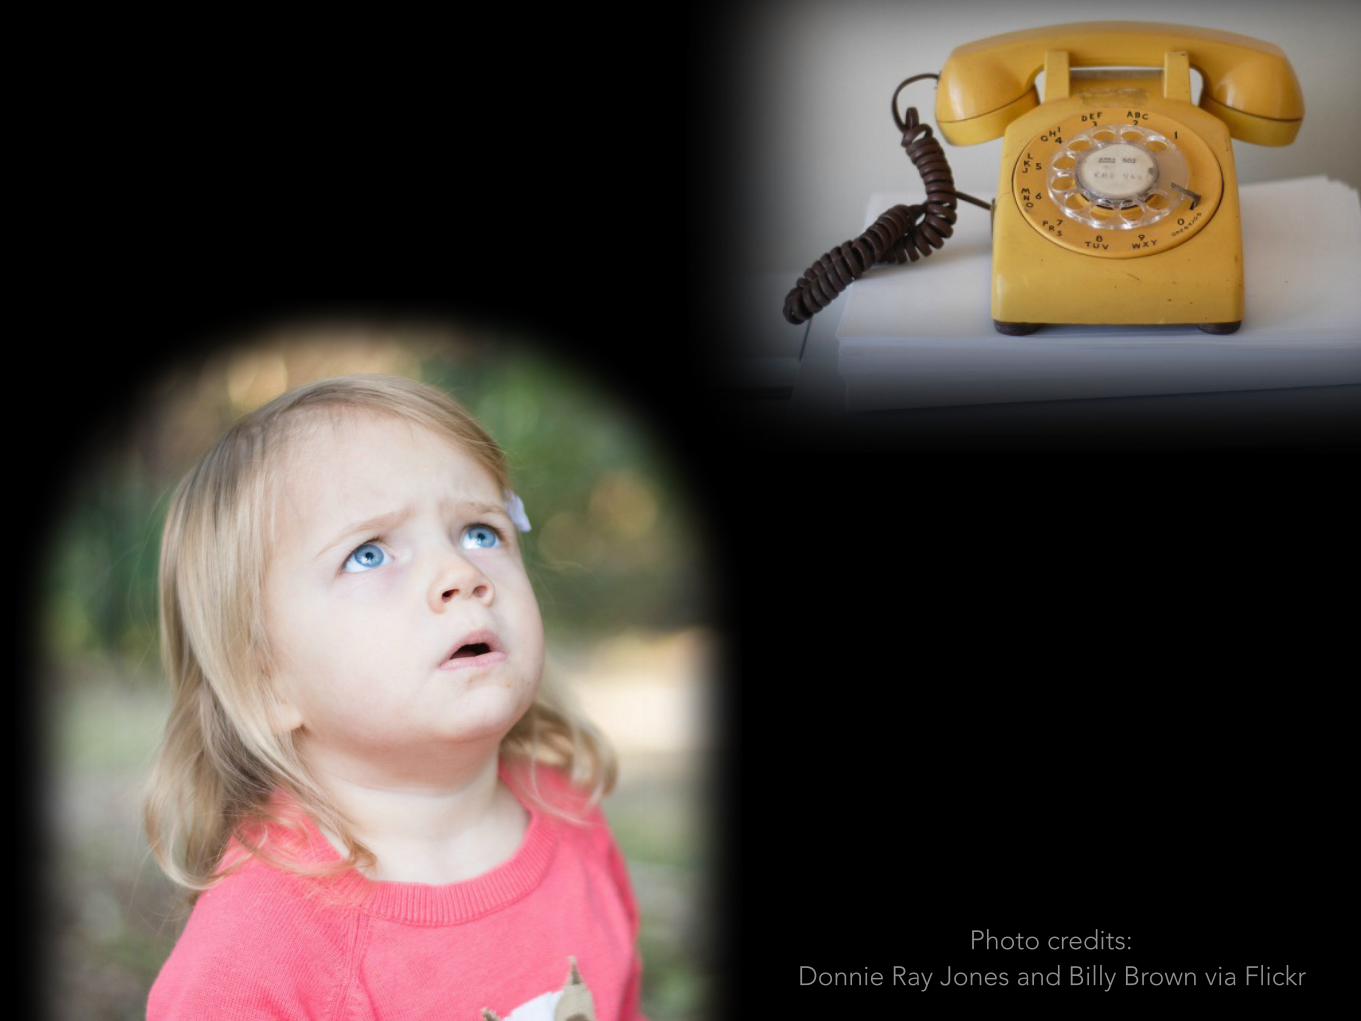
Photo credits: Donnie Ray Jones and Billy Brown via Flickr
D I S R U P T I O N

From your landline phone
company?


A B O R I N G PA S T


“There is one great advantage that must follow regulation, and
that advantage is protection"

F I R S T S TAT E O V E R S I G H T O F M O N O P O LY U T I L I T I E S ( C . 1 9 0 5 )

T H I S C O U L D TA K E A
W H I L E …

“We come to work each day to do what we did the day before”

A D I F F E R E N T E R A

S AV I N G S T H R O U G H P S Y C H O L O G Y
1,221 kWh
846 kWh
448 kWh
Efficient neighbors
All neighbors
YOU
Bill date: Jul 1 -Jul 31Great
Good
More than average
>You used 47% less than your efficient neighbors
HOW YOU’RE DOING

S AV I N G S T H R O U G H P S Y C H O L O G Y
1,221 kWh
846 kWh
448 kWh
Efficient neighbors
All neighbors
YOU
Bill date: Jul 1 -Jul 31Great
Good
More than average
>You used 47% less than your efficient neighbors
HOW YOU’RE DOING
1-3% savings

D E M A N D M A N A G E M E N T

D E M A N D M A N A G E M E N T
1 utility, 330 megawatts =
When did electricity sales peak nationwide?• 2013
• 2010
• 2007
• 2005
• earlier

3.2
3.3
3.4
3.5
3.6
3.7
3.8
2000 2001 2002 2003 2004 2005 2006 2007 2008 2009 2010 2011 2012 2013 2014
P E A K
S TA G N A N T R E TA I L S A L E S
trillion kilowatt-hours

What is the last year fossil fuel provided > 60% of new power plant capacity?
• 2013
• 2010
• 2007
• 2005
• earlier

Perc
ent o
f new
cap
acity
0%
20%
40%
60%
80%
100%
Fossil fuel Renewable
Gig
awat
ts a
dd
ed (w
hite
line
)
0
10
20
30
40
50
2003 2005 2007 2009 2011 2013 2015Q2
R I S I N G R E N E W A B L E E N E R G Y S H A R E
June 10, 2015
of new power plant capacity

Perc
ent o
f new
cap
acity
0%
20%
40%
60%
80%
100%
Coal Gas Wind Small Solar Big Solar
U . S . P O W E R P L A N T C A PA C I T Y A D D I T I O N S(annual megawatts, AC)
Sources: EIA and SEIA
Gig
awat
ts a
dd
ed (w
hite
line
)
0
10
20
30
40
50
2003 2004 2005 2006 2007 2008 2009 2010 2011 2012 2013 2014 2015 2016Q1

C O S T P R E S S U R E S
Lower wholesale prices mean utilities with excess generation sell for less

N O W M O V I N G FA S T
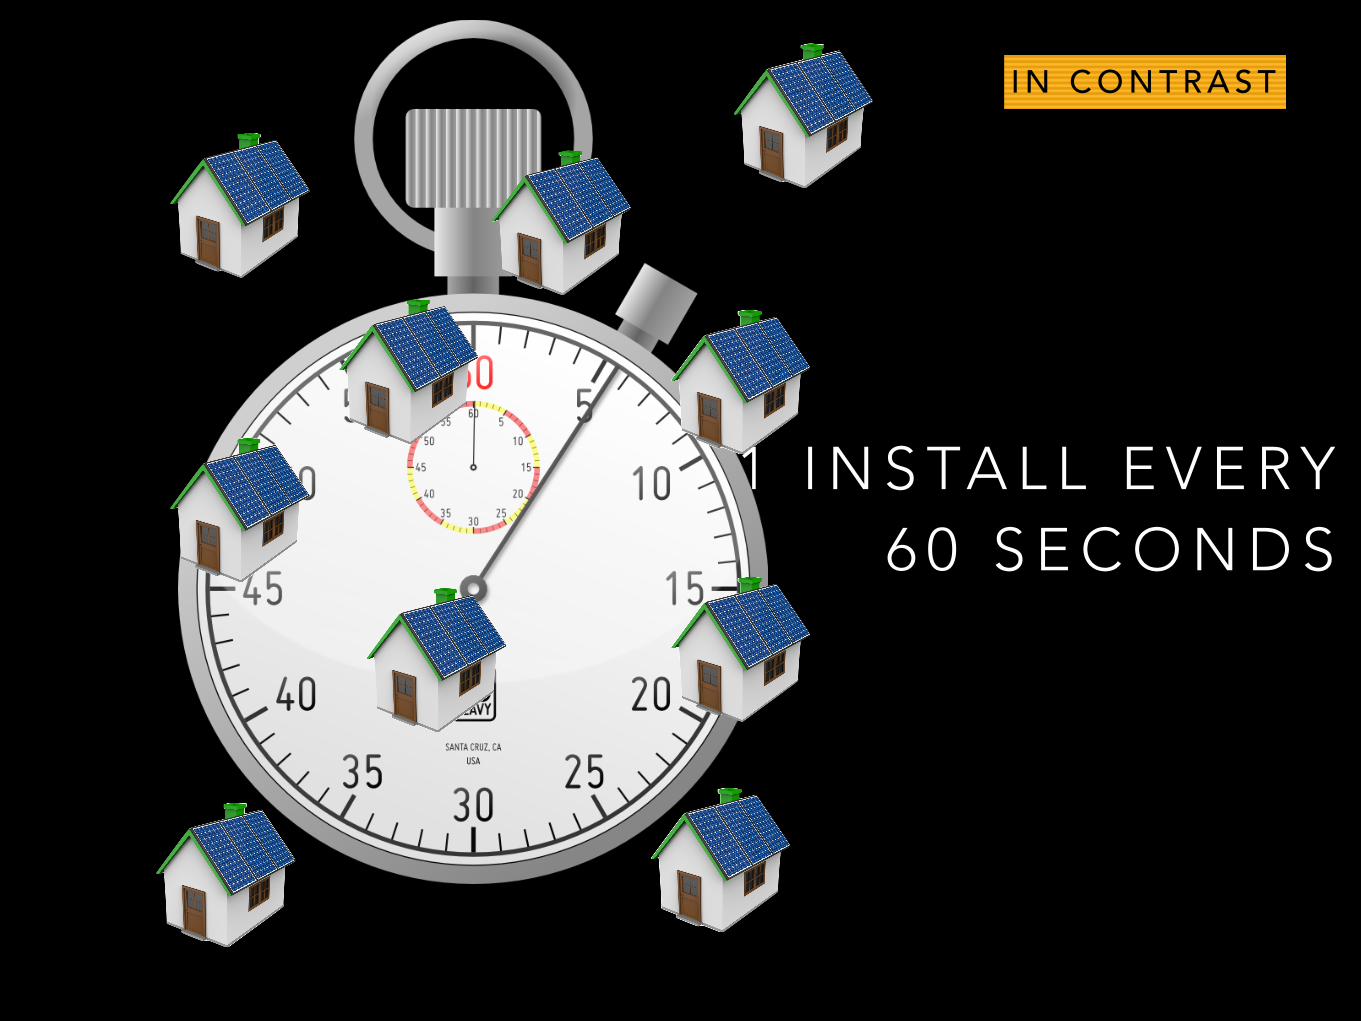
1 I N S TA L L E V E R Y 6 0 S E C O N D S
I N C O N T R A S T

0
7,500
15,000
22,500
30,000
$0.00
$2.50
$5.00
$7.50
$10.00
2000 2002 2004 2006 2008 2010 2012 2014
Weighted Avg. Cost ($/W)
Cumulative Capacity (MW)
SOLAR INSTALLS DRIVE RAPID PRICE DECLINE

B AT T E R I E S E V E R Y W H E R E
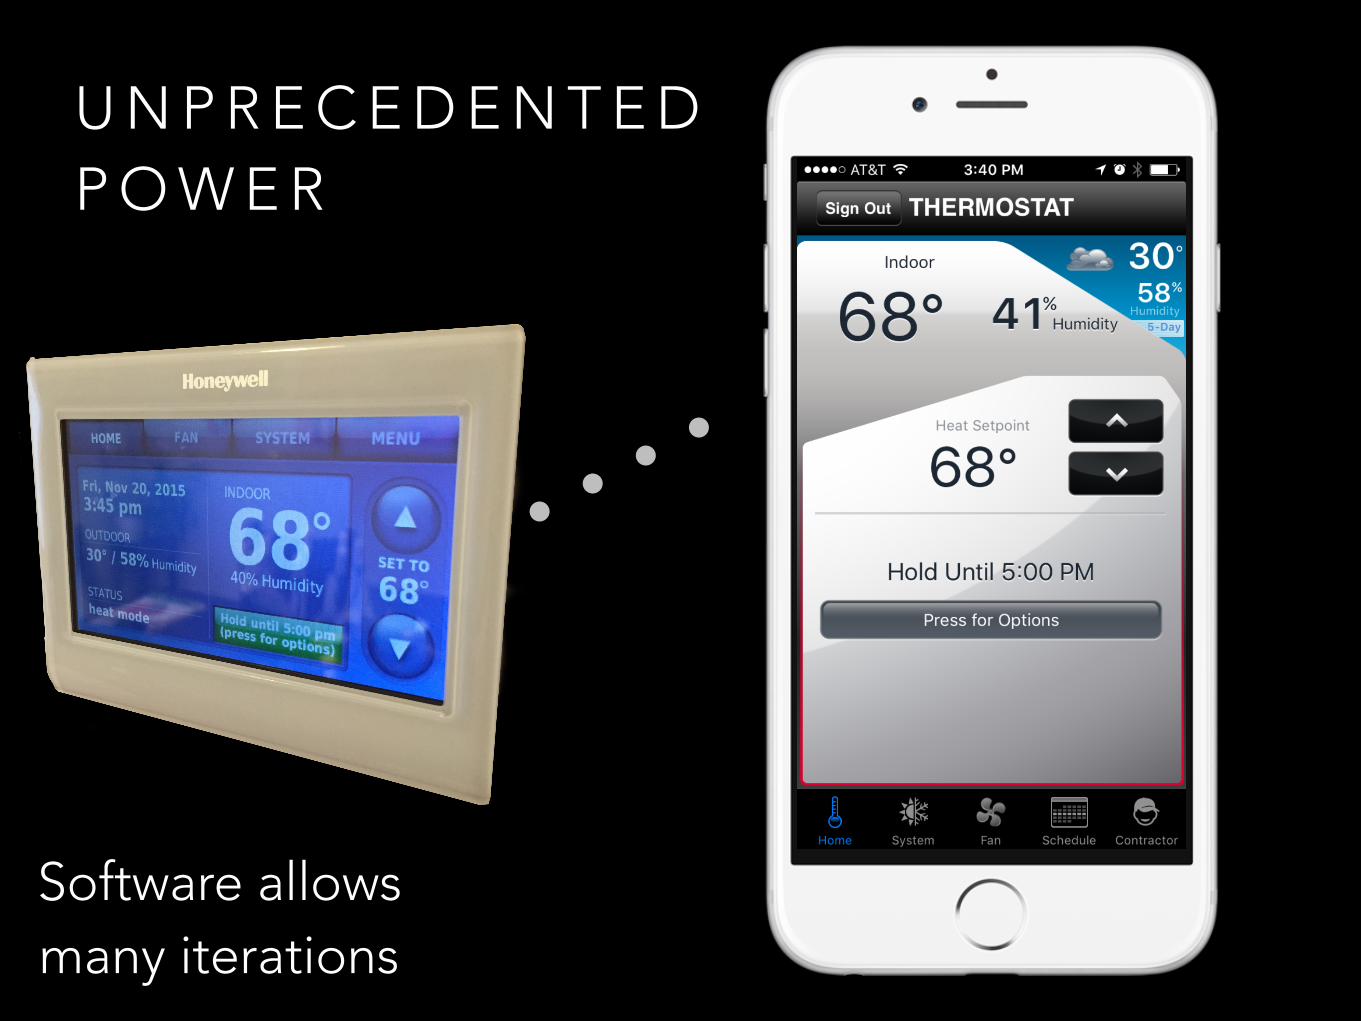
U N P R E C E D E N T E D P O W E R
Software allows many iterations

2007 2008 2011 2012 2013 2013 2014 20142009 2010

A W H O L E N E W W O R L D

Minster POPULATION 2,806

P E R C E N T O F H O U S E H O L D S W I T H
S O L A R
15%


In 20 years…

R . I . P.

U N P R E C E D E N T E D O P P O R T U N I T Y

$ 3 6 0 B I L L I O N

23%
49%
All buildings Source: http://www.nrel.gov/docs/fy16osti/65298.pdf
R O O F T O P S O L A R P O T E N T I A L 2 0 1 6
POTENTIAL PERCENT OF POWER FROM LOCAL
ROOFTOP SOLAROver 50% 40 to 50% 25 to 40% 11 to 25%
2008 data
40-50%25-40%
Over 50%
Over 50%
25-40%
40%
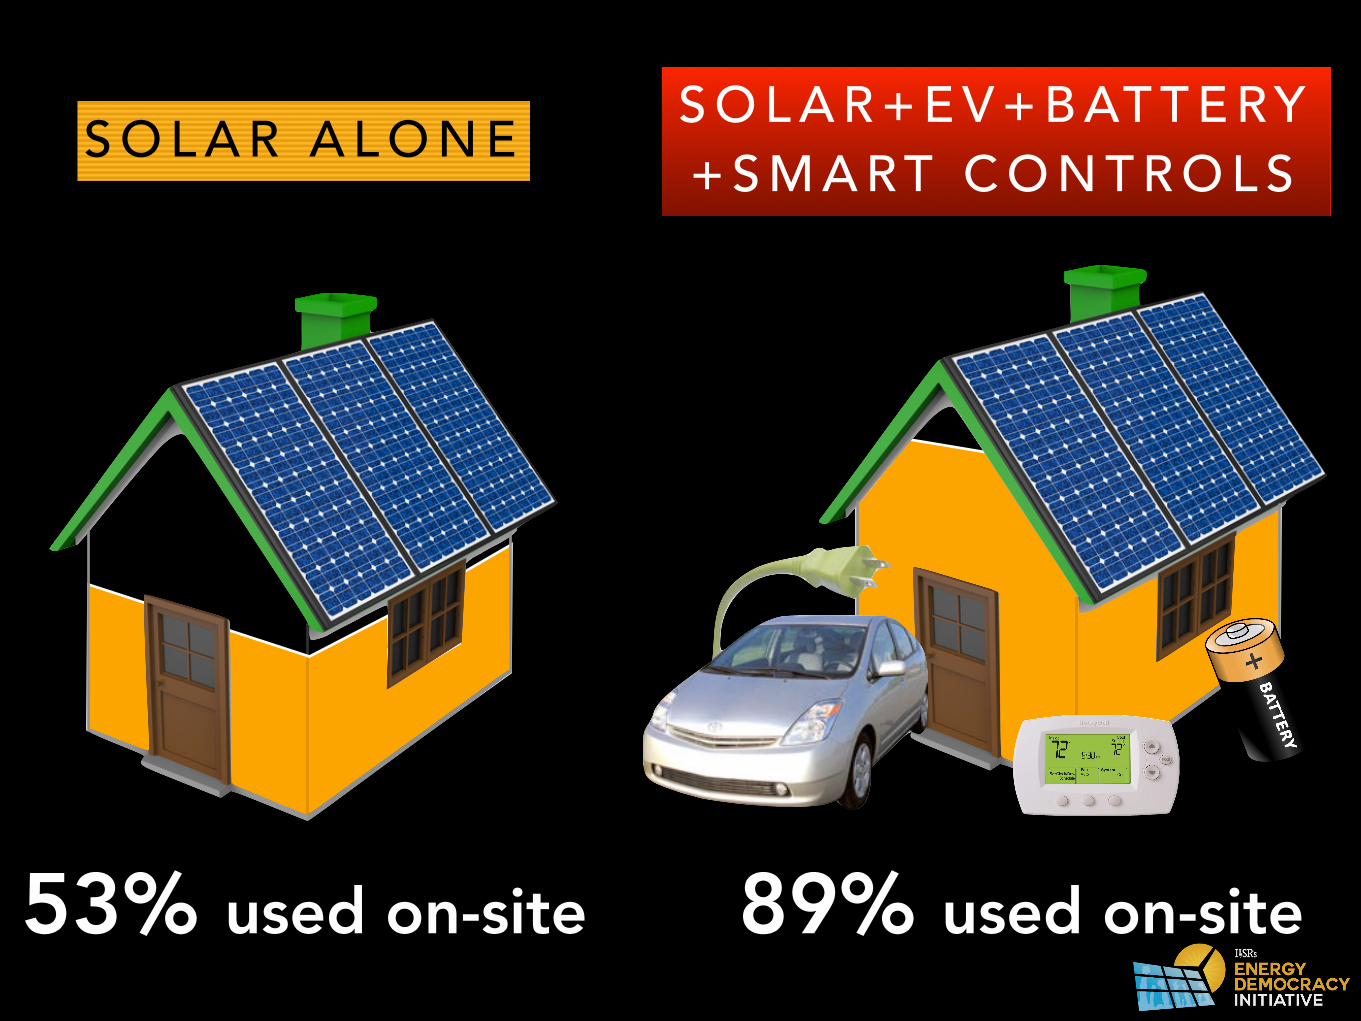
53% used on-site
S O L A R A L O N E S O L A R + E V + B AT T E R Y + S M A R T C O N T R O L S
89% used on-site
B I G B E N E F I T S

R E N E WA B L E B E N E F I T S
0
3
6
9
12
15
Jan-2002 Jan-2004 Jan-2006 Jan-2008 Jan-2010 Jan-2012 Jan-2014
Natural Gas Price
Wind and Sun Price

D I S T R I B U T E D B E N E F I T S
Solar on Littlestown Hospital
D I S P E R S I N G 1 - M W S O L A R P L A N T S R E D U C E S I N T E G R AT I O N C O S T S
0
1
2
3
4
1 solar project 5 solar projects 25 solar projects
0.3¢
1.1¢
3.9¢
cents per kilowatt-hour
Credit: USDA

L O C A L E C O N O M I C B E N E F I T S
1 megawatt
$2.5 million
20 jobs
Source: ILSR, 2014
$5.4 million in energy savings

How Green Energy Farmers busted the barriers:
Formed several, unrelated LLCs with only Iowa owners.
State regulation Pass-through to individualsFor a limited time, the Production Tax Credit was available as a cash grant, more easily used by ordinary investors.
Sold to the utilityElectricity was sold via a power purchase agreement to the utility.
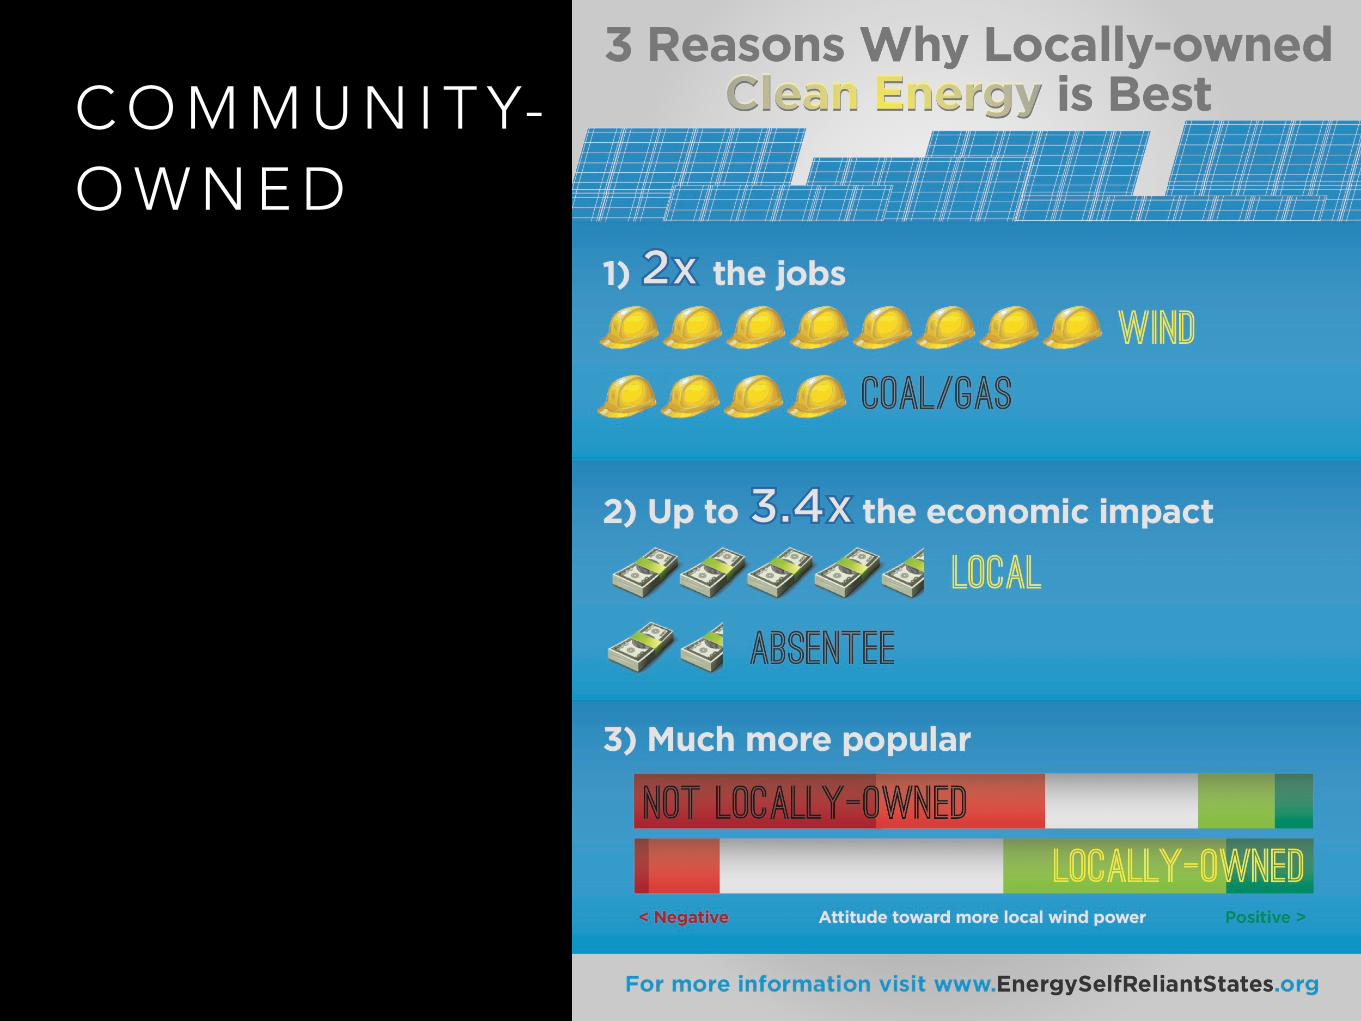
C O M M U N I T Y-O W N E D

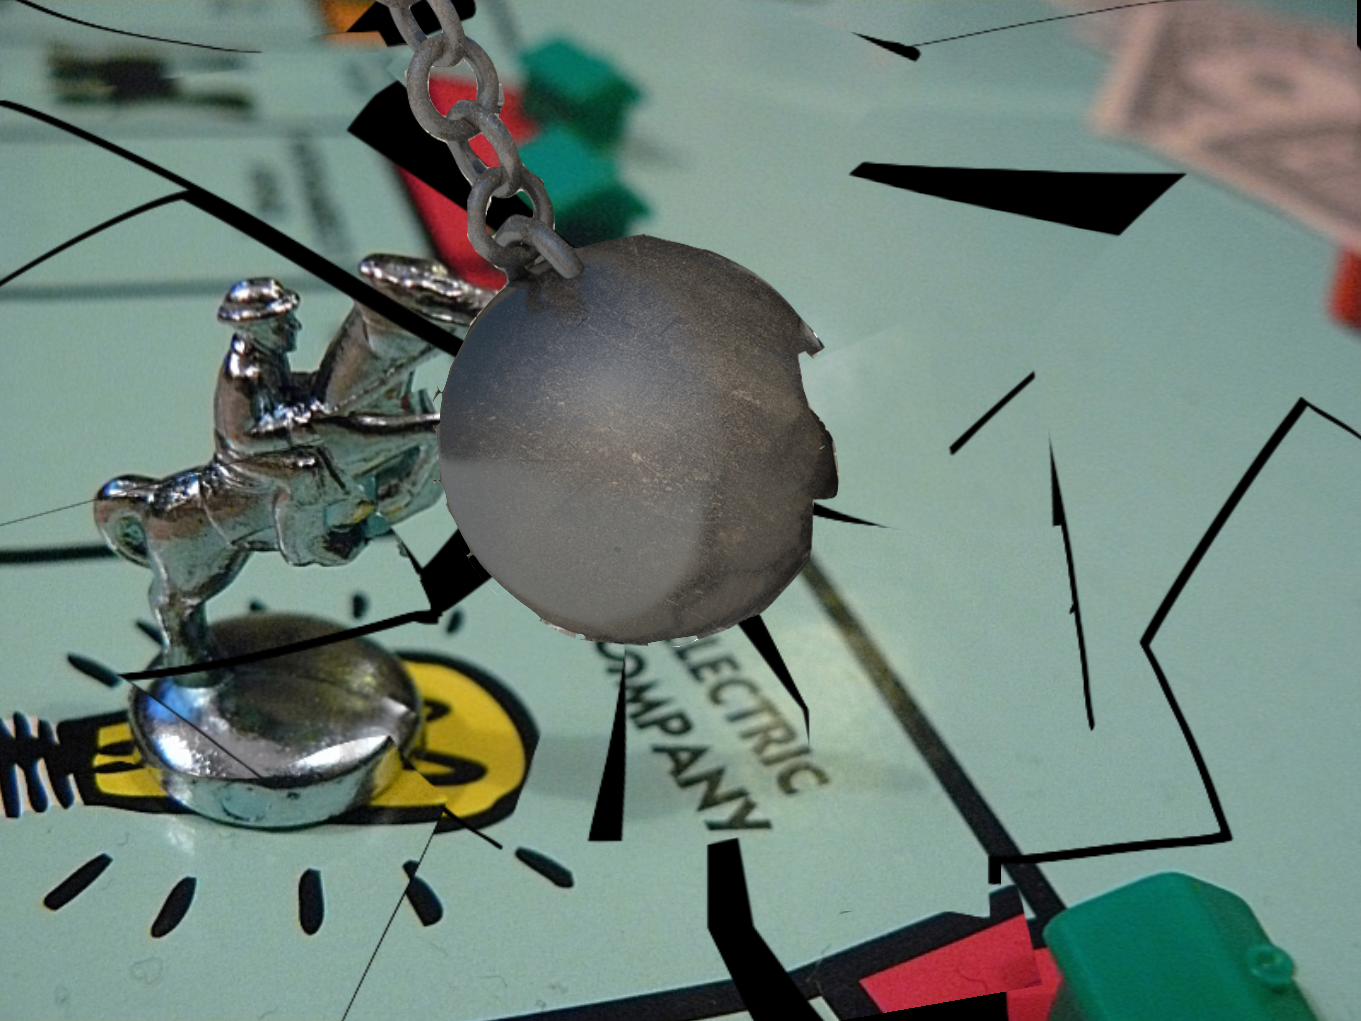
O L D R U L E S

U T I L I T Y R U L E S A R E A N T I Q U E

A Q U E S T I O N
What are some rules we’ve already adopted?
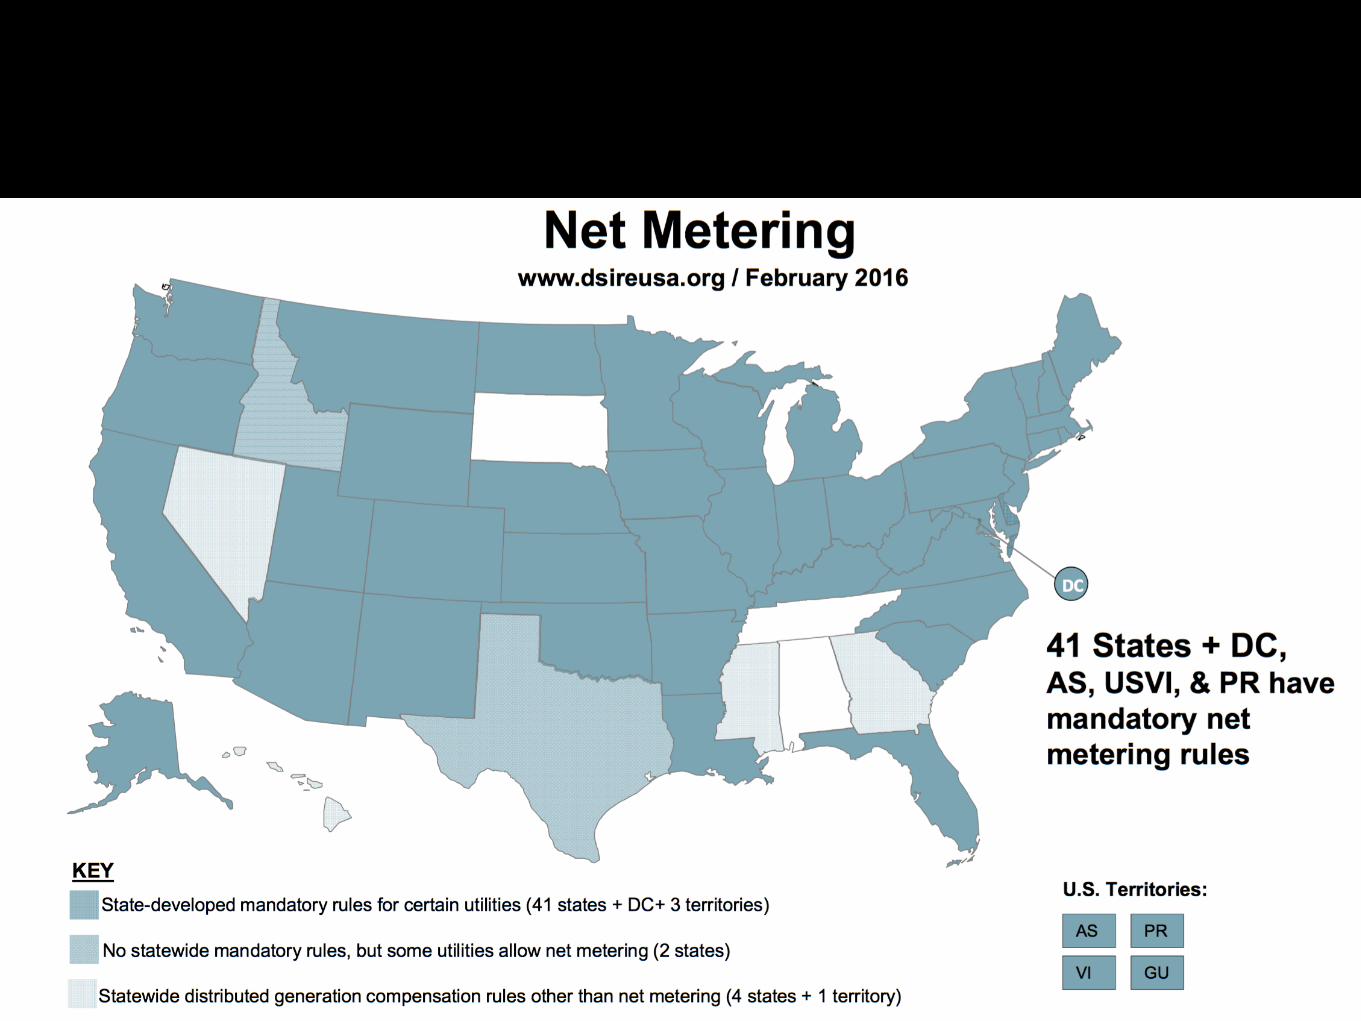


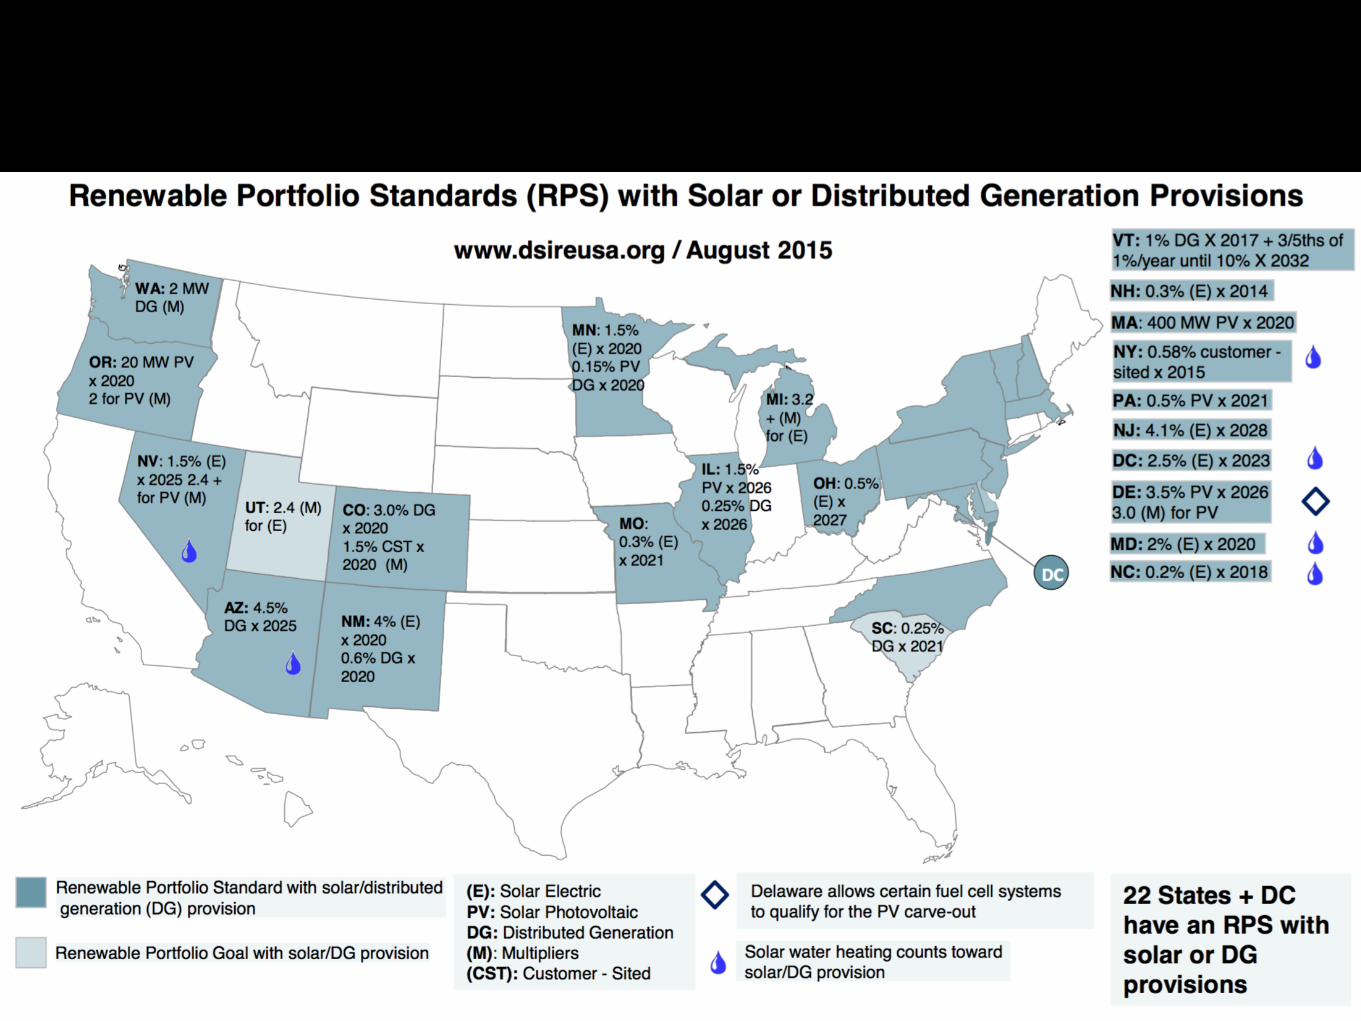
Timeline of State Renewable Energy Standards
1983 1991 19991998199719961994
NE
NJ
TX
NV
NM WACADE
CT
MT
DCMD
HI
MN
MN
WIIA
IA
VT
PA
YEAR UPDATED
Sources: C2ES, DSIRE
YEAR ADOPTED
2000 2001 2002 20062005
OR
NC
NH
AZ MN
NV
NY
RI
CO
NM NJ
(30 total)
2003 20102004 200920082007
MA MI
MO
OH
IL
KS
WI
CT
PANM
NVMNCT
DE
CA
AZ
TXNVCO
CTCOCA
WINJHICT
NJ
TXPANMNJMNMEMD
MDMADEDC
NVMNMEILHIDC
DECO
RIOR NY
NJMD


Timeline of State Energy Efficiency Standards
1999 2000 20082007200620052004
CA
CO
CT
HI
IL
MD
MI
MN
NV
NM
NY
OH*NC
PA
PA
RITX
TX
VT
WA
YEAR UPDATED
Source: ACEEE, 2014, http://bit.ly/eers-timeline
YEAR ADOPTED
2009 2010 2011 201420132012
IA
ME
MA
OR
CA
HI
NV
AZ
AR WI
CT
NM
(25 total)
* “paused” in 2013

N E W R U L E S

E N E R G Y D E M O C R A C Y I N A C T I O N
GRID AS COMMONS
= super efficient buildings
A solution that New York is
pursuing

C O N E D

T R A N S PA R E N T P R I C I N G
Day NightNight

-6%
T R A N S PA R E N T P R I C I N G
Peak energy use
PECO, 2015

The utility adds a monthly assessment to the customer’s bill to pay for energy savings improvements, with the savings greater than the monthly cost.
A utility customer signs up for better insulation, a rooftop solar array, or a share of solar on a nearby building.
1
2
M A K I N G C L E A N E N E R G Y E A S I E R T H A N A C R E D I T C A R D S W I P E
F I N A N C I N G : O N - B I L L R E PAY M E N T

H O W D O W E C H A N G E ?

2 5 % C O N T R O L T H E I R U T I L I T Y
25%
Sacramento Municipal Utility District
Farmer’s Electric Cooperative
Georgetown Utility Systems
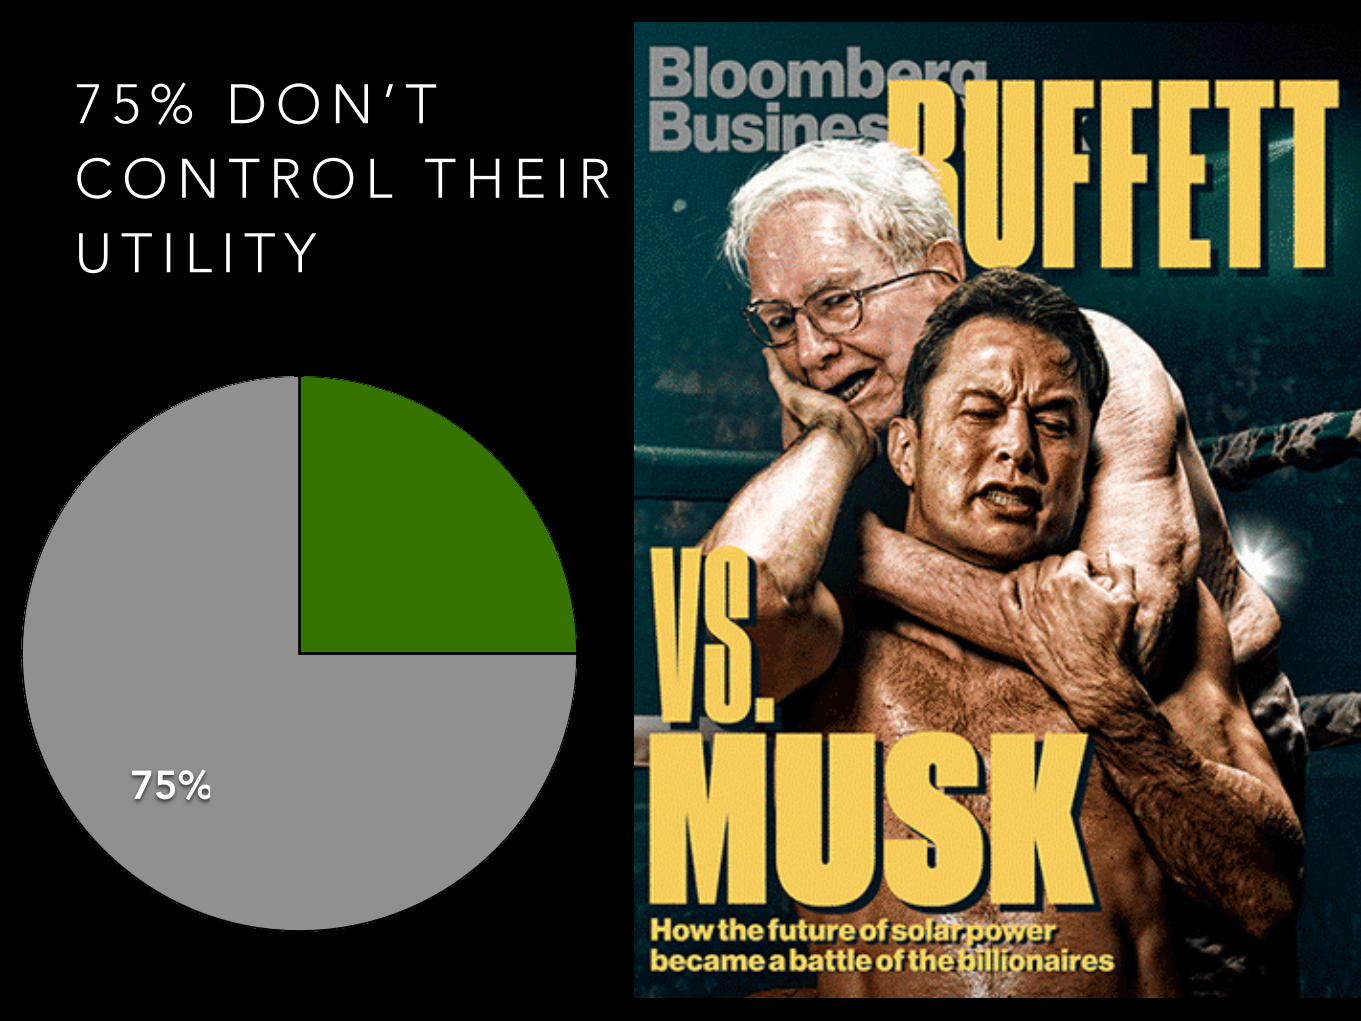
7 5 % D O N ’ T C O N T R O L T H E I R U T I L I T Y
75%

B - C O R P O R AT I O N

N E W Y O R K

T H A N K Y O U !@johnffarrell
www.ilsr.org
C H A N G I N G T H E R U L E S
P R O V I D I N G T O O L S
1 0 0 % R E N E WA B L E L O C A L E C O N O M Y
H U M A N S C A L E
L O C A L O W N E R S H I P
D E M O C R AT I C A U T H O R I T Y
I L L U S T R AT I N G T H E V I S I O N