the colorado school discipline report cardblogs.edweek.org/edweek/rulesforengagement/co... · the...
TRANSCRIPT
THE COLORADO SCHOOL DISCIPLINE REPORT CARDTHE STATE OF 179 DISTRICTS
Toward Ending the School-to-Prison Pipeline in Colorado
by Padres & Jóvenes Unidos March 2014
1
About the authors ........................................................................ 2
Introduction ................................................................................... 3
Summary of state data ................................................................ 5
Summary of district level data ................................................... 8
Conclusion ................................................................................... 14
Join us: building a statewide network .................................... 15
Report card methodology ........................................................ 16
Colorado 2012-2013 School Discipline Report Card ..............17
Comparison: Metro Denver Area Districts .............................. 29
Table of Contents
2
About the authorsRooted in the historic movement of Chicano peoples in the Southwest, Padres Unidos began organizing over two decades ago to demand school reforms to end the drop-out/push-out crisis and racial inequities in student achievement in Denver’s public schools. The lead organizers in our Ending the School to Jail Track campaign in Colorado are Ricardo Martinez, Co-Executive Director and Daniel Kim, Director of Youth Organizing.
Through a network of chapters at local public schools, our organizers work with students and parents to identify problems, their impacts and root causes, and to resolve them by conducting primary research, analyzing data and policies,
and organizing grassroots campaigns that win concrete changes to institutional policies and practices. It is very important that we won this law as it has really pushed the state to move in the right direction. But this work is just beginning.
Having identified racially discriminatory “zero tolerance” school discipline as one of the most important factors alienating and pushing out youth of color from school, Jóvenes Unidos, the youth initiative of Padres Unidos, has taken the lead in the organization’s signature campaign to end the school-to-prison pipeline by eliminating racial discrimination in school discipline and by limiting the role of police in schools.
A founder and leader in the national movement to end the school-to-prison pipeline
2003-2005 Exposing the school-to-prison pipeline in Denver. With the Advancement Project, researched and released the report, Education on Lockdown: The Schoolhouse to Jailhouse Track (2005).
2005Implementing restorative justice in Denver schools. Worked with Denver Public Schools (DPS) to secure funding to pilot Restorative Justice programs at 6 schools. Since then, 17 DPS schools have implemented restorative justice programs.
2006-2008 Rewriting Denver’s school discipline policy into one of the most progressive in the country (Policy JK / JK-R).
2010-2012 Passing the Colorado Smart School Discipline Law, one of the first and most comprehensive state bills to reform school discipline.
2011-2013 Forging a landmark police Intergovernmental Agreement (IGA) between DPS and the Denver Police Department to restrict the role of police in school discipline and promote restorative justice.
AcknowledgementsResearch, writing, editing: Jim Freeman Graphic design: Burt Vera Cruz
Padres & Jóvenes UnidosParents & Youth United
www.padresunidos.org
Our thanks and appreciation to the Advancement Project, our partner in this work from the beginning.
3
IntroductionEnding the school-to-prison pipeline in Colorado
For many years, the overuse of harsh school disciplinary measures such as out-of-school suspensions, expulsions, police tickets, and school-based arrests has caused severe harm to Colorado’s students, families, schools, and communities. Tens of thousands of mostly Black, Latino, and Native American students have been needlessly pushed out of school and/or sent into the juvenile justice system by these misguided and ineffective practices.
In addition, this “zero-tolerance” approach has caused particular harm to students with disabilities, undocumented students, and LGBTQ youth. At the same time, it has undermined school success, failed to promote school safety, and been enormously costly to taxpayers across the state.
In response, Padres & Jóvenes Unidos and its allies launched a campaign in 2010 to address the use of harsh and discriminatory school discipline and move toward ending the school-to-prison pipeline in Colorado. It culminated with the 2012 passage of the Smart School Discipline Law (SSDL), which was passed by the state legislature with broad bipartisan support and is arguably the preeminent example of comprehensive school discipline legislation in the country.
Key elements of the Smart School Discipline Law (2012)
1. The SSDL recognizes that “the use of inflexible ‘zero tolerance’ policies as a means of addressing disciplinary policies in schools has resulted in unnecessary expulsions, out-of-school suspensions, and referrals to law
enforcement agencies,” and declared that the “involvement of students in the criminal or juvenile justice systems should be avoided when addressing minor misbehavior that is typical for a student based on his or her developmental stage.”
2. The SSDL required every school district in Colorado to implement “proportionate” discipline that reduces the number of out-of-school suspensions, expulsions, and referrals to law enforcement.
3. Districts were also required to implement prevention strategies, restorative justice, peer mediation, counseling, and other approaches designed to minimize student exposure to the juvenile and criminal justice system.
4. The SSDL substantially improved the collection of data around school-based arrests, tickets, and court referrals.
5. It enhanced and prioritized the training of school-based police officers on appropriate approaches to discipline with students of color, LGBTQ students and students with disabilities.
Undeniable progress but the job is not done
The passage of the Smart School Discipline Law was a critical step in addressing Colorado’s “school-to-prison pipeline.” Indeed, our analysis of school discipline data for 2012-13, the first full year of the law’s implementation, indicates a number of promising developments. In particular, many districts are issuing far fewer out-of-school suspensions, expulsions, and referrals to law enforcement, leading to reductions statewide, and in some cases, significant reductions. Importantly, these improvements are, in most cases, benefitting all racial subgroups. This is undeniably encouraging progress for which the law’s supporters should be proud.
Nevertheless, our analysis has also uncovered some significant areas of concern in how the law is
4
being implemented. In particular, the data indicates that meaningful reform still has not reached many districts, schools, and students within the state. For example, many districts have continued to refer students to law enforcement at high rates; in fact, Black and Native American students were referred more frequently statewide than they were before the passage of the Smart School Discipline Law.
Additionally, while some racial inequities in the application of school discipline were reduced, others were widened. And there continues to be huge variability in the practices used statewide, such that some districts mete out hundreds of expulsions and referrals to law enforcement every year, while many others never employ such tactics. Thus, unfortunately, Colorado students’ educational opportunities continue to hinge in significant part on where they live, and far too many students are still suffering the consequences of extreme disciplinary practices.
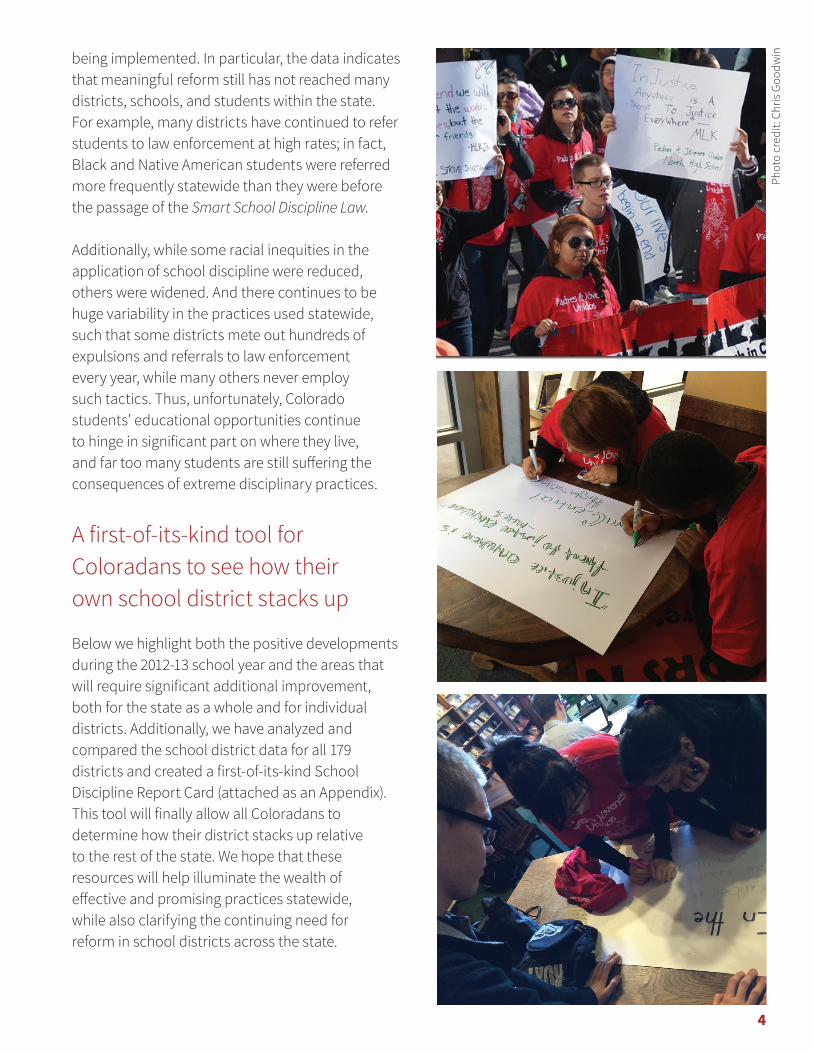
A first-of-its-kind tool for Coloradans to see how their own school district stacks up
Below we highlight both the positive developments during the 2012-13 school year and the areas that will require significant additional improvement, both for the state as a whole and for individual districts. Additionally, we have analyzed and compared the school district data for all 179 districts and created a first-of-its-kind School Discipline Report Card (attached as an Appendix). This tool will finally allow all Coloradans to determine how their district stacks up relative to the rest of the state. We hope that these resources will help illuminate the wealth of effective and promising practices statewide, while also clarifying the continuing need for reform in school districts across the state.
Phot
o cr
edit:
Chr
is G
oodw
in
5
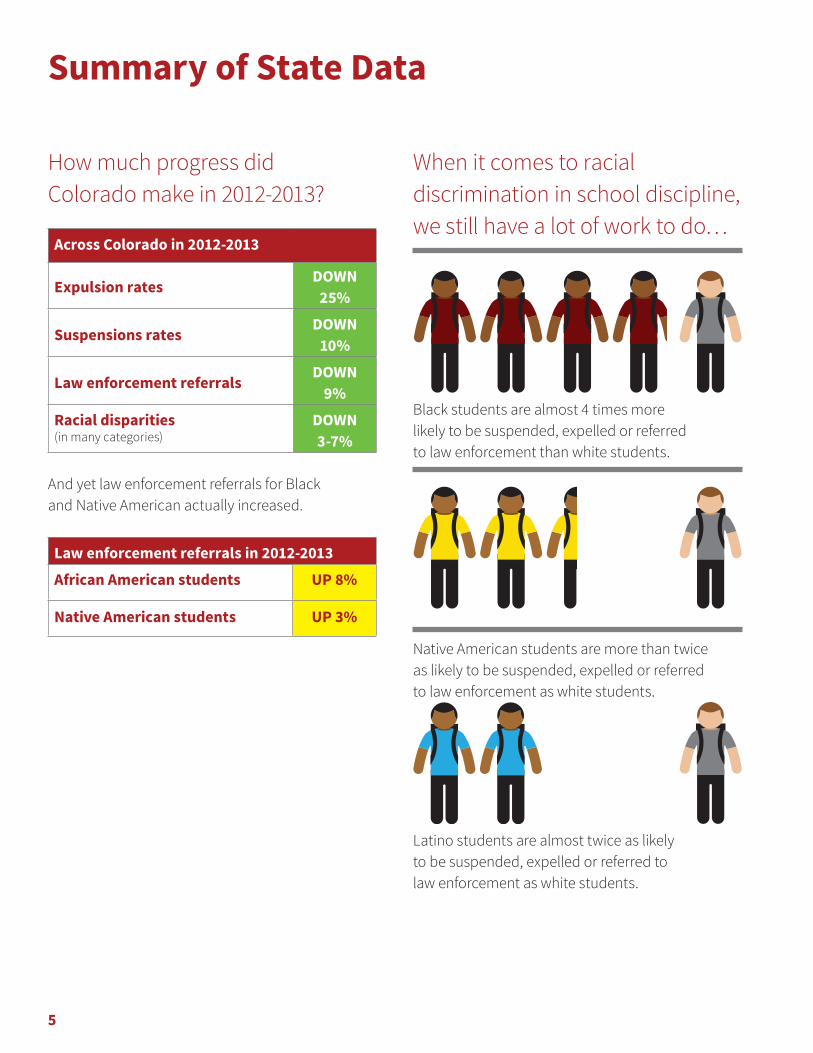
How much progress did Colorado make in 2012-2013?
Across Colorado in 2012-2013
Expulsion ratesDOWN
25%
Suspensions ratesDOWN
10%
Law enforcement referralsDOWN
9%
Racial disparities (in many categories)
DOWN3-7%
And yet law enforcement referrals for Black and Native American actually increased.
Law enforcement referrals in 2012-2013
African American students UP 8%
Native American students UP 3%
When it comes to racial discrimination in school discipline, we still have a lot of work to do…
Black students are almost 4 times more likely to be suspended, expelled or referred to law enforcement than white students.
Native American students are more than twice as likely to be suspended, expelled or referred to law enforcement as white students.
Latino students are almost twice as likely to be suspended, expelled or referred to law enforcement as white students.
Summary of State Data
6
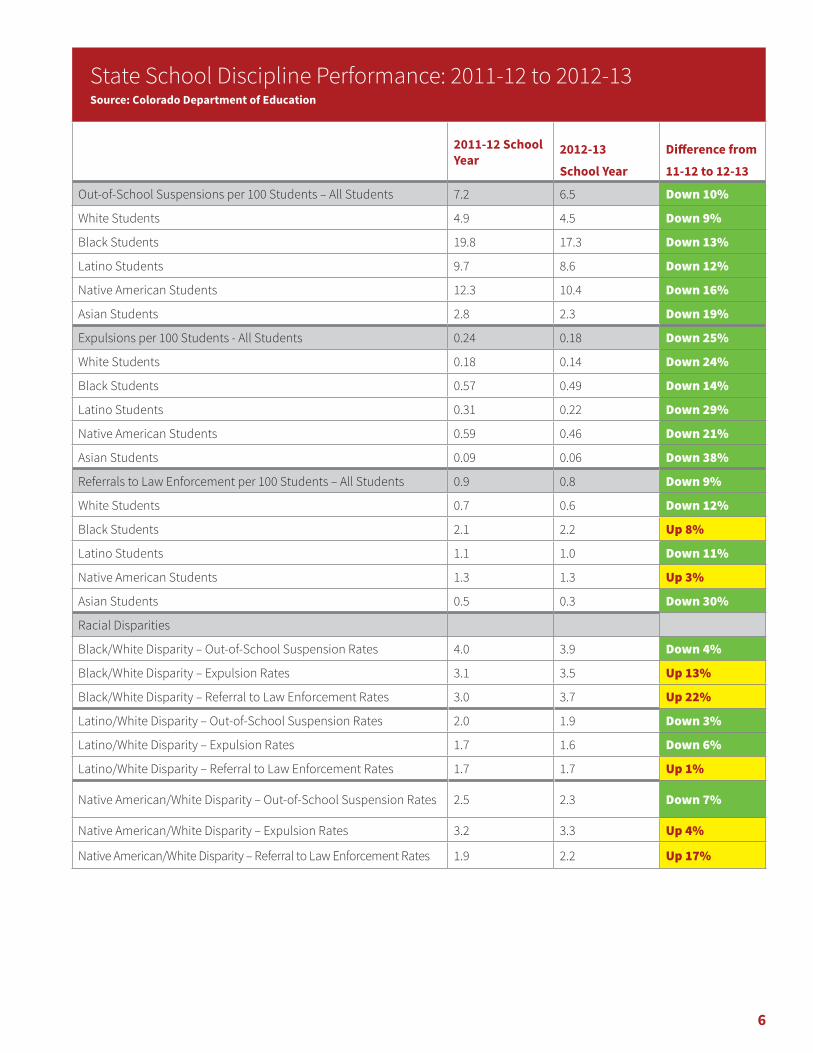
State School Discipline Performance: 2011-12 to 2012-13Source: Colorado Department of Education
2011-12 School Year
2012-13 School Year
Difference from 11-12 to 12-13
Out-of-School Suspensions per 100 Students – All Students 7.2 6.5 Down 10%
White Students 4.9 4.5 Down 9%
Black Students 19.8 17.3 Down 13%
Latino Students 9.7 8.6 Down 12%
Native American Students 12.3 10.4 Down 16%
Asian Students 2.8 2.3 Down 19%
Expulsions per 100 Students - All Students 0.24 0.18 Down 25%
White Students 0.18 0.14 Down 24%
Black Students 0.57 0.49 Down 14%
Latino Students 0.31 0.22 Down 29%
Native American Students 0.59 0.46 Down 21%
Asian Students 0.09 0.06 Down 38%
Referrals to Law Enforcement per 100 Students – All Students 0.9 0.8 Down 9%
White Students 0.7 0.6 Down 12%
Black Students 2.1 2.2 Up 8%
Latino Students 1.1 1.0 Down 11%
Native American Students 1.3 1.3 Up 3%
Asian Students 0.5 0.3 Down 30%
Racial Disparities
Black/White Disparity – Out-of-School Suspension Rates 4.0 3.9 Down 4%
Black/White Disparity – Expulsion Rates 3.1 3.5 Up 13%
Black/White Disparity – Referral to Law Enforcement Rates 3.0 3.7 Up 22%
Latino/White Disparity – Out-of-School Suspension Rates 2.0 1.9 Down 3%
Latino/White Disparity – Expulsion Rates 1.7 1.6 Down 6%
Latino/White Disparity – Referral to Law Enforcement Rates 1.7 1.7 Up 1%
Native American/White Disparity – Out-of-School Suspension Rates 2.5 2.3 Down 7%
Native American/White Disparity – Expulsion Rates 3.2 3.3 Up 4%
Native American/White Disparity – Referral to Law Enforcement Rates 1.9 2.2 Up 17%
7
At the state level, there have been both promising signs of progress and areas of continuing – and even increasing – concern.
Signs of progress ▶ Out-of-school suspension, expulsion, and
referral to law enforcement rates all decreased, with the expulsion rate experiencing the biggest drop of 25%.
▶ There was a decrease in the out-of-school suspension, expulsion, and referral to law enforcement rates of most racial subgroups.
▶ There were some modest improvements in racial disparities, particularly for out-of-school suspension rates.
Areas of concern, racial disparities persistIn spite of this noteworthy progress, there were other developments that either fell short of expectations or indicated regression. For example:
▶ The referral of Black and Native American students to law enforcement actually increased.
▶ Far more progress is needed with regard to harsh discipline of students of color for Colorado to have a truly equitable discipline system. Indeed, in some cases, disparities widened in 2012-13.
▷ Some of these dynamics have been worsening across the state for years. For example, the Black/White disparity for referrals to law enforcement is now 45% worse than it was five years ago, and the Native American/White disparity for referrals to law enforcement is 27% worse.
▷ Black students are now 3.7 times more likely to be referred to law enforcement than White students and 3.5 times more likely to be expelled. Native American students are 2.2 times more likely than White students to be referred to law enforcement and 3.3 times more likely to be expelled. And even despite some improvement over the last
year, Latino students are still almost twice as likely to be suspended out-of-school, expelled, and referred to law enforcement as their White peers.
▶ The 9% drop in referrals to law enforcement and the 10% drop in out-of-school suspensions fell well short of what is necessary to ensure these harsh consequences are being used appropriately statewide.
Overall, at the state level, Coloradans should be encouraged that the Smart School Discipline Law has helped to create progress that is benefitting students, families, and communities across the state. And, given that 2012-13 represented only the first full school year following the passage of the law, the available data inspires hope that additional improvements will be evident in future years.
Nevertheless, it is unacceptable that, in some cases, the gains being made are not benefitting students of color who have been most affected by harsh and inequitable disciplinary measures in the past. Going forward, there is an urgent need to place particular emphasis on improvements with regard to students of color, particularly with regard to the most severe disciplinary consequences, such as referrals to law enforcement.
8
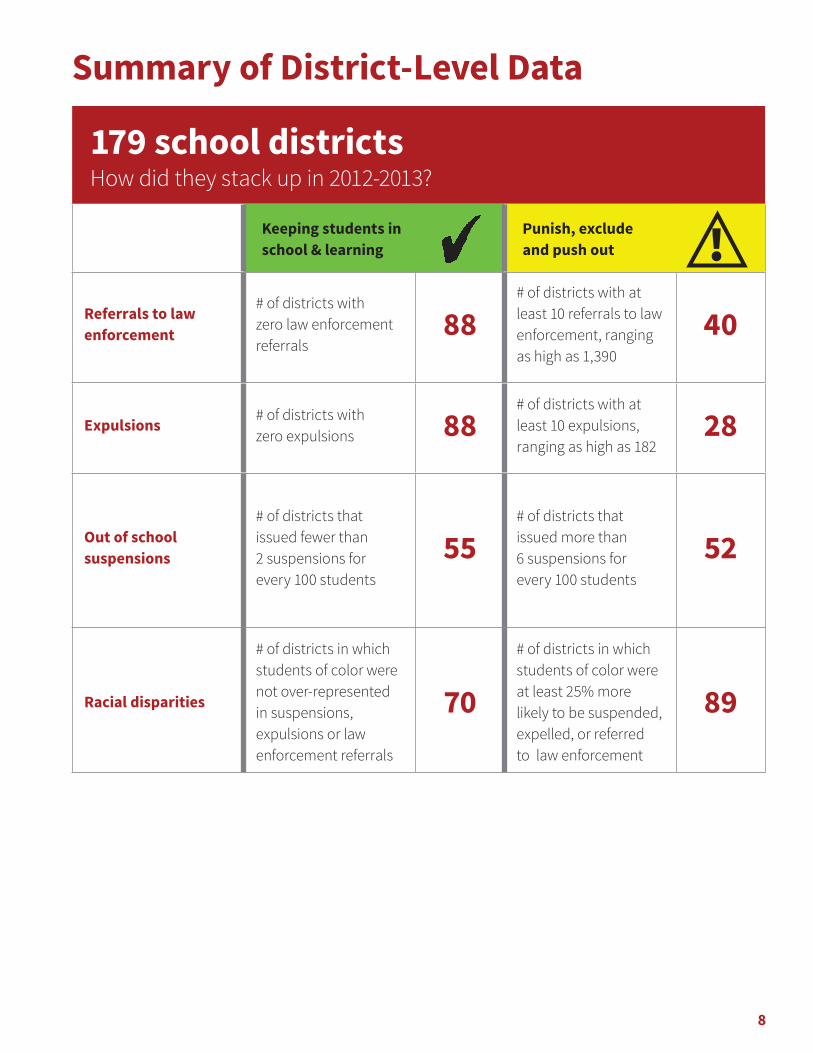
Summary of District-Level Data
179 school districts How did they stack up in 2012-2013?
Keeping students in school & learning
Punish, exclude and push out
Referrals to law enforcement
# of districts with zero law enforcement referrals
88# of districts with at least 10 referrals to law enforcement, ranging as high as 1,390
40
Expulsions# of districts with zero expulsions 88
# of districts with at least 10 expulsions, ranging as high as 182
28
Out of school suspensions
# of districts that issued fewer than 2 suspensions for every 100 students
55# of districts that issued more than 6 suspensions for every 100 students
52
Racial disparities
# of districts in which students of color were not over-represented in suspensions, expulsions or law enforcement referrals
70
# of districts in which students of color were at least 25% more likely to be suspended, expelled, or referred to law enforcement
89
9
Key District-Level FindingsIn examining the school discipline data for each of the 179 districts within the state,1 the most significant overarching findings are the following:
▶ There has been improvement in many districts around the state, and in some cases strong improvement.
▶ Many other districts have failed to improve and have even increased their use of out-of-school suspensions, expulsions, and referrals to law enforcement.
▶ There is huge variability across districts in their use of out-of-school suspensions, expulsions, and referrals to law enforcement.
▶ While many districts have significant racial disparities within their use of these disciplinary measures, a large number of other districts have been able to implement them more equitably.
What follows is more detailed information about out-of-school suspensions, expulsions, referrals to law enforcement, and racial disparities within these measures.
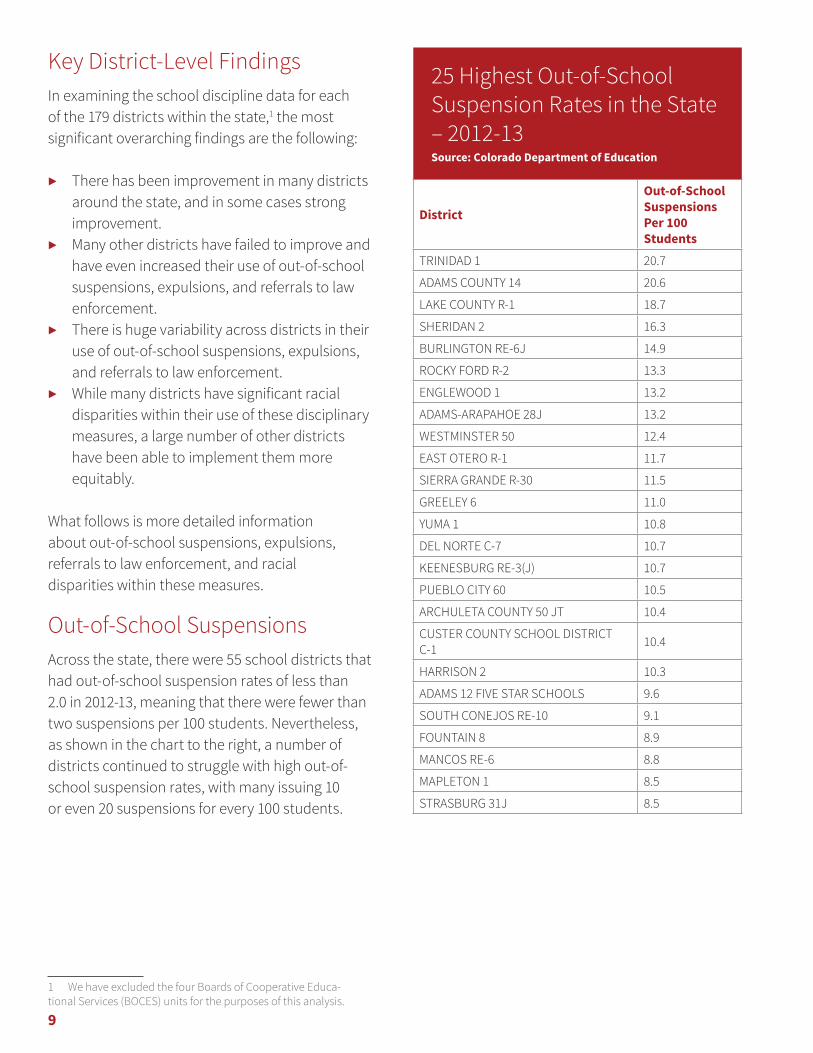
Out-of-School SuspensionsAcross the state, there were 55 school districts that had out-of-school suspension rates of less than 2.0 in 2012-13, meaning that there were fewer than two suspensions per 100 students. Nevertheless, as shown in the chart to the right, a number of districts continued to struggle with high out-of-school suspension rates, with many issuing 10 or even 20 suspensions for every 100 students.
1 We have excluded the four Boards of Cooperative Educa-tional Services (BOCES) units for the purposes of this analysis.
25 Highest Out-of-School Suspension Rates in the State – 2012-13Source: Colorado Department of Education
District
Out-of-School Suspensions Per 100 Students
TRINIDAD 1 20.7
ADAMS COUNTY 14 20.6
LAKE COUNTY R-1 18.7
SHERIDAN 2 16.3
BURLINGTON RE-6J 14.9
ROCKY FORD R-2 13.3
ENGLEWOOD 1 13.2
ADAMS-ARAPAHOE 28J 13.2
WESTMINSTER 50 12.4
EAST OTERO R-1 11.7
SIERRA GRANDE R-30 11.5
GREELEY 6 11.0
YUMA 1 10.8
DEL NORTE C-7 10.7
KEENESBURG RE-3(J) 10.7
PUEBLO CITY 60 10.5
ARCHULETA COUNTY 50 JT 10.4
CUSTER COUNTY SCHOOL DISTRICT C-1 10.4
HARRISON 2 10.3
ADAMS 12 FIVE STAR SCHOOLS 9.6
SOUTH CONEJOS RE-10 9.1
FOUNTAIN 8 8.9
MANCOS RE-6 8.8
MAPLETON 1 8.5
STRASBURG 31J 8.5
10
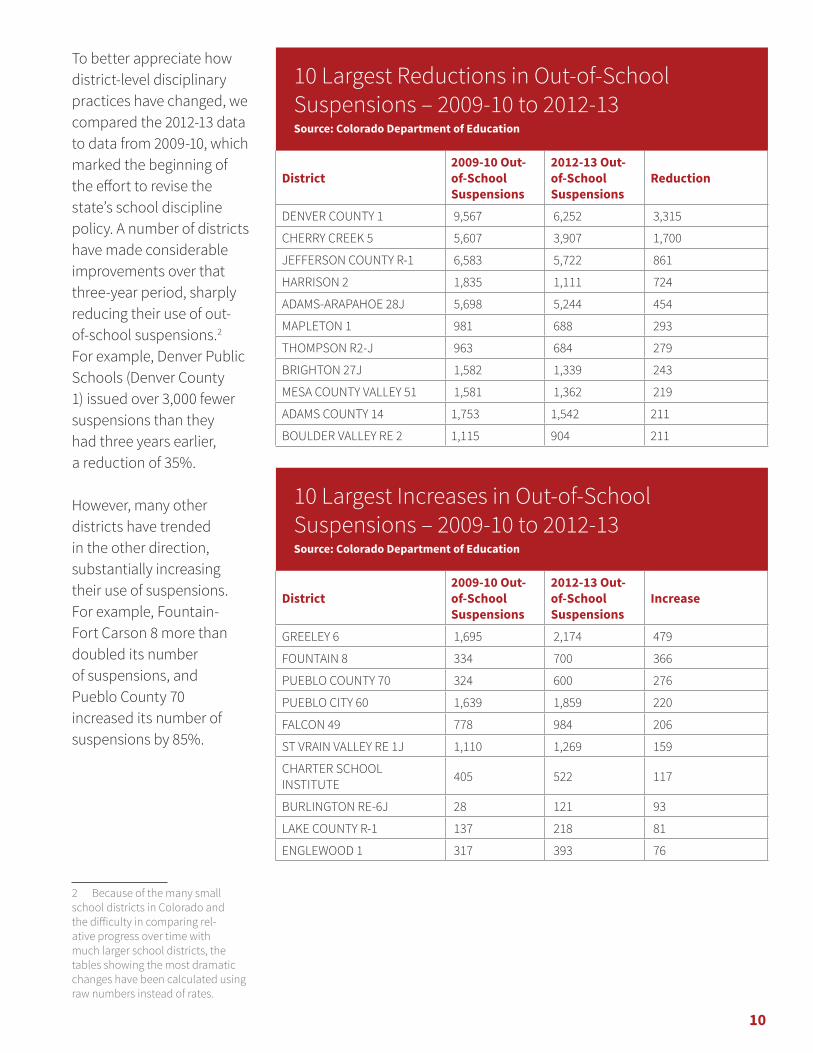
10 Largest Reductions in Out-of-School Suspensions – 2009-10 to 2012-13Source: Colorado Department of Education
District2009-10 Out-of-School Suspensions
2012-13 Out-of-School Suspensions
Reduction
DENVER COUNTY 1 9,567 6,252 3,315
CHERRY CREEK 5 5,607 3,907 1,700
JEFFERSON COUNTY R-1 6,583 5,722 861
HARRISON 2 1,835 1,111 724
ADAMS-ARAPAHOE 28J 5,698 5,244 454
MAPLETON 1 981 688 293
THOMPSON R2-J 963 684 279
BRIGHTON 27J 1,582 1,339 243
MESA COUNTY VALLEY 51 1,581 1,362 219
ADAMS COUNTY 14 1,753 1,542 211
BOULDER VALLEY RE 2 1,115 904 211
10 Largest Increases in Out-of-School Suspensions – 2009-10 to 2012-13Source: Colorado Department of Education
District2009-10 Out-of-School Suspensions
2012-13 Out-of-School Suspensions
Increase
GREELEY 6 1,695 2,174 479
FOUNTAIN 8 334 700 366
PUEBLO COUNTY 70 324 600 276
PUEBLO CITY 60 1,639 1,859 220
FALCON 49 778 984 206
ST VRAIN VALLEY RE 1J 1,110 1,269 159
CHARTER SCHOOL INSTITUTE 405 522 117
BURLINGTON RE-6J 28 121 93
LAKE COUNTY R-1 137 218 81
ENGLEWOOD 1 317 393 76
To better appreciate how district-level disciplinary practices have changed, we compared the 2012-13 data to data from 2009-10, which marked the beginning of the effort to revise the state’s school discipline policy. A number of districts have made considerable improvements over that three-year period, sharply reducing their use of out-of-school suspensions.2 For example, Denver Public Schools (Denver County 1) issued over 3,000 fewer suspensions than they had three years earlier, a reduction of 35%.
However, many other districts have trended in the other direction, substantially increasing their use of suspensions. For example, Fountain-Fort Carson 8 more than doubled its number of suspensions, and Pueblo County 70 increased its number of suspensions by 85%.
2 Because of the many small school districts in Colorado and the difficulty in comparing rel-ative progress over time with much larger school districts, the tables showing the most dramatic changes have been calculated using raw numbers instead of rates.
11
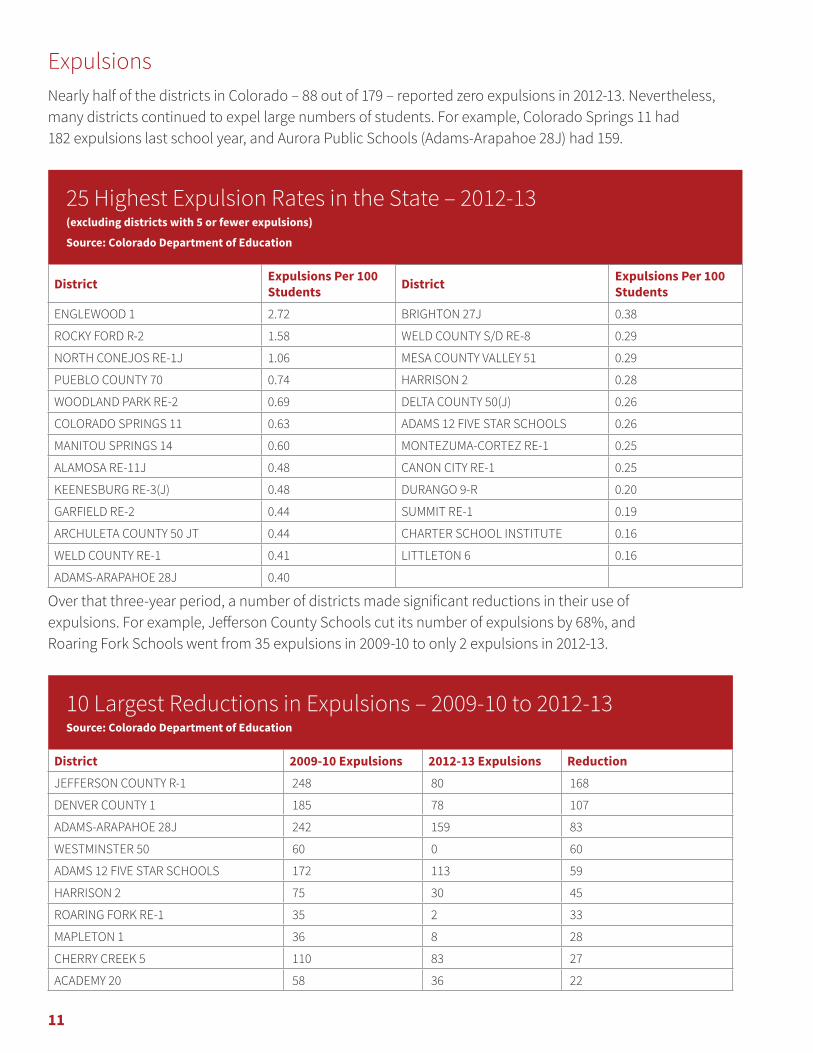
ExpulsionsNearly half of the districts in Colorado – 88 out of 179 – reported zero expulsions in 2012-13. Nevertheless, many districts continued to expel large numbers of students. For example, Colorado Springs 11 had 182 expulsions last school year, and Aurora Public Schools (Adams-Arapahoe 28J) had 159.
25 Highest Expulsion Rates in the State – 2012-13 (excluding districts with 5 or fewer expulsions)
Source: Colorado Department of Education
District Expulsions Per 100 Students District Expulsions Per 100
StudentsENGLEWOOD 1 2.72 BRIGHTON 27J 0.38
ROCKY FORD R-2 1.58 WELD COUNTY S/D RE-8 0.29
NORTH CONEJOS RE-1J 1.06 MESA COUNTY VALLEY 51 0.29
PUEBLO COUNTY 70 0.74 HARRISON 2 0.28
WOODLAND PARK RE-2 0.69 DELTA COUNTY 50(J) 0.26
COLORADO SPRINGS 11 0.63 ADAMS 12 FIVE STAR SCHOOLS 0.26
MANITOU SPRINGS 14 0.60 MONTEZUMA-CORTEZ RE-1 0.25
ALAMOSA RE-11J 0.48 CANON CITY RE-1 0.25
KEENESBURG RE-3(J) 0.48 DURANGO 9-R 0.20
GARFIELD RE-2 0.44 SUMMIT RE-1 0.19
ARCHULETA COUNTY 50 JT 0.44 CHARTER SCHOOL INSTITUTE 0.16
WELD COUNTY RE-1 0.41 LITTLETON 6 0.16
ADAMS-ARAPAHOE 28J 0.40
Over that three-year period, a number of districts made significant reductions in their use of expulsions. For example, Jefferson County Schools cut its number of expulsions by 68%, and Roaring Fork Schools went from 35 expulsions in 2009-10 to only 2 expulsions in 2012-13.
10 Largest Reductions in Expulsions – 2009-10 to 2012-13Source: Colorado Department of Education
District 2009-10 Expulsions 2012-13 Expulsions ReductionJEFFERSON COUNTY R-1 248 80 168
DENVER COUNTY 1 185 78 107
ADAMS-ARAPAHOE 28J 242 159 83
WESTMINSTER 50 60 0 60
ADAMS 12 FIVE STAR SCHOOLS 172 113 59
HARRISON 2 75 30 45
ROARING FORK RE-1 35 2 33
MAPLETON 1 36 8 28
CHERRY CREEK 5 110 83 27
ACADEMY 20 58 36 22

12
While there were a number of districts that increased their use of expulsions, only a few did so by a substantial margin. For example, Englewood Schools went from issuing 19 expulsions in 2009-10 to issuing 81 expulsions in 2012-13. Also, Colorado Springs 11 issued 65 more expulsions in 2012-13, an increase of 56%.
Referrals to Law EnforcementJust as with expulsions, 88 of the 179 districts in the state issued zero referrals to law enforcement last year. On the other hand, many other districts issued hundreds, topped by Jefferson County with 1,390 and Adams 12 Five Star with 1,172. Indeed, the use of law enforcement varies dramatically across the state. While Colorado Springs 11 had only one referral for its nearly 29,000 students, Manzanola 3J had one referral for every 16 of its students.
25 Highest Rates of Referrals to Law Enforcement – 2012-13 (excluding districts with 5 or fewer referrals)
Source: Colorado Department of Education
DistrictReferrals to Law Enforcement Per 100 Students
DistrictReferrals to Law Enforcement Per 100 Students
MANZANOLA 3J 6.1 ADAMS-ARAPAHOE 28J 1.6
ENGLEWOOD 1 3.3 CHERRY CREEK 5 1.6
LAKE COUNTY R-1 3.1 SHERIDAN 2 1.5
ADAMS 12 FIVE STAR SCHOOLS 2.7 AULT-HIGHLAND RE-9 1.4
ALAMOSA RE-11J 1.9 LITTLETON 6 1.4
GILPIN COUNTY RE-1 1.9 PUEBLO COUNTY 70 1.3
MEEKER RE1 1.9 CLEAR CREEK RE-1 1.3
CRIPPLE CREEK-VICTOR RE-1 1.9 LAMAR RE-2 1.2
ELLICOTT 22 1.9 TRINIDAD 1 1.1
ADAMS COUNTY 14 1.8 PARK COUNTY RE-2 1.0
SOUTH ROUTT RE 3 1.7 MONTEZUMA-CORTEZ RE-1 1.0
MESA COUNTY VALLEY 51 1.7 ROCKY FORD R-2 1.0
JEFFERSON COUNTY R-1 1.6
Once again, a number of districts have demonstrated significant improvements. For example, despite having the most referrals to law enforcement in the state, Jefferson County has reduced its use of such referrals by 38% in the last three years. Districts such as Poudre R-1 (52%) and Montezuma-Cortez RE-1 (78%) have made even greater reductions.
On the other hand, 44 districts referred more students to law enforcement in 2012-13 than they did three years earlier.

13
10 Largest Reductions in Referrals to Law Enforcement – 2009-10 to 2012-13Source: Colorado Department of Education
District Referrals of 2009-10 Referrals of 2012-13 Reduction
JEFFERSON COUNTY R-1 2,254 1,390 864
ADAMS-ARAPAHOE 28J 1,001 638 363
MESA COUNTY VALLEY 51 520 361 159
POUDRE R-1 188 90 98
MONTEZUMA-CORTEZ RE-1 125 28 97
BRIGHTON 27J 235 142 93
DOUGLAS COUNTY RE 1 232 144 88
LITTLETON 6 300 223 77
SUMMIT RE-1 94 20 74
MAPLETON 1 123 59 64
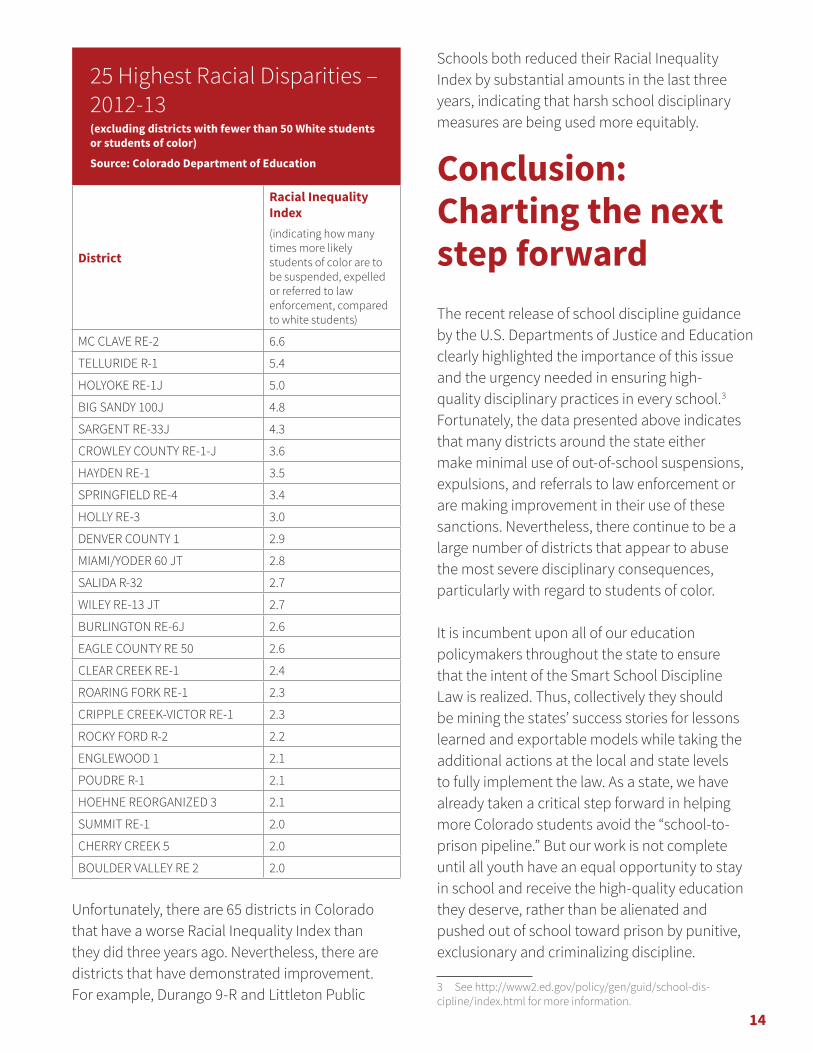
Racial DisparitiesWe calculated the “Racial Inequality Index” for every district in the state, which identifies the relative likelihood that students of color will receive an out-of-school suspension, expulsion, or referral to law enforcement, compared to their white peers. A rate of 1.0 indicates that students of color and white students are equally likely to be suspended, expelled or referred to law enforcement. Greater than 1.0 would indicate that students of color are more likely to receive these disciplinary sanctions; 1.5 would indicate that students of color are 50% more likely to receive such a sanction, and so on.
What we found is striking. Even though there are significant racial disparities evident at the state level, and racial inequality is widespread at the local level, there are a considerable number of
districts around the state that employ out-of-school suspensions, expulsions, and referrals to law enforcement at roughly the same rate for students of color as they do for White students.
In fact, during the 2012-2013 school year, there were 70 districts in which students of color were not over-represented in suspensions, expulsions, and law enforcement referrals. However, there were also 89 districts in which students of color were at least 25% more likely than White students to receive these harsh punishments. Indeed, in many districts, students of color were 3, 4, or even 6 times more likely than their White peers to be suspended, expelled, or referred to law enforcement.
14
25 Highest Racial Disparities – 2012-13 (excluding districts with fewer than 50 White students or students of color)
Source: Colorado Department of Education
District
Racial Inequality Index(indicating how many times more likely students of color are to be suspended, expelled or referred to law enforcement, compared to white students)
MC CLAVE RE-2 6.6
TELLURIDE R-1 5.4
HOLYOKE RE-1J 5.0
BIG SANDY 100J 4.8
SARGENT RE-33J 4.3
CROWLEY COUNTY RE-1-J 3.6
HAYDEN RE-1 3.5
SPRINGFIELD RE-4 3.4
HOLLY RE-3 3.0
DENVER COUNTY 1 2.9
MIAMI/YODER 60 JT 2.8
SALIDA R-32 2.7
WILEY RE-13 JT 2.7
BURLINGTON RE-6J 2.6
EAGLE COUNTY RE 50 2.6
CLEAR CREEK RE-1 2.4
ROARING FORK RE-1 2.3
CRIPPLE CREEK-VICTOR RE-1 2.3
ROCKY FORD R-2 2.2
ENGLEWOOD 1 2.1
POUDRE R-1 2.1
HOEHNE REORGANIZED 3 2.1
SUMMIT RE-1 2.0
CHERRY CREEK 5 2.0
BOULDER VALLEY RE 2 2.0
Unfortunately, there are 65 districts in Colorado that have a worse Racial Inequality Index than they did three years ago. Nevertheless, there are districts that have demonstrated improvement. For example, Durango 9-R and Littleton Public
Schools both reduced their Racial Inequality Index by substantial amounts in the last three years, indicating that harsh school disciplinary measures are being used more equitably.
Conclusion: Charting the next step forwardThe recent release of school discipline guidance by the U.S. Departments of Justice and Education clearly highlighted the importance of this issue and the urgency needed in ensuring high-quality disciplinary practices in every school.3 Fortunately, the data presented above indicates that many districts around the state either make minimal use of out-of-school suspensions, expulsions, and referrals to law enforcement or are making improvement in their use of these sanctions. Nevertheless, there continue to be a large number of districts that appear to abuse the most severe disciplinary consequences, particularly with regard to students of color.
It is incumbent upon all of our education policymakers throughout the state to ensure that the intent of the Smart School Discipline Law is realized. Thus, collectively they should be mining the states’ success stories for lessons learned and exportable models while taking the additional actions at the local and state levels to fully implement the law. As a state, we have already taken a critical step forward in helping more Colorado students avoid the “school-to-prison pipeline.” But our work is not complete until all youth have an equal opportunity to stay in school and receive the high-quality education they deserve, rather than be alienated and pushed out of school toward prison by punitive, exclusionary and criminalizing discipline.
3 See http://www2.ed.gov/policy/gen/guid/school-dis-cipline/index.html for more information.

15
Join us in building a statewide networkIf you are a student, parent/guardian, community member, teacher, school staff member, school administrator or district official who wants to end zero tolerance and racial discrimination in school discipline, and keep students in school and learning, please contact us. We are building a statewide network to ensure that the Smart School Disclipline Law is fully implemented and to end the school-to-prison pipeline in Colorado. Together we can ensure that all Colorado youth have the same right to stay in school and get the high-quality education they deserve.
Padres & Jóvenes Unidoswww.padresunidos.org(303) 458-6545
16
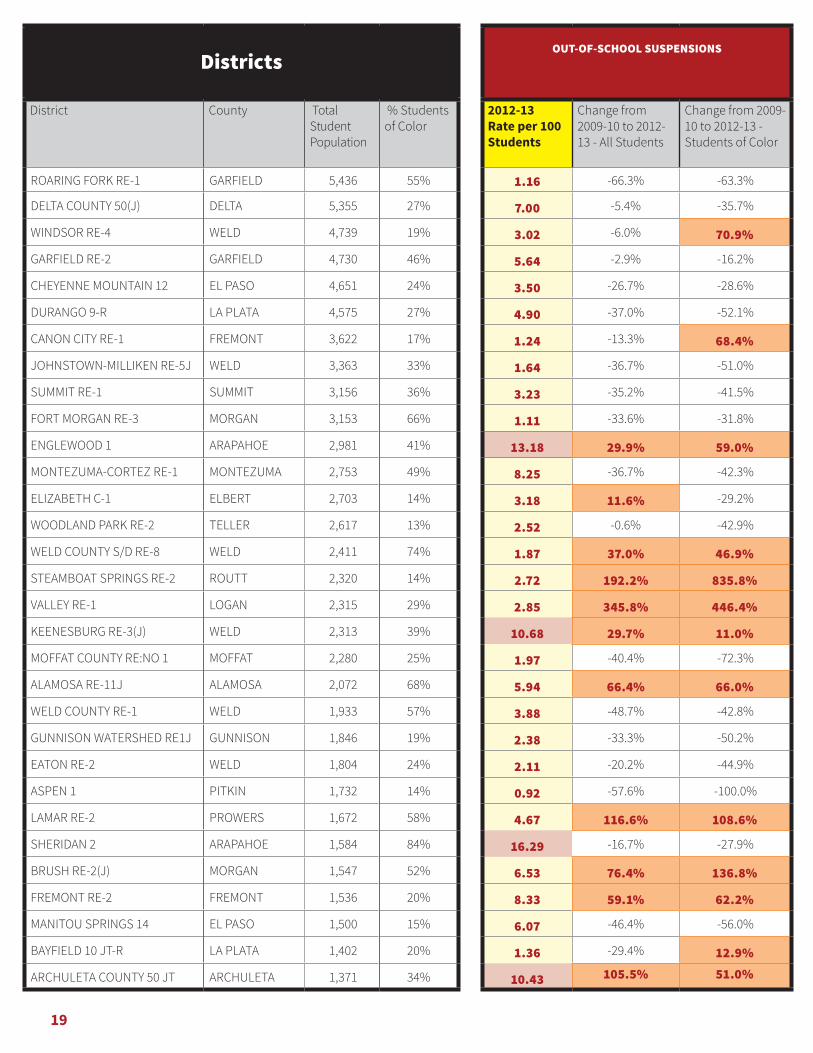
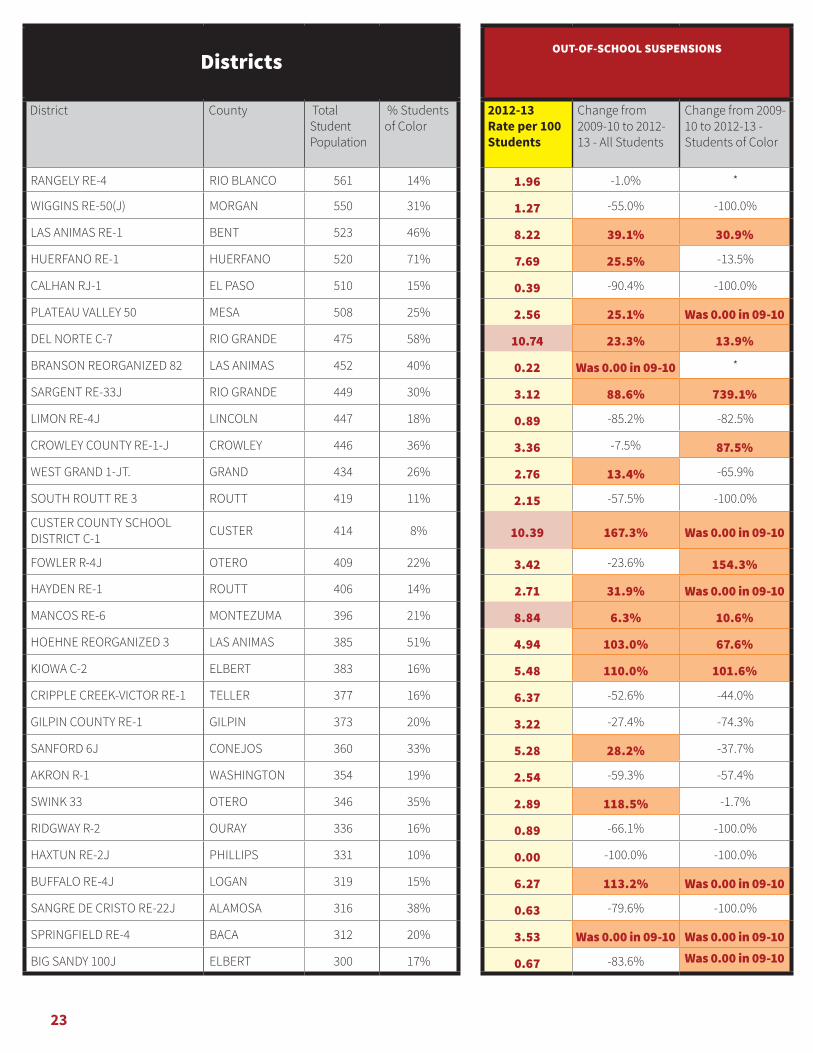
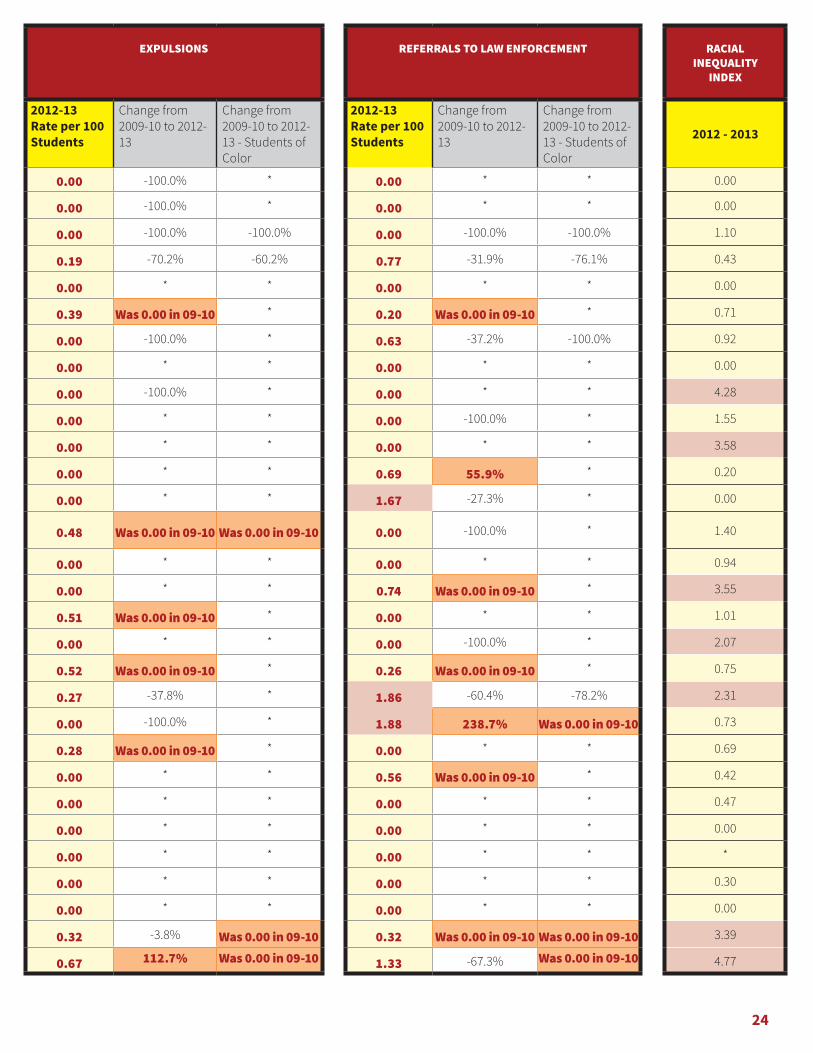
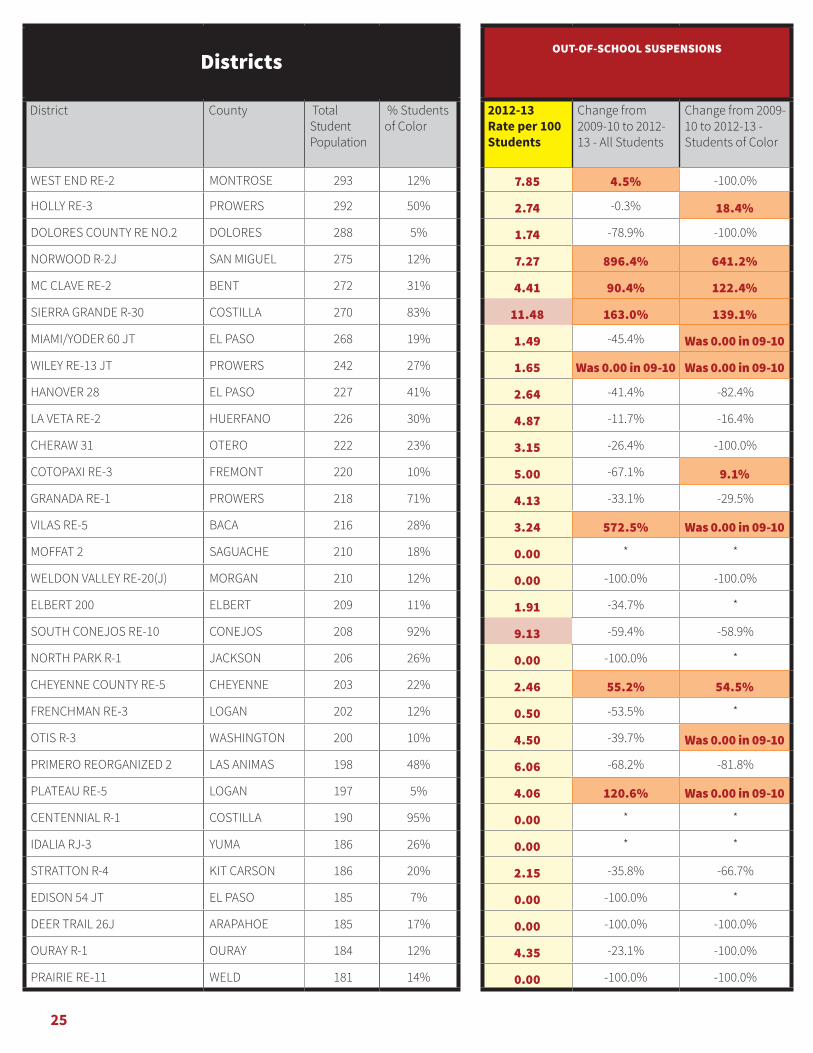
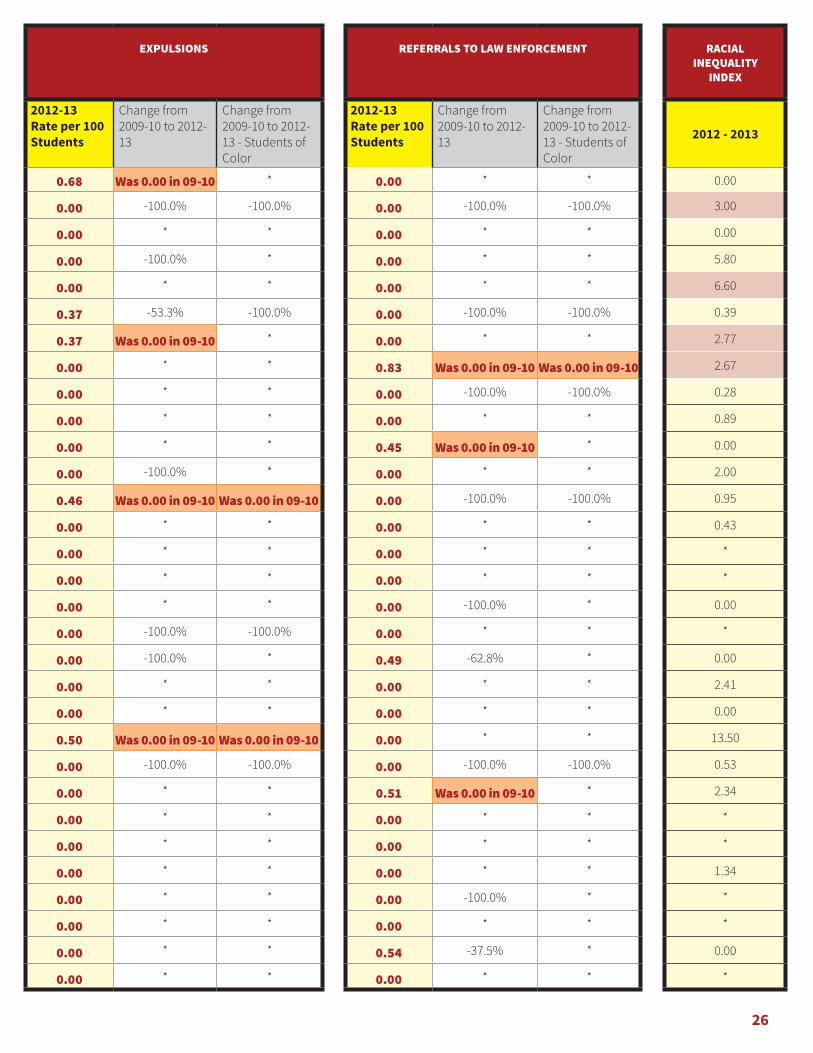
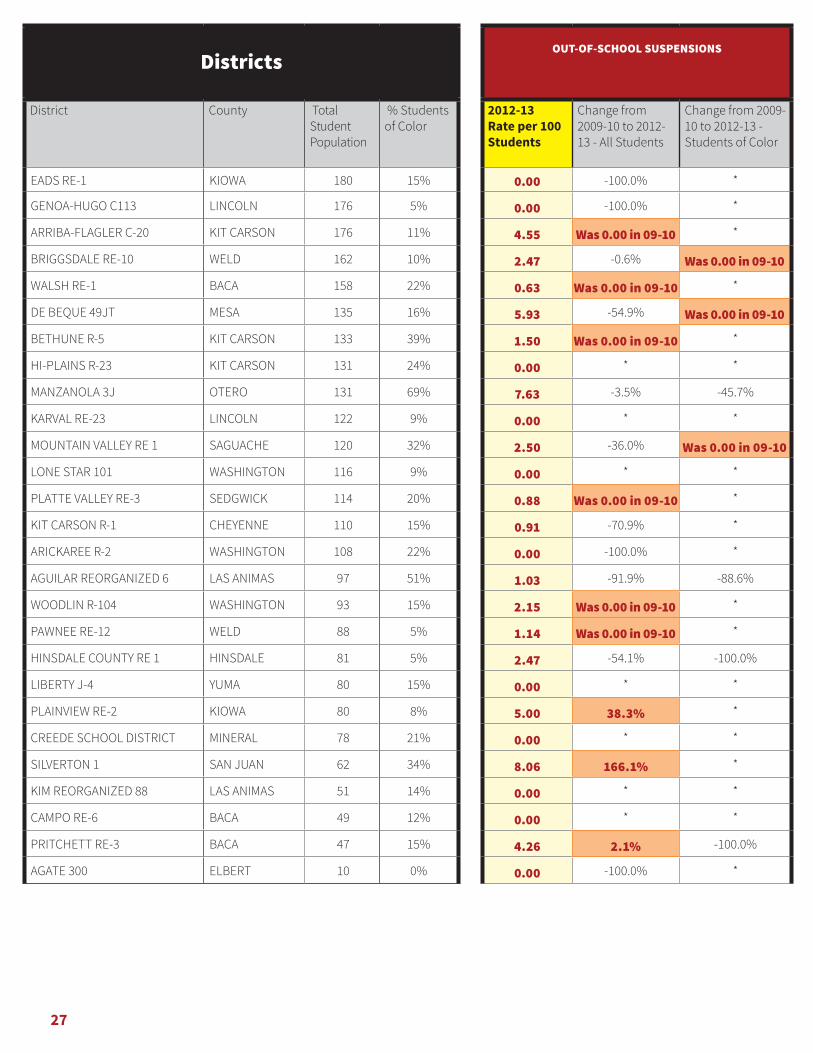
Appendix: Colorado School Discipline Report CardMethodology
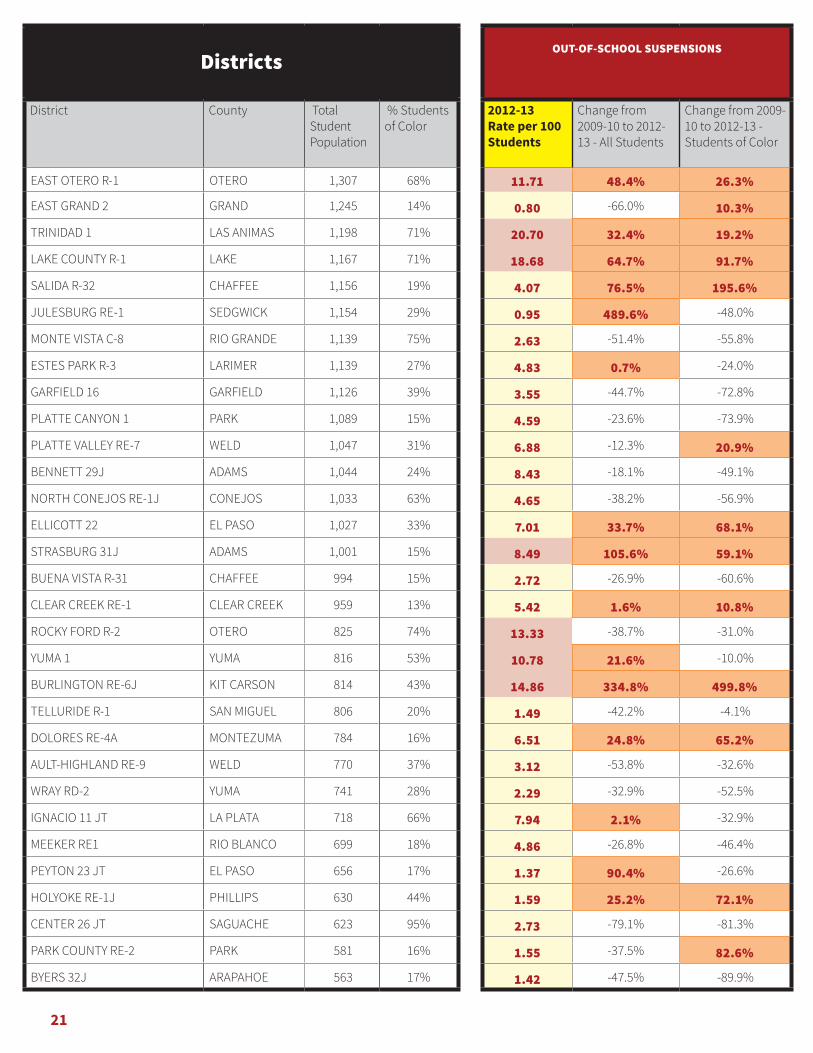
The 179 school districts are listed in descending order by student population from largest to smallest.
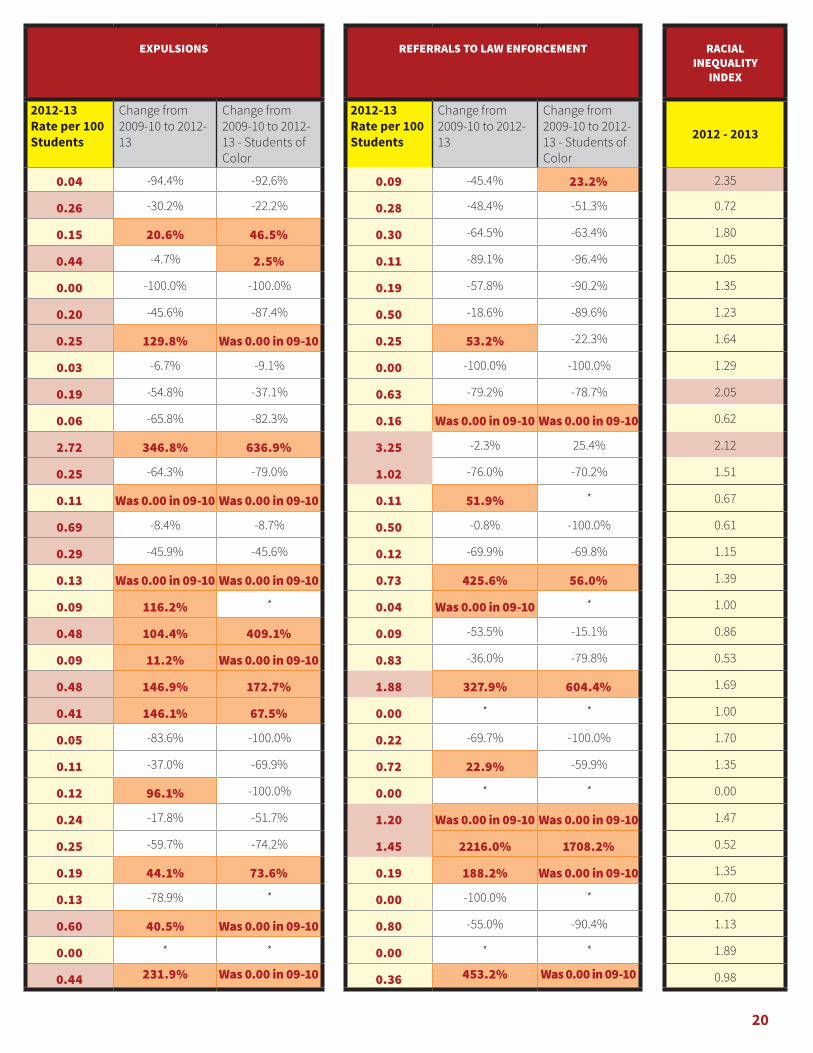
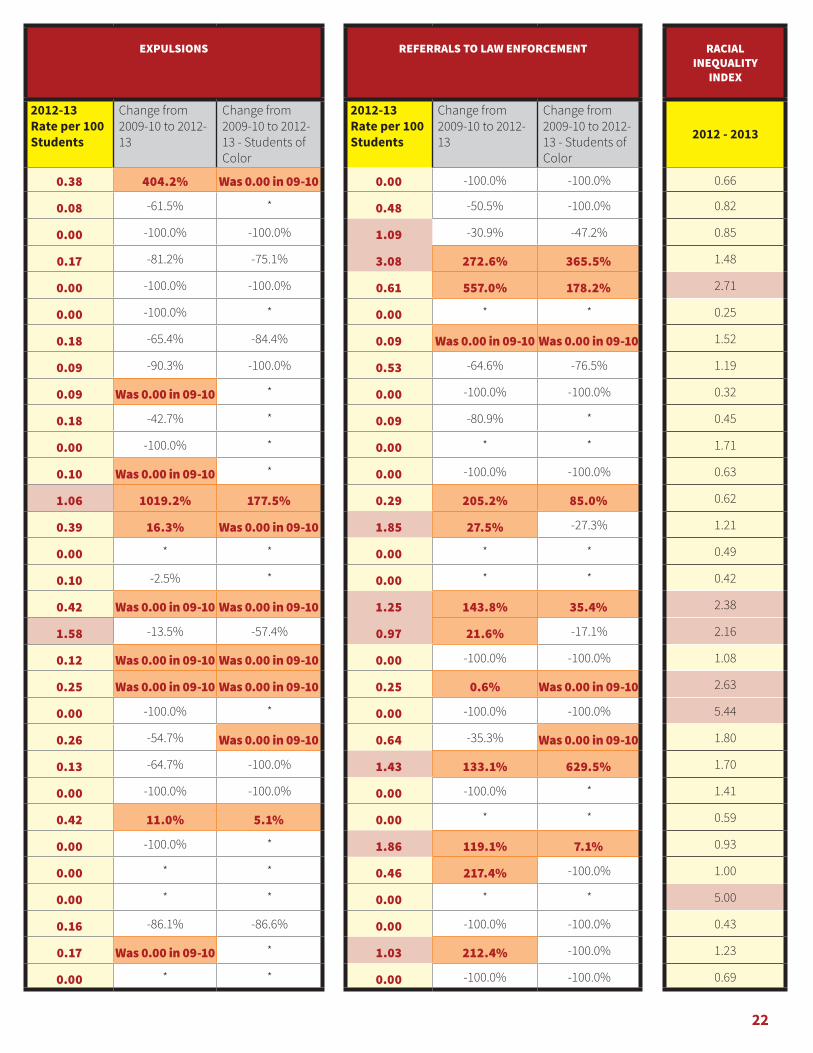
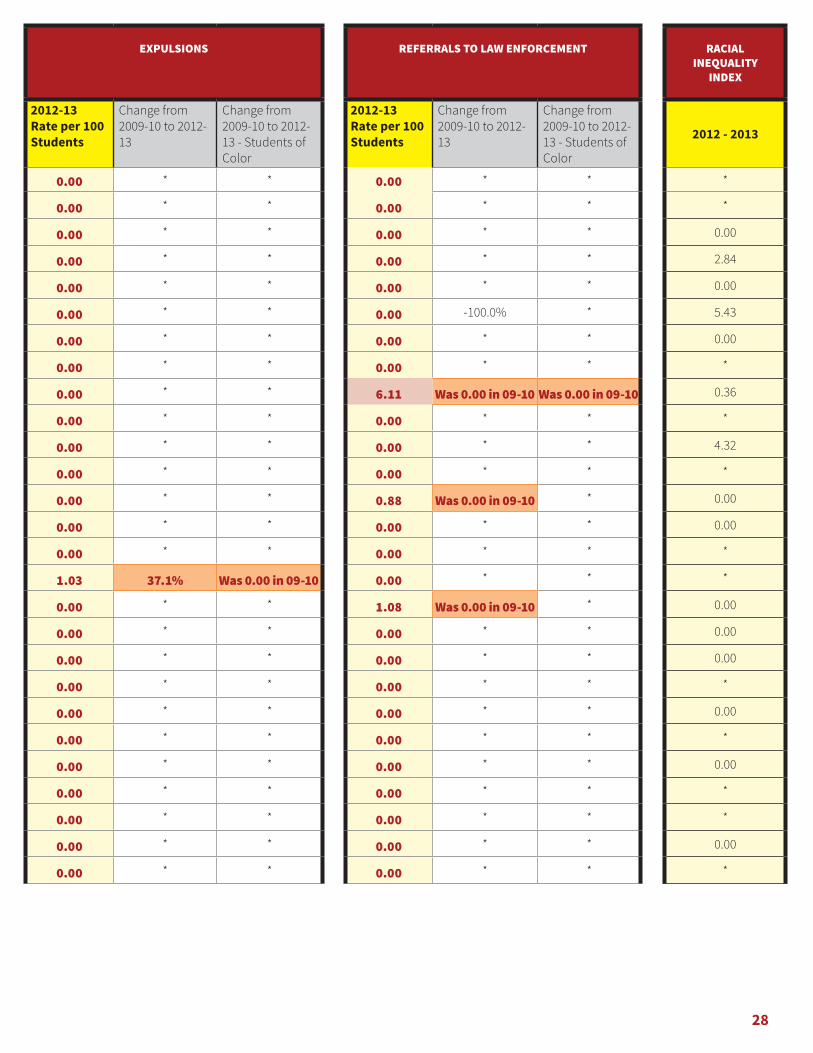
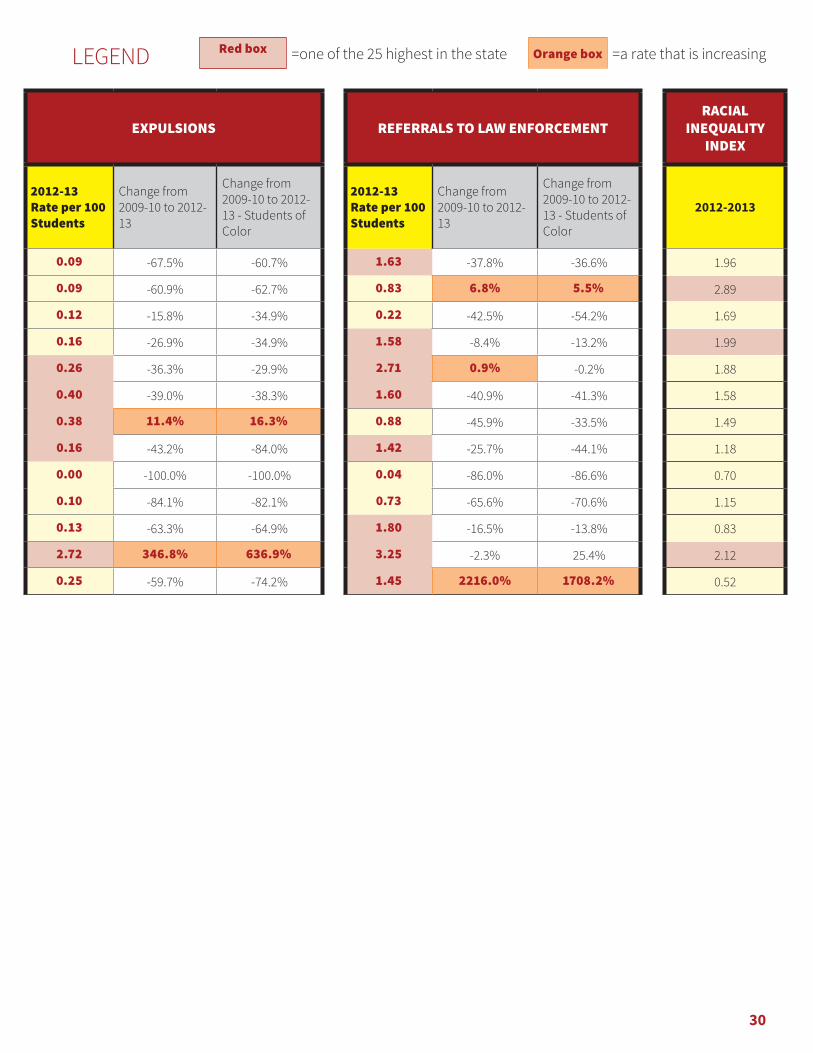
Suspension, Expulsion, Law Enforcement Referral Rates. The report card includes the out-of-school suspension rate, expulsion rate, referral to law enforcement rate, and Racial Inequality Index for each of the 179 districts. The 25 highest rates in each category are highlighted in red. (Note that when identifying the districts with the highest rates, districts with fewer than five expulsions or fewer than five referrals to law enforcement were excluded in those categories, and districts with fewer than 50 students of color or 50 white students were excluded in the Racial Inequality Index category.)
Percentage change. The Report Card also includes the percentage change between the 2009-10 and 2012-13 school years in the out-of-school suspension rate, expulsion rate, and referral to law enforcement rate, for all students and for students of color. Any increases in those rates over that three-year period are highlighted in orange.
Racial Inequality Index. “Racial Inequality Index” refers to the ratio of out-of-school suspensions, expulsions, and referrals to law enforcement for students of color compared to white students. A rate of 1.0 would indicate perfect equality; greater than 1.0 would indicate that students of color are more likely to receive these disciplinary sanctions; 1.5 would indicate that students of color are 50% more likely to receive such a sanction, and so on.
Asterisks. For the data indicating the change between 2009-10 and 2012-13, an asterisk indicates that the rates in both years were zero. For the Racial Inequality Index category, an asterisk indicates either that the rates were zero for both White students and students of color or that the rate was zero for White students, not zero for students of color, but there were too few White students to make a legitimate comparison.
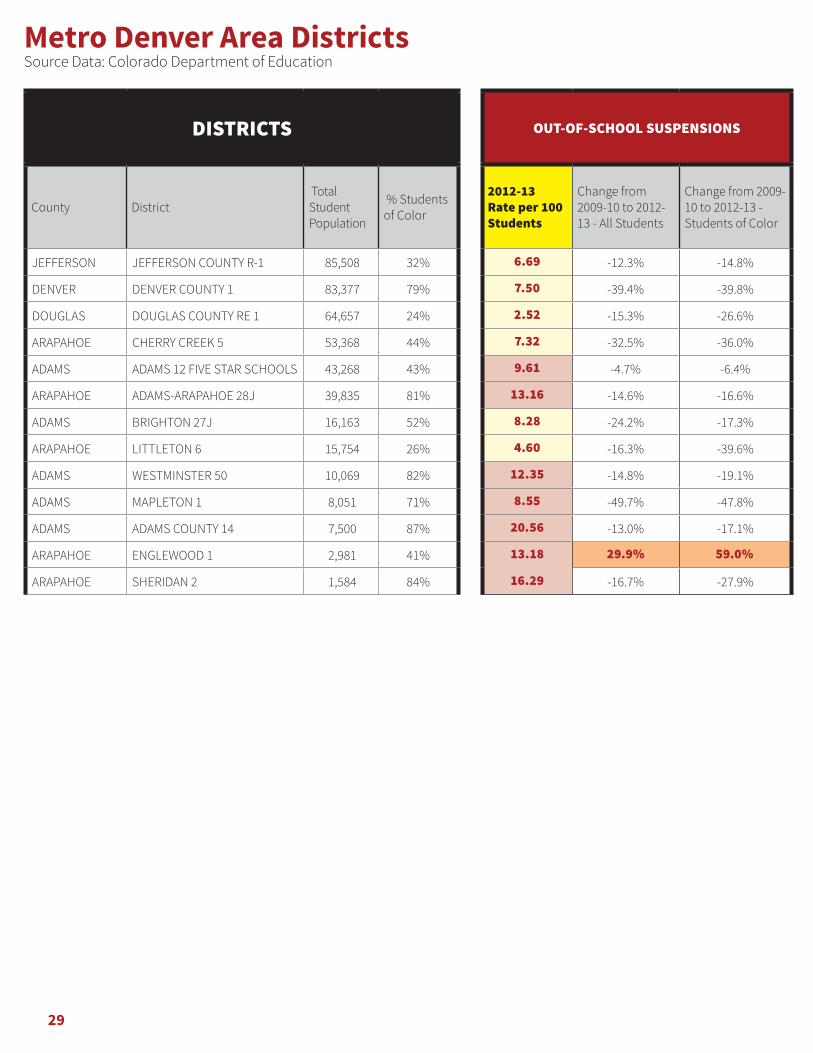
Comparison of Metro Denver Area Districts. Please see page 30 for a comparison of only Metro area school districts.
17
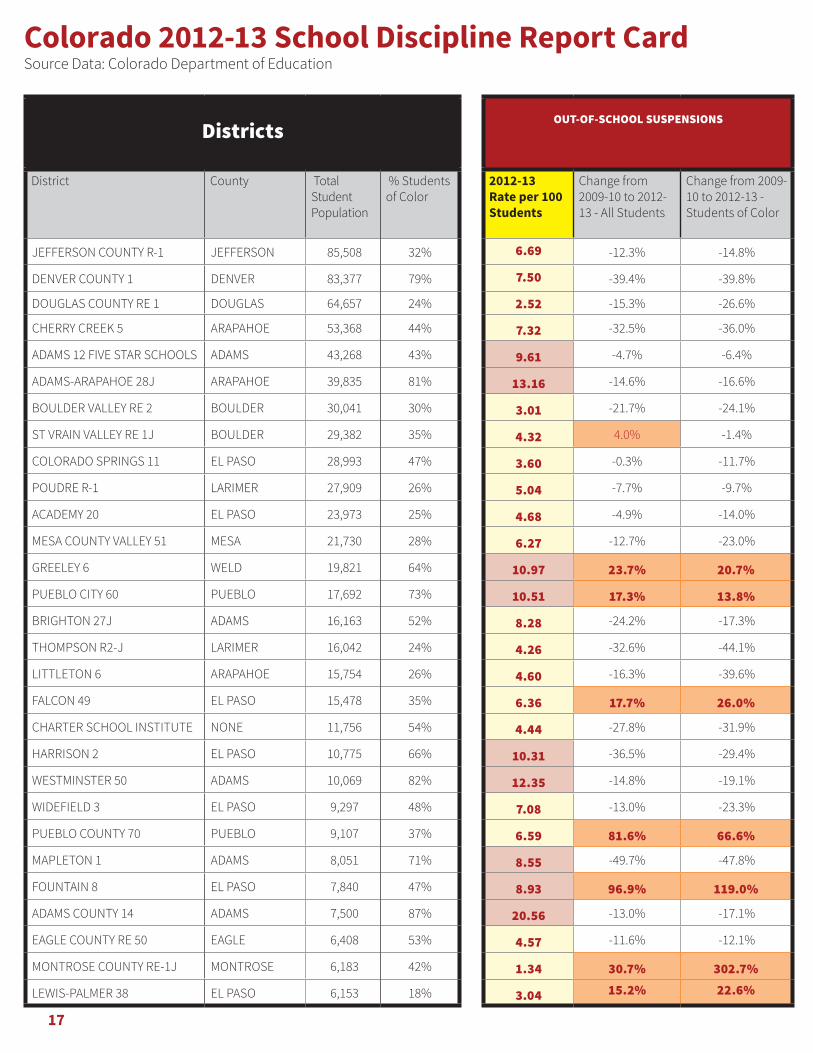
DistrictsOUT-OF-SCHOOL SUSPENSIONS EXPULSIONS REFERRALS TO LAW ENFORCEMENT RACIAL
INEQUALITY INDEX
District County Total Student Population
% Students of Color
2012-13 Rate per 100 Students
Change from 2009-10 to 2012-13 - All Students
Change from 2009-10 to 2012-13 - Students of Color
2012-13 Rate per 100 Students
Change from 2009-10 to 2012-13
Change from 2009-10 to 2012-13 - Students of Color
2012-13 Rate per 100 Students
Change from 2009-10 to 2012-13
Change from 2009-10 to 2012-13 - Students of Color
2012 - 2013
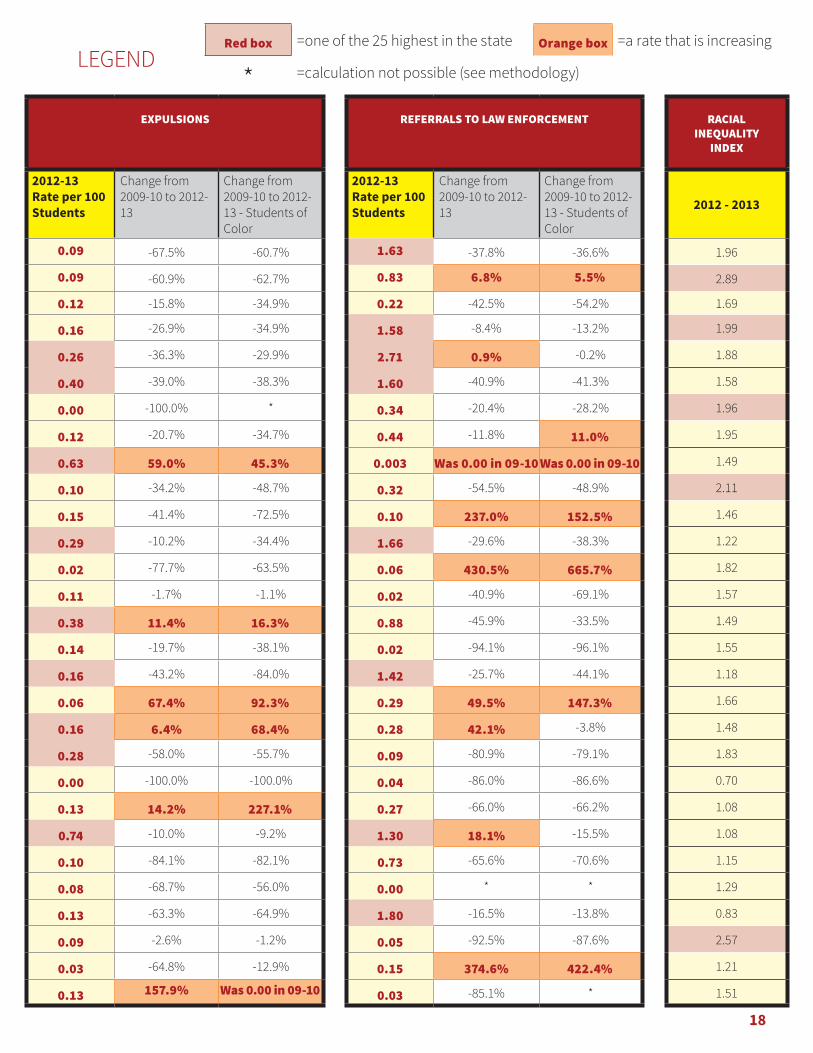
JEFFERSON COUNTY R-1 JEFFERSON 85,508 32% 6.69 -12.3% -14.8% 0.09 -67.5% -60.7% 1.63 -37.8% -36.6% 1.96
DENVER COUNTY 1 DENVER 83,377 79% 7.50 -39.4% -39.8% 0.09 -60.9% -62.7% 0.83 6.8% 5.5% 2.89
DOUGLAS COUNTY RE 1 DOUGLAS 64,657 24% 2.52 -15.3% -26.6% 0.12 -15.8% -34.9% 0.22 -42.5% -54.2% 1.69
CHERRY CREEK 5 ARAPAHOE 53,368 44% 7.32 -32.5% -36.0% 0.16 -26.9% -34.9% 1.58 -8.4% -13.2% 1.99
ADAMS 12 FIVE STAR SCHOOLS ADAMS 43,268 43% 9.61 -4.7% -6.4% 0.26 -36.3% -29.9% 2.71 0.9% -0.2% 1.88
ADAMS-ARAPAHOE 28J ARAPAHOE 39,835 81% 13.16 -14.6% -16.6% 0.40 -39.0% -38.3% 1.60 -40.9% -41.3% 1.58
BOULDER VALLEY RE 2 BOULDER 30,041 30% 3.01 -21.7% -24.1% 0.00 -100.0% * 0.34 -20.4% -28.2% 1.96
ST VRAIN VALLEY RE 1J BOULDER 29,382 35% 4.32 4.0% -1.4% 0.12 -20.7% -34.7% 0.44 -11.8% 11.0% 1.95
COLORADO SPRINGS 11 EL PASO 28,993 47% 3.60 -0.3% -11.7% 0.63 59.0% 45.3% 0.003 Was 0.00 in 09-10 Was 0.00 in 09-10 1.49
POUDRE R-1 LARIMER 27,909 26% 5.04 -7.7% -9.7% 0.10 -34.2% -48.7% 0.32 -54.5% -48.9% 2.11
ACADEMY 20 EL PASO 23,973 25% 4.68 -4.9% -14.0% 0.15 -41.4% -72.5% 0.10 237.0% 152.5% 1.46
MESA COUNTY VALLEY 51 MESA 21,730 28% 6.27 -12.7% -23.0% 0.29 -10.2% -34.4% 1.66 -29.6% -38.3% 1.22
GREELEY 6 WELD 19,821 64% 10.97 23.7% 20.7% 0.02 -77.7% -63.5% 0.06 430.5% 665.7% 1.82
PUEBLO CITY 60 PUEBLO 17,692 73% 10.51 17.3% 13.8% 0.11 -1.7% -1.1% 0.02 -40.9% -69.1% 1.57
BRIGHTON 27J ADAMS 16,163 52% 8.28 -24.2% -17.3% 0.38 11.4% 16.3% 0.88 -45.9% -33.5% 1.49
THOMPSON R2-J LARIMER 16,042 24% 4.26 -32.6% -44.1% 0.14 -19.7% -38.1% 0.02 -94.1% -96.1% 1.55
LITTLETON 6 ARAPAHOE 15,754 26% 4.60 -16.3% -39.6% 0.16 -43.2% -84.0% 1.42 -25.7% -44.1% 1.18
FALCON 49 EL PASO 15,478 35% 6.36 17.7% 26.0% 0.06 67.4% 92.3% 0.29 49.5% 147.3% 1.66
CHARTER SCHOOL INSTITUTE NONE 11,756 54% 4.44 -27.8% -31.9% 0.16 6.4% 68.4% 0.28 42.1% -3.8% 1.48
HARRISON 2 EL PASO 10,775 66% 10.31 -36.5% -29.4% 0.28 -58.0% -55.7% 0.09 -80.9% -79.1% 1.83
WESTMINSTER 50 ADAMS 10,069 82% 12.35 -14.8% -19.1% 0.00 -100.0% -100.0% 0.04 -86.0% -86.6% 0.70
WIDEFIELD 3 EL PASO 9,297 48% 7.08 -13.0% -23.3% 0.13 14.2% 227.1% 0.27 -66.0% -66.2% 1.08
PUEBLO COUNTY 70 PUEBLO 9,107 37% 6.59 81.6% 66.6% 0.74 -10.0% -9.2% 1.30 18.1% -15.5% 1.08
MAPLETON 1 ADAMS 8,051 71% 8.55 -49.7% -47.8% 0.10 -84.1% -82.1% 0.73 -65.6% -70.6% 1.15
FOUNTAIN 8 EL PASO 7,840 47% 8.93 96.9% 119.0% 0.08 -68.7% -56.0% 0.00 * * 1.29
ADAMS COUNTY 14 ADAMS 7,500 87% 20.56 -13.0% -17.1% 0.13 -63.3% -64.9% 1.80 -16.5% -13.8% 0.83
EAGLE COUNTY RE 50 EAGLE 6,408 53% 4.57 -11.6% -12.1% 0.09 -2.6% -1.2% 0.05 -92.5% -87.6% 2.57
MONTROSE COUNTY RE-1J MONTROSE 6,183 42% 1.34 30.7% 302.7% 0.03 -64.8% -12.9% 0.15 374.6% 422.4% 1.21
LEWIS-PALMER 38 EL PASO 6,153 18% 3.04 15.2% 22.6% 0.13 157.9% Was 0.00 in 09-10 0.03 -85.1% * 1.51
Colorado 2012-13 School Discipline Report CardSource Data: Colorado Department of Education
18
DistrictsOUT-OF-SCHOOL SUSPENSIONS EXPULSIONS REFERRALS TO LAW ENFORCEMENT RACIAL
INEQUALITY INDEX
District County Total Student Population
% Students of Color
2012-13 Rate per 100 Students
Change from 2009-10 to 2012-13 - All Students
Change from 2009-10 to 2012-13 - Students of Color
2012-13 Rate per 100 Students
Change from 2009-10 to 2012-13
Change from 2009-10 to 2012-13 - Students of Color
2012-13 Rate per 100 Students
Change from 2009-10 to 2012-13
Change from 2009-10 to 2012-13 - Students of Color
2012 - 2013
JEFFERSON COUNTY R-1 JEFFERSON 85,508 32% 6.69 -12.3% -14.8% 0.09 -67.5% -60.7% 1.63 -37.8% -36.6% 1.96
DENVER COUNTY 1 DENVER 83,377 79% 7.50 -39.4% -39.8% 0.09 -60.9% -62.7% 0.83 6.8% 5.5% 2.89
DOUGLAS COUNTY RE 1 DOUGLAS 64,657 24% 2.52 -15.3% -26.6% 0.12 -15.8% -34.9% 0.22 -42.5% -54.2% 1.69
CHERRY CREEK 5 ARAPAHOE 53,368 44% 7.32 -32.5% -36.0% 0.16 -26.9% -34.9% 1.58 -8.4% -13.2% 1.99
ADAMS 12 FIVE STAR SCHOOLS ADAMS 43,268 43% 9.61 -4.7% -6.4% 0.26 -36.3% -29.9% 2.71 0.9% -0.2% 1.88
ADAMS-ARAPAHOE 28J ARAPAHOE 39,835 81% 13.16 -14.6% -16.6% 0.40 -39.0% -38.3% 1.60 -40.9% -41.3% 1.58
BOULDER VALLEY RE 2 BOULDER 30,041 30% 3.01 -21.7% -24.1% 0.00 -100.0% * 0.34 -20.4% -28.2% 1.96
ST VRAIN VALLEY RE 1J BOULDER 29,382 35% 4.32 4.0% -1.4% 0.12 -20.7% -34.7% 0.44 -11.8% 11.0% 1.95
COLORADO SPRINGS 11 EL PASO 28,993 47% 3.60 -0.3% -11.7% 0.63 59.0% 45.3% 0.003 Was 0.00 in 09-10 Was 0.00 in 09-10 1.49
POUDRE R-1 LARIMER 27,909 26% 5.04 -7.7% -9.7% 0.10 -34.2% -48.7% 0.32 -54.5% -48.9% 2.11
ACADEMY 20 EL PASO 23,973 25% 4.68 -4.9% -14.0% 0.15 -41.4% -72.5% 0.10 237.0% 152.5% 1.46
MESA COUNTY VALLEY 51 MESA 21,730 28% 6.27 -12.7% -23.0% 0.29 -10.2% -34.4% 1.66 -29.6% -38.3% 1.22
GREELEY 6 WELD 19,821 64% 10.97 23.7% 20.7% 0.02 -77.7% -63.5% 0.06 430.5% 665.7% 1.82
PUEBLO CITY 60 PUEBLO 17,692 73% 10.51 17.3% 13.8% 0.11 -1.7% -1.1% 0.02 -40.9% -69.1% 1.57
BRIGHTON 27J ADAMS 16,163 52% 8.28 -24.2% -17.3% 0.38 11.4% 16.3% 0.88 -45.9% -33.5% 1.49
THOMPSON R2-J LARIMER 16,042 24% 4.26 -32.6% -44.1% 0.14 -19.7% -38.1% 0.02 -94.1% -96.1% 1.55
LITTLETON 6 ARAPAHOE 15,754 26% 4.60 -16.3% -39.6% 0.16 -43.2% -84.0% 1.42 -25.7% -44.1% 1.18
FALCON 49 EL PASO 15,478 35% 6.36 17.7% 26.0% 0.06 67.4% 92.3% 0.29 49.5% 147.3% 1.66
CHARTER SCHOOL INSTITUTE NONE 11,756 54% 4.44 -27.8% -31.9% 0.16 6.4% 68.4% 0.28 42.1% -3.8% 1.48
HARRISON 2 EL PASO 10,775 66% 10.31 -36.5% -29.4% 0.28 -58.0% -55.7% 0.09 -80.9% -79.1% 1.83
WESTMINSTER 50 ADAMS 10,069 82% 12.35 -14.8% -19.1% 0.00 -100.0% -100.0% 0.04 -86.0% -86.6% 0.70
WIDEFIELD 3 EL PASO 9,297 48% 7.08 -13.0% -23.3% 0.13 14.2% 227.1% 0.27 -66.0% -66.2% 1.08
PUEBLO COUNTY 70 PUEBLO 9,107 37% 6.59 81.6% 66.6% 0.74 -10.0% -9.2% 1.30 18.1% -15.5% 1.08
MAPLETON 1 ADAMS 8,051 71% 8.55 -49.7% -47.8% 0.10 -84.1% -82.1% 0.73 -65.6% -70.6% 1.15
FOUNTAIN 8 EL PASO 7,840 47% 8.93 96.9% 119.0% 0.08 -68.7% -56.0% 0.00 * * 1.29
ADAMS COUNTY 14 ADAMS 7,500 87% 20.56 -13.0% -17.1% 0.13 -63.3% -64.9% 1.80 -16.5% -13.8% 0.83
EAGLE COUNTY RE 50 EAGLE 6,408 53% 4.57 -11.6% -12.1% 0.09 -2.6% -1.2% 0.05 -92.5% -87.6% 2.57
MONTROSE COUNTY RE-1J MONTROSE 6,183 42% 1.34 30.7% 302.7% 0.03 -64.8% -12.9% 0.15 374.6% 422.4% 1.21
LEWIS-PALMER 38 EL PASO 6,153 18% 3.04 15.2% 22.6% 0.13 157.9% Was 0.00 in 09-10 0.03 -85.1% * 1.51
Red box =one of the 25 highest in the state Orange box =a rate that is increasing
* =calculation not possible (see methodology)LEGEND
19
DistrictsOUT-OF-SCHOOL SUSPENSIONS EXPULSIONS REFERRALS TO LAW ENFORCEMENT RACIAL
INEQUALITY INDEX
District County Total Student Population
% Students of Color
2012-13 Rate per 100 Students
Change from 2009-10 to 2012-13 - All Students
Change from 2009-10 to 2012-13 - Students of Color
2012-13 Rate per 100 Students
Change from 2009-10 to 2012-13
Change from 2009-10 to 2012-13 - Students of Color
2012-13 Rate per 100 Students
Change from 2009-10 to 2012-13
Change from 2009-10 to 2012-13 - Students of Color
2012 - 2013
ROARING FORK RE-1 GARFIELD 5,436 55% 1.16 -66.3% -63.3% 0.04 -94.4% -92.6% 0.09 -45.4% 23.2% 2.35
DELTA COUNTY 50(J) DELTA 5,355 27% 7.00 -5.4% -35.7% 0.26 -30.2% -22.2% 0.28 -48.4% -51.3% 0.72
WINDSOR RE-4 WELD 4,739 19% 3.02 -6.0% 70.9% 0.15 20.6% 46.5% 0.30 -64.5% -63.4% 1.80
GARFIELD RE-2 GARFIELD 4,730 46% 5.64 -2.9% -16.2% 0.44 -4.7% 2.5% 0.11 -89.1% -96.4% 1.05
CHEYENNE MOUNTAIN 12 EL PASO 4,651 24% 3.50 -26.7% -28.6% 0.00 -100.0% -100.0% 0.19 -57.8% -90.2% 1.35
DURANGO 9-R LA PLATA 4,575 27% 4.90 -37.0% -52.1% 0.20 -45.6% -87.4% 0.50 -18.6% -89.6% 1.23
CANON CITY RE-1 FREMONT 3,622 17% 1.24 -13.3% 68.4% 0.25 129.8% Was 0.00 in 09-10 0.25 53.2% -22.3% 1.64
JOHNSTOWN-MILLIKEN RE-5J WELD 3,363 33% 1.64 -36.7% -51.0% 0.03 -6.7% -9.1% 0.00 -100.0% -100.0% 1.29
SUMMIT RE-1 SUMMIT 3,156 36% 3.23 -35.2% -41.5% 0.19 -54.8% -37.1% 0.63 -79.2% -78.7% 2.05
FORT MORGAN RE-3 MORGAN 3,153 66% 1.11 -33.6% -31.8% 0.06 -65.8% -82.3% 0.16 Was 0.00 in 09-10 Was 0.00 in 09-10 0.62
ENGLEWOOD 1 ARAPAHOE 2,981 41% 13.18 29.9% 59.0% 2.72 346.8% 636.9% 3.25 -2.3% 25.4% 2.12
MONTEZUMA-CORTEZ RE-1 MONTEZUMA 2,753 49% 8.25 -36.7% -42.3% 0.25 -64.3% -79.0% 1.02 -76.0% -70.2% 1.51
ELIZABETH C-1 ELBERT 2,703 14% 3.18 11.6% -29.2% 0.11 Was 0.00 in 09-10 Was 0.00 in 09-10 0.11 51.9% * 0.67
WOODLAND PARK RE-2 TELLER 2,617 13% 2.52 -0.6% -42.9% 0.69 -8.4% -8.7% 0.50 -0.8% -100.0% 0.61
WELD COUNTY S/D RE-8 WELD 2,411 74% 1.87 37.0% 46.9% 0.29 -45.9% -45.6% 0.12 -69.9% -69.8% 1.15
STEAMBOAT SPRINGS RE-2 ROUTT 2,320 14% 2.72 192.2% 835.8% 0.13 Was 0.00 in 09-10 Was 0.00 in 09-10 0.73 425.6% 56.0% 1.39
VALLEY RE-1 LOGAN 2,315 29% 2.85 345.8% 446.4% 0.09 116.2% * 0.04 Was 0.00 in 09-10 * 1.00
KEENESBURG RE-3(J) WELD 2,313 39% 10.68 29.7% 11.0% 0.48 104.4% 409.1% 0.09 -53.5% -15.1% 0.86
MOFFAT COUNTY RE:NO 1 MOFFAT 2,280 25% 1.97 -40.4% -72.3% 0.09 11.2% Was 0.00 in 09-10 0.83 -36.0% -79.8% 0.53
ALAMOSA RE-11J ALAMOSA 2,072 68% 5.94 66.4% 66.0% 0.48 146.9% 172.7% 1.88 327.9% 604.4% 1.69
WELD COUNTY RE-1 WELD 1,933 57% 3.88 -48.7% -42.8% 0.41 146.1% 67.5% 0.00 * * 1.00
GUNNISON WATERSHED RE1J GUNNISON 1,846 19% 2.38 -33.3% -50.2% 0.05 -83.6% -100.0% 0.22 -69.7% -100.0% 1.70
EATON RE-2 WELD 1,804 24% 2.11 -20.2% -44.9% 0.11 -37.0% -69.9% 0.72 22.9% -59.9% 1.35
ASPEN 1 PITKIN 1,732 14% 0.92 -57.6% -100.0% 0.12 96.1% -100.0% 0.00 * * 0.00
LAMAR RE-2 PROWERS 1,672 58% 4.67 116.6% 108.6% 0.24 -17.8% -51.7% 1.20 Was 0.00 in 09-10 Was 0.00 in 09-10 1.47
SHERIDAN 2 ARAPAHOE 1,584 84% 16.29 -16.7% -27.9% 0.25 -59.7% -74.2% 1.45 2216.0% 1708.2% 0.52
BRUSH RE-2(J) MORGAN 1,547 52% 6.53 76.4% 136.8% 0.19 44.1% 73.6% 0.19 188.2% Was 0.00 in 09-10 1.35
FREMONT RE-2 FREMONT 1,536 20% 8.33 59.1% 62.2% 0.13 -78.9% * 0.00 -100.0% * 0.70
MANITOU SPRINGS 14 EL PASO 1,500 15% 6.07 -46.4% -56.0% 0.60 40.5% Was 0.00 in 09-10 0.80 -55.0% -90.4% 1.13
BAYFIELD 10 JT-R LA PLATA 1,402 20% 1.36 -29.4% 12.9% 0.00 * * 0.00 * * 1.89
ARCHULETA COUNTY 50 JT ARCHULETA 1,371 34% 10.43 105.5% 51.0% 0.44 231.9% Was 0.00 in 09-10 0.36 453.2% Was 0.00 in 09-10 0.98
20
DistrictsOUT-OF-SCHOOL SUSPENSIONS EXPULSIONS REFERRALS TO LAW ENFORCEMENT RACIAL
INEQUALITY INDEX
District County Total Student Population
% Students of Color
2012-13 Rate per 100 Students
Change from 2009-10 to 2012-13 - All Students
Change from 2009-10 to 2012-13 - Students of Color
2012-13 Rate per 100 Students
Change from 2009-10 to 2012-13
Change from 2009-10 to 2012-13 - Students of Color
2012-13 Rate per 100 Students
Change from 2009-10 to 2012-13
Change from 2009-10 to 2012-13 - Students of Color
2012 - 2013
ROARING FORK RE-1 GARFIELD 5,436 55% 1.16 -66.3% -63.3% 0.04 -94.4% -92.6% 0.09 -45.4% 23.2% 2.35
DELTA COUNTY 50(J) DELTA 5,355 27% 7.00 -5.4% -35.7% 0.26 -30.2% -22.2% 0.28 -48.4% -51.3% 0.72
WINDSOR RE-4 WELD 4,739 19% 3.02 -6.0% 70.9% 0.15 20.6% 46.5% 0.30 -64.5% -63.4% 1.80
GARFIELD RE-2 GARFIELD 4,730 46% 5.64 -2.9% -16.2% 0.44 -4.7% 2.5% 0.11 -89.1% -96.4% 1.05
CHEYENNE MOUNTAIN 12 EL PASO 4,651 24% 3.50 -26.7% -28.6% 0.00 -100.0% -100.0% 0.19 -57.8% -90.2% 1.35
DURANGO 9-R LA PLATA 4,575 27% 4.90 -37.0% -52.1% 0.20 -45.6% -87.4% 0.50 -18.6% -89.6% 1.23
CANON CITY RE-1 FREMONT 3,622 17% 1.24 -13.3% 68.4% 0.25 129.8% Was 0.00 in 09-10 0.25 53.2% -22.3% 1.64
JOHNSTOWN-MILLIKEN RE-5J WELD 3,363 33% 1.64 -36.7% -51.0% 0.03 -6.7% -9.1% 0.00 -100.0% -100.0% 1.29
SUMMIT RE-1 SUMMIT 3,156 36% 3.23 -35.2% -41.5% 0.19 -54.8% -37.1% 0.63 -79.2% -78.7% 2.05
FORT MORGAN RE-3 MORGAN 3,153 66% 1.11 -33.6% -31.8% 0.06 -65.8% -82.3% 0.16 Was 0.00 in 09-10 Was 0.00 in 09-10 0.62
ENGLEWOOD 1 ARAPAHOE 2,981 41% 13.18 29.9% 59.0% 2.72 346.8% 636.9% 3.25 -2.3% 25.4% 2.12
MONTEZUMA-CORTEZ RE-1 MONTEZUMA 2,753 49% 8.25 -36.7% -42.3% 0.25 -64.3% -79.0% 1.02 -76.0% -70.2% 1.51
ELIZABETH C-1 ELBERT 2,703 14% 3.18 11.6% -29.2% 0.11 Was 0.00 in 09-10 Was 0.00 in 09-10 0.11 51.9% * 0.67
WOODLAND PARK RE-2 TELLER 2,617 13% 2.52 -0.6% -42.9% 0.69 -8.4% -8.7% 0.50 -0.8% -100.0% 0.61
WELD COUNTY S/D RE-8 WELD 2,411 74% 1.87 37.0% 46.9% 0.29 -45.9% -45.6% 0.12 -69.9% -69.8% 1.15
STEAMBOAT SPRINGS RE-2 ROUTT 2,320 14% 2.72 192.2% 835.8% 0.13 Was 0.00 in 09-10 Was 0.00 in 09-10 0.73 425.6% 56.0% 1.39
VALLEY RE-1 LOGAN 2,315 29% 2.85 345.8% 446.4% 0.09 116.2% * 0.04 Was 0.00 in 09-10 * 1.00
KEENESBURG RE-3(J) WELD 2,313 39% 10.68 29.7% 11.0% 0.48 104.4% 409.1% 0.09 -53.5% -15.1% 0.86
MOFFAT COUNTY RE:NO 1 MOFFAT 2,280 25% 1.97 -40.4% -72.3% 0.09 11.2% Was 0.00 in 09-10 0.83 -36.0% -79.8% 0.53
ALAMOSA RE-11J ALAMOSA 2,072 68% 5.94 66.4% 66.0% 0.48 146.9% 172.7% 1.88 327.9% 604.4% 1.69
WELD COUNTY RE-1 WELD 1,933 57% 3.88 -48.7% -42.8% 0.41 146.1% 67.5% 0.00 * * 1.00
GUNNISON WATERSHED RE1J GUNNISON 1,846 19% 2.38 -33.3% -50.2% 0.05 -83.6% -100.0% 0.22 -69.7% -100.0% 1.70
EATON RE-2 WELD 1,804 24% 2.11 -20.2% -44.9% 0.11 -37.0% -69.9% 0.72 22.9% -59.9% 1.35
ASPEN 1 PITKIN 1,732 14% 0.92 -57.6% -100.0% 0.12 96.1% -100.0% 0.00 * * 0.00
LAMAR RE-2 PROWERS 1,672 58% 4.67 116.6% 108.6% 0.24 -17.8% -51.7% 1.20 Was 0.00 in 09-10 Was 0.00 in 09-10 1.47
SHERIDAN 2 ARAPAHOE 1,584 84% 16.29 -16.7% -27.9% 0.25 -59.7% -74.2% 1.45 2216.0% 1708.2% 0.52
BRUSH RE-2(J) MORGAN 1,547 52% 6.53 76.4% 136.8% 0.19 44.1% 73.6% 0.19 188.2% Was 0.00 in 09-10 1.35
FREMONT RE-2 FREMONT 1,536 20% 8.33 59.1% 62.2% 0.13 -78.9% * 0.00 -100.0% * 0.70
MANITOU SPRINGS 14 EL PASO 1,500 15% 6.07 -46.4% -56.0% 0.60 40.5% Was 0.00 in 09-10 0.80 -55.0% -90.4% 1.13
BAYFIELD 10 JT-R LA PLATA 1,402 20% 1.36 -29.4% 12.9% 0.00 * * 0.00 * * 1.89
ARCHULETA COUNTY 50 JT ARCHULETA 1,371 34% 10.43 105.5% 51.0% 0.44 231.9% Was 0.00 in 09-10 0.36 453.2% Was 0.00 in 09-10 0.98
21
DistrictsOUT-OF-SCHOOL SUSPENSIONS EXPULSIONS REFERRALS TO LAW ENFORCEMENT RACIAL
INEQUALITY INDEX
District County Total Student Population
% Students of Color
2012-13 Rate per 100 Students
Change from 2009-10 to 2012-13 - All Students
Change from 2009-10 to 2012-13 - Students of Color
2012-13 Rate per 100 Students
Change from 2009-10 to 2012-13
Change from 2009-10 to 2012-13 - Students of Color
2012-13 Rate per 100 Students
Change from 2009-10 to 2012-13
Change from 2009-10 to 2012-13 - Students of Color
2012 - 2013
EAST OTERO R-1 OTERO 1,307 68% 11.71 48.4% 26.3% 0.38 404.2% Was 0.00 in 09-10 0.00 -100.0% -100.0% 0.66
EAST GRAND 2 GRAND 1,245 14% 0.80 -66.0% 10.3% 0.08 -61.5% * 0.48 -50.5% -100.0% 0.82
TRINIDAD 1 LAS ANIMAS 1,198 71% 20.70 32.4% 19.2% 0.00 -100.0% -100.0% 1.09 -30.9% -47.2% 0.85
LAKE COUNTY R-1 LAKE 1,167 71% 18.68 64.7% 91.7% 0.17 -81.2% -75.1% 3.08 272.6% 365.5% 1.48
SALIDA R-32 CHAFFEE 1,156 19% 4.07 76.5% 195.6% 0.00 -100.0% -100.0% 0.61 557.0% 178.2% 2.71
JULESBURG RE-1 SEDGWICK 1,154 29% 0.95 489.6% -48.0% 0.00 -100.0% * 0.00 * * 0.25
MONTE VISTA C-8 RIO GRANDE 1,139 75% 2.63 -51.4% -55.8% 0.18 -65.4% -84.4% 0.09 Was 0.00 in 09-10 Was 0.00 in 09-10 1.52
ESTES PARK R-3 LARIMER 1,139 27% 4.83 0.7% -24.0% 0.09 -90.3% -100.0% 0.53 -64.6% -76.5% 1.19
GARFIELD 16 GARFIELD 1,126 39% 3.55 -44.7% -72.8% 0.09 Was 0.00 in 09-10 * 0.00 -100.0% -100.0% 0.32
PLATTE CANYON 1 PARK 1,089 15% 4.59 -23.6% -73.9% 0.18 -42.7% * 0.09 -80.9% * 0.45
PLATTE VALLEY RE-7 WELD 1,047 31% 6.88 -12.3% 20.9% 0.00 -100.0% * 0.00 * * 1.71
BENNETT 29J ADAMS 1,044 24% 8.43 -18.1% -49.1% 0.10 Was 0.00 in 09-10 * 0.00 -100.0% -100.0% 0.63
NORTH CONEJOS RE-1J CONEJOS 1,033 63% 4.65 -38.2% -56.9% 1.06 1019.2% 177.5% 0.29 205.2% 85.0% 0.62
ELLICOTT 22 EL PASO 1,027 33% 7.01 33.7% 68.1% 0.39 16.3% Was 0.00 in 09-10 1.85 27.5% -27.3% 1.21
STRASBURG 31J ADAMS 1,001 15% 8.49 105.6% 59.1% 0.00 * * 0.00 * * 0.49
BUENA VISTA R-31 CHAFFEE 994 15% 2.72 -26.9% -60.6% 0.10 -2.5% * 0.00 * * 0.42
CLEAR CREEK RE-1 CLEAR CREEK 959 13% 5.42 1.6% 10.8% 0.42 Was 0.00 in 09-10 Was 0.00 in 09-10 1.25 143.8% 35.4% 2.38
ROCKY FORD R-2 OTERO 825 74% 13.33 -38.7% -31.0% 1.58 -13.5% -57.4% 0.97 21.6% -17.1% 2.16
YUMA 1 YUMA 816 53% 10.78 21.6% -10.0% 0.12 Was 0.00 in 09-10 Was 0.00 in 09-10 0.00 -100.0% -100.0% 1.08
BURLINGTON RE-6J KIT CARSON 814 43% 14.86 334.8% 499.8% 0.25 Was 0.00 in 09-10 Was 0.00 in 09-10 0.25 0.6% Was 0.00 in 09-10 2.63
TELLURIDE R-1 SAN MIGUEL 806 20% 1.49 -42.2% -4.1% 0.00 -100.0% * 0.00 -100.0% -100.0% 5.44
DOLORES RE-4A MONTEZUMA 784 16% 6.51 24.8% 65.2% 0.26 -54.7% Was 0.00 in 09-10 0.64 -35.3% Was 0.00 in 09-10 1.80
AULT-HIGHLAND RE-9 WELD 770 37% 3.12 -53.8% -32.6% 0.13 -64.7% -100.0% 1.43 133.1% 629.5% 1.70
WRAY RD-2 YUMA 741 28% 2.29 -32.9% -52.5% 0.00 -100.0% -100.0% 0.00 -100.0% * 1.41
IGNACIO 11 JT LA PLATA 718 66% 7.94 2.1% -32.9% 0.42 11.0% 5.1% 0.00 * * 0.59
MEEKER RE1 RIO BLANCO 699 18% 4.86 -26.8% -46.4% 0.00 -100.0% * 1.86 119.1% 7.1% 0.93
PEYTON 23 JT EL PASO 656 17% 1.37 90.4% -26.6% 0.00 * * 0.46 217.4% -100.0% 1.00
HOLYOKE RE-1J PHILLIPS 630 44% 1.59 25.2% 72.1% 0.00 * * 0.00 * * 5.00
CENTER 26 JT SAGUACHE 623 95% 2.73 -79.1% -81.3% 0.16 -86.1% -86.6% 0.00 -100.0% -100.0% 0.43
PARK COUNTY RE-2 PARK 581 16% 1.55 -37.5% 82.6% 0.17 Was 0.00 in 09-10 * 1.03 212.4% -100.0% 1.23
BYERS 32J ARAPAHOE 563 17% 1.42 -47.5% -89.9% 0.00 * * 0.00 -100.0% -100.0% 0.69
22
DistrictsOUT-OF-SCHOOL SUSPENSIONS EXPULSIONS REFERRALS TO LAW ENFORCEMENT RACIAL
INEQUALITY INDEX
District County Total Student Population
% Students of Color
2012-13 Rate per 100 Students
Change from 2009-10 to 2012-13 - All Students
Change from 2009-10 to 2012-13 - Students of Color
2012-13 Rate per 100 Students
Change from 2009-10 to 2012-13
Change from 2009-10 to 2012-13 - Students of Color
2012-13 Rate per 100 Students
Change from 2009-10 to 2012-13
Change from 2009-10 to 2012-13 - Students of Color
2012 - 2013
EAST OTERO R-1 OTERO 1,307 68% 11.71 48.4% 26.3% 0.38 404.2% Was 0.00 in 09-10 0.00 -100.0% -100.0% 0.66
EAST GRAND 2 GRAND 1,245 14% 0.80 -66.0% 10.3% 0.08 -61.5% * 0.48 -50.5% -100.0% 0.82
TRINIDAD 1 LAS ANIMAS 1,198 71% 20.70 32.4% 19.2% 0.00 -100.0% -100.0% 1.09 -30.9% -47.2% 0.85
LAKE COUNTY R-1 LAKE 1,167 71% 18.68 64.7% 91.7% 0.17 -81.2% -75.1% 3.08 272.6% 365.5% 1.48
SALIDA R-32 CHAFFEE 1,156 19% 4.07 76.5% 195.6% 0.00 -100.0% -100.0% 0.61 557.0% 178.2% 2.71
JULESBURG RE-1 SEDGWICK 1,154 29% 0.95 489.6% -48.0% 0.00 -100.0% * 0.00 * * 0.25
MONTE VISTA C-8 RIO GRANDE 1,139 75% 2.63 -51.4% -55.8% 0.18 -65.4% -84.4% 0.09 Was 0.00 in 09-10 Was 0.00 in 09-10 1.52
ESTES PARK R-3 LARIMER 1,139 27% 4.83 0.7% -24.0% 0.09 -90.3% -100.0% 0.53 -64.6% -76.5% 1.19
GARFIELD 16 GARFIELD 1,126 39% 3.55 -44.7% -72.8% 0.09 Was 0.00 in 09-10 * 0.00 -100.0% -100.0% 0.32
PLATTE CANYON 1 PARK 1,089 15% 4.59 -23.6% -73.9% 0.18 -42.7% * 0.09 -80.9% * 0.45
PLATTE VALLEY RE-7 WELD 1,047 31% 6.88 -12.3% 20.9% 0.00 -100.0% * 0.00 * * 1.71
BENNETT 29J ADAMS 1,044 24% 8.43 -18.1% -49.1% 0.10 Was 0.00 in 09-10 * 0.00 -100.0% -100.0% 0.63
NORTH CONEJOS RE-1J CONEJOS 1,033 63% 4.65 -38.2% -56.9% 1.06 1019.2% 177.5% 0.29 205.2% 85.0% 0.62
ELLICOTT 22 EL PASO 1,027 33% 7.01 33.7% 68.1% 0.39 16.3% Was 0.00 in 09-10 1.85 27.5% -27.3% 1.21
STRASBURG 31J ADAMS 1,001 15% 8.49 105.6% 59.1% 0.00 * * 0.00 * * 0.49
BUENA VISTA R-31 CHAFFEE 994 15% 2.72 -26.9% -60.6% 0.10 -2.5% * 0.00 * * 0.42
CLEAR CREEK RE-1 CLEAR CREEK 959 13% 5.42 1.6% 10.8% 0.42 Was 0.00 in 09-10 Was 0.00 in 09-10 1.25 143.8% 35.4% 2.38
ROCKY FORD R-2 OTERO 825 74% 13.33 -38.7% -31.0% 1.58 -13.5% -57.4% 0.97 21.6% -17.1% 2.16
YUMA 1 YUMA 816 53% 10.78 21.6% -10.0% 0.12 Was 0.00 in 09-10 Was 0.00 in 09-10 0.00 -100.0% -100.0% 1.08
BURLINGTON RE-6J KIT CARSON 814 43% 14.86 334.8% 499.8% 0.25 Was 0.00 in 09-10 Was 0.00 in 09-10 0.25 0.6% Was 0.00 in 09-10 2.63
TELLURIDE R-1 SAN MIGUEL 806 20% 1.49 -42.2% -4.1% 0.00 -100.0% * 0.00 -100.0% -100.0% 5.44
DOLORES RE-4A MONTEZUMA 784 16% 6.51 24.8% 65.2% 0.26 -54.7% Was 0.00 in 09-10 0.64 -35.3% Was 0.00 in 09-10 1.80
AULT-HIGHLAND RE-9 WELD 770 37% 3.12 -53.8% -32.6% 0.13 -64.7% -100.0% 1.43 133.1% 629.5% 1.70
WRAY RD-2 YUMA 741 28% 2.29 -32.9% -52.5% 0.00 -100.0% -100.0% 0.00 -100.0% * 1.41
IGNACIO 11 JT LA PLATA 718 66% 7.94 2.1% -32.9% 0.42 11.0% 5.1% 0.00 * * 0.59
MEEKER RE1 RIO BLANCO 699 18% 4.86 -26.8% -46.4% 0.00 -100.0% * 1.86 119.1% 7.1% 0.93
PEYTON 23 JT EL PASO 656 17% 1.37 90.4% -26.6% 0.00 * * 0.46 217.4% -100.0% 1.00
HOLYOKE RE-1J PHILLIPS 630 44% 1.59 25.2% 72.1% 0.00 * * 0.00 * * 5.00
CENTER 26 JT SAGUACHE 623 95% 2.73 -79.1% -81.3% 0.16 -86.1% -86.6% 0.00 -100.0% -100.0% 0.43
PARK COUNTY RE-2 PARK 581 16% 1.55 -37.5% 82.6% 0.17 Was 0.00 in 09-10 * 1.03 212.4% -100.0% 1.23
BYERS 32J ARAPAHOE 563 17% 1.42 -47.5% -89.9% 0.00 * * 0.00 -100.0% -100.0% 0.69
23
DistrictsOUT-OF-SCHOOL SUSPENSIONS EXPULSIONS REFERRALS TO LAW ENFORCEMENT RACIAL
INEQUALITY INDEX
District County Total Student Population
% Students of Color
2012-13 Rate per 100 Students
Change from 2009-10 to 2012-13 - All Students
Change from 2009-10 to 2012-13 - Students of Color
2012-13 Rate per 100 Students
Change from 2009-10 to 2012-13
Change from 2009-10 to 2012-13 - Students of Color
2012-13 Rate per 100 Students
Change from 2009-10 to 2012-13
Change from 2009-10 to 2012-13 - Students of Color
2012 - 2013
RANGELY RE-4 RIO BLANCO 561 14% 1.96 -1.0% * 0.00 -100.0% * 0.00 * * 0.00
WIGGINS RE-50(J) MORGAN 550 31% 1.27 -55.0% -100.0% 0.00 -100.0% * 0.00 * * 0.00
LAS ANIMAS RE-1 BENT 523 46% 8.22 39.1% 30.9% 0.00 -100.0% -100.0% 0.00 -100.0% -100.0% 1.10
HUERFANO RE-1 HUERFANO 520 71% 7.69 25.5% -13.5% 0.19 -70.2% -60.2% 0.77 -31.9% -76.1% 0.43
CALHAN RJ-1 EL PASO 510 15% 0.39 -90.4% -100.0% 0.00 * * 0.00 * * 0.00
PLATEAU VALLEY 50 MESA 508 25% 2.56 25.1% Was 0.00 in 09-10 0.39 Was 0.00 in 09-10 * 0.20 Was 0.00 in 09-10 * 0.71
DEL NORTE C-7 RIO GRANDE 475 58% 10.74 23.3% 13.9% 0.00 -100.0% * 0.63 -37.2% -100.0% 0.92
BRANSON REORGANIZED 82 LAS ANIMAS 452 40% 0.22 Was 0.00 in 09-10 * 0.00 * * 0.00 * * 0.00
SARGENT RE-33J RIO GRANDE 449 30% 3.12 88.6% 739.1% 0.00 -100.0% * 0.00 * * 4.28
LIMON RE-4J LINCOLN 447 18% 0.89 -85.2% -82.5% 0.00 * * 0.00 -100.0% * 1.55
CROWLEY COUNTY RE-1-J CROWLEY 446 36% 3.36 -7.5% 87.5% 0.00 * * 0.00 * * 3.58
WEST GRAND 1-JT. GRAND 434 26% 2.76 13.4% -65.9% 0.00 * * 0.69 55.9% * 0.20
SOUTH ROUTT RE 3 ROUTT 419 11% 2.15 -57.5% -100.0% 0.00 * * 1.67 -27.3% * 0.00
CUSTER COUNTY SCHOOL DISTRICT C-1 CUSTER 414 8% 10.39 167.3% Was 0.00 in 09-10 0.48 Was 0.00 in 09-10 Was 0.00 in 09-10 0.00 -100.0% * 1.40
FOWLER R-4J OTERO 409 22% 3.42 -23.6% 154.3% 0.00 * * 0.00 * * 0.94
HAYDEN RE-1 ROUTT 406 14% 2.71 31.9% Was 0.00 in 09-10 0.00 * * 0.74 Was 0.00 in 09-10 * 3.55
MANCOS RE-6 MONTEZUMA 396 21% 8.84 6.3% 10.6% 0.51 Was 0.00 in 09-10 * 0.00 * * 1.01
HOEHNE REORGANIZED 3 LAS ANIMAS 385 51% 4.94 103.0% 67.6% 0.00 * * 0.00 -100.0% * 2.07
KIOWA C-2 ELBERT 383 16% 5.48 110.0% 101.6% 0.52 Was 0.00 in 09-10 * 0.26 Was 0.00 in 09-10 * 0.75
CRIPPLE CREEK-VICTOR RE-1 TELLER 377 16% 6.37 -52.6% -44.0% 0.27 -37.8% * 1.86 -60.4% -78.2% 2.31
GILPIN COUNTY RE-1 GILPIN 373 20% 3.22 -27.4% -74.3% 0.00 -100.0% * 1.88 238.7% Was 0.00 in 09-10 0.73
SANFORD 6J CONEJOS 360 33% 5.28 28.2% -37.7% 0.28 Was 0.00 in 09-10 * 0.00 * * 0.69
AKRON R-1 WASHINGTON 354 19% 2.54 -59.3% -57.4% 0.00 * * 0.56 Was 0.00 in 09-10 * 0.42
SWINK 33 OTERO 346 35% 2.89 118.5% -1.7% 0.00 * * 0.00 * * 0.47
RIDGWAY R-2 OURAY 336 16% 0.89 -66.1% -100.0% 0.00 * * 0.00 * * 0.00
HAXTUN RE-2J PHILLIPS 331 10% 0.00 -100.0% -100.0% 0.00 * * 0.00 * * *
BUFFALO RE-4J LOGAN 319 15% 6.27 113.2% Was 0.00 in 09-10 0.00 * * 0.00 * * 0.30
SANGRE DE CRISTO RE-22J ALAMOSA 316 38% 0.63 -79.6% -100.0% 0.00 * * 0.00 * * 0.00
SPRINGFIELD RE-4 BACA 312 20% 3.53 Was 0.00 in 09-10 Was 0.00 in 09-10 0.32 -3.8% Was 0.00 in 09-10 0.32 Was 0.00 in 09-10 Was 0.00 in 09-10 3.39
BIG SANDY 100J ELBERT 300 17% 0.67 -83.6% Was 0.00 in 09-10 0.67 112.7% Was 0.00 in 09-10 1.33 -67.3% Was 0.00 in 09-10 4.77
24
DistrictsOUT-OF-SCHOOL SUSPENSIONS EXPULSIONS REFERRALS TO LAW ENFORCEMENT RACIAL
INEQUALITY INDEX
District County Total Student Population
% Students of Color
2012-13 Rate per 100 Students
Change from 2009-10 to 2012-13 - All Students
Change from 2009-10 to 2012-13 - Students of Color
2012-13 Rate per 100 Students
Change from 2009-10 to 2012-13
Change from 2009-10 to 2012-13 - Students of Color
2012-13 Rate per 100 Students
Change from 2009-10 to 2012-13
Change from 2009-10 to 2012-13 - Students of Color
2012 - 2013
RANGELY RE-4 RIO BLANCO 561 14% 1.96 -1.0% * 0.00 -100.0% * 0.00 * * 0.00
WIGGINS RE-50(J) MORGAN 550 31% 1.27 -55.0% -100.0% 0.00 -100.0% * 0.00 * * 0.00
LAS ANIMAS RE-1 BENT 523 46% 8.22 39.1% 30.9% 0.00 -100.0% -100.0% 0.00 -100.0% -100.0% 1.10
HUERFANO RE-1 HUERFANO 520 71% 7.69 25.5% -13.5% 0.19 -70.2% -60.2% 0.77 -31.9% -76.1% 0.43
CALHAN RJ-1 EL PASO 510 15% 0.39 -90.4% -100.0% 0.00 * * 0.00 * * 0.00
PLATEAU VALLEY 50 MESA 508 25% 2.56 25.1% Was 0.00 in 09-10 0.39 Was 0.00 in 09-10 * 0.20 Was 0.00 in 09-10 * 0.71
DEL NORTE C-7 RIO GRANDE 475 58% 10.74 23.3% 13.9% 0.00 -100.0% * 0.63 -37.2% -100.0% 0.92
BRANSON REORGANIZED 82 LAS ANIMAS 452 40% 0.22 Was 0.00 in 09-10 * 0.00 * * 0.00 * * 0.00
SARGENT RE-33J RIO GRANDE 449 30% 3.12 88.6% 739.1% 0.00 -100.0% * 0.00 * * 4.28
LIMON RE-4J LINCOLN 447 18% 0.89 -85.2% -82.5% 0.00 * * 0.00 -100.0% * 1.55
CROWLEY COUNTY RE-1-J CROWLEY 446 36% 3.36 -7.5% 87.5% 0.00 * * 0.00 * * 3.58
WEST GRAND 1-JT. GRAND 434 26% 2.76 13.4% -65.9% 0.00 * * 0.69 55.9% * 0.20
SOUTH ROUTT RE 3 ROUTT 419 11% 2.15 -57.5% -100.0% 0.00 * * 1.67 -27.3% * 0.00
CUSTER COUNTY SCHOOL DISTRICT C-1 CUSTER 414 8% 10.39 167.3% Was 0.00 in 09-10 0.48 Was 0.00 in 09-10 Was 0.00 in 09-10 0.00 -100.0% * 1.40
FOWLER R-4J OTERO 409 22% 3.42 -23.6% 154.3% 0.00 * * 0.00 * * 0.94
HAYDEN RE-1 ROUTT 406 14% 2.71 31.9% Was 0.00 in 09-10 0.00 * * 0.74 Was 0.00 in 09-10 * 3.55
MANCOS RE-6 MONTEZUMA 396 21% 8.84 6.3% 10.6% 0.51 Was 0.00 in 09-10 * 0.00 * * 1.01
HOEHNE REORGANIZED 3 LAS ANIMAS 385 51% 4.94 103.0% 67.6% 0.00 * * 0.00 -100.0% * 2.07
KIOWA C-2 ELBERT 383 16% 5.48 110.0% 101.6% 0.52 Was 0.00 in 09-10 * 0.26 Was 0.00 in 09-10 * 0.75
CRIPPLE CREEK-VICTOR RE-1 TELLER 377 16% 6.37 -52.6% -44.0% 0.27 -37.8% * 1.86 -60.4% -78.2% 2.31
GILPIN COUNTY RE-1 GILPIN 373 20% 3.22 -27.4% -74.3% 0.00 -100.0% * 1.88 238.7% Was 0.00 in 09-10 0.73
SANFORD 6J CONEJOS 360 33% 5.28 28.2% -37.7% 0.28 Was 0.00 in 09-10 * 0.00 * * 0.69
AKRON R-1 WASHINGTON 354 19% 2.54 -59.3% -57.4% 0.00 * * 0.56 Was 0.00 in 09-10 * 0.42
SWINK 33 OTERO 346 35% 2.89 118.5% -1.7% 0.00 * * 0.00 * * 0.47
RIDGWAY R-2 OURAY 336 16% 0.89 -66.1% -100.0% 0.00 * * 0.00 * * 0.00
HAXTUN RE-2J PHILLIPS 331 10% 0.00 -100.0% -100.0% 0.00 * * 0.00 * * *
BUFFALO RE-4J LOGAN 319 15% 6.27 113.2% Was 0.00 in 09-10 0.00 * * 0.00 * * 0.30
SANGRE DE CRISTO RE-22J ALAMOSA 316 38% 0.63 -79.6% -100.0% 0.00 * * 0.00 * * 0.00
SPRINGFIELD RE-4 BACA 312 20% 3.53 Was 0.00 in 09-10 Was 0.00 in 09-10 0.32 -3.8% Was 0.00 in 09-10 0.32 Was 0.00 in 09-10 Was 0.00 in 09-10 3.39
BIG SANDY 100J ELBERT 300 17% 0.67 -83.6% Was 0.00 in 09-10 0.67 112.7% Was 0.00 in 09-10 1.33 -67.3% Was 0.00 in 09-10 4.77
25
DistrictsOUT-OF-SCHOOL SUSPENSIONS EXPULSIONS REFERRALS TO LAW ENFORCEMENT RACIAL
INEQUALITY INDEX
District County Total Student Population
% Students of Color
2012-13 Rate per 100 Students
Change from 2009-10 to 2012-13 - All Students
Change from 2009-10 to 2012-13 - Students of Color
2012-13 Rate per 100 Students
Change from 2009-10 to 2012-13
Change from 2009-10 to 2012-13 - Students of Color
2012-13 Rate per 100 Students
Change from 2009-10 to 2012-13
Change from 2009-10 to 2012-13 - Students of Color
2012 - 2013
WEST END RE-2 MONTROSE 293 12% 7.85 4.5% -100.0% 0.68 Was 0.00 in 09-10 * 0.00 * * 0.00
HOLLY RE-3 PROWERS 292 50% 2.74 -0.3% 18.4% 0.00 -100.0% -100.0% 0.00 -100.0% -100.0% 3.00
DOLORES COUNTY RE NO.2 DOLORES 288 5% 1.74 -78.9% -100.0% 0.00 * * 0.00 * * 0.00
NORWOOD R-2J SAN MIGUEL 275 12% 7.27 896.4% 641.2% 0.00 -100.0% * 0.00 * * 5.80
MC CLAVE RE-2 BENT 272 31% 4.41 90.4% 122.4% 0.00 * * 0.00 * * 6.60
SIERRA GRANDE R-30 COSTILLA 270 83% 11.48 163.0% 139.1% 0.37 -53.3% -100.0% 0.00 -100.0% -100.0% 0.39
MIAMI/YODER 60 JT EL PASO 268 19% 1.49 -45.4% Was 0.00 in 09-10 0.37 Was 0.00 in 09-10 * 0.00 * * 2.77
WILEY RE-13 JT PROWERS 242 27% 1.65 Was 0.00 in 09-10 Was 0.00 in 09-10 0.00 * * 0.83 Was 0.00 in 09-10 Was 0.00 in 09-10 2.67
HANOVER 28 EL PASO 227 41% 2.64 -41.4% -82.4% 0.00 * * 0.00 -100.0% -100.0% 0.28
LA VETA RE-2 HUERFANO 226 30% 4.87 -11.7% -16.4% 0.00 * * 0.00 * * 0.89
CHERAW 31 OTERO 222 23% 3.15 -26.4% -100.0% 0.00 * * 0.45 Was 0.00 in 09-10 * 0.00
COTOPAXI RE-3 FREMONT 220 10% 5.00 -67.1% 9.1% 0.00 -100.0% * 0.00 * * 2.00
GRANADA RE-1 PROWERS 218 71% 4.13 -33.1% -29.5% 0.46 Was 0.00 in 09-10 Was 0.00 in 09-10 0.00 -100.0% -100.0% 0.95
VILAS RE-5 BACA 216 28% 3.24 572.5% Was 0.00 in 09-10 0.00 * * 0.00 * * 0.43
MOFFAT 2 SAGUACHE 210 18% 0.00 * * 0.00 * * 0.00 * * *
WELDON VALLEY RE-20(J) MORGAN 210 12% 0.00 -100.0% -100.0% 0.00 * * 0.00 * * *
ELBERT 200 ELBERT 209 11% 1.91 -34.7% * 0.00 * * 0.00 -100.0% * 0.00
SOUTH CONEJOS RE-10 CONEJOS 208 92% 9.13 -59.4% -58.9% 0.00 -100.0% -100.0% 0.00 * * *
NORTH PARK R-1 JACKSON 206 26% 0.00 -100.0% * 0.00 -100.0% * 0.49 -62.8% * 0.00
CHEYENNE COUNTY RE-5 CHEYENNE 203 22% 2.46 55.2% 54.5% 0.00 * * 0.00 * * 2.41
FRENCHMAN RE-3 LOGAN 202 12% 0.50 -53.5% * 0.00 * * 0.00 * * 0.00
OTIS R-3 WASHINGTON 200 10% 4.50 -39.7% Was 0.00 in 09-10 0.50 Was 0.00 in 09-10 Was 0.00 in 09-10 0.00 * * 13.50
PRIMERO REORGANIZED 2 LAS ANIMAS 198 48% 6.06 -68.2% -81.8% 0.00 -100.0% -100.0% 0.00 -100.0% -100.0% 0.53
PLATEAU RE-5 LOGAN 197 5% 4.06 120.6% Was 0.00 in 09-10 0.00 * * 0.51 Was 0.00 in 09-10 * 2.34
CENTENNIAL R-1 COSTILLA 190 95% 0.00 * * 0.00 * * 0.00 * * *
IDALIA RJ-3 YUMA 186 26% 0.00 * * 0.00 * * 0.00 * * *
STRATTON R-4 KIT CARSON 186 20% 2.15 -35.8% -66.7% 0.00 * * 0.00 * * 1.34
EDISON 54 JT EL PASO 185 7% 0.00 -100.0% * 0.00 * * 0.00 -100.0% * *
DEER TRAIL 26J ARAPAHOE 185 17% 0.00 -100.0% -100.0% 0.00 * * 0.00 * * *
OURAY R-1 OURAY 184 12% 4.35 -23.1% -100.0% 0.00 * * 0.54 -37.5% * 0.00
PRAIRIE RE-11 WELD 181 14% 0.00 -100.0% -100.0% 0.00 * * 0.00 * * *
26
DistrictsOUT-OF-SCHOOL SUSPENSIONS EXPULSIONS REFERRALS TO LAW ENFORCEMENT RACIAL
INEQUALITY INDEX
District County Total Student Population
% Students of Color
2012-13 Rate per 100 Students
Change from 2009-10 to 2012-13 - All Students
Change from 2009-10 to 2012-13 - Students of Color
2012-13 Rate per 100 Students
Change from 2009-10 to 2012-13
Change from 2009-10 to 2012-13 - Students of Color
2012-13 Rate per 100 Students
Change from 2009-10 to 2012-13
Change from 2009-10 to 2012-13 - Students of Color
2012 - 2013
WEST END RE-2 MONTROSE 293 12% 7.85 4.5% -100.0% 0.68 Was 0.00 in 09-10 * 0.00 * * 0.00
HOLLY RE-3 PROWERS 292 50% 2.74 -0.3% 18.4% 0.00 -100.0% -100.0% 0.00 -100.0% -100.0% 3.00
DOLORES COUNTY RE NO.2 DOLORES 288 5% 1.74 -78.9% -100.0% 0.00 * * 0.00 * * 0.00
NORWOOD R-2J SAN MIGUEL 275 12% 7.27 896.4% 641.2% 0.00 -100.0% * 0.00 * * 5.80
MC CLAVE RE-2 BENT 272 31% 4.41 90.4% 122.4% 0.00 * * 0.00 * * 6.60
SIERRA GRANDE R-30 COSTILLA 270 83% 11.48 163.0% 139.1% 0.37 -53.3% -100.0% 0.00 -100.0% -100.0% 0.39
MIAMI/YODER 60 JT EL PASO 268 19% 1.49 -45.4% Was 0.00 in 09-10 0.37 Was 0.00 in 09-10 * 0.00 * * 2.77
WILEY RE-13 JT PROWERS 242 27% 1.65 Was 0.00 in 09-10 Was 0.00 in 09-10 0.00 * * 0.83 Was 0.00 in 09-10 Was 0.00 in 09-10 2.67
HANOVER 28 EL PASO 227 41% 2.64 -41.4% -82.4% 0.00 * * 0.00 -100.0% -100.0% 0.28
LA VETA RE-2 HUERFANO 226 30% 4.87 -11.7% -16.4% 0.00 * * 0.00 * * 0.89
CHERAW 31 OTERO 222 23% 3.15 -26.4% -100.0% 0.00 * * 0.45 Was 0.00 in 09-10 * 0.00
COTOPAXI RE-3 FREMONT 220 10% 5.00 -67.1% 9.1% 0.00 -100.0% * 0.00 * * 2.00
GRANADA RE-1 PROWERS 218 71% 4.13 -33.1% -29.5% 0.46 Was 0.00 in 09-10 Was 0.00 in 09-10 0.00 -100.0% -100.0% 0.95
VILAS RE-5 BACA 216 28% 3.24 572.5% Was 0.00 in 09-10 0.00 * * 0.00 * * 0.43
MOFFAT 2 SAGUACHE 210 18% 0.00 * * 0.00 * * 0.00 * * *
WELDON VALLEY RE-20(J) MORGAN 210 12% 0.00 -100.0% -100.0% 0.00 * * 0.00 * * *
ELBERT 200 ELBERT 209 11% 1.91 -34.7% * 0.00 * * 0.00 -100.0% * 0.00
SOUTH CONEJOS RE-10 CONEJOS 208 92% 9.13 -59.4% -58.9% 0.00 -100.0% -100.0% 0.00 * * *
NORTH PARK R-1 JACKSON 206 26% 0.00 -100.0% * 0.00 -100.0% * 0.49 -62.8% * 0.00
CHEYENNE COUNTY RE-5 CHEYENNE 203 22% 2.46 55.2% 54.5% 0.00 * * 0.00 * * 2.41
FRENCHMAN RE-3 LOGAN 202 12% 0.50 -53.5% * 0.00 * * 0.00 * * 0.00
OTIS R-3 WASHINGTON 200 10% 4.50 -39.7% Was 0.00 in 09-10 0.50 Was 0.00 in 09-10 Was 0.00 in 09-10 0.00 * * 13.50
PRIMERO REORGANIZED 2 LAS ANIMAS 198 48% 6.06 -68.2% -81.8% 0.00 -100.0% -100.0% 0.00 -100.0% -100.0% 0.53
PLATEAU RE-5 LOGAN 197 5% 4.06 120.6% Was 0.00 in 09-10 0.00 * * 0.51 Was 0.00 in 09-10 * 2.34
CENTENNIAL R-1 COSTILLA 190 95% 0.00 * * 0.00 * * 0.00 * * *
IDALIA RJ-3 YUMA 186 26% 0.00 * * 0.00 * * 0.00 * * *
STRATTON R-4 KIT CARSON 186 20% 2.15 -35.8% -66.7% 0.00 * * 0.00 * * 1.34
EDISON 54 JT EL PASO 185 7% 0.00 -100.0% * 0.00 * * 0.00 -100.0% * *
DEER TRAIL 26J ARAPAHOE 185 17% 0.00 -100.0% -100.0% 0.00 * * 0.00 * * *
OURAY R-1 OURAY 184 12% 4.35 -23.1% -100.0% 0.00 * * 0.54 -37.5% * 0.00
PRAIRIE RE-11 WELD 181 14% 0.00 -100.0% -100.0% 0.00 * * 0.00 * * *
27
DistrictsOUT-OF-SCHOOL SUSPENSIONS EXPULSIONS REFERRALS TO LAW ENFORCEMENT RACIAL
INEQUALITY INDEX
District County Total Student Population
% Students of Color
2012-13 Rate per 100 Students
Change from 2009-10 to 2012-13 - All Students
Change from 2009-10 to 2012-13 - Students of Color
2012-13 Rate per 100 Students
Change from 2009-10 to 2012-13
Change from 2009-10 to 2012-13 - Students of Color
2012-13 Rate per 100 Students
Change from 2009-10 to 2012-13
Change from 2009-10 to 2012-13 - Students of Color
2012 - 2013
EADS RE-1 KIOWA 180 15% 0.00 -100.0% * 0.00 * * 0.00 * * *
GENOA-HUGO C113 LINCOLN 176 5% 0.00 -100.0% * 0.00 * * 0.00 * * *
ARRIBA-FLAGLER C-20 KIT CARSON 176 11% 4.55 Was 0.00 in 09-10 * 0.00 * * 0.00 * * 0.00
BRIGGSDALE RE-10 WELD 162 10% 2.47 -0.6% Was 0.00 in 09-10 0.00 * * 0.00 * * 2.84
WALSH RE-1 BACA 158 22% 0.63 Was 0.00 in 09-10 * 0.00 * * 0.00 * * 0.00
DE BEQUE 49JT MESA 135 16% 5.93 -54.9% Was 0.00 in 09-10 0.00 * * 0.00 -100.0% * 5.43
BETHUNE R-5 KIT CARSON 133 39% 1.50 Was 0.00 in 09-10 * 0.00 * * 0.00 * * 0.00
HI-PLAINS R-23 KIT CARSON 131 24% 0.00 * * 0.00 * * 0.00 * * *
MANZANOLA 3J OTERO 131 69% 7.63 -3.5% -45.7% 0.00 * * 6.11 Was 0.00 in 09-10 Was 0.00 in 09-10 0.36
KARVAL RE-23 LINCOLN 122 9% 0.00 * * 0.00 * * 0.00 * * *
MOUNTAIN VALLEY RE 1 SAGUACHE 120 32% 2.50 -36.0% Was 0.00 in 09-10 0.00 * * 0.00 * * 4.32
LONE STAR 101 WASHINGTON 116 9% 0.00 * * 0.00 * * 0.00 * * *
PLATTE VALLEY RE-3 SEDGWICK 114 20% 0.88 Was 0.00 in 09-10 * 0.00 * * 0.88 Was 0.00 in 09-10 * 0.00
KIT CARSON R-1 CHEYENNE 110 15% 0.91 -70.9% * 0.00 * * 0.00 * * 0.00
ARICKAREE R-2 WASHINGTON 108 22% 0.00 -100.0% * 0.00 * * 0.00 * * *
AGUILAR REORGANIZED 6 LAS ANIMAS 97 51% 1.03 -91.9% -88.6% 1.03 37.1% Was 0.00 in 09-10 0.00 * * *
WOODLIN R-104 WASHINGTON 93 15% 2.15 Was 0.00 in 09-10 * 0.00 * * 1.08 Was 0.00 in 09-10 * 0.00
PAWNEE RE-12 WELD 88 5% 1.14 Was 0.00 in 09-10 * 0.00 * * 0.00 * * 0.00
HINSDALE COUNTY RE 1 HINSDALE 81 5% 2.47 -54.1% -100.0% 0.00 * * 0.00 * * 0.00
LIBERTY J-4 YUMA 80 15% 0.00 * * 0.00 * * 0.00 * * *
PLAINVIEW RE-2 KIOWA 80 8% 5.00 38.3% * 0.00 * * 0.00 * * 0.00
CREEDE SCHOOL DISTRICT MINERAL 78 21% 0.00 * * 0.00 * * 0.00 * * *
SILVERTON 1 SAN JUAN 62 34% 8.06 166.1% * 0.00 * * 0.00 * * 0.00
KIM REORGANIZED 88 LAS ANIMAS 51 14% 0.00 * * 0.00 * * 0.00 * * *
CAMPO RE-6 BACA 49 12% 0.00 * * 0.00 * * 0.00 * * *
PRITCHETT RE-3 BACA 47 15% 4.26 2.1% -100.0% 0.00 * * 0.00 * * 0.00
AGATE 300 ELBERT 10 0% 0.00 -100.0% * 0.00 * * 0.00 * * *
28
DistrictsOUT-OF-SCHOOL SUSPENSIONS EXPULSIONS REFERRALS TO LAW ENFORCEMENT RACIAL
INEQUALITY INDEX
District County Total Student Population
% Students of Color
2012-13 Rate per 100 Students
Change from 2009-10 to 2012-13 - All Students
Change from 2009-10 to 2012-13 - Students of Color
2012-13 Rate per 100 Students
Change from 2009-10 to 2012-13
Change from 2009-10 to 2012-13 - Students of Color
2012-13 Rate per 100 Students
Change from 2009-10 to 2012-13
Change from 2009-10 to 2012-13 - Students of Color
2012 - 2013
EADS RE-1 KIOWA 180 15% 0.00 -100.0% * 0.00 * * 0.00 * * *
GENOA-HUGO C113 LINCOLN 176 5% 0.00 -100.0% * 0.00 * * 0.00 * * *
ARRIBA-FLAGLER C-20 KIT CARSON 176 11% 4.55 Was 0.00 in 09-10 * 0.00 * * 0.00 * * 0.00
BRIGGSDALE RE-10 WELD 162 10% 2.47 -0.6% Was 0.00 in 09-10 0.00 * * 0.00 * * 2.84
WALSH RE-1 BACA 158 22% 0.63 Was 0.00 in 09-10 * 0.00 * * 0.00 * * 0.00
DE BEQUE 49JT MESA 135 16% 5.93 -54.9% Was 0.00 in 09-10 0.00 * * 0.00 -100.0% * 5.43
BETHUNE R-5 KIT CARSON 133 39% 1.50 Was 0.00 in 09-10 * 0.00 * * 0.00 * * 0.00
HI-PLAINS R-23 KIT CARSON 131 24% 0.00 * * 0.00 * * 0.00 * * *
MANZANOLA 3J OTERO 131 69% 7.63 -3.5% -45.7% 0.00 * * 6.11 Was 0.00 in 09-10 Was 0.00 in 09-10 0.36
KARVAL RE-23 LINCOLN 122 9% 0.00 * * 0.00 * * 0.00 * * *
MOUNTAIN VALLEY RE 1 SAGUACHE 120 32% 2.50 -36.0% Was 0.00 in 09-10 0.00 * * 0.00 * * 4.32
LONE STAR 101 WASHINGTON 116 9% 0.00 * * 0.00 * * 0.00 * * *
PLATTE VALLEY RE-3 SEDGWICK 114 20% 0.88 Was 0.00 in 09-10 * 0.00 * * 0.88 Was 0.00 in 09-10 * 0.00
KIT CARSON R-1 CHEYENNE 110 15% 0.91 -70.9% * 0.00 * * 0.00 * * 0.00
ARICKAREE R-2 WASHINGTON 108 22% 0.00 -100.0% * 0.00 * * 0.00 * * *
AGUILAR REORGANIZED 6 LAS ANIMAS 97 51% 1.03 -91.9% -88.6% 1.03 37.1% Was 0.00 in 09-10 0.00 * * *
WOODLIN R-104 WASHINGTON 93 15% 2.15 Was 0.00 in 09-10 * 0.00 * * 1.08 Was 0.00 in 09-10 * 0.00
PAWNEE RE-12 WELD 88 5% 1.14 Was 0.00 in 09-10 * 0.00 * * 0.00 * * 0.00
HINSDALE COUNTY RE 1 HINSDALE 81 5% 2.47 -54.1% -100.0% 0.00 * * 0.00 * * 0.00
LIBERTY J-4 YUMA 80 15% 0.00 * * 0.00 * * 0.00 * * *
PLAINVIEW RE-2 KIOWA 80 8% 5.00 38.3% * 0.00 * * 0.00 * * 0.00
CREEDE SCHOOL DISTRICT MINERAL 78 21% 0.00 * * 0.00 * * 0.00 * * *
SILVERTON 1 SAN JUAN 62 34% 8.06 166.1% * 0.00 * * 0.00 * * 0.00
KIM REORGANIZED 88 LAS ANIMAS 51 14% 0.00 * * 0.00 * * 0.00 * * *
CAMPO RE-6 BACA 49 12% 0.00 * * 0.00 * * 0.00 * * *
PRITCHETT RE-3 BACA 47 15% 4.26 2.1% -100.0% 0.00 * * 0.00 * * 0.00
AGATE 300 ELBERT 10 0% 0.00 -100.0% * 0.00 * * 0.00 * * *
29
Metro Denver Area DistrictsSource Data: Colorado Department of Education
DISTRICTS OUT-OF-SCHOOL SUSPENSIONS EXPULSIONS REFERRALS TO LAW ENFORCEMENTRACIAL
INEQUALITY INDEX
County District Total Student Population
% Students of Color
2012-13 Rate per 100 Students
Change from 2009-10 to 2012-13 - All Students
Change from 2009-10 to 2012-13 - Students of Color
2012-13 Rate per 100 Students
Change from 2009-10 to 2012-13
Change from 2009-10 to 2012-13 - Students of Color
2012-13 Rate per 100 Students
Change from 2009-10 to 2012-13
Change from 2009-10 to 2012-13 - Students of Color
2012-2013
JEFFERSON JEFFERSON COUNTY R-1 85,508 32% 6.69 -12.3% -14.8% 0.09 -67.5% -60.7% 1.63 -37.8% -36.6% 1.96
DENVER DENVER COUNTY 1 83,377 79% 7.50 -39.4% -39.8% 0.09 -60.9% -62.7% 0.83 6.8% 5.5% 2.89
DOUGLAS DOUGLAS COUNTY RE 1 64,657 24% 2.52 -15.3% -26.6% 0.12 -15.8% -34.9% 0.22 -42.5% -54.2% 1.69
ARAPAHOE CHERRY CREEK 5 53,368 44% 7.32 -32.5% -36.0% 0.16 -26.9% -34.9% 1.58 -8.4% -13.2% 1.99
ADAMS ADAMS 12 FIVE STAR SCHOOLS 43,268 43% 9.61 -4.7% -6.4% 0.26 -36.3% -29.9% 2.71 0.9% -0.2% 1.88
ARAPAHOE ADAMS-ARAPAHOE 28J 39,835 81% 13.16 -14.6% -16.6% 0.40 -39.0% -38.3% 1.60 -40.9% -41.3% 1.58
ADAMS BRIGHTON 27J 16,163 52% 8.28 -24.2% -17.3% 0.38 11.4% 16.3% 0.88 -45.9% -33.5% 1.49
ARAPAHOE LITTLETON 6 15,754 26% 4.60 -16.3% -39.6% 0.16 -43.2% -84.0% 1.42 -25.7% -44.1% 1.18
ADAMS WESTMINSTER 50 10,069 82% 12.35 -14.8% -19.1% 0.00 -100.0% -100.0% 0.04 -86.0% -86.6% 0.70
ADAMS MAPLETON 1 8,051 71% 8.55 -49.7% -47.8% 0.10 -84.1% -82.1% 0.73 -65.6% -70.6% 1.15
ADAMS ADAMS COUNTY 14 7,500 87% 20.56 -13.0% -17.1% 0.13 -63.3% -64.9% 1.80 -16.5% -13.8% 0.83
ARAPAHOE ENGLEWOOD 1 2,981 41% 13.18 29.9% 59.0% 2.72 346.8% 636.9% 3.25 -2.3% 25.4% 2.12
ARAPAHOE SHERIDAN 2 1,584 84% 16.29 -16.7% -27.9% 0.25 -59.7% -74.2% 1.45 2216.0% 1708.2% 0.52
30
DISTRICTS OUT-OF-SCHOOL SUSPENSIONS EXPULSIONS REFERRALS TO LAW ENFORCEMENTRACIAL
INEQUALITY INDEX
County District Total Student Population
% Students of Color
2012-13 Rate per 100 Students
Change from 2009-10 to 2012-13 - All Students
Change from 2009-10 to 2012-13 - Students of Color
2012-13 Rate per 100 Students
Change from 2009-10 to 2012-13
Change from 2009-10 to 2012-13 - Students of Color
2012-13 Rate per 100 Students
Change from 2009-10 to 2012-13
Change from 2009-10 to 2012-13 - Students of Color
2012-2013
JEFFERSON JEFFERSON COUNTY R-1 85,508 32% 6.69 -12.3% -14.8% 0.09 -67.5% -60.7% 1.63 -37.8% -36.6% 1.96
DENVER DENVER COUNTY 1 83,377 79% 7.50 -39.4% -39.8% 0.09 -60.9% -62.7% 0.83 6.8% 5.5% 2.89
DOUGLAS DOUGLAS COUNTY RE 1 64,657 24% 2.52 -15.3% -26.6% 0.12 -15.8% -34.9% 0.22 -42.5% -54.2% 1.69
ARAPAHOE CHERRY CREEK 5 53,368 44% 7.32 -32.5% -36.0% 0.16 -26.9% -34.9% 1.58 -8.4% -13.2% 1.99
ADAMS ADAMS 12 FIVE STAR SCHOOLS 43,268 43% 9.61 -4.7% -6.4% 0.26 -36.3% -29.9% 2.71 0.9% -0.2% 1.88
ARAPAHOE ADAMS-ARAPAHOE 28J 39,835 81% 13.16 -14.6% -16.6% 0.40 -39.0% -38.3% 1.60 -40.9% -41.3% 1.58
ADAMS BRIGHTON 27J 16,163 52% 8.28 -24.2% -17.3% 0.38 11.4% 16.3% 0.88 -45.9% -33.5% 1.49
ARAPAHOE LITTLETON 6 15,754 26% 4.60 -16.3% -39.6% 0.16 -43.2% -84.0% 1.42 -25.7% -44.1% 1.18
ADAMS WESTMINSTER 50 10,069 82% 12.35 -14.8% -19.1% 0.00 -100.0% -100.0% 0.04 -86.0% -86.6% 0.70
ADAMS MAPLETON 1 8,051 71% 8.55 -49.7% -47.8% 0.10 -84.1% -82.1% 0.73 -65.6% -70.6% 1.15
ADAMS ADAMS COUNTY 14 7,500 87% 20.56 -13.0% -17.1% 0.13 -63.3% -64.9% 1.80 -16.5% -13.8% 0.83
ARAPAHOE ENGLEWOOD 1 2,981 41% 13.18 29.9% 59.0% 2.72 346.8% 636.9% 3.25 -2.3% 25.4% 2.12
ARAPAHOE SHERIDAN 2 1,584 84% 16.29 -16.7% -27.9% 0.25 -59.7% -74.2% 1.45 2216.0% 1708.2% 0.52
Red box =one of the 25 highest in the state Orange box =a rate that is increasingLEGEND

Padres & Jóvenes Unidoswww.padresunidos.org(303) 458-6545