the colorado river reservoir study: implications for water...
TRANSCRIPT

The Colorado River Reservoir Study: Implications for Water Supply, Hydropower
Generation and Recreational Use of Declining Water Levels in Lake Powell and
Lake Mead
Work Plan May 28, 2014
Master’s Group Project
Bren School of Environmental Science and Management University of California, Santa Barbara
Project Members
Ning Jiang | Season Martin | Julia Morton | Skyler Murphy
Faculty Advisor Naomi Tague, PhD
External Advisors
Bob Wilkinson, PhD | Ken Nowak, PhD
Client Douglas Kenney, PhD | Western Water Policy Project

Table of Contents
Executive Summary .......................................................................... 1
Significance ...................................................................................... 2
Objectives ........................................................................................ 2
Literature Review ............................................................................. 4 Background .............................................................................................. 4 Colorado River Basin Governance ............................................................. 6 River Operations ...................................................................................... 7 Water Supply and Delivery Systems ......................................................... 9 Hydropower Generation ......................................................................... 10 Recreation .............................................................................................. 11 Environmental Impacts .......................................................................... 12
Technical Approach and Data Catalog ............................................. 13
Deliverables.................................................................................... 18 Western Water Policy Project: .................................................................. 18 Bren School of Environmental Science and Management: ............................ 18
Milestones ...................................................................................... 18
Group Structure and Management .................................................. 19 Client: ................................................................................................... 19 Faculty Advisor: ..................................................................................... 19 Job Definitions: ...................................................................................... 19 Meeting Structure: ................................................................................. 19 Guidelines for interacting with faculty advisors, clients and external advisors: 20 System to Ensure Deadlines are Met: ........................................................ 20 Procedures for Documenting, Cataloging, and Archiving Information:............ 20 Overall Expectations of Group Members: ................................................... 20 Overall Expectations of the Faculty Advisor:............................................... 20 Conflict Resolution Process: ..................................................................... 20
Budget ............................................................................................ 21
Bibliography ................................................................................... 22

1| Colorado River Reservoir Study
Executive Summary
Much of the western United States depends on the Colorado River for municipal water supply and agricultural irrigation, making it one of the most important and over allocated natural resources in the nation. In addition to water resources, the Colorado River is an important source of hydroelectricity, water recreation, tourism and ecological habitat (Senate Energy and Natural Resources Committee, 2013). Supporting approximately 40 million people and irrigating over 1.8 million acres of land across seven states and two countries, virtually every drop of the Colorado River is allocated to a consumptive use (Bureau of Reclamation, 2012). With some of the nation’s fasted growing urban populations dependent on the river for their water supply, demand for the water is steadily growing. With the addition of climatic variability and prolonged drought, water levels in key storage reservoirs Lake Mead and Lake Powell have dropped to precipitously levels recently, increasing stress on current water availability in the basin.
To begin addressing potential water shortages, the Department of Interior issued the Colorado River Interim Guidelines in 2007. Predominantly focused on water allocations to the Lower Basin states (California, Arizona and Nevada), the guidelines specify water levels in Lake Powell and Lake Mead that trigger equalization between the two reservoirs and delivery curtailments from Lake Mead. It is likely that Lake Mead will drop below 1,075’ by 2016, triggering the first set of mandated curtailments set forth in the agreement (Pitt, 2014).
Utilizing designated thresholds specified in the Interim Guidelines—Lake Mead (1,075’, 1,050’, 1,025’, and 1,000’), and Lake Powell (3,575’ and 3,525’)--this project will evaluate the impacts of declining reservoir levels on key users in the Lower Colorado River Basin. Specifically, the project will explore:
1. Operational and financial implications of reduced reservoir levels on hydropower generation at Glen Canyon Dam and Hoover Dam.
2. Changes in water deliveries from Lake Mead within the Lower Basin States. 3. Recreational use changes on Lake Powell and Lake Mead, and associated changes in revenue for
key stakeholders. 4. Ecological and water quality impacts to the Lower Colorado River Basin.
A multi-faceted approach is necessary to adequately achieve the project objectives. Focused literature reviews and interviews with key river and sector experts will develop a thorough understanding of the processes and policies behind targeted impacts. Utilizing existing models of hydropower generation from each dam, financial impacts of power generation changes to energy contractors will be quantified at each threshold level. After developing a model to determine the relationship between reservoir levels and recreational use historically, focused case studies of the National Park Service and the local economy of Page, AZ will illuminate the financial impact of the decreased water levels in question.
A focused review of state priority water rights and water use by sector will be compiled to understand how water is distributed across the Lower Basin and how different sectors will be affected as deliveries are curtailed at each threshold level. Several allocation scenarios for 1,000’ Lake Mead levels will be explored increase understanding of potential impacts at that level. To understand ecological and water quality impacts, current literature will be synthesized, and changes in hydropower revenue available to key environmental programs in the basin will be quantified.
Ultimately, the project will outline the impacts of declining reservoir levels on hydropower generation, water deliveries, recreational users and ecosystems. An integrated comprehensive analysis of the implications of declining reservoirs is timely, and essential for a sustainable future Colorado River.

2| Colorado River Reservoir Study
Significance
The Colorado River is arguably one of the single most important natural resources in the western United States. It is an important source of drinking water, electricity generation, agricultural irrigation, recreation, tourism, and supports one of the largest riparian corridors in the West (Senate Energy and Natural Resources Committee, 2013). Spanning seven states and two countries, it supports approximately 40 million people (Bureau of Reclamation, 2012). Some of the country’s fastest growing urban populations depend on the river for water supply, rapidly increasing demand. Furthermore, significant natural stream variability has decreased annual flows since the river was first apportioned in 1922. Increasing demand and decreasing flows are already creating allocation problems within the Colorado River Basin. Numerous studies have quantified decreases in the basin’s future flow. Despite projection differences, it is widely accepted that temperature increases from climatic variability will further diminish stream flow making the supply-demand imbalance a permanent reality for the Colorado River (Vano et al., 2014).
Lake Mead and Lake Powell, key reservoirs created to mitigate supply issues from flow variability, have reached record low levels in the past several years due to prolonged drought and high demand. In addition to the obvious supply issues this presents, low water levels carry additional implications for the diverse user groups relying on the Colorado River. The Department of Interior started to address potential shortage issues through the Colorado River Interim Guidelines for Lower Basin Shortages and Coordinated Operations of Lake Powell and Lake Mead in 2007. Predominantly focused on Lower Basin state allocations, the Interim Guidelines specify threshold Lake Mead reservoir levels that will trigger Powell-Mead equalization and delivery curtailments from Mead (1,075’, 1,050’ and 1,025’ feet above average sea level).
It is not a question of if, but when, these threshold reservoir levels are reached as persistent drought conditions and climatic variability pose significant impacts on runoff and river flows. The dialogue started by the Interim Guidelines is essential for effective future planning in the Basin. However, noteworthy gaps persist. The guidelines stop short of specifying allocations in the event that Lake Mead drops below 1,000’, not a far-fetched scenario. Nor do they include threshold levels crucial to other river and basin uses. The Colorado River Basin Water Supply and Demand Study further augmented the conversation by outlining shortage probabilities and possible solutions, but declined to detail shortage impacts (Bureau of Reclamation, 2012). In the absence of a comprehensive study and/or agreement, various stakeholders have undertaken studies to understand the implications of declining reservoirs on an individual basis. However, looming water insecurity combined with the complexity of western water law and delicate political relationships hinder information sharing between stakeholders. This project proposes to fill the gap by developing a comprehensive picture of potential future economic implications for the hydropower and recreation industry, as well as the impact on water supply delivery systems, as Lake Powell and Lake Mead levels decline. An integrated comprehensive analysis of the situation is critical to managing this complex situation as equitably as possible.
Objectives
As the Colorado River Basin moves into the future, hydrologic conditions are likely to worsen with increasing climatic variability and demand for the river’s resources. Within the next two years, Lake Mead will likely drop below 1075’, triggering the Interim Guidelines (Bureau of Reclamation, 2014; Pitt, 2014). The project will focus on the implications of extreme low reservoir storage conditions, which are expected to occur within the next decade, rather than assessing the probability that these conditions will occur in the future.

3| Colorado River Reservoir Study
The project will utilize the thresholds stated in the Interim Guidelines as a starting point for evaluating the impacts of declining reservoir levels. Specified reservoir elevations for Lake Mead include 1,075’, 1,050’, 1,025’ and 1,000’; identified levels for Lake Powell are 3,575’ and 3,525’. This project will assess the implications at the designated thresholds by answering the following questions:
1 Energy contractors such as Metropolitan Water District, Southern Nevada Water Authority, and smaller distributers sell
hydropower energy to local customers. 2 State allocations are known for 1,075'-1,025'. Scenarios will be necessary for 1000'.
3 Sector allocations within each state will analyze priority rights assuming no changes in existing arrangements.
4 Includes: Motorboats, sea kayaking, rafting, fisherman
5 Includes: hiking, backpacking, camping
6 Focusing on Glen Canyon National Recreation Area and Lake Mead National Recreation Area
7 If hydropower generation at Glen Canyon decreases, profits will decrease and therefore funding for ecosystem
restoration/mitigation programs will be affected.
Hyd
rop
ow
er
Overall Question: What are the operational and financial implications of reduced reservoir levels on hydropower generation at Glen Canyon Dam and Hoover Dam?
Q1) How will hydropower generation change at each designated threshold?
Q2) How will energy contractors be impacted by lost hydropower generation1?
Wat
er
Sup
ply
Overall Question: What are the changes in water deliveries within the Lower Basin States as reservoir levels decline?
Q3) How will changes in allocation at 1,000', 1,025', 1,050', and 1,075’ be distributed amongst different sectors in each state23?
Re
cre
atio
n
Overall Question: What are the changes in recreational use and associated changes in revenues in the Lower Colorado River Basin?
Q4) How will recreational use change for river/reservoir-based4 and land-based5 recreational users6?
Q5) What are the changes in revenue to the National Park Service, specifically looking at Glen Canyon National Recreation Area, and Lake Mead National Recreation Area?
Q6) What are the changes in revenue to the local economy of Page, AZ, from changes in recreational use on Lake Powell?
Envi
ron
me
nt
Overall Question: Are there other environmental impacts associated with declining reservoir levels?
Q7) What types of ecosystem and water quality impacts are associated with declining reservoir levels?
Q8) How is funding to the Lower Colorado River Multi-Species Conservation Program (LCRMSCP) and Salinity Program changed by reduction in hydropower revenues7?
4| Colorado River Reservoir Study
Literature Review
Background
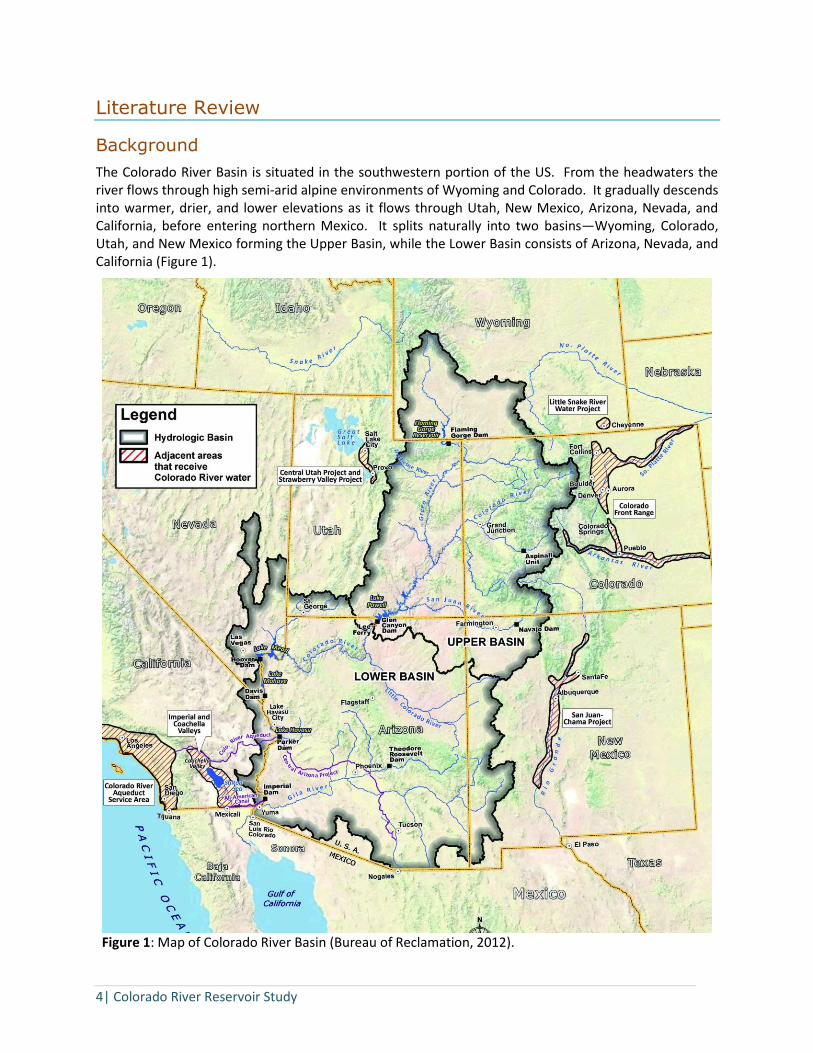
The Colorado River Basin is situated in the southwestern portion of the US. From the headwaters the river flows through high semi-arid alpine environments of Wyoming and Colorado. It gradually descends into warmer, drier, and lower elevations as it flows through Utah, New Mexico, Arizona, Nevada, and California, before entering northern Mexico. It splits naturally into two basins—Wyoming, Colorado, Utah, and New Mexico forming the Upper Basin, while the Lower Basin consists of Arizona, Nevada, and California (Figure 1).
Figure 1: Map of Colorado River Basin (Bureau of Reclamation, 2012).

5| Colorado River Reservoir Study
Snowmelt in the Rocky Mountains mainly drives the river’s hydrologic cycle. The 100-year flow record demonstrates large inter-annual variability; however, past climate reconstructions show prolonged wet and dry periods. Below average annual flows since the early 2000’s are rapidly decreasing supply and the Colorado River is accumulating a large water debt (National Research Council, 2007).
A series of dams and diversion projects control the wild and variable nature of the Colorado River for better utilization by southwestern communities. Glen Canyon and Hoover are the two largest dams on the Colorado River system. The reservoirs created behind the dams, Lake Powell and Lake Mead, provide storage for the seven basin states and Mexico to reliably obtain water deliveries.
Lake Mead is a central component of the water supply system in the southwest. It plays a significant role in water delivery, flood control and power generation to populations in the Lower Basin states and Mexico. Lake Mead’s elevation depends on Colorado River runoff and releases from Lake Powell upstream. At full capacity, 1,221.4’, the reservoir holds 28,945,000 acre-feet (AF), approximately the river’s entire flow for two years (Bureau of Reclamation: Lower Colorado Region, 2012). The stored water serves a multitude of uses including: running a hydropower plant; providing municipal, industrial, and agricultural water to Arizona, California, Nevada, and Mexico; providing recreational opportunities; and maintaining downstream flows for ecosystems. Lake Mead has not filled to capacity since 1983. As of April 1st, the water level was at 1,101.49’, not far from the first threshold, 1,075’ in the Interim Guidelines (U.S. Bureau of Reclamation: Lower Colorado River Region, 2014).
Lake Powell, on the other hand, serves two main purposes. First, Powell provides enough storage capacity to allow Upper Basin states to fulfill annual compact deliveries to Lower Basin states during below average flow years. In addition, it generates revenue by ensuring reliable flow through the hydroelectric turbines at Glen Canyon Dam (Powell, 2008). Sourced from Upper Basin tributary and mainstem flows, Powell holds approximately 27,081,000 AF at its fully capacity of 3,700.5’ (U.S. Bureau of Reclamation, 1963). The April 1st water level was 3,574.75’, about 125’ from full capacity (U.S. Bureau of Reclamation: Upper Colorado Region, 2014).
Water from the Colorado River fulfills a wide variety of needs. A history of competition and animosity between basin states is a result of water’s high value (National Research Council, 2007). Today, a diverse set of users with conflicting needs have evolved with a stake in the future of the basin. As the operator of both dams, the Bureau of Recreation is a major player in virtually all facets of river management. Major cities such as Las Vegas, Denver, and Tucson, as well as major water districts in Nevada – Southern Nevada Water Authority, Arizona – Central Arizona Project, and California – Metropolitan Water District are concentrated on fulfilling municipal water needs. Farmers and major irrigation districts such Imperial Valley Irrigation District and Palo Verde Irrigation District are concerned about the future viability of their livelihood. Members of approximately twenty-two Native American tribes depend on the Colorado River for food, cultural practices, and/or water supplies. Finally, non-consumptive uses such as recreation and ecological needs depend on a healthy functioning river.
Even though the Colorado River Compact partitioned the river evenly between the Upper and Lower Basins, Lower Basin states have historically larger demands from larger urban centers, more agricultural production, and significantly drier climates. The Upper Basin chronically under-used its annual allocation due to inadequate storage capacity and smaller dependent populations centers, which the Lower Basin gladly siphoned to satisfy its large demand (State of the Rockies Project, 2012). Rapid population growth in cities dependent on the Colorado River’s water such as Denver, Albuquerque, Las Vegas, Tucson, Los Angeles, and San Diego, in the 1990’s and 2000’s initiated prolonged stress on the basin’s allocations (National Research Council, 2007). The Upper Basin’s unused portion is increasingly insufficient in supporting existing Lower Basin needs. Finally, the Colorado River no longer annually meets the Sea of Cortez, physical proof of its over-allocation.

6| Colorado River Reservoir Study
Colorado River Basin Governance
Governance of the Colorado River Basin is complex and politicized. A majority of western water law in the Basin states is governed by prior appropriation, which grants the first users first rights to water. Water rights holders are required to use their amount allocated for beneficial use or they lose the right for future use. Beneficial use has traditionally only applied to human uses such as agricultural, municipal, or industrial. Non-consumptive uses such as in-stream flows and recreational uses were not historically considered beneficial (State of the Rockies Project, 2012), however some states have recently revised the definition to include such purposes. Prior appropriation is also not typically applied across state lines; instead, arrangements are sought to reflect the different rates of development in sub-regions.
A complex and voluminous set of interstate compacts, Congressional Acts, bi-national treaties, and Supreme Court decisions, collectively known as the Law of the River, lay out the allocation and management guidelines on the Colorado River. Largely designed to accommodate natural hydrologic anomalies of the river’s flow exacerbated by climatic variations, the Law of the River includes over ten major legal agreements (National Research Council, 2007).
In 1922, the Colorado River Compact became the first major agreement of the Law, partitioning the river’s total annual flow between the Upper and Lower Basins. The Compact allocated 7.5 million acre-feet (MAF) annually to both the Upper and Lower Basins, as well as providing an additional 1 MAF to the Lower Basin as available. The agreement also provided for a later allocation of 1.5 MAF to Mexico, as a modification to the Treaty in 1944. The Compact was flawed from the start—initial total annual flow designation was based on hydrologic measurements made during the ten wettest years of the past 100 years, making the full allocation of 17.5 MAF a significantly higher value than the average flow (National Research Council, 2007).
Key agreements and decisions in Lower Basin management include the Boulder Canyon Act of 1928 and Arizona vs. California (1963). In addition to ratifying the Compact, the Boulder Canyon Project Act was mainly a response to homesteaders’ inability to control the river’s variable flow to serve growing population and irrigational needs in California. Annual water allocations to California, Arizona, and Nevada were specified along with authorization of the Hoover Dam’s construction in order to moderate the river’s flows (State of the Rockies Project, 2012). With the addition of authorizing the Secretary of Interior as the final decision-maker in all Lower Basin issues, the Boulder Canyon Act essentially delineated the river’s management in the Lower Basin (National Research Council, 2007).
In 1963 Arizona vs. California became a landmark Supreme Court decision regarding the role of tributary flows in annual allocations. California was protesting a major diversion project planned by Arizona on the basis that they were already using their annual allocations by appropriating water in the tributary Gila River before it reached the mainstem Colorado. Siding with Arizona, the Court upheld the right to appropriate and use tributary flows without impacting annual mainstem allocations put forth in previous agreements. In the future, this decision would allow Arizona to construct the Central Arizona Project (CAP), a major water supply line for the state today (Kuhn, 2007).
All legal decisions impact the entire Basin since its flow is continuous and shared. However, the Upper Basin is largely governed by different compacts and acts than is the Lower Basin. The Upper Colorado River Basin Compact of 1948 serves the same role as the Boulder Canyon Act for Upper Basin States. However, water in the Upper Basin was apportioned by percentages versus specific quantities, and instead of the Secretary of the Interior serving as the central decision-maker, the Colorado River Commission was created to manage all Upper Basin issues.

7| Colorado River Reservoir Study
Congressional Acts in 1956 and 1968 authorized additional storage and reclamation projects. Specifically, the Colorado River Storage Project Act of 1956 outlined the development plan for the Upper Basin including the construction of Glen Canyon Dam. The 1968 Colorado River Basin Project authorized the Central Arizona Project. To pacify California’s concerns, CAP’s rights were designated junior to California’s, and would be curtailed first during a shortage, a provision that has become salient as reservoir levels recently declined. Finally, in 2007 the Lower Basin states negotiated the Colorado River Interim Guidelines for Lower Basin Shortages and the Coordinated Operation of Lake Powell and Lake Mead to specify allocation administration during potential shortages.
River Operations
The Interim Guidelines establish thresholds that will trigger coordinated management of Lake Mead and Lake Powell in surplus and drought conditions. The operations and protocols promulgated in the Interim Guidelines are effective through December of 2025, at which point they will be reviewed. Lower Basin states will have a chance to make revisions and adopt a new annual operating plan effective January 2026 (“Colorado River Interim Guidelines for Lower Basin Shortages and the Coordinated Operations for Lake Powell and Lake Mead,” 2007).
As storage in Lake Mead storage declines, the importance of these shortage protocols is illustrated. The Interim Guidelines specify three threshold elevations in Lake Mead that trigger water delivery curtailments to Lower Basin states in order to prolong the useful life of the reservoir. As the elevation of Lake Mead drops from 1,075’, to 1,050’ and 1,025’, water allocations to Arizona, Nevada, and California decrease accordingly (Table 1).
Table 1: Designated thresholds in Lake Mead and water allocations for California, Arizona, and Nevada established in the Interim Guidelines.
In addition to thresholds for low storage conditions, normal (1,075’ - 1,145’) and surplus (above 1,145’) conditions were also specified. Surplus conditions through the Intentionally Created Surplus (ICS) process allow water users in the Lower Basin to gain water credits by decreasing mainstem. The decreased mainstem uses can be achieved through efficiency upgrades in either water transportation, extraordinary conservation such as fallowing cropland, use of desalinization in place of Colorado River

8| Colorado River Reservoir Study
water, the purchase of tributary water rights, or the importation of non-Colorado River water to the system. Users are incentivized to create surplus in exchange for eligibility to receive additional deliveries equal to the quantity of surplus they created. It is important to note that the Secretary of the Interior can cancel the delivery of ICS water in shortage years.
The second key management guideline is the coordinated operation of Lake Powell and Lake Mead. The Interim Guidelines establish yearly target levels for Lake Powell (Table 2). Water release protocol from Glen Canyon Dam to Lake Mead are detailed in Table 3, based on conditions determined by Powell’s target level for the year.
Table 2. Lake Powell’s target elevations table established in the Interim Guidelines. The elevations represent the target elevation of Lake Powell for each given year. Above these elevations represents a surplus condition and below these elevations represents a shortage condition (“Colorado River Interim Guidelines for Lower Basin Shortages and the Coordinated Operations for Lake Powell and Lake Mead,” 2007).
9| Colorado River Reservoir Study
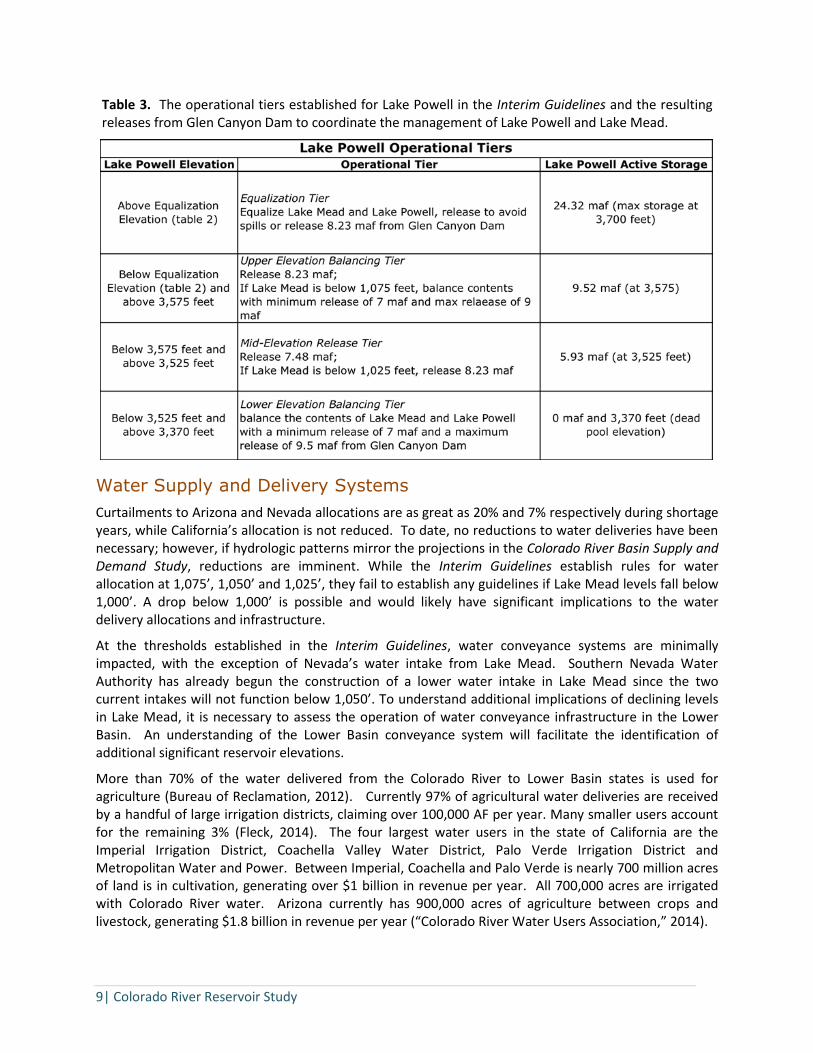
Table 3. The operational tiers established for Lake Powell in the Interim Guidelines and the resulting releases from Glen Canyon Dam to coordinate the management of Lake Powell and Lake Mead.
Water Supply and Delivery Systems
Curtailments to Arizona and Nevada allocations are as great as 20% and 7% respectively during shortage years, while California’s allocation is not reduced. To date, no reductions to water deliveries have been necessary; however, if hydrologic patterns mirror the projections in the Colorado River Basin Supply and Demand Study, reductions are imminent. While the Interim Guidelines establish rules for water allocation at 1,075’, 1,050’ and 1,025’, they fail to establish any guidelines if Lake Mead levels fall below 1,000’. A drop below 1,000’ is possible and would likely have significant implications to the water delivery allocations and infrastructure.
At the thresholds established in the Interim Guidelines, water conveyance systems are minimally impacted, with the exception of Nevada’s water intake from Lake Mead. Southern Nevada Water Authority has already begun the construction of a lower water intake in Lake Mead since the two current intakes will not function below 1,050’. To understand additional implications of declining levels in Lake Mead, it is necessary to assess the operation of water conveyance infrastructure in the Lower Basin. An understanding of the Lower Basin conveyance system will facilitate the identification of additional significant reservoir elevations.
More than 70% of the water delivered from the Colorado River to Lower Basin states is used for agriculture (Bureau of Reclamation, 2012). Currently 97% of agricultural water deliveries are received by a handful of large irrigation districts, claiming over 100,000 AF per year. Many smaller users account for the remaining 3% (Fleck, 2014). The four largest water users in the state of California are the Imperial Irrigation District, Coachella Valley Water District, Palo Verde Irrigation District and Metropolitan Water and Power. Between Imperial, Coachella and Palo Verde is nearly 700 million acres of land is in cultivation, generating over $1 billion in revenue per year. All 700,000 acres are irrigated with Colorado River water. Arizona currently has 900,000 acres of agriculture between crops and livestock, generating $1.8 billion in revenue per year (“Colorado River Water Users Association,” 2014).

10| Colorado River Reservoir Study
While agriculture may be the largest consumptive use of water in the Lower Basin, urban and industrial uses are increasing the pressure on water managers in the West. With populations in California, Arizona and Nevada projected to double between 1995 and 2025, urban and industrial water demand will grow (Campbell, 1997). Already 100% of Nevada’s state allocation is utilized by the Southern Nevada Water Authority, which feeds solely urban and industrial uses. In California, Metropolitan Water District of Southern California utilizes more than 90% of their allocated water for urban and industrial uses as well (“Colorado River Water Users Association,” 2014). Population growth will cause water demand to consistently exceed supply in the Basin, clearly illustrated in the Colorado River Basin Water Supply and Demand Study. The continuously growing demand for water from the Colorado emphasizes the importance of a strong understanding of where the water is going and how it is being used.
With water rights distributed between large irrigation districts, Indian reservations and private users, water is used in numerous ways. Although the basic state level allocations are well documented, how water is further distributed within each state is less clear. This project, will clearly illustrate where all water goes within each Lower Basin state and how it is used. Based on priority rights structure, the project will identify the most vulnerable water users delivery curtailments during shortage conditions. Additionally, the analysis will assess water conveyance systems used in the Lower Basin and how the changing levels of Lake Mead may affect the systems physical ability to divert water. The project will provide valuable information that may be utilized in future analysis of the social and economic implications of water allocations and cuts among Lower Basin users as reservoir levels continue to drop.
Hydropower Generation
Hoover Dam is the sixth largest hydroelectric power facility in the US. Each year, the dam generate 4 billion kilowatt-hours (kWh) of hydroelectricity, provides power to 1.3 million people, and covers peak demand for numerous cities in Nevada, Arizona, and California (Bureau of Reclamation: Lower Colorado Region, 2012; Zimmerman, 2010). Electricity generated from Hoover Dam is divided up according to the Hoover Power Allocation Act of 1984. The largest contractors include Metropolitan Water District of Southern California (MWD), Nevada, Arizona, and Los Angeles, who are collectively allocated 86% of the hydropower. The remainder dispersed to smaller California utilities (Bureau of Reclamation: Lower Colorado Region, 2012). Glen Canyon Dam generates 5 billion kWh annually, for 5.8 million customers in Wyoming, Utah, Colorado, New Mexico, Arizona, Nevada, and Nebraska. In addition, Glen Canyon Dam generates $150 million in revenue, which funds various federal programs, such as the Salinity Control Program and the Lower Colorado River Multispecies Collaborative Program (Best, 2013).
Both dams are operated and maintained by the Bureau of Reclamation. Hydropower generated by the dams is marketed through the Western Area Power Administration (WAPA), who ensures that the electricity supply matches demand at all times. Hydropower from Hoover and Glen Canyon dams is the Southwest’s cheapest power source. WAPA is legally mandated to only cover basic operational costs, not profit, by selling power, resulting in extremely low rates available to energy contractors. (U.S. Energy Information Administration (EIA), n.d.; Zimmerman, 2010).
Lowered reservoir storage levels in Lake Mead and Lake Powell have decreased hydropower generation capacity from the dams. . A 1’ drop leads to 5.7 megawatts less power (Tony, 2010). Water levels at Lake Mead have been decreasing by 10 feet per year. As a result, electricity generation at Hoover Dam has decreased by 29% since 1980 (Zimmerman, 2010). Glen Canyon suffers a similar fate. In 2014, power production is expected to be 8% lower than in 2013 (Tweed, 2013).
Hydropower is distributed by WAPA on an “as-available” basis (Western Area Power Admistration, n.d.). Reduced power generation results in a proportional decreases in hydropower supply to WAPA’s contractors. Individual utilities have to make up for the shortfall by purchasing more expensive

11| Colorado River Reservoir Study
alternative sources on the open market, paying prices up to four times higher (Zimmerman, 2010). This financial burden has been experienced to various degrees by many utilities, and the cost of increasing costs of power purchase is usually passed onto customers (Zimmerman, 2010). For example, MWD has raised power rates by 49% over the past three years due to purchases of electricity from other sources (Zimmerman, 2010).
There is no publicly available study on hydropower generation capacity at various thresholds set by the Interim Guidelines, or the subsequent losses of revenue for power contractors of Hoover Dam and Glen Canyon Dam. This project aims to quantify the power generation change at each designated threshold (1075’, 1050’, 1025’, and 1000’ for Lake Mead; 3575’ and 3525’ for Lake Powell), and identify reservoir levels critical for power generation outside of the Interim Guidelines. The project will also analyze how energy contractors will be differentially impacted by lost hydropower generation. Large utilities may have more resources to buffer the loss of inexpensive hydropower electricity; while small-sized contractors may be more vulnerable to hydropower loss and experience greater revenue decreases.
Recreation
The Colorado River Basin is a playground for recreation enthusiasts. The expansive network of rivers, tributaries, mountains and canyons provide opportunities for hiking, camping, watersports, biking, fishing, hunting, wildlife watching and off-road vehicles. The extensive network of public land lures recreationists and supports local and regional economies. In 2009, Glen Canyon National Recreation Area received 1,750,000 overnight visits (National Parks Conservation Association & Center for Park Research, 2011). While visitation at the various parks, recreation areas, wildlife refuges and state parks varies, yearly recreational expenditures for the whole Basin is estimated at $25.6 billion, ranking the Colorado River as the 155th company in the Fortune 500 (Southwick Associates, 2012). Moving forward, ecological and recreational needs must be considered. In the words of Anne Castle, Assistant Secretary for Water and Science at the Department of Interior:
“We can’t simply sacrifice recreational and environmental flows when times get tough. We know that outdoor recreation is an important driver of the Southwestern economy, just like agriculture, so we’ve got to consider all of those things together. It’s essential to our economy. It’s essential to our way of life.” (Pitt, 2014)
Further declines in reservoir levels will negatively impact whitewater rafting, fishing and motorized watersports on the reservoirs. On the other hand, decreased reservoir levels could expose additional land for hiking, and camping. Quantification of the changes in recreational use by river and reservoir based user groups, motorized and non-motorized boaters and fisherman, and land-based users, hikers, backpackers, wildlife viewers and campers, along the Lower Colorado River has not been fully assessed and is a key component of this project.
The Outdoor Industry Association has done extensive studies on the economic benefit of recreation on both national and state economies (Outdoor Industry Association, 2012a, Outdoor Industry Association, 2012b, Outdoor Industry Association, 2012c, Outdoor Industry Association, 2012d; Southwick Associates, 2013b). Nationally, outdoor recreationists spend $646 billion each year generating $40 billion in revenue for both federal and state taxes (Outdoor Industry Association, 2012a). Communities in close vicinity to protected public lands had higher per capita income levels in 2010 than those farther away. Recreation potential is often cited as a key factor in attracting new businesses to western states and recruiting top employees (Rasker, 2012).
A recent study commissioned by Protect the Flows assessed the economic benefits of recreation in the Colorado River Basin. Southwick Associates conducted phone interviews to determine the percentage

12| Colorado River Reservoir Study
of the population recreating on the river in each state, the types of recreation and the revenue generated by each activity, then used an economic modeling software to determine the economic benefits (Southwick Associates, 2012). Unfortunately, Colorado River Inc. as the study has been nicknamed, did not include motorized recreation; therefore, leaving out the large contingent of motorized water sports on Lake Powell and Lake Mead (Southwick Associates, 2012). Further refinement of economic impact on specific industry stakeholders due to recreational use changes on the Lower Colorado River is necessary.
The impacts of declining reservoir levels and river flows on recreational uses are not well known. However, Southwick Associates completed a study in 2013 estimating the impacts of reductions in Colorado River flows on property values in the Colorado River Basin (Southwick Associates, 2013a). Southwick Associates (2013a) found a 20% reduction in river flow would decrease riverfront property sale prices by 9.5% and properties with a river view by 5.7%. A regional study in southwestern Colorado documented the potential impacts of drought on tourism and recreation by performing stakeholder engagement and determining visitation rates, lodging receipts and license sales (Thomas & Wilhelmi, 2012). Both recent studies provide the groundwork for a more integrated and comprehensive analysis of recreation-related economic impacts of decreased river flows and reservoir levels at the designated thresholds.
Recreation is an essential component of a sustainable future for the communities of the Colorado River Basin. But the full impact of lowering reservoir levels and river flows is unknown. The project will determine the potential changes in recreational use at various reservoir levels to assess the economic impact to the National Park Service and Page, Arizona. Given the large recreational opportunities along the river corridor, the project will focus on Glen Canyon National Recreation Area and Lake Mead National Recreation Area. Since recreational use changes for land-based users could be more difficult to assess, the main focus of the analysis will be on the river and reservoir based users.
Environmental Impacts
Water supply, hydropower generation and recreational users are not the only stakeholders impacted by declining reservoir levels and river flows in the Colorado River Basin. The ecosystem supports a diversity of riparian habitat, birds, fish and mammals. Dams throughout the Basin have significantly diminished the habitat of the four endangered fish species – Colorado pikeminnow, razorback sucker, humpback chub and bonytail chub (National Parks Conservation Association & Center for Park Research, 2011). Low flows negatively impact the Colorado River Delta and riparian communities along the river corridor (Environmental Defense Fund, Trout Unlimited, Western Resource Advocates, The Nature Conservancy, & pro natura noreste, 2012). Additionally, decreases in hydropower generation from Glen Canyon Dam will reduce profits and impact the restoration and mitigation programs funded with hydropower revenues. Decreased revenues to support salinity control and the Lower Colorado River Multi-Species Conservation Program could have significant negative impacts to the river ecosystem. While the impacts of declining reservoir levels on ecosystems and other stakeholders are important, this project will not set out to systematically assess the various impacts. Instead, reservoir levels critical to environmental needs will be summarized.
13| Colorado River Reservoir Study
Technical Approach and Data Catalog
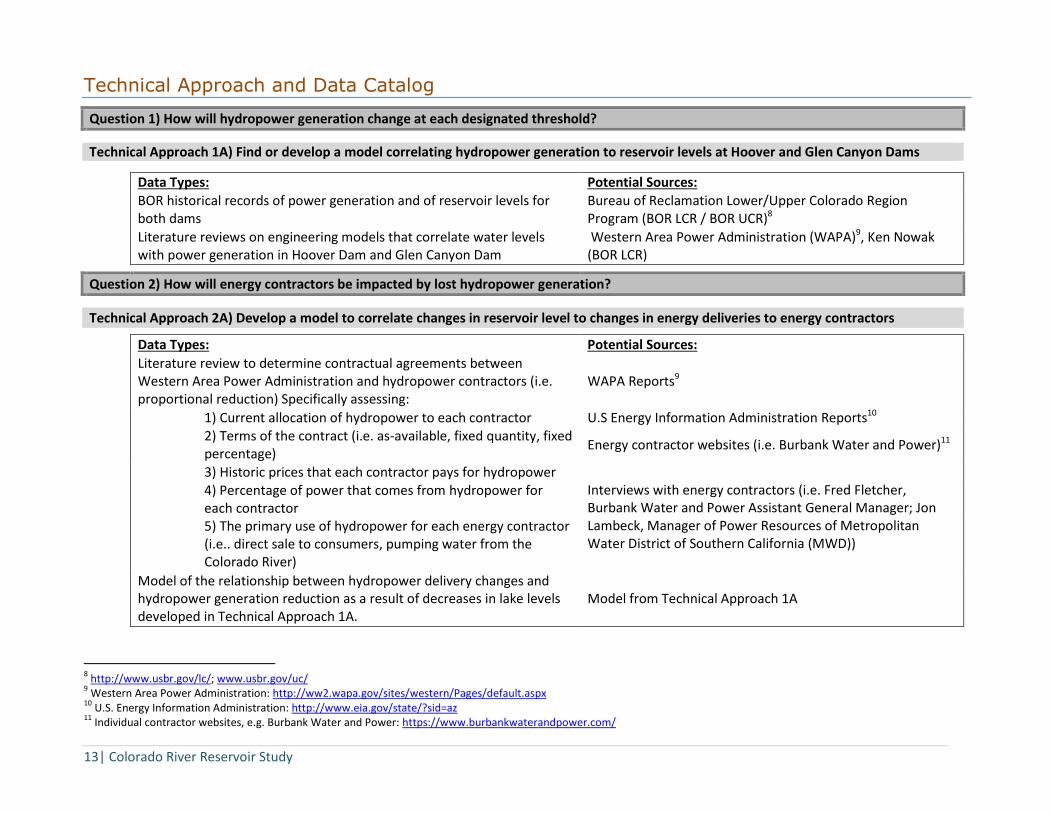
Question 1) How will hydropower generation change at each designated threshold?
Technical Approach 1A) Find or develop a model correlating hydropower generation to reservoir levels at Hoover and Glen Canyon Dams
Data Types: Potential Sources:
BOR historical records of power generation and of reservoir levels for both dams
Bureau of Reclamation Lower/Upper Colorado Region Program (BOR LCR / BOR UCR)8
Literature reviews on engineering models that correlate water levels with power generation in Hoover Dam and Glen Canyon Dam
Western Area Power Administration (WAPA)9, Ken Nowak (BOR LCR)
Question 2) How will energy contractors be impacted by lost hydropower generation?
Technical Approach 2A) Develop a model to correlate changes in reservoir level to changes in energy deliveries to energy contractors
Data Types: Potential Sources:
Literature review to determine contractual agreements between Western Area Power Administration and hydropower contractors (i.e. proportional reduction) Specifically assessing:
WAPA Reports9
1) Current allocation of hydropower to each contractor U.S Energy Information Administration Reports10
2) Terms of the contract (i.e. as-available, fixed quantity, fixed percentage)
Energy contractor websites (i.e. Burbank Water and Power)11
3) Historic prices that each contractor pays for hydropower Interviews with energy contractors (i.e. Fred Fletcher, Burbank Water and Power Assistant General Manager; Jon Lambeck, Manager of Power Resources of Metropolitan Water District of Southern California (MWD))
4) Percentage of power that comes from hydropower for each contractor
5) The primary use of hydropower for each energy contractor (i.e.. direct sale to consumers, pumping water from the Colorado River)
Model of the relationship between hydropower delivery changes and hydropower generation reduction as a result of decreases in lake levels developed in Technical Approach 1A.
Model from Technical Approach 1A
8 http://www.usbr.gov/lc/; www.usbr.gov/uc/
9 Western Area Power Administration: http://ww2.wapa.gov/sites/western/Pages/default.aspx
10 U.S. Energy Information Administration: http://www.eia.gov/state/?sid=az
11 Individual contractor websites, e.g. Burbank Water and Power: https://www.burbankwaterandpower.com/

14| Colorado River Reservoir Study
Technical Approach 2B) Determine changes in energy acquisition costs for selected contractors based on local open market prices.
i) Identify contractors to analyze
Data Types Potential Sources:
Based on literature review and expert interviews from Technical Approach 2A, hydropower contractors will be chosen based on contractor size, location, purpose of hydropower, and state regulation of hydropower pricing.
Data/Information from Technical Approach 2A
ii) Determine changes to energy acquisition costs
Data Types Potential Sources:
Literature review and expert interviews with hydropower contractors on the availability, types, and prices of alternative power sources on the open market
WAPA Reports; U.S Energy Information Administration Reports; Energy contractors and internal reports (i.e. Burbank Water and Power); Jack Sahl (former Director of Environment & Resource Sustainability at Southern California Edison)
iii) Calculate of the cost of acquiring alternative power sources for each identified contractor
Data Types Potential Sources:
Amount of power needed from alternative power sources Data/Information from Technical Approach 2A
Cost of acquiring alternative power Data/Information from Technical Approach 2B ii
Technical Approach 2B Alternative) Determine overall cost of supplemental energy acquisition in current regional open market
Data Types: Potential Sources:
Amount of power needed from alternative power sources Data from Technical Approach 2A
Current market price of non-hydropower energy sources U.S Energy Information Administration Reports; California Independent Systems Operator12
12
California Independent Systems Operator: http://www.caiso.com/about/Pages/OurCommitment/default.aspx

15| Colorado River Reservoir Study
Question 3) How will changes in allocation at 1000', 1025', 1050', and 1075’ be distributed amongst different sectors in each state?
Technical Approach 3A) Assess the changes in water allocation to different sectors within each state at designated thresholds including 1000' assuming statewide cuts consistent with the Interim Guidelines
Data Types: Potential Sources:
BOR records of annual water deliveries to Lower Basin state water users including monthly and annual consumptive water uses by individual water right holders
BOR record of water right priority list per state
Water delivery schedule from large irrigation districts. Imperial Water District, Southern Nevada Water Authority and the Central Arizona Project
Interviews with water law experts and water use industry leaders (agriculture, municipal) to gather information on the structure of water distribution between different state sectors and the potential impact of water reductions to their respective industries.
Richard Schmid, Riverside County Farm Bureau; Jim Boyle, Maricopa County Farm Bureau; Resources Manager (Southern California Water Committee, Colorado River Task Force)
John Entsminger, director of SNWA and LVVWD; Patricia Mulroy, former director of SNWA; Brigham Daniels, Environmental Law Professor BYU; Michael Lacey, Director ADWR; Chuck Cullom, CAP Colorado River Program Manager; James Modeer, Colorado River Water Users Association (CRUWA)
Technical Approach 3B if practical) Explore scenarios13 for allocation to California, Nevada and Arizona below 1000'
Data Types: Potential Sources:
Extensive literature review focusing the potential impacts and vulnerability of different users and sectors within each Lower Basin state to reductions in water availability.
State Department of Water Resources (California, Arizona and Nevada); Irrigation District publications; Colorado River Basin Supply and Demand Study (BOR); CRUWA publications
Interviews experts involved with policy, law and decision making on the Colorado River to develop scenarios for water allocation below 1000'.
Similar to list from Technical Approach 3A
Technical Approach 3C) Synthesis of the implications of a Compact Call on Upper Basin states.
Data types: Potential Sources:
Literature review of possibility of a Compact Call and the resulting implications for Upper Basin states.
Colorado River Basin Water Supply and Demand Study (BOR)
13
Outline different realistic scenarios: 1) Extrapolation based on Interim Guidelines; 2) Based on current sociopolitical landscape

16| Colorado River Reservoir Study
Question 4) How will recreational use change for river/reservoir-based and land-based recreational users?
Technical Approach 4A) Find or develop a model to determine if there is a correlation between number of users [correcting for weather, seasonality, etc.] and reservoir levels [or surface area].
Data Types: Potential Sources:
Park Service monthly recreational user data for Lake Mead NRA, Glen Canyon NRA
Park Service Stats Database14
BOR historic daily reservoir levels, releases, inflows for Lake Powell and Lake Mead levels
BOR LCR Program River Operations15; Colorado River Basin Supply and Demand Study/EIS
Technical Approach 4A Alternative) Identify reservoir levels at which key access points are no longer available and associated user day loss
Data Types: Potential Sources: Current operable reservoir elevations for access points in each park NPS Reports and Interviews
User days by access point Park Service Stats Database
Question 5) What are the changes in revenue to the National Park Service, specifically looking at Glen Canyon National Recreation Area, and Lake Mead National Recreation Area?
Technical Approach 5A) Assuming there is a correlation between the change in use relative to reservoir levels (Technical Approach 4A), the NPS user fee structure will be used to determine the change in revenue to the National Park Service.
Data Types: Potential Sources:
National Park Service historic and current fee structure NPS Unit Websites
Model correlating reservoir levels to recreational use Technical Approach 4A
Technical Approach 5A Alternative) Estimate societal value of changes in recreational use.
Data Types: Potential Sources:
Contingent valuation of visitor day in NPS areas Peer Reviewed Literature
Model correlating reservoir levels to recreational use Technical Approach 4A/4A Alternative
14
https://irma.nps.gov/Stats/Reports/Park 15
http://www.usbr.gov/lc/riverops.html

17| Colorado River Reservoir Study
Question 6) What are the changes in revenue to the local economy of Page, AZ, from changes in recreational use on Lake Powell?
Technical Approach 6A) Explore changes in tourism revenue to in Page, AZ
Data Types: Potential Sources:
Park Service recreational user data for Lake Mead NRA, Glen Canyon NRA and Grand Canyon NP
Park Service Stats Database
Revenue from tourism in Page, AZ
Chamber of commerce, Hotel Reports, Houseboat Industry rentals, Local Business reports and interviews, Internal reports from Page government, monthly sales tax data
Question 7) What types of environmental impacts are associated with declining reservoir levels?
Technical Approach 7A) Synthesis of ecosystem impacts including funding mechanisms.
Data Types: Potential Sources:
Literature review of the impacts of declining reservoir levels on fish, birds, vegetation and other ecosystems
EPA; NEPA; U.S. Fish and Wildlife ESA Documents
Estimates of payments to the Lower Colorado River Multiple Species Conservation Program (LCRMSCP) from hydropower revenue
LSCRMSCP Financial Reports; BOR Revenue Reports; WAPA Reports
Model correlating hydropower generation to reservoir levels Technical Approach 1A
Technical Approach 7B) Synthesis of water quality impacts including funding mechanisms.
Data Types: Potential Sources:
Literature review of water quality impacts EPA; Salinity Control Acts
Estimates of payments to the Salinity Control Program from hydropower revenue
Salinity Program Financial Reports; BOR Financial Reports
Model correlating hydropower generation to reservoir levels Technical Approach 1A
18| Colorado River Reservoir Study
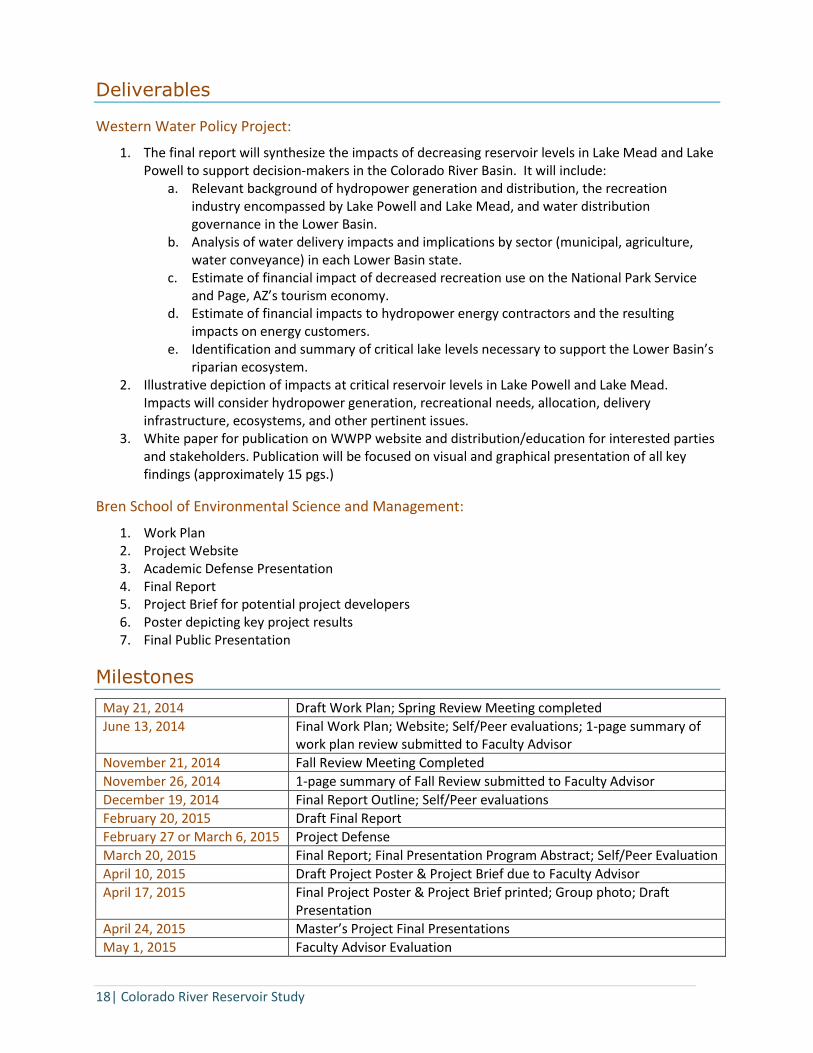
Deliverables
Western Water Policy Project:
1. The final report will synthesize the impacts of decreasing reservoir levels in Lake Mead and Lake Powell to support decision-makers in the Colorado River Basin. It will include:
a. Relevant background of hydropower generation and distribution, the recreation industry encompassed by Lake Powell and Lake Mead, and water distribution governance in the Lower Basin.
b. Analysis of water delivery impacts and implications by sector (municipal, agriculture, water conveyance) in each Lower Basin state.
c. Estimate of financial impact of decreased recreation use on the National Park Service and Page, AZ’s tourism economy.
d. Estimate of financial impacts to hydropower energy contractors and the resulting impacts on energy customers.
e. Identification and summary of critical lake levels necessary to support the Lower Basin’s riparian ecosystem.
2. Illustrative depiction of impacts at critical reservoir levels in Lake Powell and Lake Mead. Impacts will consider hydropower generation, recreational needs, allocation, delivery infrastructure, ecosystems, and other pertinent issues.
3. White paper for publication on WWPP website and distribution/education for interested parties and stakeholders. Publication will be focused on visual and graphical presentation of all key findings (approximately 15 pgs.)
Bren School of Environmental Science and Management:
1. Work Plan 2. Project Website 3. Academic Defense Presentation 4. Final Report 5. Project Brief for potential project developers 6. Poster depicting key project results 7. Final Public Presentation
Milestones
May 21, 2014 Draft Work Plan; Spring Review Meeting completed
June 13, 2014 Final Work Plan; Website; Self/Peer evaluations; 1-page summary of work plan review submitted to Faculty Advisor
November 21, 2014 Fall Review Meeting Completed
November 26, 2014 1-page summary of Fall Review submitted to Faculty Advisor
December 19, 2014 Final Report Outline; Self/Peer evaluations
February 20, 2015 Draft Final Report
February 27 or March 6, 2015 Project Defense
March 20, 2015 Final Report; Final Presentation Program Abstract; Self/Peer Evaluation
April 10, 2015 Draft Project Poster & Project Brief due to Faculty Advisor
April 17, 2015 Final Project Poster & Project Brief printed; Group photo; Draft Presentation
April 24, 2015 Master’s Project Final Presentations
May 1, 2015 Faculty Advisor Evaluation

19| Colorado River Reservoir Study
Group Structure and Management
Client:
Doug Kenney Western Water Policy Program University of Colorado Law School (303) 492-1296 [email protected]
Faculty Advisor:
Naomi Tague Bren School of Environmental Science & Management University of California Santa Barbara [email protected]
Job Definitions:
1. Project Manager: Season Martin
Creates and distributes meeting agendas, and facilitates meetings
Facilitates and promotes clear communication among team members
Serves as main contact for communicating with client and advisors
Manages deadlines in the group’s Google calendar and ensures group members meet deadlines
Delegates tasks among group members
Schedules all meeting rooms and times and informs group members 2. Web Manager: Skyler Murphy
Creates and maintains the group project website with pertinent updates.
Photograph, record and maintain a visual library of group activities, meetings, and work
Manages group email address
Formats documents and performs final edits 3. Data Manager: Ning Jiang
Creates group data storage structure and maintain file organization on Google and G drives
Install group software and maintain all files and directories
Oversees use of Zotero to maintain a file of bibliographic references for the group 4. Financial Manager: Julia Morton
Manages Bren’s allocated budget of $1300 for anticipated expenses
Keeps group members apprised of current state of funds through a shared document
Responsible for tracking, managing, communicating, and updating the group’s budget and reimbursement needs
Takes meeting notes and adds deadlines to Asana
Meeting Structure:
Meeting time, location and agenda will be coordinated by the Project Manager.
Meeting minutes will be taken and distributed by the Financial Manager.
The group will have weekly meetings with the faculty advisor, and Doug Kenny as needed.
The group members will also meet as needed, at least once a week, to develop faculty and client meeting objectives and work on project tasks.
Meetings with just the team members will start with a personal check-in as well as a reflection on what is going well and what could be improved on.

20| Colorado River Reservoir Study
Guidelines for interacting with faculty advisors, clients and external advisors:
The Project Manager will be the primary point of contact for the faculty advisor, client and external advisors. Agendas and materials required for weekly meetings with the faculty advisor and client will be distributed one day prior to the meeting. The Project Manager will provide drafts or documents requiring feedback. Group members will expect a one-week turnaround with comments unless otherwise agreed upon. Faculty advisor, client, and external advisors will be updated on the progress of the project at scheduled meetings.
System to Ensure Deadlines are Met:
The group members will use a shared Google calendar and Asana to record and track task assignments. The Project Manager will enter all deadlines and relevant dates into the Google calendar and ensure all deadlines are met. The Financial Manager will update Asana with task assignments.
Procedures for Documenting, Cataloging, and Archiving Information:
Meeting documents (agendas, minutes, preliminary drafts) will be shared as Google Drive files that are accessible to all group members. Literature and other resources will be uploaded to the group Zotero folder and tagged appropriately. Individuals who upload a file are responsible for creating/checking the meta-data. A detailed procedure for documenting, cataloging and archiving information will be developed by the Data Manager and saved on Google Drive for reference.
Overall Expectations of Group Members:
Group members are expected to produce graduate level work and complete assigned tasks in a timely manner unless they communicate otherwise. Group members are expected to stay up-to-date with Asana and Google Calendar deadlines and personal tasks. Additionally, group members will foster open communication and understanding between team members, the faculty advisor, client and external advisors.
Overall Expectations of the Faculty Advisor:
Faculty Advisor is expected to attend weekly meetings with the group members, provide guidance on project scope, provide feedback on the process for achieving the scope, and provide feedback on drafts and project deliverables.
Conflict Resolution Process:
Each team member is responsible for creating an open, safe environment that fosters understanding and positive dialogue. Throughout the project, group members are expected to respectfully share any concerns regarding project actions, actively listen to differing views and collaboratively find an agreeable solution. If conflicts or tension arises, group members should address the situation immediately. Prior to involving other group members or advisors, the parties should attempt to resolve the issue themselves. If the parties are unable to resolve the disagreement, the group members should ask the faculty advisor to assist in mediation. If the problem requires additional support, the Project Manager will contact the campus ombuds office (http://www.ombuds.ucsb.edu), where an appointed conflict mediator will work with the parties to reach a resolution.

21| Colorado River Reservoir Study
Budget
Proposed Budget
Item Cost ($)
Phone Calls 50
Final Poster and Presentation Expenses 300
Business Cards 25
Maps 50
Office Supplies 50
Visitor expenses 50
Travel/Conferences 500
Printing** 200
Miscellaneous 275
Total 1500
**Fixed Amount
22| Colorado River Reservoir Study
Bibliography
Best, A. (2013). Hydro production at Glen Canyon Dam threatened by low water. Aspen Journalism. Retrieved from http://aspenjournalism.org/2013/12/08/hydropower-production-at-glen-canyon-dam-threatened-by-low-water/
Bureau of Reclamation. (2012). Colorado River Basin Water Supply and Demand Study: Executive Summary.
Bureau of Reclamation. (2014). 24-Month Study.
Bureau of Reclamation: Lower Colorado Region. (2012, June). Frequently Asked Questions and Answers: Lake Mead. Hoover Dam. Retrieved April 22, 2014, from http://www.usbr.gov/lc/hooverdam/faqs/lakefaqs.html
Campbell, P. (1997). Population Projections: States, 1995 - 2025. Census Bureau. Retrieved from http://www.census.gov/prod/2/pop/p25/p25-1131.pdf
Colorado River Interim Guidelines for Lower Basin Shortages and the Coordinated Operations for Lake Powell and Lake Mead. (2007, December).
Colorado River Water Users Association. (2014, January 1). Colorado River Water Users Association. Retrieved from http://www.crwua.org/
Environmental Defense Fund, Trout Unlimited, Western Resource Advocates, The Nature Conservancy, & pro natura noreste. (2012). Healthy Flows for the Colorado River Basin.
Fleck, J. (2014, April 13). AMACRQ: Colorado River Use Bar Graph. JFleck at Inkstain. Inkstain. Retrieved from http://www.inkstain.net/fleck/2014/04/amacrq-colorado-river-use-bar-graph/
Kuhn, E. (2007). The Colorado River: The Story of a Quest for Certainty on a Diminishing River. Glenwood Springs, CO: Colorado River District. Retrieved from http://www.crwcd.org/media/uploads/How_Much_Water_05-15-07.pdf
National Parks Conservation Association, & Center for Park Research. (2011). National Parks of the Colorado River Basin: Water Management, Resource Threats, and Economics.
National Research Council. (2007). Colorado River Basin Water Management: Evaluating and Adjusting to Hydroclimatic Variability. Washington D.C.: The National Academies Press. Retrieved from http://www.nap.edu/openbook.php?record_id=11857
Outdoor Industry Association. (2012a). The Outdoor Recreation Economy.
Outdoor Industry Association. (2012b). The Outdoor Recreation Economy: Arizona.
Outdoor Industry Association. (2012c). The Outdoor Recreation Economy: California.
Outdoor Industry Association. (2012d). The Outdoor Recreation Economy: Nevada.
Pitt, J. (2014, January 8). What the New York Times Misses About the Colorado River. Water Currents - National Geographic. Retrieved from

23| Colorado River Reservoir Study
http://newswatch.nationalgeographic.com/2014/01/08/the-new-york-times-and-the-colorado-wheres-the-river/
Powell, J. L. (2008). Dead Pool: Lake Powell, Global Warming, and the Future of Water in the West. Berkeley, CA: University of California Press.
Rasker, R. (2012). West is Best: How Public Lands in the West Create a Competitive Economic Advantage. Headwaters Economics.
Senate Energy and Natural Resources Committee. To consider the Bureau of Reclamation’s Colorado River Basin Water Supply and Demand Study (2013). Washington D.C. Retrieved from http://www.energy.senate.gov/public/index.cfm/2013/7/water-and-power-subcommittee
Southwick Associates. (2012). Economic Contributions of Outdoor Recreation on the Colorado River & Its Tributaries. Retrieved from http://protectflows.com/wp-content/uploads/2013/09/Colorado-River-Recreational-Economic-Impacts-Southwick-Associates-5-3-12_2.pdf
Southwick Associates. (2013a). Potential Impacts to Property Values from Long-term Changes in Water Levels on the Colorado River and Its Tributaries: A Delphi Approach.
Southwick Associates. (2013b). The Economic Contributions of Outdoor Recreation: Technical Report on Methods and Findings. Outdoor Industry Association.
State of the Rockies Project. (2012). State of the Rockies Report Card: The Colorado River Basin, Agenda for Use, Restoration, and Sustainability for the Next Generation. Colorado Springs, CO: The Colorado College State of the Rockies Project. Retrieved from http://www2.coloradocollege.edu/StateoftheRockies2/2012RC/2012ReportCard.pdf
Thomas, D., & Wilhelm, O. (2012). Drought Assessment for Recreation & Tourism: Southwestern Colorado Report.
Tony, I. (2010). Big Drop in Lake Mead Level Curbs Hoover Water. Retrieved from http://southwest.construction.com/southwest_contractor_news/2010/0927_LakeMeadLevel.asp
Tweed, K. (2013). Colorado River hydropower faces a dry future. ie Spectrum. Retrieved from http://spectrum.ieee.org/energy/renewables/colorado-river-hydropower-faces-a-dry-future
U.S. Bureau of Reclamation. (1963). Colorado River Storage Project, Glen Canyon Unit, Lake Powell, area and capacity tables. U.S. Bureau of Reclamation. Retrieved from http://digital.lib.usu.edu/cdm/ref/collection/Elusive/id/15929
U.S. Bureau of Reclamation: Lower Colorado River Region. (2014, May 11). Lower Colorado River Daily Report (hourly data). Reclamation: Lower Colorado Region. Retrieved May 12, 2014, from http://www.usbr.gov/lc/region/g4000/hourly/hourly.html
U.S. Bureau of Reclamation: Upper Colorado Region. (2014, May 10). Water Operations Data: Elevation, Content, Inflow & Release for last 40 Days. Reclamation: Upper Colorado Region. Retrieved May 12, 2014, from http://www.usbr.gov/uc/water/rsvrs/ops/crsp_40_gc.html

24| Colorado River Reservoir Study
U.S. Energy Information Administration (EIA). (n.d.). Federal Power Marketing Administrations operate across much of the United States. Retrieved April 22, 2014, from http://www.eia.gov/todayinenergy/detail.cfm?id=11651
Vano, J. A., Udall, B., Cayan, D. R., Overpeck, J. T., Brekke, L. D., Das, T., … Lettenmaier, D. P. (2014). Understanding Uncertainties in Future Colorado River Streamflow. Bulletin of the American Meteorological Society, 95(1), 59–78. doi:10.1175/BAMS-D-12-00228.1
Western Area Power Administration. (n.d.). Power Marketing. Western Area Power Administration. Retrieved April 23, 2014, from https://ww2.wapa.gov/sites/western/about/faqs/Pages/faqpm.aspx
Zimmerman, J. (2010, 06). Colorado River drought threatens power production. Retrieved from http://www.pe.com/local-news/topics/topics-environment-headlines/20101006-region-colorado-river-drought-threatens-power-production.ece