the climate impacts group: the climate impacts group: climate information and decision-making in the...
Post on 21-Dec-2015
215 views
TRANSCRIPT
The Climate Impacts The Climate Impacts Group:Group: Climate Information and Decision-making in the Pacific Northwest
Lara Whitely BinderCenter for Science in the Earth
SystemClimate Impacts Group
University of Washington
September 22, 2004Climate Science in the
Public Interest
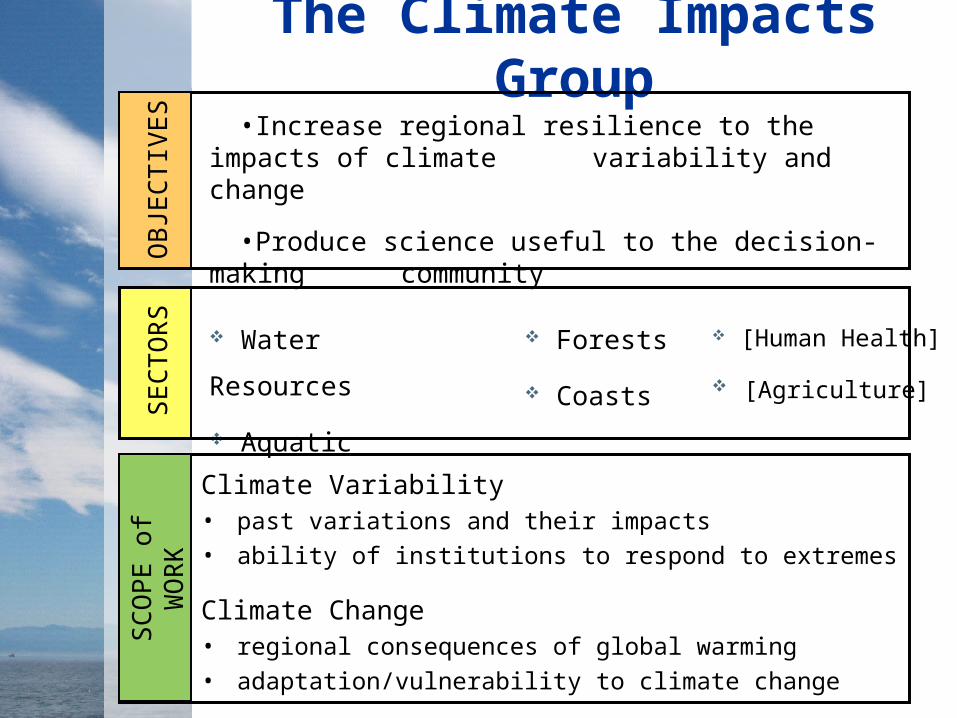
The Climate Impacts Group
Water Resources
Aquatic Resources
Forests
Coasts
[Human Health]
[Agriculture]
Climate Variability• past variations and their impacts
• ability of institutions to respond to extremes
Climate Change• regional consequences of global warming
• adaptation/vulnerability to climate change
•Increase regional resilience to the impacts of climate variability and change
•Produce science useful to the decision-making communityO
BJE
CTIV
ES
SE
CTO
RS
SC
OPE
of
WO
RK
How Does CIG Support Planning for Climate Variability and Change?
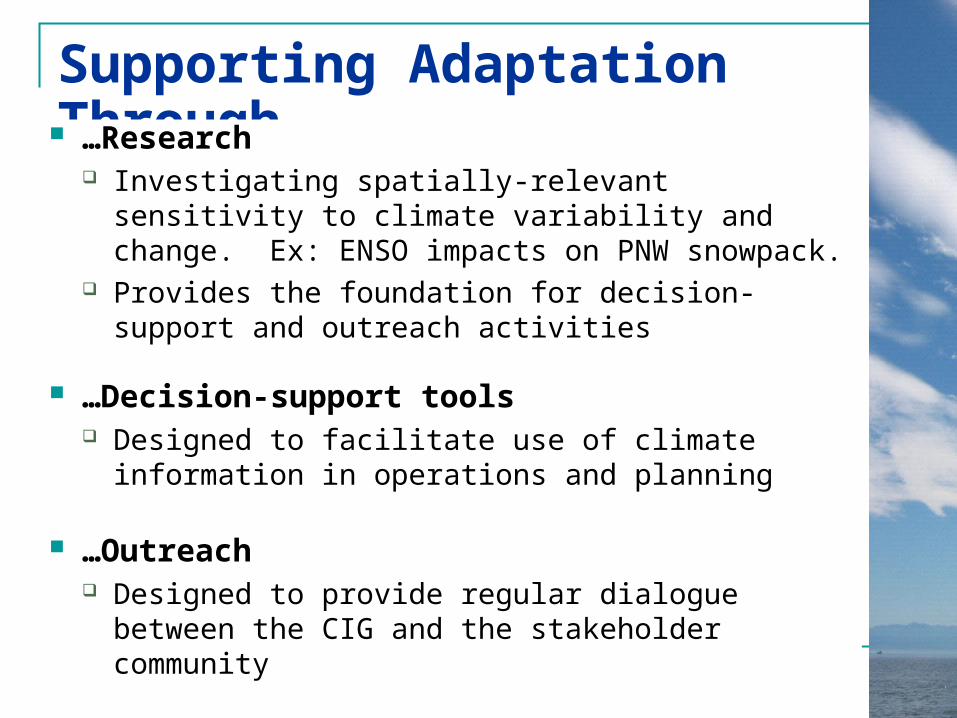
Supporting Adaptation Through… …Research
Investigating spatially-relevant sensitivity to climate variability and change. Ex: ENSO impacts on PNW snowpack.
Provides the foundation for decision-support and outreach activities
…Decision-support tools Designed to facilitate use of climate information in
operations and planning
…Outreach Designed to provide regular dialogue between the
CIG and the stakeholder community
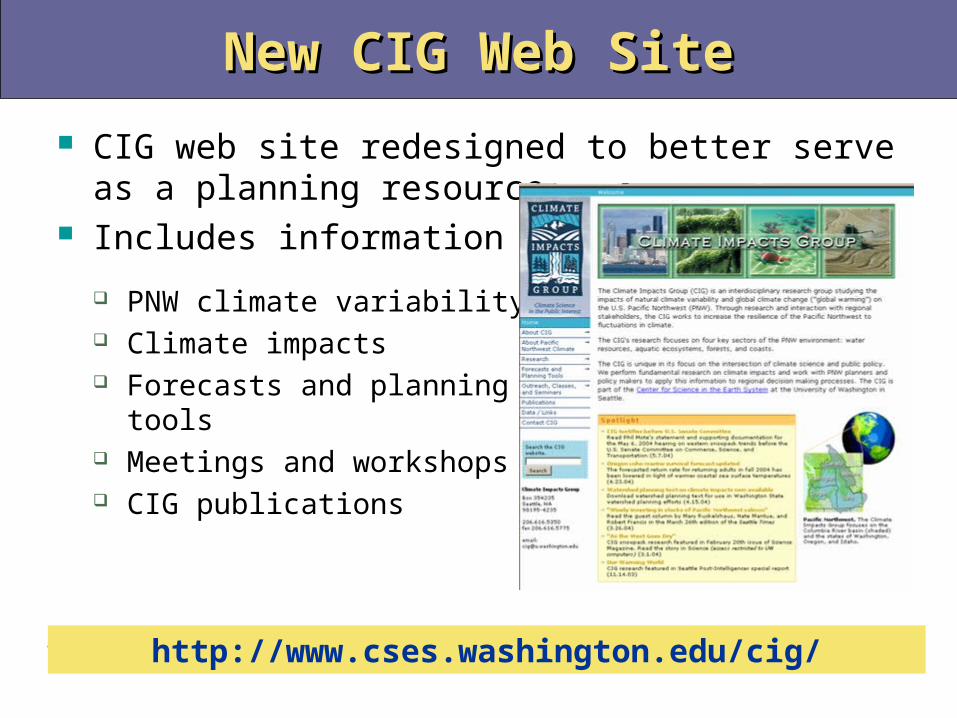
New CIG Web SiteNew CIG Web Site
CIG web site redesigned to better serve as a planning resource
Includes information on:
PNW climate variability and change
Climate impacts Forecasts and planning
tools Meetings and workshops CIG publications
http://www.cses.washington.edu/cig/
Supporting Adaptation: Decision-support Tools

CIG Decision-Support Tools: Climate Variability
Seasonal climate outlook
Long-lead (1 year) climate-based streamflow forecast for the Columbia River and Snake River systems. Expanding to western U.S.
Six-month lead time reservoir forecasts tools (under development)
Oregon Coastal Coho salmon survival forecasts
Extreme events forecasting
Designed to help with management on seasonal to interannual time scales. Main “products”:

Seasonal Climate Outlook
Interpreting global ENSO forecasts and PDO state for PNW (temperature, precipitation).
Excerpt of the Fall 2004 - Winter 2005 forecast:Tropical Pacific now: The tropical Pacific has been slightly warmer than normal for several months, and is expected to continue so, with a chance that a weak El Niño event will occur this winter. (See the Climate Prediction Center's discussion.)What will it mean for the Northwest in coming months? With little forecasting help from the tropical Pacific, the odds for precipitation are roughly normal for the next year. The odds for temperature are also normal until winter, when above-average temperatures become more likely - a reflection largely of recent trends toward warmer weather (e.g., 8 of the last 10 winters have
been at least 1°F warmer than "normal" in Washington state).
Available on CIG, WA State Climatologist web sites (http://www.cses.washington.edu/cig/fpt/cloutlook.shtml).
Lets resource managers begin hedging risks based on historically observed responses to ENSO and PDO.

Long-lead Streamflow Long-lead Streamflow ForecastsForecasts
http://www.cses.washington.edu/cig/fpt/waterfc/oneyearstreamflow.shtml-- Forecast may affect reservoir mgmt,
hydro production, instream flow management choices
-- Scenarios available for western US. Updated monthly.
-- Scenarios available on the CIG’s web site.0
100000
200000
300000
400000
500000
600000
700000
J J A S O N D J F M A M J J A S
Climate Forecast
Estimated Initial Conditions
ForecastEnsemble
Lead time = 12 months
Warm ENSO Only

Developing six-month forecasts for municipal water supplies in the Puget Sound area using NCEP forecasts
Streamflow forecast Reservoir storage forecast Demand forecasts
April Forecast Streamflows on Cedar River at Chester Morse
0
100
200
300
400
500
600
May-03 Jun-03 Jul-03 Aug-03 Sep-03 Oct-03
Av
era
ge
Mo
nth
ly F
low
(c
fs)
0
100
200
300
400
500
600
Median Ensemble Forecast Ave. Actual Hist. Ave
Adjusted April 2003 Forecast: Total Seattle Reservoir Storage
0
5
10
15
20
25
30
35
40
45
50
Date
To
tal S
tora
ge
Bill
ion
Gal
lon
s
0.00
5.00
10.00
15.00
20.00
25.00
30.00
35.00
40.00
45.00
50.00
median Ensembles Forecast Average Observed Storage
Low Reservoir Conditions
April Forecast: 4.29-10.22.03
100
120
140
160
180
200
220
240
4/29/2003 5/29/2003 6/29/2003 7/29/2003 8/29/2003 9/29/2003
de
ma
nd
, m
gd
MaxMin25th%75th%AverageActualForecast using ave Tmax ('83-'02)Forecast using real climate ('03)
Municipal Reservoir Forecasts

Construct Forecasting Systems: Salmon Returns
Coastal Ocean Conditions
Sea surface temperatures
Sea level
Nearshore winds
Oregon coho
salmon survival
SpringFall Winter Summer
FisheryRun-size forecast
(using obs’d conditions)Run-size forecast (using SST forecast)
Plankton surveysJack returns
Harvest & allocation
decisions (February)
http://www.cses.washington.edu/cig/fpt/orcohofc.shtml

Experimental 7-14 day extreme weather event risk assessment forecasts available for the PNW. Available for region or by specific stations.
Based on observed relationships between the probability of certain extreme weather events in the US and variations in Pacific North American atmospheric circulation pattern. Ex: PNW locations 2-4 times more likely to experience an
extremely high daily maximum temperature on positive vs. negative PNA days, depending on location
Forecasts include probabilities for: Extreme warm/cold days, days with extremely high precip,
heavy snowfall events
http://www.cses.washington.edu/cig/fpt/extreme.shtml
Extreme Events Forecasting

CIG Decision-Support Tools: Climate Change
Climate change impact scenarios
Client-based research consultancies
Climate change streamflow scenarios tool
Technical planning assistance
Designed to help managers evaluate and respond to projected climate change impacts. Research focused on the 2020s and 2040s. Main “products”:
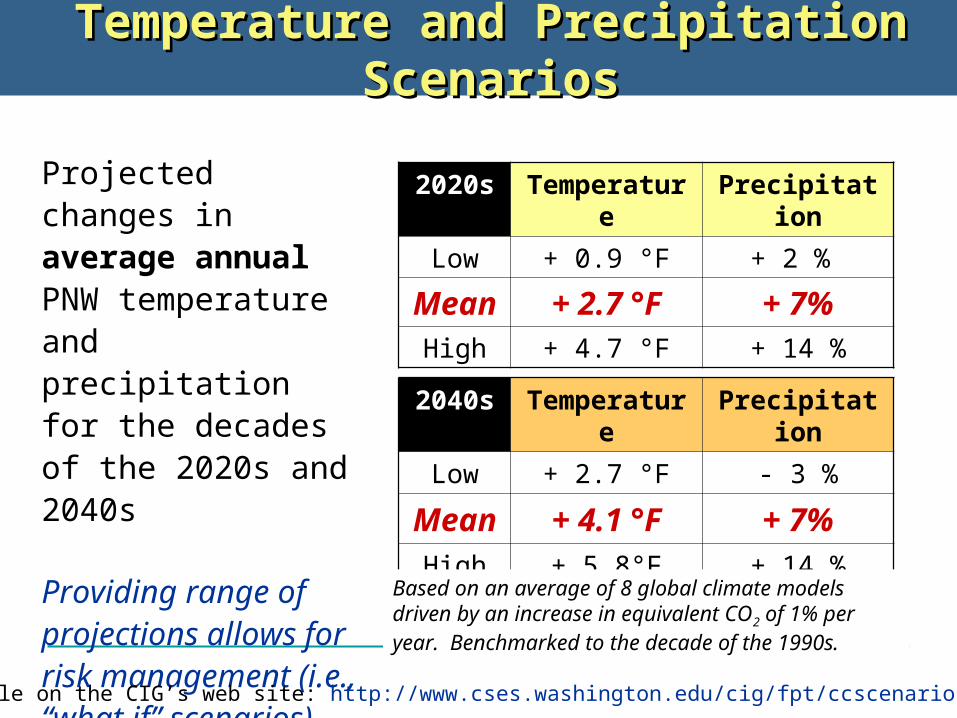
Temperature and Precipitation Temperature and Precipitation ScenariosScenarios
Projected changes in average annual PNW temperature and precipitation for the decades of the 2020s and 2040s
Providing range of projections allows for risk management (i.e., “what if” scenarios)
2020s Temperature Precipitation
Low + 0.9 °F + 2 %
Mean + 2.7 °F + 7%High + 4.7 °F + 14 %
2040s Temperature Precipitation
Low + 2.7 °F - 3 %
Mean + 4.1 °F + 7%High + 5.8°F + 14 %
Available on the CIG’s web site: http://www.cses.washington.edu/cig/fpt/ccscenarios.shtml
Based on an average of 8 global climate models driven by an increase in equivalent CO2 of 1% per year. Benchmarked to the decade of the 1990s.

Changes in April 1 snowpack available at basin and sub-basin levels
Scenarios for April 1 SnowpackScenarios for April 1 Snowpack
Current Climate
-44% -58%
“2020s” (+3°F) “2040s” (+4.5°F)
Contact the CIG for availability
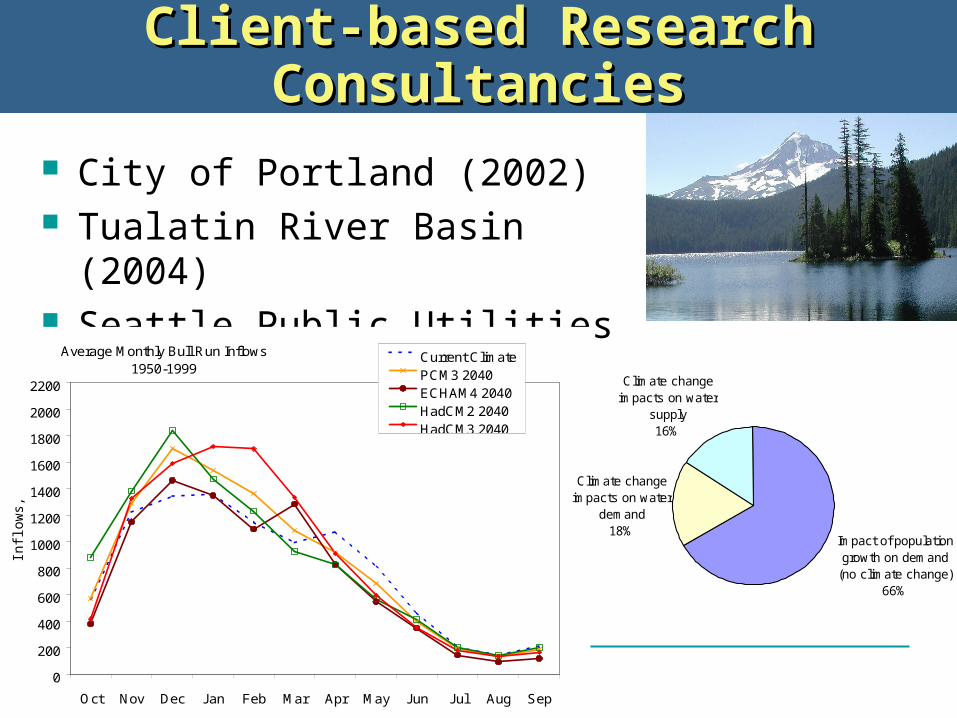
Client-based Research Client-based Research ConsultanciesConsultancies
City of Portland (2002) Tualatin River Basin (2004) Seattle Public Utilities (2004)
Average Monthly Bull Run Inflows1950-1999
0
200
400
600
800
1000
1200
1400
1600
1800
2000
2200
Oct Nov Dec Jan Feb Mar Apr May Jun Jul Aug Sep
Inflo
ws,
cfs
Current ClimatePCM3 2040ECHAM4 2040HadCM2 2040HadCM3 2040
Climate change impacts on water
demand18%
Climate change impacts on water
supply16%
Impact of population growth on demand
(no climate change)66%
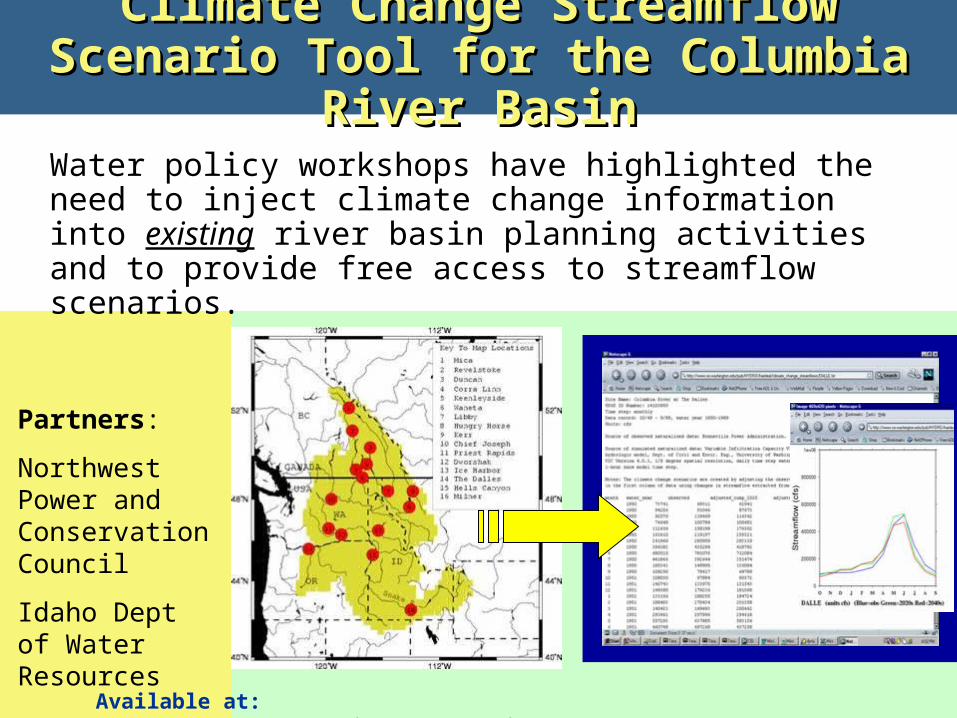
Climate Change Streamflow Climate Change Streamflow Scenario Tool for the Columbia Scenario Tool for the Columbia
River BasinRiver BasinWater policy workshops have highlighted the need to inject climate change information into existing river basin planning activities and to provide free access to streamflow scenarios.
Available at: http://www.cses.washington.edu/cig/fpt/ccstreamflowtool/sft.shtml
Partners:
Northwest Power and Conservation Council
Idaho Dept of Water Resources
Supporting Adaptation: Outreach
Promotes regional understanding of climate impacts in PNW water resource management. Activities include:
Workshops and meetings Presentations and briefings One-on-one technical assistance Work with the local media Web site development and maintenance
Provides opportunity for feedback from the stakeholder community
Outreach

Technical Assistance for Watershed Planning
Building a foundation and forging relationships with state staff and local planning units
Developing language for use in planning documentation Developing GIS-based maps of watershed-scale impacts
http://www.cses.washington.edu/cig/fpt/watershedplan.shtml
Information about climate variability and change need to be translated for and delivered to the watershed level.
Initial focus on WA; expanding to OR, ID
Meetings and WorkshopsMeetings and Workshops Sector-specific meetings with technical resource staff
and senior decision makers:
Climate Impacts on Salmon Management and Recovery in the Columbia River Basin (9.21.04)
Fall climate and water forecast meetings (WA/OR and ID)
Climate and water policy meetings (2001, 2002)
2005: expansion of salmon and coastal work
CIG available to give presentations at meetings, agencies, etc.
http://www.cses.washington.edu/cig/outreach/workshops.shtml
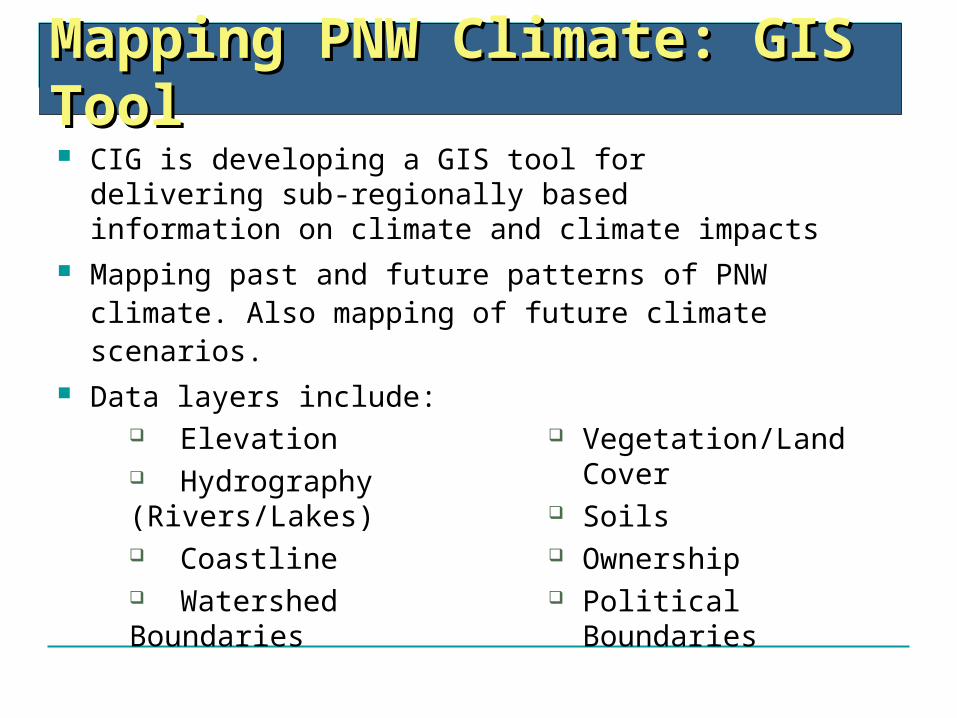
Mapping PNW Climate: Mapping PNW Climate: GIS ToolGIS Tool CIG is developing a GIS tool for delivering sub-
regionally based information on climate and climate impacts
Mapping past and future patterns of PNW climate. Also mapping of future climate scenarios.
Data layers include:
Vegetation/Land Cover
Soils Ownership Political Boundaries
Elevation Hydrography (Rivers/Lakes) Coastline Watershed Boundaries
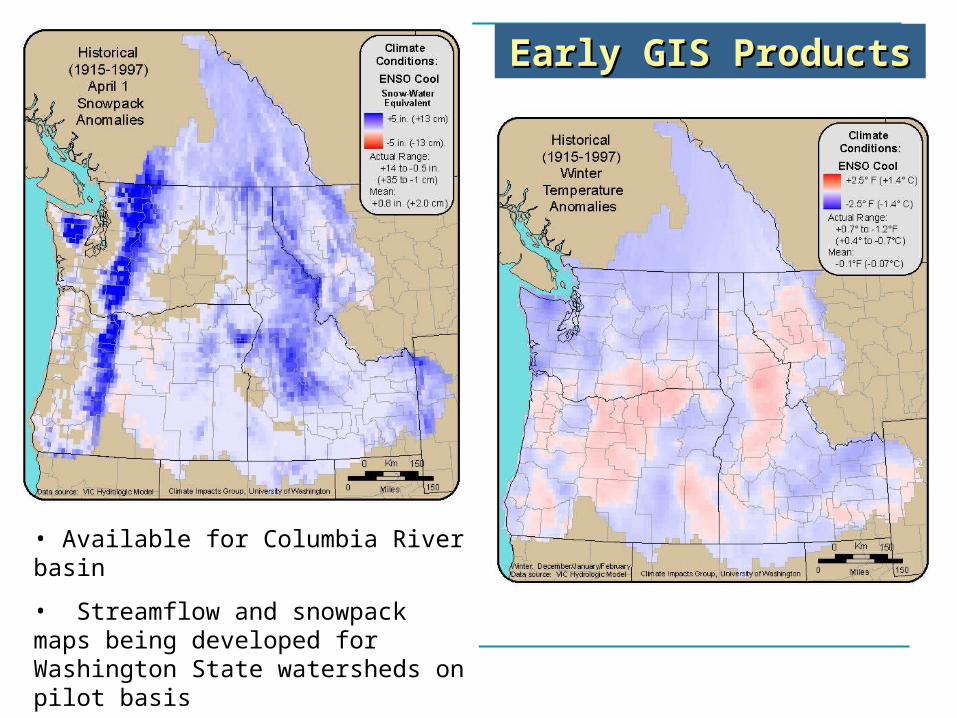
Early GIS ProductsEarly GIS Products
• Available for Columbia River basin
• Streamflow and snowpack maps being developed for Washington State watersheds on pilot basis
• Will be available on CIG website
CIG is available to assist in planning activities
Research
• General as well as consultancy-based research
Decision-support products
• Forecasts
• Climate change scenarios
Outreach
• Technical assistant
• Meetings and workshops

For More Information or Assistance….
Please contact
Lara Whitely BinderUW Climate Impacts Group
www.cses.washington.edu/cigClimate Science in the
Public Interest