the climate and weather of waikato - niwa | … climateweb.pdf · this publication replaces the...
TRANSCRIPT

THE CLIMATE AND WEATHER OF
W A I K A T O2nd edition P.R. Chappell
Note to Second EditionThis publication replaces the first edition of the New Zealand Meteorological Service Miscellaneous Publication 115 (7), written in 1974 by W.J. Maunder. This edition incorporates more recent data and updated methods of climatological variable calculation.
NIWA SCIENCE AND TECHNOLOGY SERIES NUMBER 61
ISSN 1173-0382
© All rights reserved. The copyright for this report, and for the data, maps, figures and other information (hereafter collectively referred to as “data”) contained in it, is held by NIWA. This copyright extends to all forms of copying and any storage of material in any kind of information retrieval system.
While NIWA uses all reasonable endeavours to ensure the accuracy of the data, NIWA does not guarantee or make any representation or warranty (express or implied) regarding the accuracy or completeness of the data, the use to which the data may be put or the results to be obtained from the use of the data. Accordingly, NIWA expressly disclaims all legal liability whatsoever arising from, or connected to, the use of, reference to, reliance on or possession of the data or the existence of errors therein. NIWA recommends that users exercise their own skill and care with respect to their use of the data and that they obtain independent professional advice relevant to their particular circumstances.

THE CLIMATE AND WEATHER OF WAIKATO2nd edition P.R. Chappell


CONTENTSSUMMARY 6
INTRODUCTION 7
TYPICAL WEATHER SITUATIONS IN WAIKATO 9Fine weather spells 9Showery periods 9Periods of moderate to heavy rain 10
CLIMATIC ELEMENTS 13Wind 13Rainfall 15
Rainfall distribution 15Rainfall frequency and intensity 18Recent extreme events in Waikato 19Periods of low rainfall 20
Temperature 21Sea surface temperature 21Air temperature 22Earth Temperatures 25Frosts 26
Sunshine and Solar Radiation 27Sunshine 27Solar radiation 28UV (Ultra-violet radiation) 28
Fog 29Severe convective storms 30
Thunderstorms 30Hail 30Tornadoes 30
Sea swell and waves 30
DERIVED CLIMATOLOGICAL PARAMETERS 33Vapour pressure and relative humidity 33Evapotranspiration and soil water balance 34Degree-day totals 36
ACKNOWLEDGEMENTS 38
REFERENCES 38
Phot
o: ©
myc
hilly
bin.
co.n
z/Ju
lie F
itz-G
eral
d

6
SUMMARYWaikato exhibits a range of climates due to the variety of landscapes in the region. The northern coastal areas of Coromandel Peninsula and the Hauraki Plains have different climatic characteristics to the high altitude areas around Taupo and Tongariro National Park in the south of the region. It can be very windy in exposed areas, but low elevation inland parts of the region are more sheltered. Mountain ranges cause rainfall anomalies which are directly related to elevation. However, rainfall is generally plentiful year-round. An east-west gradient of bright sunshine is observed, with more sunshine in the east than the west of the region.

Figure 1. Map of Waikato region, with locations of places mentioned in the text, tables, and figures.
7
INTRODUCTIONThe Waikato region (Figure 1) extends from Coromandel Peninsula in the north to Mt Ruapehu in the south, and is defined here as the region administered by the Waikato Regional Council, and also includes Tongariro National Park (Mt Ruapehu). The region covers a large portion of the central North Island’s west coast, with a number of harbours offering shelter from the predominant southwest swells. On the east coast, Coromandel Peninsula extends to the north with white sandy beaches and Kauri forests, and shelters the Firth of Thames.
The landscape setting of the region varies significantly, which has an impact on the region’s climate. Low elevation and northern coastal settings in the Thames-Coromandel District give way to extensive pasture and hill country for the majority of the region, which supports large dairy farms and plantation forestry. The Central Plateau rises near Taupo, with an alpine desert landscape surrounding the volcanoes of Tongariro National Park.
All numbers given in the following tables are calculated from the 1981-2010 normal period (a normal is an average or estimated average over a standard 30-year period), unless otherwise stated.

8
9
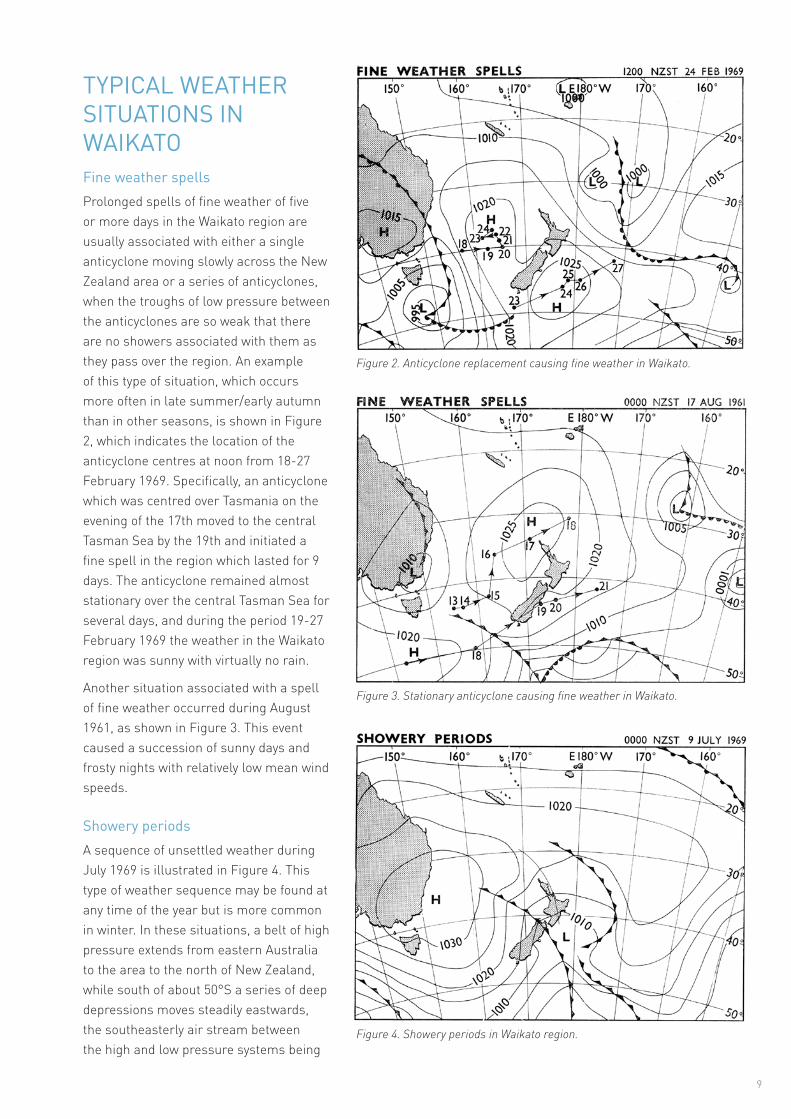
TYPICAL WEATHER SITUATIONS IN WAIKATOFine weather spellsProlonged spells of fine weather of five or more days in the Waikato region are usually associated with either a single anticyclone moving slowly across the New Zealand area or a series of anticyclones, when the troughs of low pressure between the anticyclones are so weak that there are no showers associated with them as they pass over the region. An example of this type of situation, which occurs more often in late summer/early autumn than in other seasons, is shown in Figure 2, which indicates the location of the anticyclone centres at noon from 18-27 February 1969. Specifically, an anticyclone which was centred over Tasmania on the evening of the 17th moved to the central Tasman Sea by the 19th and initiated a fine spell in the region which lasted for 9 days. The anticyclone remained almost stationary over the central Tasman Sea for several days, and during the period 19-27 February 1969 the weather in the Waikato region was sunny with virtually no rain.
Another situation associated with a spell of fine weather occurred during August 1961, as shown in Figure 3. This event caused a succession of sunny days and frosty nights with relatively low mean wind speeds.
Showery periodsA sequence of unsettled weather during July 1969 is illustrated in Figure 4. This type of weather sequence may be found at any time of the year but is more common in winter. In these situations, a belt of high pressure extends from eastern Australia to the area to the north of New Zealand, while south of about 50°S a series of deep depressions moves steadily eastwards, the southeasterly air stream between the high and low pressure systems being
Figure 2. Anticyclone replacement causing fine weather in Waikato.
Figure 3. Stationary anticyclone causing fine weather in Waikato.
Figure 4. Showery periods in Waikato region.

10
Figure 7. Depression causing rain in Waikato region.
‘punctuated’ with frontal systems. As these systems cross New Zealand a period of rain is usually experienced in places exposed to the west, but little if any rain reaches districts east of the main ranges.
A somewhat similar pattern for 23 September 1961 is shown in Figure 5. In this case a belt of relatively high pressure lies north of the Tasman Sea and New Zealand, while low pressure systems are passing eastwards in the far south, giving a strong air stream over New Zealand from directions between northwest and west-south-west. Showers in this air stream are usually intensified by the orography of the Waikato region and showery weather will often occur over the whole region. Cold fronts, often present in such air streams, also cause an increase in the intensity of the showers as they cross the region. Showery periods of this nature usually last several days. In this case significant amounts of rain occurred on several of the days between 22 and 28 September 1961.
Periods of moderate to heavy rainWhen a depression crosses the North Island from the northwest to the southeast, periods of moderate to heavy rain often occur in the Waikato region. A typical situation of this type for 7 May 1969 is shown in Figure 6. In this case, a depression had formed over the north Tasman Sea and deepened as it moved towards the southeast. At 6 am on the 7th the centre was near New Plymouth and by midnight the depression was some 650 km south-east of National Park. During the 3 days 5-7 May 1969 considerable rain falls were recorded in the region.
Another example of a situation producing periods of moderate to heavy rain is given in Figure 7. In this case a deep depression moved from near the New South Wales coast to the area south of the South Island, and an associated frontal system crossed New Zealand from the west giving a brief period of moderate to heavy rain in areas exposed to the west.
Figure 5. Showery periods in Waikato region.
Figure 6. Pressure systems causing rainy periods in Waikato region.

11
The tropical cyclone season in the southern hemisphere lasts from November to April. Tropical cyclones reaching northern New Zealand and still retaining true cyclonic characteristics, such as a warm core, are extremely rare. However, storms of tropical origin (which may never have been fully developed tropical cyclones) affect Waikato about once or twice each year, mainly between the months of December and April. They usually bring heavy rain and strong easterly winds. Ex-tropical storms generally affect the Coromandel Peninsula more significantly than the rest of the Waikato region.
One example of an ex-tropical cyclone that affected the Coromandel Peninsula was ex-tropical cyclone Fergus, in December 1996. All major Coromandel roads were closed by slips and flooding as the storm battered the area. A State of Emergency was declared for the Thames-Coromandel District, as well as parts of the Hauraki District and the Matamata-Piako District. Hundreds of holiday makers were trapped by flood waters and had to seek shelter in Civil Defence centres.
Figure 8a-e shows, by months, the tracks of tropical cyclones which made landfall in New Zealand during the period between 1970 and 2010.
Figure 8a. Tropical cyclones which made landfall in New Zealand during December, 1970-2010. Source: Southwest Pacific Enhanced Archive of Tropical Cyclones (SPEArTC; Diamond et al., 2012)
Figure 8b. Tropical cyclones which made landfall in New Zealand during January, 1970-2010. Source: SPEArTC (Diamond et al., 2012)
Figure 8c. Tropical cyclones which made landfall in New Zealand during February, 1970-2010. Source: SPEArTC (Diamond et al., 2012)
Figure 8d. Tropical cyclones which made landfall in New Zealand during March, 1970-2010. Source: SPEArTC (Diamond et al., 2012)
Figure 8e. Tropical cyclones which made landfall in New Zealand during April, 1970-2010. Source: SPEArTC (Diamond et al., 2012)
12

Whitianga Aero AWS Mt TeAroha TV Station
Port Taharoa AWS Hamilton Aero
Taupo Aero
13
CLIMATIC ELEMENTSWindNortherly or westerly air flows are common over most of the region, although as in all areas of New Zealand the specific prevailing and strong wind direction in any locality is determined largely by local topography. Figure 9 shows mean annual wind frequencies of surface wind based on hourly observations from selected stations. Exposed sites such as Mt Te Aroha and Port Taharoa have a higher percentage of strong winds than more sheltered sites, such as Hamilton.
Mean wind speed data (average wind speeds are taken over the 10 minute period preceding each hour) are available for several sites in Waikato, and these illustrate the several different wind regimes of the region. Coastal areas (e.g. Port Taharoa) tend to be windier throughout the year compared with sheltered inland areas (e.g. Paeroa). Areas at higher elevations (e.g. Mt Ruapehu Chateau) are generally windier than low-lying sites. Table 1 gives mean monthly and annual wind speeds for selected stations in Waikato.
Table 1. Mean monthly/annual wind speeds (km/hr) for Waikato sites.
Location Jan Feb Mar Apr May Jun Jul Aug Sep Oct Nov Dec AnnWhitianga Aero AWS 12 12 11 10 11 11 11 12 12 14 14 13 12Paeroa AWS 9 9 8 7 8 8 9 9 10 10 10 9 9Port Taharoa AWS 15 15 15 15 17 18 16 17 17 20 19 17 17Hamilton AWS 11 10 10 9 9 10 10 11 11 13 13 12 11Taupo AWS 13 12 12 11 12 13 12 13 12 15 15 14 13Mt Ruapehu, Chateau EWS 14 13 14 13 15 16 16 15 15 16 15 14 15
Figure 9. Mean annual wind frequencies (%) of surface wind directions from hourly observations at selected Waikato stations. The plots show the directions from which the wind blows, e.g. the dominant wind direction at Whitianga is from the southwest.
14
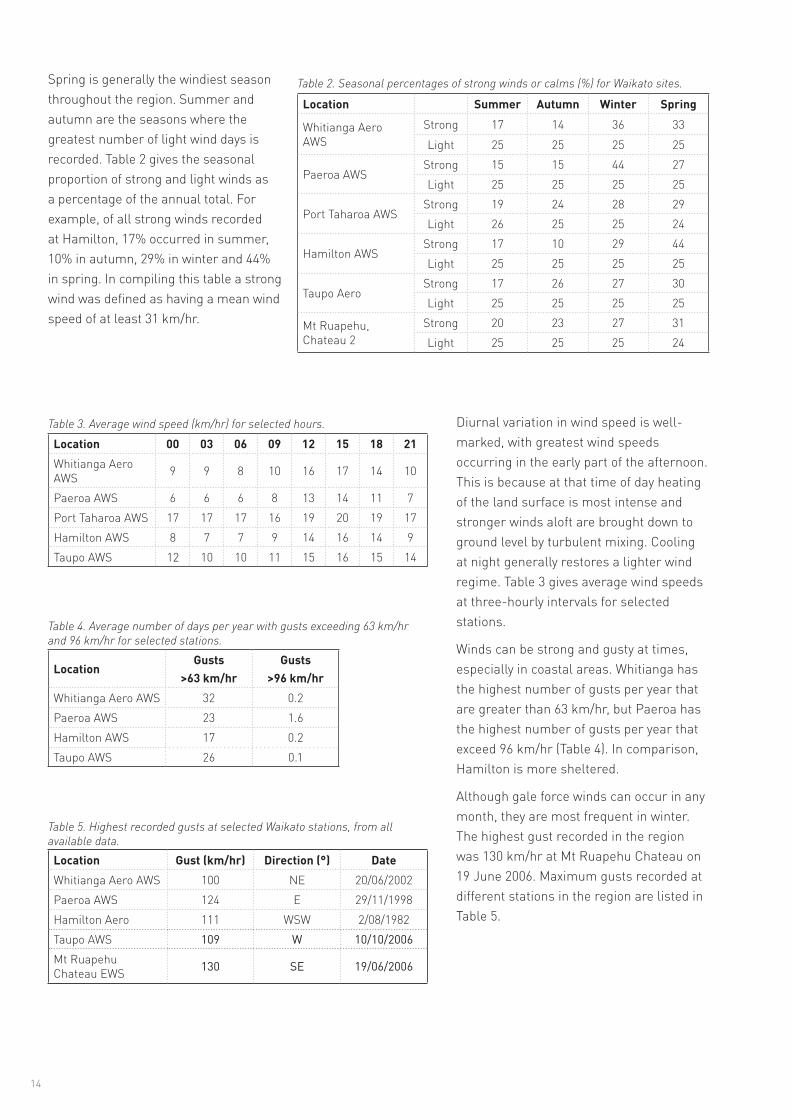
Spring is generally the windiest season throughout the region. Summer and autumn are the seasons where the greatest number of light wind days is recorded. Table 2 gives the seasonal proportion of strong and light winds as a percentage of the annual total. For example, of all strong winds recorded at Hamilton, 17% occurred in summer, 10% in autumn, 29% in winter and 44% in spring. In compiling this table a strong wind was defined as having a mean wind speed of at least 31 km/hr.
Table 2. Seasonal percentages of strong winds or calms (%) for Waikato sites.
Table 3. Average wind speed (km/hr) for selected hours.
Table 4. Average number of days per year with gusts exceeding 63 km/hr and 96 km/hr for selected stations.
Table 5. Highest recorded gusts at selected Waikato stations, from all available data.
Location Summer Autumn Winter Spring
Whitianga Aero AWS
Strong 17 14 36 33Light 25 25 25 25
Paeroa AWSStrong 15 15 44 27Light 25 25 25 25
Port Taharoa AWSStrong 19 24 28 29Light 26 25 25 24
Hamilton AWSStrong 17 10 29 44Light 25 25 25 25
Taupo AeroStrong 17 26 27 30Light 25 25 25 25
Mt Ruapehu, Chateau 2
Strong 20 23 27 31Light 25 25 25 24
Location 00 03 06 09 12 15 18 21Whitianga Aero AWS 9 9 8 10 16 17 14 10
Paeroa AWS 6 6 6 8 13 14 11 7Port Taharoa AWS 17 17 17 16 19 20 19 17Hamilton AWS 8 7 7 9 14 16 14 9Taupo AWS 12 10 10 11 15 16 15 14
LocationGusts
>63 km/hrGusts
>96 km/hrWhitianga Aero AWS 32 0.2Paeroa AWS 23 1.6Hamilton AWS 17 0.2Taupo AWS 26 0.1
Location Gust (km/hr) Direction (°) DateWhitianga Aero AWS 100 NE 20/06/2002Paeroa AWS 124 E 29/11/1998Hamilton Aero 111 WSW 2/08/1982Taupo AWS 109 W 10/10/2006Mt Ruapehu Chateau EWS 130 SE 19/06/2006
Diurnal variation in wind speed is well-marked, with greatest wind speeds occurring in the early part of the afternoon. This is because at that time of day heating of the land surface is most intense and stronger winds aloft are brought down to ground level by turbulent mixing. Cooling at night generally restores a lighter wind regime. Table 3 gives average wind speeds at three-hourly intervals for selected stations.
Winds can be strong and gusty at times, especially in coastal areas. Whitianga has the highest number of gusts per year that are greater than 63 km/hr, but Paeroa has the highest number of gusts per year that exceed 96 km/hr (Table 4). In comparison, Hamilton is more sheltered.
Although gale force winds can occur in any month, they are most frequent in winter. The highest gust recorded in the region was 130 km/hr at Mt Ruapehu Chateau on 19 June 2006. Maximum gusts recorded at different stations in the region are listed in Table 5.

15
Rainfall
Rainfall distribution
Rainfall patterns in the region are closely related to elevation, and exposure to the predominant air flows (westerly and northeasterly). The distribution of the Waikato region’s median annual rainfall is shown in Figure 10. Areas with high annual rainfall over 2000 mm (Coromandel Ranges, Central Plateau south of Lake Taupo, hill country west of Te Kuiti) provide a stark contrast to areas which receive around 1100 mm of rain per year, that is the area east of Hamilton and the Hauraki Plains, as well as east of Taupo.
Seasonal influences on rainfall distribution are also quite well defined. Table 6 lists monthly rainfall normals and percentage of annual total for selected stations. This table shows a clearly defined winter rainfall maximum. Monthly percentages of the annual rainfall total are fairly consistent across the Waikato region, with around 31% of annual rainfall expected in the winter months from June to August, and around 22% of rain in the summer months from December to February.
Table 6. Monthly/annual rainfall normals (a; mm); percentage of annual total for each month (b; %)
Location Jan Feb Mar Apr May Jun Jul Aug Sep Oct Nov Dec Ann
Whitianga Aero AWSa 82 112 139 152 171 205 242 196 169 139 104 129 1840
b 4 6 8 8 9 11 13 11 9 8 6 7
Thames 2a 65 70 78 104 90 120 148 124 96 93 74 81 1141
b 6 6 7 9 8 10 13 11 8 8 6 7
Hamilton, Ruakura EWS
a 69 62 71 67 117 102 116 73 85 91 101 118 1072b 6 6 7 6 11 9 11 7 8 8 9 11
Te Kuiti EWSa 100 93 87 104 134 149 164 140 130 138 117 140 1496b 7 6 6 7 9 10 11 9 9 9 8 9
Taupo AWSa 78 69 65 68 75 93 96 87 82 86 68 94 960
b 8 7 7 7 8 10 10 9 8 9 7 10
Mt Ruapehu Chateau EWS
a 189 167 174 180 233 258 263 241 271 280 236 268 2759b 7 6 6 7 8 9 10 9 10 10 9 10
Figure 10. Waikato median annual total rainfall, 1981-2010.
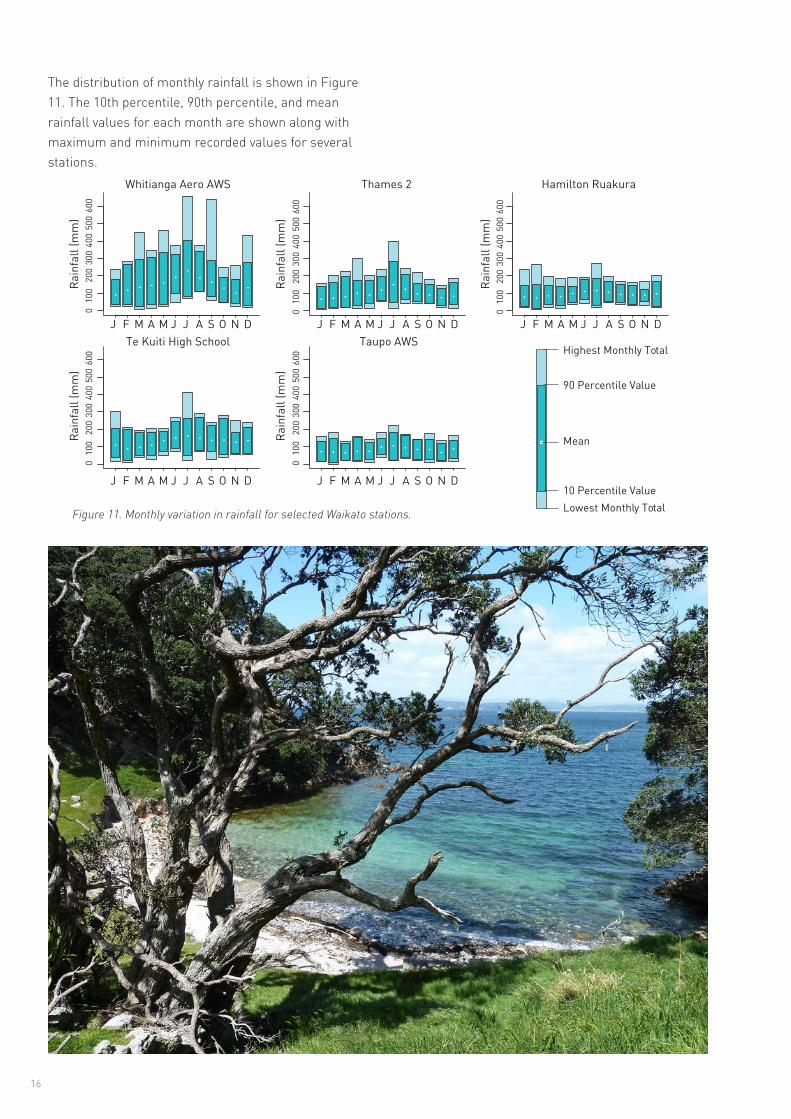
The distribution of monthly rainfall is shown in Figure 11. The 10th percentile, 90th percentile, and mean rainfall values for each month are shown along with maximum and minimum recorded values for several stations.
Whitianga Aero AWS Thames 2 Hamilton Ruakura
Te Kuiti High School
010
020
030
040
050
060
00
100
200
300
400
500
600
010
020
030
040
050
060
00
100
200
300
400
500
600
010
020
030
040
050
060
0
Taupo AWSJ F M A M J J A S O N D J F M A M J J A S O N D J F M A M J J A S O N D
J F M A M J J A S O N D J F M A M J J A S O N D
Rain
fall
(mm
)Ra
infa
ll (m
m)
Rain
fall
(mm
)
Rain
fall
(mm
)
Rain
fall
(mm
)
16
Figure 11. Monthly variation in rainfall for selected Waikato stations.
Mean
Lowest Monthly Total
90 Percentile Value
10 Percentile Value
Highest Monthly Total

Rainfall variability over longer periods is indicated by rainfall deciles, as given in Table 7. The 10th percentile values show the accumulated rainfalls that will normally be exceeded in nine out of ten years, while the 90th percentile values indicate the accumulated falls that will normally be exceeded in only one year in ten. The table includes periods from one month to
twelve months; each period over one month begins with the month stated. For example, using the table for Whitianga, for three months it can be seen that in the three month period beginning in April, 304 mm or more of rainfall can be expected in nine years in ten, while a total of 713 mm should occur in only one year in ten.
17
Table 7. Rainfall deciles for consecutive months.
Jan Feb Mar Apr May Jun Jul Aug Sep Oct Nov DecWhitianga Aero AWS1 month10th 34 36 23 38 38 96 82 109 80 50 40 3090th 179 268 293 307 333 324 401 338 286 192 181 2773 months10th 192 164 256 304 317 362 388 335 273 196 213 18190th 680 645 708 713 974 951 943 766 478 568 525 5076 months10th 604 615 726 764 709 725 690 632 555 469 451 47990th 1217 1281 1459 1643 1647 1509 1397 1214 1033 944 1031 109012 months10th 1077 1144 1155 1154 1281 1268 1354 1479 1221 1280 1247 125190th 2329 2296 2263 2211 2239 2200 2269 2250 2221 2398 2378 2461Hamilton AWS1 month10th 23 11 20 31 58 89 64 68 41 45 42 3290th 127 182 138 203 152 198 229 209 176 161 174 1623 months10th 135 139 177 237 295 285 232 221 215 203 194 15790th 319 402 444 453 526 554 463 437 411 422 424 3706 months10th 434 467 549 562 549 523 511 450 387 374 340 35890th 767 837 898 889 894 832 830 730 785 754 763 78512 months10th 1048 1022 997 919 969 973 968 1037 1030 1072 1013 104390th 1498 1478 1469 1509 1620 1597 1587 1519 1576 1550 1542 1493Taupo AWS1 month10th 15 7 19 21 30 55 23 40 25 29 19 3190th 132 146 119 150 122 145 183 167 142 142 119 1363 months10th 101 111 143 165 211 196 156 166 154 156 146 13690th 318 359 320 308 413 384 370 356 330 327 327 3876 months10th 290 364 395 388 392 367 409 372 326 286 272 29090th 648 627 631 656 652 659 647 621 719 642 659 66312 months10th 768 750 747 747 760 789 805 782 769 785 796 78190th 1208 1167 1162 1150 1267 1250 1252 1251 1276 1285 1205 1272

Rainfall frequency and intensity
The average number of days each year on which 0.1 mm or more of rain is recorded varies from around 160 days in western and southern parts of the region (e.g. Raglan and Taupo) to over 200 days in eastern areas (e.g. Whitianga). Taupo also exhibits the lowest number of rain days, at 112 days per year. The 0.1 mm rain days and 1 mm wet days show the same geographic variability. Table 8 lists the average number of days per month with 0.1 mm and 1 mm of rain for selected stations.
Heavy rainfalls can occur in Waikato with the passage of depressions from the northwest or southeast, and with northeasterly flows between ridges of high pressure to the east and troughs over the Tasman Sea. Intense rainfalls also occur with thunderstorms. In Table 9, maximum short period rainfalls for periods of 10 minutes to 72 hours with calculated return periods are given for several stations. Also listed in this table are the maximum rainfalls expected in 2, 5, 10, 20, and 50 years. Depth-duration frequency tables for Waikato locations are available from NIWA’s High Intensity Rainfall Design System (HIRDS). HIRDS uses the index-frequency method to calculate rainfall return periods. For more information on methods and to use the tool, see www.hirds.niwa.co.nz.
18
Table 8. Average monthly rain days and wet days for Waikato region; a: 0.1 mm rain day, b: 1 mm wet day.
Location Jan Feb Mar Apr May Jun Jul Aug Sep Oct Nov Dec Ann
Whitianga Aero AWSa 11 12 15 18 20 22 23 22 19 16 14 14 205
b 9 9 10 11 13 14 15 16 13 11 10 10 140
Thames 2a 10 9 11 13 17 18 18 19 17 17 14 13 176b 7 6 8 9 11 13 13 13 12 11 9 9 122
Hamilton Ruakuraa 11 9 11 12 15 17 17 18 16 16 14 13 169b 8 7 8 8 11 13 13 13 12 12 11 10 126
Raglan Karioia 10 9 10 11 15 19 17 18 15 14 12 12 163b 8 7 8 9 13 15 15 15 13 12 10 10 134
Taupo AWSa 10 9 10 11 13 17 18 17 15 14 12 13 160b 7 7 7 8 8 11 12 12 11 10 8 9 112

19
Table 9. Maximum recorded short period rainfalls and calculated return periods from HIRDS.
Location 10min 20min 30min 1hr 2hrs 6hrs 12hrs 24hrs 48hrs 72hrsThames 2 a 12 21 30 60 71 91 102 131 190 209
b 6 11 19 68 39 17 7 7 16 15c 9 13 17 25 33 52 70 94 111 123d 12 17 22 32 43 68 91 122 145 161e 14 21 26 38 51 81 109 146 173 192f 17 25 31 45 61 96 129 173 205 227g 21 31 38 56 76 120 161 215 255 282
Hamilton Ruakura a 16 28 35 43 45 62 83 102 107 107b 9 29 37 25 10 8 11 10 6 4c 11 15 18 24 30 43 54 68 80 88d 14 19 22 30 38 55 69 87 103 113e 16 22 26 36 45 65 82 103 121 134f 19 26 31 42 53 76 96 120 142 157g 23 32 38 51 65 93 117 148 175 192
Te Kuiti High School a 21 30 38 57 69 85 104 147 150 182b 35 40 51 77 70 34 28 48 16 21c 10 14 17 22 29 45 58 76 96 110d 13 18 22 29 38 56 73 94 119 136e 16 22 26 35 45 66 84 108 137 157f 19 25 30 41 52 77 97 124 157 180g 23 32 38 51 64 93 117 148 187 214
Taupo NZED a 13 19 25 41 61 88 105 112 156 164b 11 11 14 17 35 38 31 14 31 24c 8 12 15 22 29 44 57 74 89 98d 10 15 20 30 38 56 72 92 109 121e 12 19 24 36 45 66 83 105 126 139f 15 22 29 43 54 77 96 120 143 159g 19 28 36 55 67 94 116 143 171 189
a: highest fall recorded (mm)b: calculated return period of a (years)c: max fall calculated with ARI 2 years (mm)d: max fall calculated with ARI 5 years (mm)e: max fall calculated with ARI 10 years (mm)f: max fall calculated with ARI 20 years (mm)g: max fall calculated with ARI 50 years (mm)Recent extreme events in Waikato
Waikato has experienced numerous extreme weather events, with significant damage and disruption caused by flooding and high winds (e.g. Figure 12). The events listed below are some of the most severe events to have affected the Waikato region between 1980 and 2012.
11-16 April 1981: A deep depression to the north and an anticyclone to the south caused a strong easterly flow over the eastern Waikato region. Torrential rain and high winds hit the Coromandel Peninsula and the Hauraki Plains. Half of Waikino Township was destroyed by flooding. Paeroa and Thames were severely inundated and over 2000 people were

20
evacuated, causing a Civil Defence Emergency (CDE) to be declared in the area. The total flood damage cost in the Paeroa area was over $44 million 2010 dollars.
16-17 February 1985: A CDE was declared in the Thames area after heavy rain caused flooding and landslides. All major roads in Coromandel Peninsula were closed. Major rivers in the area flooded, and people were isolated by floodwaters and slips. 164 people were evacuated in Te Aroha, while three people were killed in a debris flow and a woman drowned in floodwaters.
8-20 July 1998: Successive depressions moved east from the Tasman Sea over the country, causing heavy rainfall and flooding throughout the Waikato region. Lake Taupo rose to its highest level in 40 years, causing erosion to the foreshore. Extremely high river levels were experienced on the Waikato and Waipa Rivers, leading to extensive flooding downstream of Hamilton. In total, over 11,300 ha of farmland were flooded. A number of people were evacuated across the region, and damage to property was severe.
18-21 June 2002: A weather bomb struck the eastern Waikato region. Two weeks after the storm some areas were still without power or water. Roads were closed due to slips and flooding, and considerable damage was done to property. A CDE was declared in Tirau and Putaruru due to extensive flooding, causing evacuations, school closures, and a water shortage for 18,000 people. 500 people on the Coromandel Peninsula were evacuated. Insurance payouts for the event totalled over $29 million 2008 dollars.
26 July – 3 August 2008: Three storms hit the country over one week. The first storm caused power to be cut to 20,000 homes on the Coromandel Peninsula and
Periods of low rainfall
Periods of fifteen days or longer with less than 1 mm of rain on any day are referred to as ‘dry spells’. Dry spells are common in Waikato during the summer and early autumn. There is usually one, and frequently two, such periods each year between December and March. The average duration of a dry spell is about 20 days. The longest recent dry spell between three key sites in Waikato (Whitianga Airport, Hamilton, and Taupo) was 33 days recorded in Hamilton, from 24 January 1999 to 25 February 1999. During this dry spell, 19 consecutive days were without any rain. Other long dry spells include 30 days at Taupo from 1 February to 1 March 2000, of which 13 consecutive days were without any rain, and 30 days at Whitianga Airport from 14 November to 13 December 1999, all of which were without any rain.
Figure 12. Waikato River flooding near Mercer, August 2008.
the Hauraki Plains. Roads were closed due to slips and flooding, and damage to the town of Te Aroha was particularly severe. The second storm was longer-lasting, causing additional flooding, road closures, and damage on the Coromandel Peninsula and the Hauraki Plains. In the Coromandel, 20 schools were closed due to the storm. In Te Aroha, almost every property suffered damage due to extremely high winds. The third storm caused more flooding in already saturated areas, and rivers rose further. A number of people died as a result of the storms, in car accidents and from drowning.

21
Figure 13. Mean monthly land (Hamilton Ruakura) and sea surface temperatures (west coast and Coromandel).
Temperature
Sea surface temperature
Monthly mean sea surface temperatures off the west coast of Waikato region and Coromandel Peninsula are compared with mean air temperature for Hamilton in Figure 13. There is a six to eight week lag between the minima of land and sea temperatures, with west coast sea surface temperatures being slightly cooler than those off the east coast for most of the year. Figure 14 shows the mean sea surface temperatures for the New Zealand region for February and August, which are the warmest and coolest months with respect to sea surface temperatures.
Figure 14. Monthly mean sea surface temperatures (°C) for: a) February; b) August. Source: NIWA SST Archive, Uddstrom and Oien (1999).
0
5
10
15
20
25
Jan Feb Mar Apr May Jun Jul Aug Sep Oct Nov Dec
Mea
n te
mpe
ratu
re (
°C)
Month
Hamilton temperature West coast SST Coromandel SST
MEAN FEBRUARY SST (°C) MEAN AUGUST SST (°C)

22
Air temperature
In general, the Waikato region is characterised by relatively warm temperatures in the summer (20-25°C mean daily maximum temperature, Figure 15a) and relatively cold temperatures during the winter (0-8°C mean daily minimum temperature, Figure 15b). However, in the high country of Tongariro National Park, conditions are appreciably colder, especially in the winter; with temperatures often well below freezing. Figure 16 shows that median annual average temperature in the Waikato region varies with elevation and latitude. Low-lying areas around the Hauraki Plains and north of Hamilton have a mean annual temperature of around 14°C, whereas the area around Taupo has a mean annual temperature of around 11°C, and higher elevation areas in Tongariro National Park and the Kaimanawa Ranges have a mean annual temperature of less than 8°C. Figure 17 gives the monthly temperature regime (highest recorded, mean monthly maximum, mean daily maximum, mean, mean daily minimum, mean monthly minimum, and lowest recorded) for selected sites in Waikato.
Figure 15. a) Left: Waikato median summer average daily maximum temperature; b) Right: Waikato median winter average daily minimum temperature.

23
Figure 17 Monthly variation in air temperatures for selected Waikato stations.
Figure 16. Waikato median annual average temperature, 1981-2010.
Coromandel
−10
020
3040
−10
020
3040
−10
020
3040
−10
020
3040
−10
020
3040
Hamilton AWS Te Kuiti High School
Taupo AWS Mt Ruapehu Chateau 2
J F M A M J J A S O N D J F M A M J J A S O N D J F M A M J J A S O N D
J F M A M J J A S O N DJ F M A M J J A S O N D
Tem
pera
ture
(0 C)
Tem
pera
ture
(0 C)
Tem
pera
ture
(0 C)
Tem
pera
ture
(0 C)
Tem
pera
ture
(0 C)

24
The diurnal temperature range for Hamilton is moderate. Table 11 and Figure 18 show mean hourly temperatures for Hamilton AWS for January and July. From this, it can be seen that the average daily range for January is 9.7°C and for July it is 6.9°C.
Table 10. Average daily temperature range (Tmax - Tmin, °C) for Waikato sites.
Table 11. Mean hourly temperatures at Auckland Airport in January and July.
Figure 18. Mean hourly temperatures at Auckland Airport, January and July.
Location Jan Feb Mar Apr May Jun Jul Aug Sep Oct Nov Dec AnnWhitianga Aero AWS 10.1 9.5 9.8 9.9 9.1 8.9 8.9 8.9 9.1 8.7 8.9 9.2 9.2Thames 2 10.1 9.6 9.7 9.4 8.6 8.3 8.3 8.2 8.4 8.4 8.8 8.9 8.9Port Taharoa AWS 7.6 7.8 8.0 7.3 6.6 6.3 6.8 6.6 6.7 6.5 7.0 6.8 7.0Hamilton AWS 11.9 11.8 11.9 11.5 10.4 9.7 10.2 10.2 10.1 10 10.4 10.6 10.7Taupo AWS 11.3 11.1 10.8 10.4 9.3 8.6 8.9 9.2 9.5 9.4 10.4 10.3 9.9Mt Ruapehu Chateau EWS 11.0 10.5 9.9 9.1 7.9 7.3 7.4 7.5 8.3 8.7 10.0 9.9 9.0
hrs 00 01 02 03 04 05 06 07 08 09 10 11January 15.3 14.9 14.3 14.2 13.9 13.5 14.1 16.0 17.7 19.3 20.5 21.3July 7.1 6.9 6.6 6.4 6.3 6.2 6.1 6.1 6.1 7.5 9.2 10.6
hrs 12 13 14 15 16 17 18 19 20 21 22 23January 22.2 22.8 23.0 23.1 22.9 22.1 21.3 19.9 18.0 17.1 16.3 15.6July 11.6 12.5 12.9 12.8 12.7 11.6 10.1 9.3 8.7 8.1 7.7 7.4
Compared with some other parts of the country, the diurnal temperature range for Hamilton is relatively moderate. Table 11 and Figure 15 show mean hourly temperatures for Hamilton AWS for January and July.
The highest maximum temperature in Waikato is 34.8°C, recorded at Waihi on 30 January 1988. The extreme minimum temperature of -13.6°C was recorded at the Mt Ruapehu Chateau in July 1937, which is the lowest temperature on record for the North Island. These extreme temperatures compare to national extremes of 42.4°C and -25.6°C. 0
5
10
15
20
25
00 01 02 03 04 05 06 07 08 09 10 11 12 13 14 15 16 17 18 19 20 21 22 23
Mea
n ho
urly
tem
pera
ture
(°C)
Time
January July
25
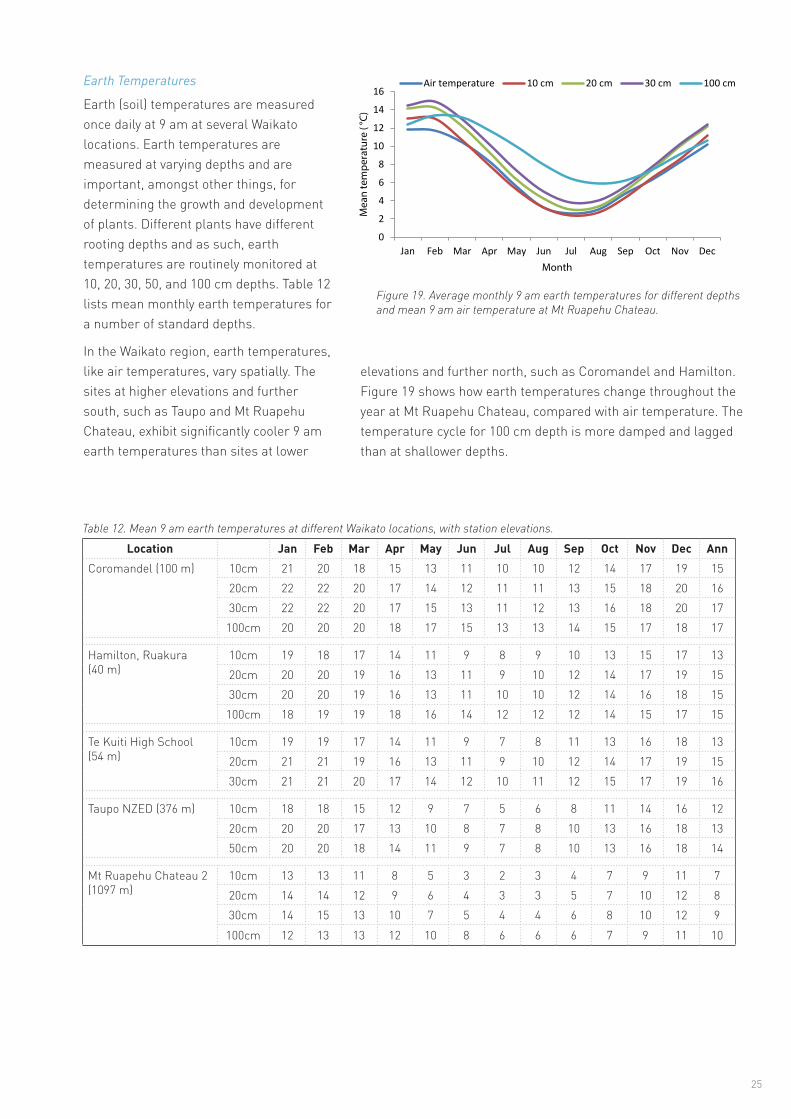
Earth Temperatures
Earth (soil) temperatures are measured once daily at 9 am at several Waikato locations. Earth temperatures are measured at varying depths and are important, amongst other things, for determining the growth and development of plants. Different plants have different rooting depths and as such, earth temperatures are routinely monitored at 10, 20, 30, 50, and 100 cm depths. Table 12 lists mean monthly earth temperatures for a number of standard depths.
In the Waikato region, earth temperatures, like air temperatures, vary spatially. The sites at higher elevations and further south, such as Taupo and Mt Ruapehu Chateau, exhibit significantly cooler 9 am earth temperatures than sites at lower
Table 12. Mean 9 am earth temperatures at different Waikato locations, with station elevations.
Figure 19. Average monthly 9 am earth temperatures for different depths and mean 9 am air temperature at Mt Ruapehu Chateau.
Location Jan Feb Mar Apr May Jun Jul Aug Sep Oct Nov Dec AnnCoromandel (100 m) 10cm 21 20 18 15 13 11 10 10 12 14 17 19 15
20cm 22 22 20 17 14 12 11 11 13 15 18 20 1630cm 22 22 20 17 15 13 11 12 13 16 18 20 17
100cm 20 20 20 18 17 15 13 13 14 15 17 18 17
Hamilton, Ruakura (40 m)
10cm 19 18 17 14 11 9 8 9 10 13 15 17 1320cm 20 20 19 16 13 11 9 10 12 14 17 19 1530cm 20 20 19 16 13 11 10 10 12 14 16 18 15
100cm 18 19 19 18 16 14 12 12 12 14 15 17 15
Te Kuiti High School (54 m)
10cm 19 19 17 14 11 9 7 8 11 13 16 18 1320cm 21 21 19 16 13 11 9 10 12 14 17 19 1530cm 21 21 20 17 14 12 10 11 12 15 17 19 16
Taupo NZED (376 m) 10cm 18 18 15 12 9 7 5 6 8 11 14 16 1220cm 20 20 17 13 10 8 7 8 10 13 16 18 1350cm 20 20 18 14 11 9 7 8 10 13 16 18 14
Mt Ruapehu Chateau 2 (1097 m)
10cm 13 13 11 8 5 3 2 3 4 7 9 11 720cm 14 14 12 9 6 4 3 3 5 7 10 12 830cm 14 15 13 10 7 5 4 4 6 8 10 12 9
100cm 12 13 13 12 10 8 6 6 6 7 9 11 10
0
2
4
6
8
10
12
14
16
Jan Feb Mar Apr May Jun Jul Aug Sep Oct Nov Dec
Mea
n te
mpe
ratu
re (
°C)
Month
Air temperature 10 cm 20 cm 30 cm 100 cm
elevations and further north, such as Coromandel and Hamilton. Figure 19 shows how earth temperatures change throughout the year at Mt Ruapehu Chateau, compared with air temperature. The temperature cycle for 100 cm depth is more damped and lagged than at shallower depths.

26
Table 13. Occurrences of frosts and grass minimum temperatures in Waikato.
Frosts
Frost is a local phenomenon and its frequency of occurrence can vary widely over very small areas. Areas most likely to be subjected to frost are flat areas, where air is not able to drain away on calm nights, and valleys, where cold air is likely to drift from higher areas.
There are two types of frost recorded. Air frosts occur when air temperature measured in a screen by a thermometer 1.3 m above the ground falls below 0°C. Ground frosts are recorded when the air temperature 2.5 cm above a clipped grass surface falls to -1.0°C or lower. Both types of frosts are common in the inland parts of the Waikato, but less common in coastal areas of the Coromandel Peninsula (see ‘Coromandel’ entry in Table 13). Table 13 lists for selected sites the mean daily grass minimum and extreme grass minimum temperatures and the average number of days each month with ground and air frosts. Data on air temperatures (mean daily, monthly minima, and extreme minima) can be obtained from Figure 17.
Location Jan Feb Mar Apr May Jun Jul Aug Sep Oct Nov Dec AnnCoromandel a 12.8 13.5 11.8 9.3 7.5 5.6 4.4 4.9 6.6 8.3 9.9 11.6 8.8
b 3.0 1.4 0.0 -2.0 -4.4 -6.2 -5.9 -4.2 -4.0 -1.4 -1.4 2.2c 0.0 0.0 0.0 0.2 0.6 3.0 4.6 2.5 1.1 0.3 0.0 0.0 12.4d 0.0 0.0 0.0 0.0 0.0 1.1 1.9 0.6 0.2 0.0 0.0 0.0 3.8
Hamilton, Ruakura a 8.9 9.3 7.7 5.3 2.9 1.1 -0.1 1.0 2.5 4.5 6.3 8.0 4.8b -2.9 -1.8 -5.2 -8.3 -8.7 -10.0 -9.4 -8.7 -7.6 -6.7 -5.4 -3.4
c 0.1 0.1 1.0 3.1 7.7 11.4 15.0 11.8 7.9 3.4 1.0 0.4 62.9d 0.0 0.0 0.0 0.2 2.2 5.8 7.2 4.1 1.3 0.1 0.0 0.0 21.0
Taupo NZED a 8.4 8.7 7.3 4.4 2.4 0.7 -0.4 0.2 1.7 3.4 5.3 7.4 4.1b -5.6 -5.7 -5.2 -5.6 -9.6 -9.1 -9.6 -10.2 -9.1 -8.2 -6.8 -6.4
c 0.4 0.3 1.0 2.9 7.0 11.5 15.3 13.1 8.6 5.7 2.1 0.8 68.8d 0.0 0.0 0.1 0.5 3.2 8.2 10.6 7.2 3.7 1.2 0.4 0.0 35.2
Mt Ruapehu Chateau 2 a 5.5 5.5 3.6 1.8 -0.7 -2.3 -2.3 -2.5 -1.1 0.9 2.0 4.0 1.2b -3.7 -5.2 -6.1 -10.1 -9.1 -12.2 -11.6 -12.5 -10.5 -9.9 -8.2 -5.9
c 1.9 1.0 4.6 11.2 13.3 13.7 18.2 19.2 15.7 8.1 7.3 3.4 117.5d 0.5 0.2 1.8 4.7 8.0 15.7 14.6 18.0 11.0 7.0 3.6 1.5 86.5
a: mean daily grass minimum (°C)b: lowest grass minimum recorded (°C)c: average number of ground frosts per monthd: average number of air frosts per month
Phot
o: ©
myc
hilly
bin.
co.n
z/M
ark
Ewin
gton

27
Sunshine and Solar Radiation
Sunshine
In the Waikato region, an east-west gradient of bright sunshine hours is observed (Figure 20). The Coromandel Ranges and the ranges to the south receive the most bright sunshine hours per year (>2100 hours). Sunshine hours are also high for the area east of Taupo (~2025 hours). This declines to around 1950 hours near Hamilton and Tokoroa, and the lowest bright sunshine hours received in the Waikato region is the hill country around Te Kuiti (~1800 hours). Figure 21 shows the monthly mean, maximum, and minimum recorded bright sunshine hours for selected sites in Waikato.
Figure 21. Mean, highest, and lowest recorded monthly bright sunshine hours for selected sites in Waikato.
Highest Recorded
Mean
Lowest Recorded
Thames 2
010
020
030
0
Hamilton Ruakura
010
020
030
0
Taupo NZED
Brig
ht S
unsh
ine
(hou
rs)
Brig
ht S
unsh
ine
(hou
rs)
Brig
ht S
unsh
ine
(hou
rs)
Brig
ht S
unsh
ine
(hou
rs)
010
020
030
0
Turangi
010
020
030
0
J F M A M J J A S O N D J F M A M J J A S O N D
J F M A M J J A S O N D J F M A M J J A S O N D
Figure 20. Median annual sunshine hours for Waikato, 1981-2010.

28
Table 14. Mean daily global solar radiation (MJ/m2/day) for Waikato sites.
Table 15. Mean daily maximum UV Index at Leigh and Lauder.
Solar radiation
Solar radiation records are available for a number of sites in Waikato, but only a few sites have a long record (>10 years). Solar radiation is presented for Whitianga, Paeroa, and Whatawhata for 1981-2010. Insolation is at a maximum in December and January and a minimum in June. Table 14 shows mean daily solar radiation (global) for each month for these three sites.
Location Jan Feb Mar Apr May Jun Jul Aug Sep Oct Nov Dec AnnWhitianga Aero AWS 21 18 15 11 8 6 7 9 13 17 20 21 14Paeroa AWS 22 19 15 11 8 6 7 9 13 16 19 21 14Whatawhata 19 16 14 10 7 5 6 8 10 14 16 18 12
Location Jan Feb Mar Apr May Jun Jul Aug Sep Oct Nov Dec AnnLeigh 12.2 10.7 8.4 5.1 2.8 1.8 1.9 3.0 4.8 7.2 9.8 11.5 6.6Lauder 10.4 8.9 6.0 2.9 1.3 0.8 0.9 1.7 3.3 5.2 7.9 10.0 4.9
UV (Ultra-violet radiation)
Ultra-violet radiation (UV) measurements are not available for any stations in the Waikato region. Table 15 and Figure 22 show the mean monthly UV Index at Leigh, the closest site to the Waikato region, compared with Lauder, a site in the lower South Island. Leigh records higher UV levels than Lauder throughout the year due to Leigh’s northern location, although at both sites, summer months record significantly higher UV levels than winter months. Figure 23 shows an example of a UV forecast for Hamilton, and indicates the levels of UV and times of the day where sun protection is required.
Figure 22. Mean monthly maximum UV Index at Leigh and Lauder.
0
2
4
6
8
10
12
14
Jan Feb Mar Apr May Jun Jul Aug Sep Oct Nov Dec
UV
Inde
x
Month
Leigh Lauder

29
Figure 23. UV Index forecast for Hamilton, January and July. Source: https://www.niwa.co.nz/our-services/online-services/uv-and-ozone
Table 16. Average number of days each year with thunder, fog, and hail, from all available data.
FogThe most common type of fog in the Waikato region is radiation fog, formed when the air cools to its dew-point on clear nights, allowing the water vapour in the air to condense. Another type of fog sometimes seen in the region is ‘steaming fog’. This forms, normally on cold nights, when the water vapour evaporating off lakes and rivers condenses as it rises into the cool air, giving the impression of steam rising off the water surface. Fogs also sometimes form when the humidity of the air near the ground has been raised by falling rain.
Location Thunder Fog HailCoromandel 6 0.4 2Hamilton, Ruakura 10 38 2Te Aroha 5 19 2Te Kuiti High School 8 28 1Taupo NZED 4 50 1Mt Ruapehu, Chateau 1 1 10 1
The frequency of fog varies widely over the Waikato region, ranging from an average of 50 days with fog per year at Taupo to an average of once every five months in Coromandel. Although fog can occur at any time of the year it is recorded most frequently between March and August. The average number of days per year with fog for selected stations in the Waikato region is listed in Table 16.
Phot
o: ©
myc
hilly
bin.
co.n
z/M
yles
And
rew
s

30
Table 17. Generated wave heights associated with specific wind speeds. Assumes a fetch length of 500 km with unlimited wind duration.
Sea swell and wavesMuch of the swell that affects the west coast of New Zealand originates in the ocean to the south of Australia. On the west coast of the Waikato region, the most frequent swell direction is from the southwest, occurring nearly 40% of the time (Gorman et al., 2003). The frequency of swells less than one metre is about 20%, while swell over two metres occur approximately 35% of the time. Heavy southwest swells are particularly noticeable in winter and spring.
On the east coast of Waikato (Coromandel Peninsula), swells from a northeasterly direction tend to predominate. These can originate from tropical cyclones well to the north of New Zealand or from anticyclones far to the east. Of all swells observed on the eastern coast the frequency of those less than one metre is 50%, while for those greater than two metres is 5% (Gorman et al., 2003).
There is a known relationship between steady wind speed and wave heights over the open sea. The most probable wave heights for a given wind speed over a typical fetch length in New Zealand coastal waters of about 500 km are given in Table 17.
Wind speed (km/hr) Associated wave height (m)10 0.520 130 240 350 475 7
100 11125 13+
Severe convective storms
Thunderstorms
In Waikato thunderstorms occur throughout the year, and have a maximum frequency in the winter months when cold, unstable air masses cross the region. Average annual frequencies for selected stations are given in Table 16, and range from 10 in Hamilton to only one per year at Mt Ruapehu Chateau. At some of the stations, it is likely that not all the thunderstorms are detected. The heavy rain, lightning, hail, wind squalls, and rare tornadoes which can occur with thunderstorms will sometimes cause severe local flooding, disruption of electrical and electronic equipment, and damage to trees, crops, and buildings.
Hail
There is no significant difference in days with hail throughout the region, the number of which are low (1-2 days per year). As with thunderstorms, an unknown number of hail falls will escape detection at some of the stations. Hail is most likely over the six months from June to November. Table 16 gives the average number of days per year on which hail is reported at selected stations.
Tornadoes
Tornadoes are rapidly rotating columns of air extending from the base of a cumulonimbus cloud, and have in New Zealand a damage path typically 10-20 m wide and 1-5 km long. The small size (compared to tornadoes in the USA), their short lifetimes, and the sparse population of much of New Zealand must result in an unknown number of tornadoes not being reported. During the period 1981-2012, 8 damage-causing tornadoes were reported in the Waikato region. One particularly severe tornado event was on 17 October 2008, when a tornado swept through Cambridge in the early morning. The tornado brought down trees and power lines, including an 80 year old oak tree. More than 100 houses had lost or damaged roofs, with major damage to 15-20 houses. Many cars were also damaged. The tornado caused a water main to burst, which flooded several rooms in the Oakdale Rest Home. In addition, 3500 customers lost power for a number of hours. Following the tornado, about $10 million worth of insurance claims were made.

31


DERIVED CLIMATOLOGICAL PARAMETERSApart from elements such as temperature and rainfall which can be measured directly, it has been found that parameters computed from several elements, have some important uses especially in industry. Parameters which define the overall suitability of the climate for agriculture, horticulture, architectural and structural designs, and contracting, etc., are vapour pressure, relative humidity, evapotranspiration (leading to soil water balance), degree-days (thermal time), and rainfall extremes. Some of these and their uses are discussed in the following paragraphs. Short-term high intensity rainfalls have been covered previously.
Vapour pressure and relative humidityVapour pressure and relative humidity are the two parameters most frequently used to indicate moisture levels in the atmosphere. Both are calculated from simultaneous dry and wet bulb thermometer readings, although a hygrograph may be used to obtain continuous humidity readings.
Location Jan Feb Mar Apr May Jun Jul Aug Sep Oct Nov Dec AnnCoromandel 17.2 17.8 16.6 14.8 13.1 11.6 10.8 11.1 12.0 12.8 13.8 15.8 13.9Paeroa AWS 16.9 17.3 15.8 14.6 12.7 10.9 10.2 10.7 11.9 12.6 13.5 15.6 13.6Hamilton AWS 16.6 16.9 15.2 13.9 12.0 10.2 9.6 10.3 11.6 12.4 13.2 15.5 13.1Te Kuiti High School 16.4 16.3 15.3 13.3 11.6 10.3 9.3 9.9 11.1 12.3 13.4 15.4 12.9Taupo Aero 14.1 14.4 13.3 11.8 10.3 8.9 8.2 8.6 9.5 10.3 11.2 13.1 11.1Mt Ruapehu Chateau 2 11.3 11.5 10.6 9.2 7.9 7.0 6.5 6.7 7.3 8.2 8.8 10.1 8.8
Location Jan Feb Mar Apr May Jun Jul Aug Sep Oct Nov Dec AnnCoromandel 80 84 83 84 87 89 89 86 82 80 78 78 83Paeroa AWS 81 84 86 88 91 91 91 89 84 83 79 80 86Hamilton AWS 81 82 83 83 85 88 87 87 84 85 81 81 84Te Kuiti High School 78 81 84 86 88 90 89 87 82 81 78 78 83Taupo Aero 77 80 80 82 86 87 87 84 81 79 76 78 82Mt Ruapehu Chateau 2 81 83 83 85 89 92 90 87 82 80 79 80 84
33
Table 18. Mean monthly/annual 9 am vapour pressure (hPa) for selected Waikato sites.
Table 19. Mean monthly/annual 9 am relative humidity (%) for selected Waikato sites.
Figure 24. Waikato median annual days of soil moisture deficit, 1981-2010.

Evapotranspiration and soil water balanceEvapotranspiration is the process where water held in the soil is gradually released to the atmosphere through a combination of direct evaporation and transpiration from plants. A water balance can be calculated by using daily rainfalls and by assuming that the soil can hold a fixed amount of water with
actual evapotranspiration continuing at the maximum rate until total moisture depletion of the soil occurs. The calculation of water balance begins after a long dry spell when it is known that all available soil moisture is depleted or after a period of very heavy rainfall when the soil is completely saturated. Daily calculations are then made of moisture lost through evapotranspiration or replaced through precipitation. If the available soil water becomes insufficient to maintain evapotranspiration then a soil moisture deficit occurs and irrigation becomes necessary to maintain plant growth. Runoff occurs when the rainfall exceeds the soil moisture capacity (assumed to be 150 mm for most New Zealand soils). The Waikato region is comparatively well served by frequent rainfalls in winter, but due to high evapotranspiration and a minimum of rainfall, soil moisture levels in summer are frequently such that irrigation or watering is necessary.
Mean monthly and annual water balance values are given in Table 20, for a number of sites in Waikato. It can be seen from this table that eastern parts of Waikato have about 34 days between November
Vapour pressure is the part of total air pressure that results from the presence of water vapour in the atmosphere. It varies greatly with air masses from different sources, being greatest in warm air masses that have tropical origins and lowest in cold, polar-derived air masses. Vapour pressure can be important in determining the physiological response of organisms to the environment (very dry air, especially if there is a pre-existing soil moisture deficit, can cause or increase wilting in plants). Average 9 am vapour pressures for several stations are given in Table 18.
Relative humidity is high in all seasons, but there is a peak in winter, as shown in Table 19. In general, there is no discernible difference in relative humidity between sites.
34
Location Jan Feb Mar Apr May Jun Jul Aug Sep Oct Nov Dec AnnCoromandel DE 48 33 10 2 0 0 0 0 0 0 4 33 129
ND 11 8 3 1 0 0 0 0 0 0 1 7 31RO 29 32 53 91 76 172 199 165 123 57 47 54 1098NR 1 1 2 4 7 12 12 12 8 4 2 2 66
Paeroa AWS DE 80 55 29 5 1 0 0 0 0 0 11 40 221ND 17 13 9 3 1 0 0 0 0 0 3 9 57RO 9 12 2 22 27 115 154 79 40 21 9 12 503NR 0 0 0 1 3 11 12 11 5 3 1 1 48
Hamilton AWS DE 51 50 26 7 1 0 0 0 0 0 8 24 167ND 12 13 8 4 1 0 0 0 0 0 2 6 46RO 2 12 1 16 44 109 120 98 49 39 8 8 508NR 0 1 0 1 5 12 13 13 6 4 1 1 58
Te Kuiti High School DE 20 27 13 2 0 0 0 0 0 0 0 3 65ND 5 8 5 1 0 0 0 0 0 0 0 1 20RO 20 8 9 35 96 135 141 121 82 66 35 38 788NR 1 1 1 3 9 14 13 13 9 6 3 3 76
DE is the average amount of soil moisture deficit in mmND is the average number of days per month on which a soil moisture deficit occursRO is the average amount of runoff in mmNR is the average number of days per month on which runoff occurs
Table 20. Mean monthly/annual water balance summary for a soil moisture capacity of 150 mm.

and April when there is insufficient soil moisture to maintain plant growth without irrigation, but only 13 days in western areas (Te Kuiti). There is adequate moisture available to maintain plant growth between May and October. Figure 24 shows region-wide variability in days of soil moisture deficit per year.
The Waikato region experienced a major drought between November 2007 and March 2008. Severe soil moisture deficits (more than 130 mm of deficit) were present in the region. Numerous locations in the region experienced record or near-record low rainfall during January, including the lowest recorded January rainfall at Ruakura since records began in 1906 (4 mm, 4% of normal January rainfall). The combination of hot and dry conditions meant that dairy farmers continued drying off dairy stock, and sheep farmers had to sell stock early. The stock feed situation remained very low in drought-stricken areas, and the price of feed significantly increased. Water restrictions were also in place for both urban and rural areas. Rainfall in April 2008 ended the severe and significant soil moisture deficits in the region. This drought dramatically affected production from pastoral agriculture in the western North Island, with economic costs of at least $1 billion, and the Ministry of Agriculture and Forestry reporting an 11% fall in sheep numbers due to the drought. Figure 25 shows the soil moisture deficits reached at Ruakura and Te Kuiti over the drought
period, compared to normal soil moisture deficit conditions for the same time of year at Ruakura (soil moisture deficit from October to May averaged from 1981-2010).
Potential evapotranspiration (PET) has been calculated for Thames, Hamilton, Te Kuiti, and Taupo, using the Penman method (Penman, 1948). The monthly mean, minimum, and maximum PET values are listed in Table 21. These values were calculated from all available data.
35
Figure 25. Soil moisture deficit at Ruakura and Te Kuiti during the November 2007 to March 2008 drought, compared with normal soil moisture deficit conditions for the same time of year at Ruakura (1981-2010).
0
20
40
60
80
100
120
140
160
)m
m( ticifed erutsiom lioS
Date
Ruakura Te Kuiti Ruakura normal
Table 21. Penman calculated maximum, mean, and minimum monthly potential evapotranspiration (mm), as well as total mean annual PET.
Location Jan Feb Mar Apr May Jun Jul Aug Sep Oct Nov Dec AnnThames 2 Max 170 130 111 68 43 30 34 48 73 113 138 164
Mean 145 117 97 60 36 23 28 41 61 93 117 138 954Min 118 106 83 45 24 15 19 23 37 60 94 107
Hamilton, Ruakura Max 147 119 96 54 34 20 26 39 59 86 118 138Mean 127 102 82 47 25 16 19 33 52 79 103 122 807Min 109 85 70 38 21 11 14 27 43 65 90 103
Te Kuiti High School Max 139 106 87 48 25 15 20 36 54 83 102 127Mean 119 98 77 43 23 12 16 29 48 73 93 110 740Min 104 85 67 35 18 9 14 25 41 64 84 96
Taupo NZED Max 173 120 98 55 35 21 25 36 63 93 126 147Mean 135 106 82 47 26 16 19 31 52 82 107 126 829Min 107 94 69 38 21 11 14 26 42 62 83 103

36
Table 22. Average growing degree-day totals above base 5°C and 10°C for selected Waikato sites, from all available data.
Degree-day totalsThe departure of mean daily temperature above a base temperature which has been found to be critical to the growth or development of a particular plant is a measure of the plant’s development on that day. The sum of these departures then relates to the maturity or harvestable state of the crop. Thus, as the plant grows, updated estimates of harvest time can be made. These estimates have been found to be very valuable for a variety of crops with different base temperatures. Degree-day totals indicate the overall effects of temperature for a specified period, and can be applied to agricultural and horticultural production. Growing degree-days express the sum of daily temperatures above a selected base temperature that represent a threshold of plant growth. Table 22 lists the monthly totals of growing degree-day totals above base temperatures of 5°C and 10°C for sites in the Waikato region.
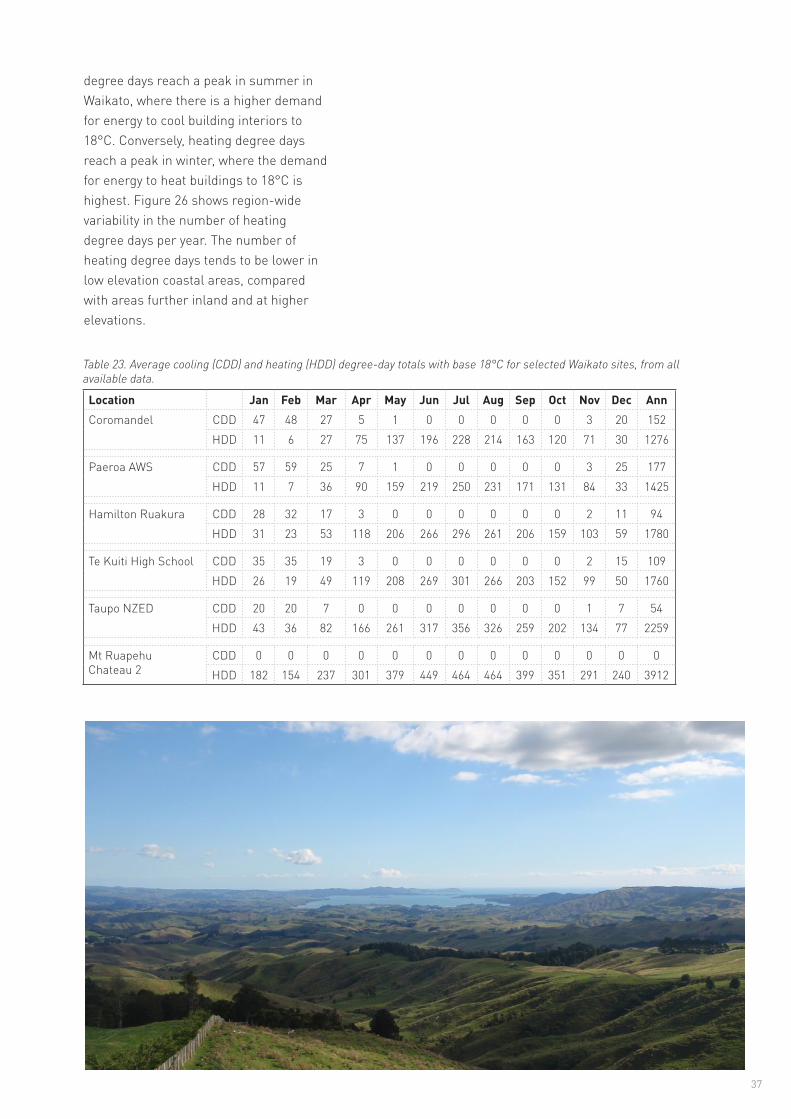
Cooling and heating degree days are measurements that reflect the amount of energy that is required to cool or heat buildings to a comfortable base temperature, which in this case is 18°C. Table 23 shows that the number of cooling
Location Jan Feb Mar Apr May Jun Jul Aug Sep Oct Nov Dec AnnCoromandel 5°C 439 410 403 320 267 194 175 189 227 284 323 393 3624
10°C 284 268 248 171 114 60 43 46 81 129 173 238 1856
Paeroa AWS 5°C 448 419 391 307 245 172 153 172 219 272 310 395 350210°C 293 278 236 159 98 51 37 39 75 119 160 240 1784
Hamilton Ruakura 5°C 400 377 367 275 198 126 110 142 184 245 288 355 306810°C 245 235 213 127 60 25 16 23 48 93 139 200 1424
Te Kuiti High School 5°C 412 383 373 274 195 123 104 137 187 251 293 368 310110°C 257 242 218 126 57 22 13 20 48 98 144 213 1458
Taupo NZED 5°C 380 350 329 225 142 79 57 81 131 201 257 332 256410°C 225 209 174 81 26 8 2 5 18 58 109 178 1094
Mt Ruapehu Chateau 2
5°C 221 213 167 94 43 9 7 5 25 59 100 164 110710°C 75 78 40 9 2 0 0 0 1 2 10 38 255
Figure 26. Median annual heating degree days for Waikato, 1981-2010
37
Table 23. Average cooling (CDD) and heating (HDD) degree-day totals with base 18°C for selected Waikato sites, from all available data.
Location Jan Feb Mar Apr May Jun Jul Aug Sep Oct Nov Dec AnnCoromandel CDD 47 48 27 5 1 0 0 0 0 0 3 20 152
HDD 11 6 27 75 137 196 228 214 163 120 71 30 1276
Paeroa AWS CDD 57 59 25 7 1 0 0 0 0 0 3 25 177HDD 11 7 36 90 159 219 250 231 171 131 84 33 1425
Hamilton Ruakura CDD 28 32 17 3 0 0 0 0 0 0 2 11 94HDD 31 23 53 118 206 266 296 261 206 159 103 59 1780
Te Kuiti High School CDD 35 35 19 3 0 0 0 0 0 0 2 15 109HDD 26 19 49 119 208 269 301 266 203 152 99 50 1760
Taupo NZED CDD 20 20 7 0 0 0 0 0 0 0 1 7 54HDD 43 36 82 166 261 317 356 326 259 202 134 77 2259
Mt Ruapehu Chateau 2
CDD 0 0 0 0 0 0 0 0 0 0 0 0 0HDD 182 154 237 301 379 449 464 464 399 351 291 240 3912
degree days reach a peak in summer in Waikato, where there is a higher demand for energy to cool building interiors to 18°C. Conversely, heating degree days reach a peak in winter, where the demand for energy to heat buildings to 18°C is highest. Figure 26 shows region-wide variability in the number of heating degree days per year. The number of heating degree days tends to be lower in low elevation coastal areas, compared with areas further inland and at higher elevations.
38
ACKNOWLEDGEMENTSThe following people from NIWA are acknowledged for their assistance in preparing this publication: Dr Andrew Tait, James Sturman, Dr Elizabeth Somervell, Dr Michael Uddstrom, Dr Richard Gorman, Georgina Griffiths, Hisako Shiona, and Erika Mackay.
Photo credits:Page 7, 8, 12, 16, 21, 23, 31, 32, 37, Petra Chappell, NIWAPage 20, Phillip Capper, http://creativecommons.org/licenses/by/2.0/deed.enPage 6, 22, 28, Erika Mackay, NIWA
REFERENCESNIWA databases used:
The National Climate Database www.cliflo.niwa.co.nz
HIRDS (High Intensity Rainfall Design System) www.hirds.niwa.co.nz
New Zealand Historic Weather Events Catalogue www.hwe.niwa.co.nz
NIWA Sea Surface Temperature Database
References:
DIAMOND, H. J., LORREY, A. M., KNAPP, K. R. & LEVINSON, D. 2012. Development of an enhanced tropical cyclone track database for the southwest Pacific from 1840-2010. International Journal of Climatology, 32, 2240-2250.
GORMAN, R. M., BRYAN, K. R. & LAING, A. K. 2003. Wave hindcast for the New Zealand region: Nearshore validation and coastal wave climate. New Zealand Journal of Marine and Freshwater Research, 37, 567-588.
PENMAN, H. L. 1948. Natural evaporation from open water, bare soil, and grass. Proceedings of the Royal Society of London A, 193, 120-145.
UDDSTROM, M. J. & OIEN, N. A. 1999. On the use of high resolution satellite data to describe the spatial and temporal variability of sea surface temperatures in the New Zealand Region. Journal of Geophysical Research (Oceans), 104, 20729-20751.

