the city of new york mayor’s office of operations office
TRANSCRIPT

The City of New York Mayor’s Office of Operations
Office of Environmental Coordination
Local Law 86 of 2005Fiscal Year 2010 Annual Report

Cover: PS/IS 276 – Battery Park City School, ManhattanDattnerArchitects

1
Table of Contents
02 Introduction Background Summary of Local Law 86 of 2005 Provisions Synopsis of Report
04 Projects Subject to LL86 of 2005
Summary of LL86 Projects
Projects Subject to LEED® Rating Level Provisions Only
Projects Subject to both LEED® Rating Level and Energy Cost Reduction Provisions
Projects Subject to System Specific Energy Cost Reduction Provisions
Projects Subject to Potable Water Use Reduction Provisions Only Completed Projects
Exempted Projects
22 Benefits and Costs of LL86 of 2005
Projected Benefits and Costs of LEED® Rating Level, Energy Cost Reduction, and Portable Water Use Reduction Provisions
34 Conclusions

Local Law 86 of 2005 Fiscal Year 2010 Annual Report
Introduction
Background
Mayor Michael R. Bloomberg signed Intro 324 into law on October 3, 2005, enacting the City’s green building law. Known as Local Law 86 of 2005 (LL86) and devel-oped in conjunction with the New York City Council, it was implemented starting in 2006 for several projects at the Department of Design and Construction and gener-ally took effect on January 1, 2007 for both public and private entities that receive city funds. By requiring the design of more efficient buildings, the law supports the goals of PlaNYC to reduce the annual rate of greenhouse gas emissions 30% by 2017 for municipal operations and 30% by 2030 for the city as a whole as well as goals to reduce energy cost, potable water use, and the amount of stormwater that enters the City’s water treatment sys-tems. LL86 will also produce other significant benefits such as improving indoor and outdoor air quality and increasing the amount of waste material recycled in the process of constructing and operating buildings. On November 20, 2006 the Mayor issued Executive Order
97, which authorized the Director of the Mayor’s Office of Environmental Coordination (MOEC) to exercise the powers and duties of the Mayor in conjunction with the implementation of LL86.
Pursuant to the City Administrative Procedures Act (CAPA), rules to implement LL86 were published in draft form for public comment on December 1, 2006 and, following a public comment period and hearing, became effective on April 2, 2007. On June 21, 2009 an amendment to the rules took effect, also following a public comment period and hearing. This amendment redefined the selected green building rating system as the Version 3 Leadership in Energy and Environmental Design (LEED®) 2009 suite of systems, the most recent version published by the U.S. Green Building Council (USGBC). The rules are found at Title 43 of the Rules of the City of New York, Chapter 10.
In 2007 the New York City School Construction Au-thority (SCA) and the Department of Education (DOE) requested that MOEC consider the New York City 2007 Green Schools Rating System (GSRS 2007) as an alter-native to LEED® for New Construction Version 2.2, the most applicable of the USGBC LEED® rating systems allowed by the law at the time. Based on an indepen-dent third party analysis by Davis Langdon Associates and as allowed by the law, the Director of the Mayor’s Office of Environmental Coordination elected to utilize this alternative system for city schools, finding it to be at least as stringent as LEED® for New Construction Ver-sion 2.2. The texts of LL86, Executive Order 97, the final Rules, the subsequent amendment, as well as the NYC 2007 Green Schools Rating System and Guide may all be viewed on the MOEC website at www.nyc.gov/oec.
PS/IS 276 – Battery Park City School, ManhattanDattnerArchitects

3
Summary of Local Law 86 of 2005 ProvisionsLocal Law 86 applies to capital building projects where construction is managed by a city agency or where a city agency holds an agreement with a non-city entity for a project to receive city funds over a threshold amount. Most building types encountered in such projects are covered by the law, with the exception of those with residential, high hazard, outdoor assembly, and indus-trial uses as primary occupancies.
For covered projects, the law’s requirements fall into four basic categories. First, they require projects that will spend at least $2 million for construction must achieve a LEED® rating level in accordance with the LEED® green building standards developed by the USGBC. A minimum Certified level is required for health and edu-cational facilities and a minimum Silver level is required for all other covered occupancy types. In many cases these projects must apply to the USGBC for indepen-dent third-party certification of the required rating level. The second group of provisions requires that projects with a LEED® rating level requirement and construction costs of $12 million or more must also reduce energy cost by a minimum of 20%-30%. The third category requires that larger boiler and lighting system upgrades achieve at least 10% energy cost reductions and that large HVAC comfort control upgrades achieve mini-mum 5% energy cost reductions. The fourth category requires that projects with $500,000 or more of domes-tic plumbing work must reduce potable water use by 30% or more.
Finally, the law requires the preparation of a report each year after the law takes effect, commencing in 2008. This is the third annual report. As with the first and second, this report provides information in accordance with specific LL86 requirements.
Synopsis of ReportLL86 requires the publication of a report after the end of each fiscal year on the capital building projects subject to LL86 that were completed in that fiscal year. In addition to those that were completed by the end of fiscal year 2010, this third annual report, like the first and second, also includes projects subject to the law that are in various stages of design and construction and that received a Certificate to Proceed from the Office of Management and Bud-get (OMB) or CBX Certificate, for land acquisition, prior to the end of FY2010.
For those LL86 projects that have completed design and started construction, this report documents, in accordance with specific LL86 requirements, the pro-jected benefits as well as estimates of the additional costs related to achieving the required LEED® rating level. Also described are the available agency find-ings regarding the payback of investments in specific energy efficiency measures implemented to meet or exceed the law’s minimum energy cost reduction requirements.
The conclusions and totals in this report are based on data supplied to the Mayor’s Office of Environ-mental Coordination by the managing agencies, i.e. those city agencies managing construction or those managing funding agreements for the expenditure of city funds on covered projects. It is important to note that, as projects proceed toward completion, the data indicated here, such as estimated costs, completion dates, and project floor areas are subject to change and will be updated in subsequent reports.

Local Law 86 of 2005 Fiscal Year 2010 Annual Report
Summary of LL86 Projects
A total of 174 projects subject to LL86 have commenced design since the law took effect on January 1, 2007, or, in the case of projects managed by the Department of Design and Construction, since January 1, 2006. These account for total combined project costs of $6,316,777,000. Of this total, $4,798,326,000 cover con-struction costs for work subject to LL86 provisions and about $1,055,900,000 in city funds were allocated, i.e. released from the city treasury, towards project costs in FY 2010.
LEED® Projects. Seventeen projects, each with construction costs from $2,000,000 to $12,000,000, are subject to the LEED® rating level provisions only. The total construction cost of these smaller projects is $109,346,000. An additional 73 LEED® projects, each with a construction cost of $12,000,000 or more, are also subject to the minimum 20–30% energy cost reduction requirements. The construction cost of the 90 projects that are subject to the LEED® provisions amounts to $4,397,841,000 and the total floor area is roughly 7,353,000 square feet (s.f.).
System Specific Projects. There are also 71 projects with aggregate construction costs of $276,119,000 for work subject to the system specific energy cost reduction requirements. Note, in accordance with LL86 provi-sions, those projects subject to the to the boiler, lighting, or HVAC comfort control energy cost reduction requirements are not subject to the LEED® rating level requirements, although they may be subject to the potable water use reduction requirements.
Water Use Reduction Projects. Thirteen projects are subject to the water use reduction requirements only, although most projects subject to the potable water use reduction requirements are subject to other require-ments as well. Sixty-nine of the 90 LEED® projects and one project subject to the system specific energy cost reduction requirements are also subject to the potable water use reduction requirements. “Table 1- Summary of Costs and LEED® Project Floor Area by Agency for Projects Subject to LL86 Provi-sions” (page 5) summarizes the costs of all LL86 projects and floor area of LEED® projects by budgeting agency. Following Table 1 are four sections that detail the projects according to the four groups of LL86 pro-visions. The tables in each section provide the following key attributes for each project by agency: the name and type of project, project cost, construction cost, the year of expected completion and, where applicable, the floor area subject to the LEED® provisions. The first section provides the names and key attributes of those smaller projects that are subject to the LEED® rating level provisions only and the second describes the larger LEED® projects that are also subject to the 20–30% minimum energy cost reduction requirement. The third includes projects subject to the boiler, lighting or HVAC comfort controls provisions, and the fourth describes projects subject to the potable water use reduction provisions only. Following these four sections is a brief discussion of projects that have been completed, as well as those that received full or partial exemptions from any LL86 provision before the end of FY 2010.
Projects Subject to LL86 of 2005

5
Notes for Table 1 and Key to Agency Acronyms: See Page 32
Table 1 - Summary of Costs and LEED® Project Floor Area by Budgeting Agency for Projects Subject to LL86 Provisions
Budgeting Agency1
Managing Agency(s)2
Number of Projects Subject to
LL86 ProvisionsProject Cost ($)4
Construction Cost of Work Subject to LL86 Provisions5
Floor Area Subject to
LEED® Rating Level Requirement
(s.f.)7
FY10 Capital Allocation ($)6
BkBP DDC 1 64,000,000 12,796,601 16,000 2,797,463
CJC DDC 1 40,698,000 1,339,000 0 7,960,000
CME CME 1 28,064,303 20,348,647 26,947 26,235,000
CUNY CUNY 2 110,761,445 109,600,000 120,000 21,017,898
DCAS DCAS,DDC 3 138,069,841 101,504,562 63,000 7,569,928
DCLA EDC, DDC 20 426,372,536 300,861,963 443,320 103,486,709
DEP DDC 1 14,296,000 12,000,000 77,000 103,684
DHS DDC 1 76,579,000 67,839,000 76,823 625,469
DOC DDC 1 92,706,000 81,300,000 558,431 818,738
DOE SCA 119 3,297,915,418 2,404,795,130 3,408,474 670,969,612
DOHMH DDC, DCAS 5 196,138,790 156,933,585 555,300 10,616,434
DOITT DDC 1 700,000,000 525,000,000 550,000 56,849,220
DPR DPR, EDC 7 199,871,220 173,760,220 242,998 94,410,000
EDC EDC 4 126,334,000 78,188,000 201,899 23,148,500
HPD HPD 1 24,489,079 21,109,833 37,000 0
NYPD DDC 2 744,036,798 719,567,886 702,870 28,522,370
NYPL DDC 2 14,011,000 12,299,106 26,500 362,181
QPL DDC 2 22,433,115 17,665,000 29,666 1,919,121
TOTAL 174 6,316,776,545 4,798,326,368 7,353,223 1,055,864,435
Local Law 86 of 2005 Fiscal Year 2010 Annual Report
Projects Subject to LEED® Rating Level Provisions Only
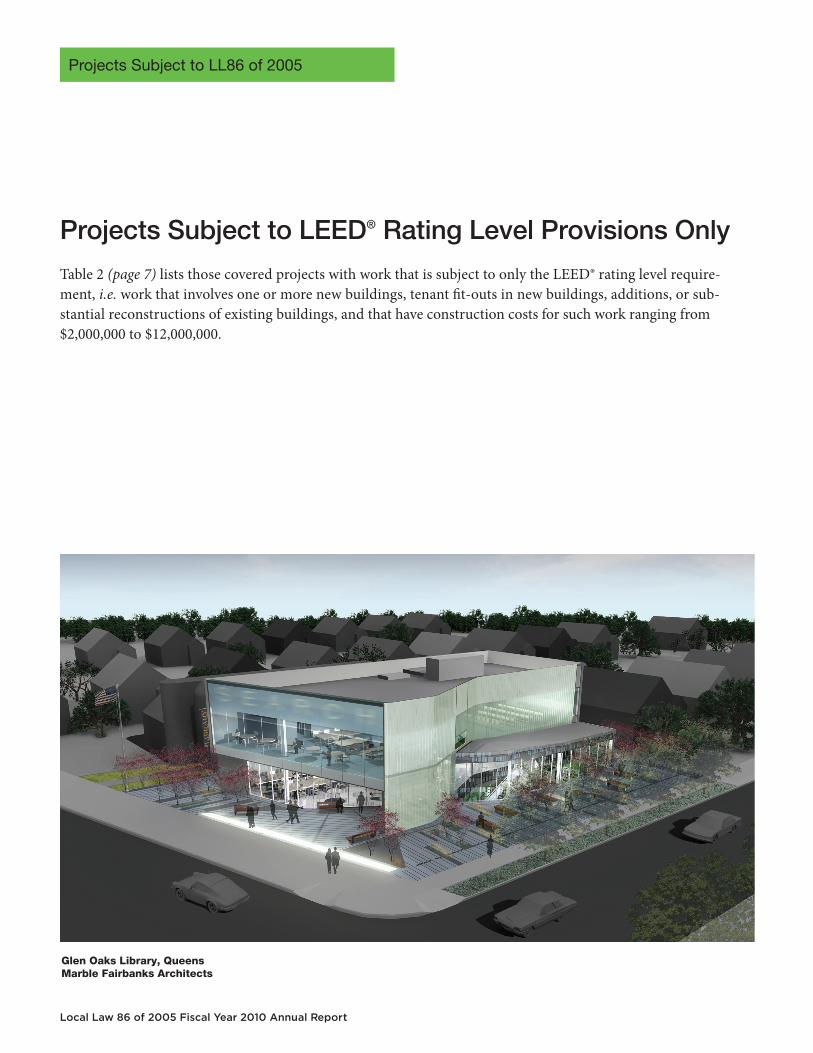
Table 2 (page 7) lists those covered projects with work that is subject to only the LEED® rating level require-ment, i.e. work that involves one or more new buildings, tenant fit-outs in new buildings, additions, or sub-stantial reconstructions of existing buildings, and that have construction costs for such work ranging from $2,000,000 to $12,000,000.
Projects Subject to LL86 of 2005
Glen Oaks Library, QueensMarble Fairbanks Architects
7
Notes for Table 2 and Key to Agency Acronyms: See Page 32
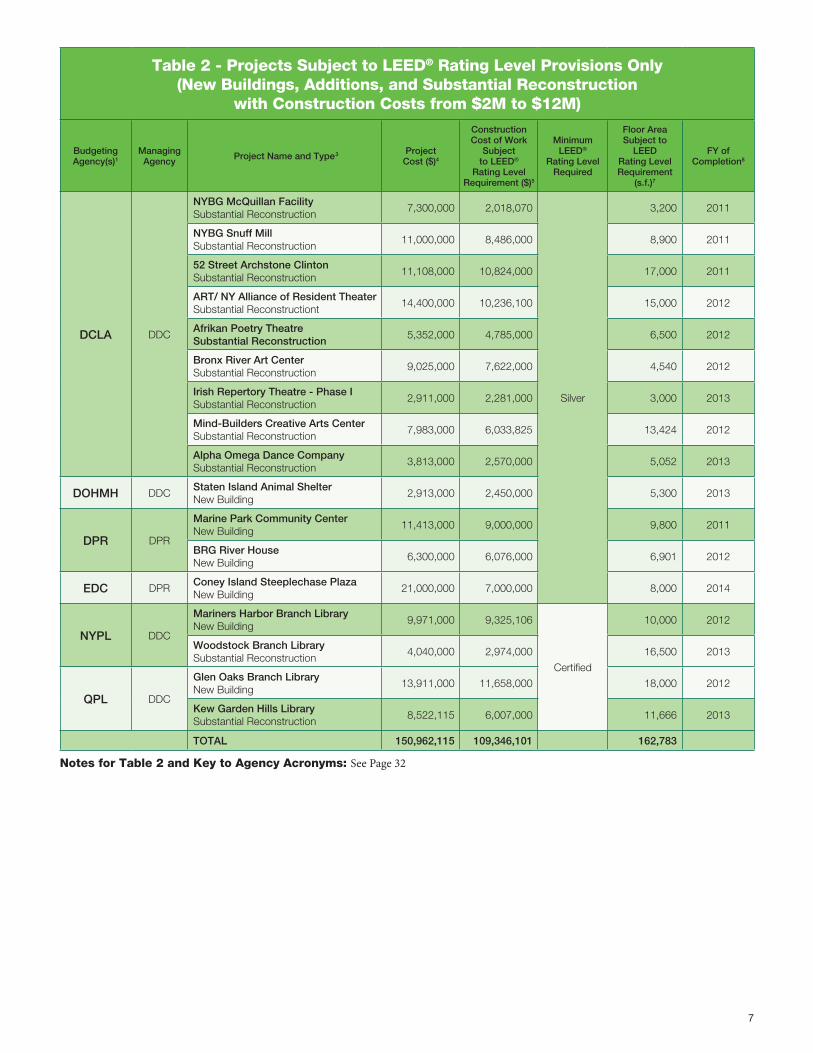
Table 2 - Projects Subject to LEED® Rating Level Provisions Only (New Buildings, Additions, and Substantial Reconstruction
with Construction Costs from $2M to $12M)
Budgeting Agency(s)1
Managing Agency Project Name and Type3 Project
Cost ($)4
Construction Cost of Work
Subject to LEED®
Rating Level Requirement ($)5
Minimum LEED®
Rating Level Required
Floor Area Subject to
LEED
Rating Level Requirement
(s.f.)7
FY of Completion8
DCLA DDC
NYBG McQuillan FacilitySubstantial Reconstruction
7,300,000 2,018,070
Silver
3,200 2011
NYBG Snuff Mill Substantial Reconstruction
11,000,000 8,486,000 8,900 2011
52 Street Archstone ClintonSubstantial Reconstruction
11,108,000 10,824,000 17,000 2011
ART/ NY Alliance of Resident TheaterSubstantial Reconstructiont
14,400,000 10,236,100 15,000 2012
Afrikan Poetry TheatreSubstantial Reconstruction
5,352,000 4,785,000 6,500 2012
Bronx River Art CenterSubstantial Reconstruction
9,025,000 7,622,000 4,540 2012
Irish Repertory Theatre - Phase I Substantial Reconstruction
2,911,000 2,281,000 3,000 2013
Mind-Builders Creative Arts CenterSubstantial Reconstruction
7,983,000 6,033,825 13,424 2012
Alpha Omega Dance CompanySubstantial Reconstruction
3,813,000 2,570,000 5,052 2013
DOHMH DDCStaten Island Animal ShelterNew Building
2,913,000 2,450,000 5,300 2013
DPR DPR
Marine Park Community CenterNew Building
11,413,000 9,000,000 9,800 2011
BRG River HouseNew Building
6,300,000 6,076,000 6,901 2012
EDC DPRConey Island Steeplechase PlazaNew Building
21,000,000 7,000,000 8,000 2014
NYPL DDC
Mariners Harbor Branch LibraryNew Building
9,971,000 9,325,106
Certified
10,000 2012
Woodstock Branch LibrarySubstantial Reconstruction
4,040,000 2,974,000 16,500 2013
QPL DDC
Glen Oaks Branch LibraryNew Building
13,911,000 11,658,000 18,000 2012
Kew Garden Hills LibrarySubstantial Reconstruction
8,522,115 6,007,000 11,666 2013
TOTAL 150,962,115 109,346,101 162,783

Local Law 86 of 2005 Fiscal Year 2010 Annual Report
Projects Subject to both LEED® Rating Level and Energy Cost Reduction Provisions
The projects described in Table 3 (page 9) are subject to the LEED® rating level requirements as well as the minimum 20–30% energy cost reduction requirements, since they involve new buildings, additions, and substantial reconstructions with construction costs of $12 million or more.
Projects Subject to LL86 of 2005
BAM Fisher BuildingH3 Hardy Collaboration, Architecture, LLC

9
Notes for Table 3 and Key to Agency Acronyms: See Page 32
Table 3 - Projects Subject to both LEED® Rating Level and Energy Cost Reduction Provisions (New Buildings, Additions, and
Substantial Reconstruction with Construction Costs of $12M or More)
Budgeting Agency1
Managing Agency2 Project Name and Type3 Project
Cost ($)4
Construction Cost of Work
Subject to LEED®
Rating Level Requirement ($)5
Minimum LEED®
Rating Level Required
Floor Area Subject
to LEED® Rating Level Requirement
(s.f.)7
FY of Completion8
BkBP DDCAsser Levy Park ReconstructionNew Building
64,000,000 12,796,601
Silver
16,000 2015
CME CMEJacobi Medical Center CampusSubstantial Reconstruction
28,064,303 20,348,647 26,947 2014
CUNY CUNYBCC North Instructional BuildingNew Building
102,300,000 102,300,000 Certified 120,000 2011
DCAS DDCCity Hall RenovationSubstantial Reconstruction
106,789,521 95,420,397
Silver
63,000 2012
DCLA
DDC
Brooklyn Museum Climate Control - 4AAddition
21,612,000 21,392,000 15,000 2010
Museum of the City of New York - Phase IISubstantial Reconstruction
25,817,000 25,540,000 54,640 2012
SI Insititute of Arts & SciencesSubstantial Reconstruction
24,915,000 21,762,000 48,302 2013
122 Community CenterSubstantial Reconstruction
21,181,000 15,652,000 44,225 2013
EDC
Downtown Brooklyn Strand TheaterSubstantial Reconstruction
24,000,000 23,000,000 70,000 2012
Theatre for a New AudienceNew Building
34,000,000 30,000,000 22,000 2013
American Museum of Moving ImageAddition
50,738,000 48,000,000 70,562 2012
BAM Richard B. Fisher Building New Building
43,320,840 43,320,840 27,000 2012
Orchestra of St. Luke’s - DiMenna CenterSubstantial Reconstruction
13,580,128 13,580,128 14,975 2011
DEP DDCDEP Shaft MaintenanceSubstantial Reconstruction
14,296,000 12,000,000 77,000 2014
DHS DDCNew Family Intake Center-BronxNew Building
76,579,000 67,839,000 76,823 2011
DOC DDCJATC ReconstructionSubstantial Reconstruction
92,706,000 81,300,000 558,431 2014
DOE SCA
PS 287-QNew Building
51,660,353 38,527,488
Certified
59,770 2013
PS 71-RNew Building
80,684,270 65,190,160 110,306 2013
IS 230-Q AnnexNew Building
28,299,555 23,302,429 36,204 2012
PS/IS 312-QNew Building
74,884,366 65,610,000 98,569 2012
PS/IS 338-KNew Building
82,525,201 69,713,610 103,945 2014

Local Law 86 of 2005 Fiscal Year 2010 Annual Report
Notes for Table 3 and Key to Agency Acronyms: See Page 32
Table 3 (cont’d) - Projects Subject to both LEED® Rating Level and Energy Cost Reduction Provisions (New Buildings, Additions, and
Substantial Reconstruction with Construction Costs of $12M or More)
Budgeting Agency1
Managing Agency2 Project Name and Type3 Project
Cost ($)4
Construction Cost of Work
Subject to LEED®
Rating Level Requirement ($)5
Minimum LEED®
Rating Level Required
Floor Area Subject
to LEED® Rating Level Requirement
(s.f.)7
FY of Completion8
DOE SCA
Clinton MS & HS New Building
138,339,399 85,248,045
Certified
139,719 2013
PS 290-Q New Building
81,503,289 63,297,855 99,023 2014
PS 311-QNew Building
76,971,664 67,428,148 103,687 2014
PS 298-QNew Building
82,507,416 72,293,572 107,595 2014
PS 8-KAddition
29,280,511 22,779,016 17,858 2012
PS/IS 48-QNew Building
72,399,387 62,776,844 94,023 2011
PS 42-Q Addition
59,329,623 32,490,536 53,091 2013
PS 196-QAddition
41,079,865 27,048,736 35,684 2012
Ampark Neighborhood School-XAddition
66,972,197 35,038,016 55,869 2011
PS 133-KNew Building
91,477,187 79,203,904 117,484 2013
PS 160-K AnnexAddition
58,732,532 37,877,320 61,971 2013
PS 264-KNew Building
64,125,395 47,618,624 73,528 2012
IS/HS @ Spring CreekNew Building
100,313,783 87,125,688 154,530 2013
All City Leadership School New Building
40,362,711 35,041,604 53,171 2012
PS 310-KNew Building
41,070,551 32,076,000 52,758 2012
Community Health Academy (CLOTH)New Building
65,544,323 52,298,688 75,183 2012
Maspeth HS 585-QNew Building
113,612,421 84,019,000 149,938 2013
PS/IS 277-QNew Building
77,279,958 56,331,600 94,580 2013
PS 29-QAddition
27,971,300 16,375,770 26,735 2013
Settlement Housing PS/IS/HSNew Building
54,507,156 42,839,524 147,654 2012
PS 331-KNew Building
42,644,469 37,410,129 98,849 2013
IS/HS 404-QNew Building
84,624,967 74,234,070 142,606 2013
11
Notes for Table 3 and Key to Agency Acronyms: See Page 32
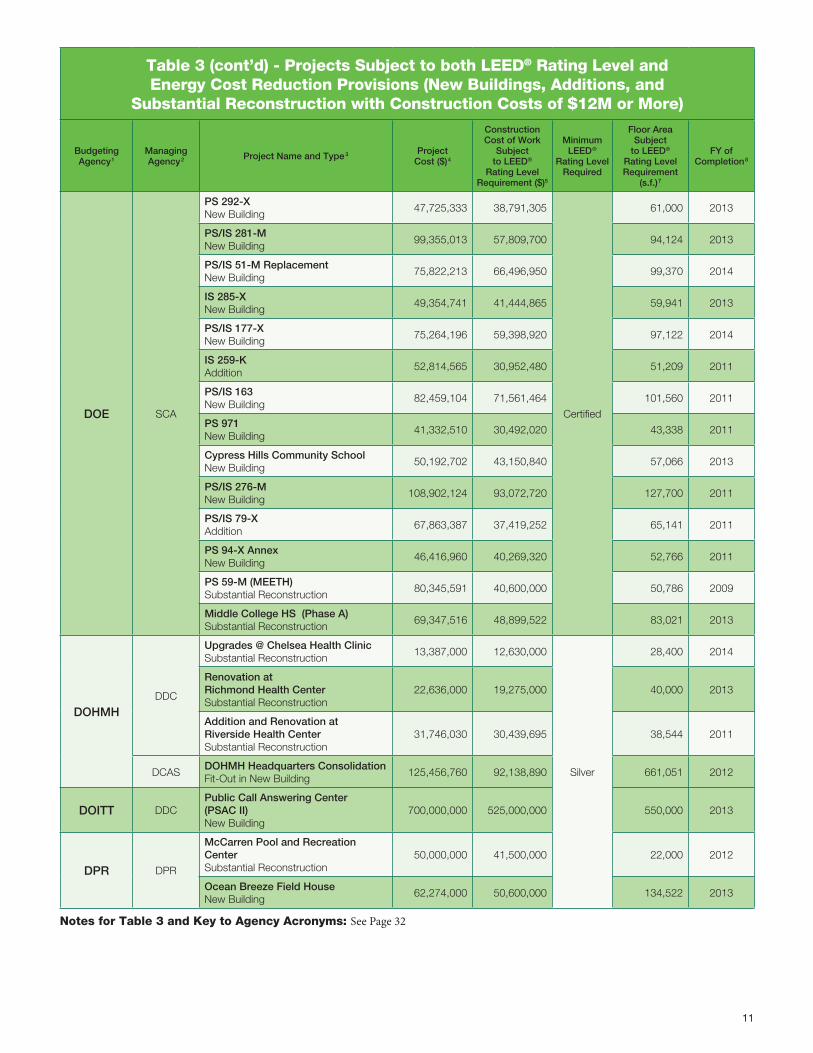
Table 3 (cont’d) - Projects Subject to both LEED® Rating Level and Energy Cost Reduction Provisions (New Buildings, Additions, and
Substantial Reconstruction with Construction Costs of $12M or More)
Budgeting Agency1
Managing Agency2 Project Name and Type3 Project
Cost ($)4
Construction Cost of Work
Subject to LEED®
Rating Level Requirement ($)5
Minimum LEED®
Rating Level Required
Floor Area Subject
to LEED® Rating Level Requirement
(s.f.)7
FY of Completion8
DOE SCA
PS 292-XNew Building
47,725,333 38,791,305
Certified
61,000 2013
PS/IS 281-MNew Building
99,355,013 57,809,700 94,124 2013
PS/IS 51-M ReplacementNew Building
75,822,213 66,496,950 99,370 2014
IS 285-XNew Building
49,354,741 41,444,865 59,941 2013
PS/IS 177-XNew Building
75,264,196 59,398,920 97,122 2014
IS 259-KAddition
52,814,565 30,952,480 51,209 2011
PS/IS 163New Building
82,459,104 71,561,464 101,560 2011
PS 971New Building
41,332,510 30,492,020 43,338 2011
Cypress Hills Community SchoolNew Building
50,192,702 43,150,840 57,066 2013
PS/IS 276-MNew Building
108,902,124 93,072,720 127,700 2011
PS/IS 79-XAddition
67,863,387 37,419,252 65,141 2011
PS 94-X AnnexNew Building
46,416,960 40,269,320 52,766 2011
PS 59-M (MEETH)Substantial Reconstruction
80,345,591 40,600,000 50,786 2009
Middle College HS (Phase A)Substantial Reconstruction
69,347,516 48,899,522 83,021 2013
DOHMHDDC
Upgrades @ Chelsea Health ClinicSubstantial Reconstruction
13,387,000 12,630,000
Silver
28,400 2014
Renovation at Richmond Health CenterSubstantial Reconstruction
22,636,000 19,275,000 40,000 2013
Addition and Renovation at Riverside Health CenterSubstantial Reconstruction
31,746,030 30,439,695 38,544 2011
DCASDOHMH Headquarters ConsolidationFit-Out in New Building
125,456,760 92,138,890 661,051 2012
DOITT DDCPublic Call Answering Center (PSAC II)New Building
700,000,000 525,000,000 550,000 2013
DPR DPR
McCarren Pool and Recreation CenterSubstantial Reconstruction
50,000,000 41,500,000 22,000 2012
Ocean Breeze Field HouseNew Building
62,274,000 50,600,000 134,522 2013

Local Law 86 of 2005 Fiscal Year 2010 Annual Report
Notes for Table 3 and Key to Agency Acronyms: See Page 32
Table 3 (cont’d) - Projects Subject to both LEED® Rating Level and Energy Cost Reduction Provisions (New Buildings, Additions, and
Substantial Reconstruction with Construction Costs of $12M or More)
Budgeting Agency1
Managing Agency2 Project Name and Type3 Project
Cost ($)4
Construction Cost of Work
Subject to LEED®
Rating Level Requirement ($)5
Minimum LEED®
Rating Level Required
Floor Area Subject
to LEED® Rating Level Requirement
(s.f.)7
FY of Completion8
DPR
DPRDistrict HQ and Comfort StationNew Building
24,584,220 24,584,220
Silver
15,527 2011
EDC
Prospect Park Lakeside CenterNew Building
30,000,000 30,000,000 26,000 2012
Building JSubstantial Reconstruction
15,300,000 12,000,000 28,248 2009
EDC EDC
Sephardic Community Youth Center, Inc.New Building
62,946,000 46,800,000 110,000 2011
Federation of Italian - American OrganizationsNew Building
12,388,000 12,388,000 49,899 2013
Pier A RedevelopmentSubstantial Reconstruction
30,000,000 12,000,000 33,000 2012
HPD HPDArverne By The Sea YMCANew Building
24,489,079 21,109,833 37,000 2012
NYPD DDC
121st Precinct in Staten IslandNew Building
60,259,798 57,567,886 52,870 2013
New Police AcademyNew Building
683,777,000 662,000,000 650,000 2013
TOTAL 5,469,042,480 4,397,840,872 7,190,440

13
Bronx Community College North Instructional BuildingRobert A.M. Stern Architect
BRONX COMMUNITY COLLEGE NORTH INSTRUCTIONAL BUILDINGNOVEMBER 13, 2006
BRONX, NEW YORK
ROBERT A.M. STERN ARCHITECTS
ELEVATIONS
NORTH ELEVATION
SOUTH ELEVATION - QUAD SIDE
EAST ELEVATION WEST ELEVATION

Local Law 86 of 2005 Fiscal Year 2010 Annual Report
Projects Subject to System Specific Energy Cost Reduction Provisions
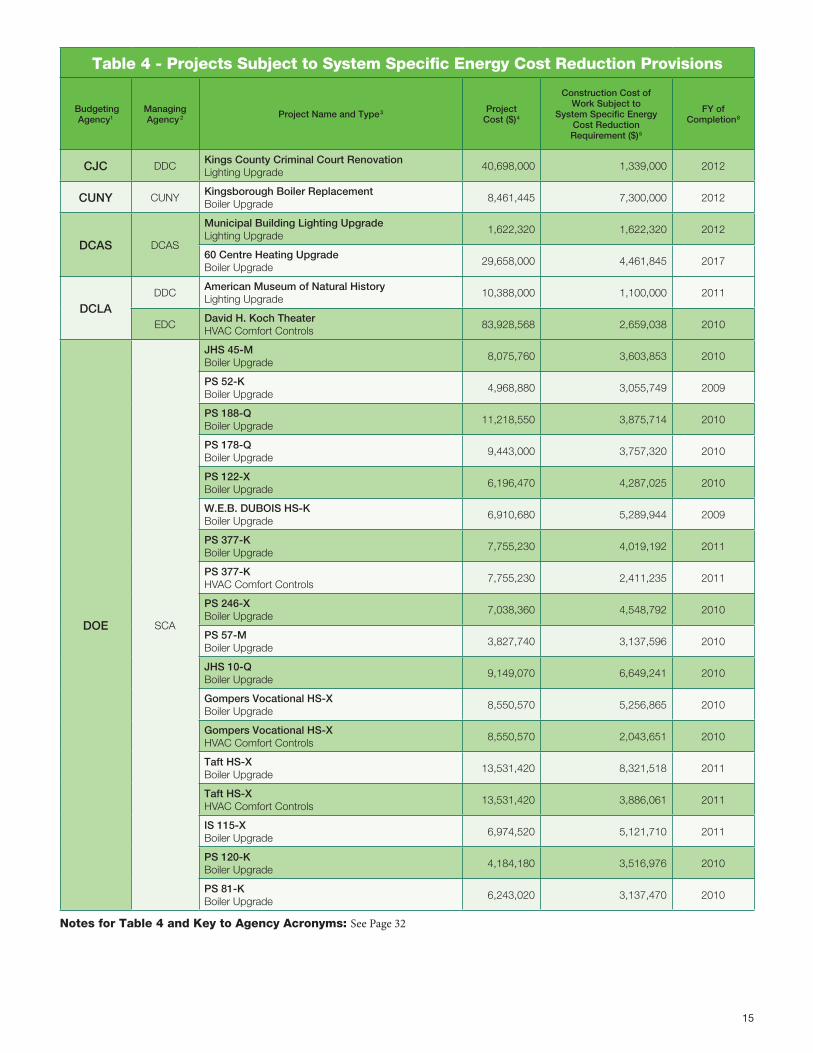
Table 4 (page 15) lists projects that are not subject to the LEED® rating level provisions but that involve the in-stallation or replacement of boilers or HVAC comfort controls with construction costs of $2,000,000 or more or the installation of lighting systems with construction costs of $1,000,000 or more.
Projects Subject to LL86 of 2005
DOHMH Office Consolidation, Long Island CityGerner Kronick + Valcarcel, Architects, PC
15
Table 4 - Projects Subject to System Specific Energy Cost Reduction Provisions
Budgeting Agency1
Managing Agency 2 Project Name and Type3 Project
Cost ($)4
Construction Cost of Work Subject to
System Specific Energy Cost Reduction Requirement ($)5
FY of Completion8
CJC DDCKings County Criminal Court RenovationLighting Upgrade
40,698,000 1,339,000 2012
CUNY CUNYKingsborough Boiler ReplacementBoiler Upgrade
8,461,445 7,300,000 2012
DCAS DCAS
Municipal Building Lighting UpgradeLighting Upgrade
1,622,320 1,622,320 2012
60 Centre Heating UpgradeBoiler Upgrade
29,658,000 4,461,845 2017
DCLADDC
American Museum of Natural History Lighting Upgrade
10,388,000 1,100,000 2011
EDCDavid H. Koch TheaterHVAC Comfort Controls
83,928,568 2,659,038 2010
DOE SCA
JHS 45-MBoiler Upgrade
8,075,760 3,603,853 2010
PS 52-KBoiler Upgrade
4,968,880 3,055,749 2009
PS 188-QBoiler Upgrade
11,218,550 3,875,714 2010
PS 178-QBoiler Upgrade
9,443,000 3,757,320 2010
PS 122-XBoiler Upgrade
6,196,470 4,287,025 2010
W.E.B. DUBOIS HS-KBoiler Upgrade
6,910,680 5,289,944 2009
PS 377-KBoiler Upgrade
7,755,230 4,019,192 2011
PS 377-K HVAC Comfort Controls
7,755,230 2,411,235 2011
PS 246-XBoiler Upgrade
7,038,360 4,548,792 2010
PS 57-MBoiler Upgrade
3,827,740 3,137,596 2010
JHS 10-QBoiler Upgrade
9,149,070 6,649,241 2010
Gompers Vocational HS-X Boiler Upgrade
8,550,570 5,256,865 2010
Gompers Vocational HS-X HVAC Comfort Controls
8,550,570 2,043,651 2010
Taft HS-XBoiler Upgrade
13,531,420 8,321,518 2011
Taft HS-XHVAC Comfort Controls
13,531,420 3,886,061 2011
IS 115-X Boiler Upgrade
6,974,520 5,121,710 2011
PS 120-KBoiler Upgrade
4,184,180 3,516,976 2010
PS 81-KBoiler Upgrade
6,243,020 3,137,470 2010
Notes for Table 4 and Key to Agency Acronyms: See Page 32

Local Law 86 of 2005 Fiscal Year 2010 Annual Report
Table 4 (cont’d) - Projects Subject to System Specific Energy Cost Reduction Provisions
Budgeting Agency1
Managing Agency 2 Project Name and Type3 Project
Cost ($)4
Construction Cost of Work Subject to
System Specific Energy Cost Reduction Requirement ($)5
FY of Completion8
DOE SCA
PS 81-KHVAC Comfort Controls
6,243,020 2,494,767 2010
PS 108-XBoiler Upgrade
5,971,700 4,299,624 2011
PS 56-KBoiler Upgrade
6,969,200 3,898,560 2010
PS 56-KHVAC Comfort Controls
6,969,200 2,388,811 2010
PS 23-RBoiler Upgrade
5,171,040 2,916,467 2011
PS 36-MBoiler Upgrade
6,227,060 3,422,167 2011
PS 36-MHVAC Comfort Controls
6,227,060 2,195,671 2011
PS 76-MBoiler Upgrade
5,963,720 3,467,388 2011
PS 32-XBoiler Upgrade
21,065,870 3,633,340 2013
John Jay HS-KBoiler Upgrade
10,863,440 7,426,219 2012
PS 111-MBoiler Upgrade
5,726,620 4,562,867 2011
PS 121-QBoiler Upgrade
4,346,075 3,257,033 2012
IS 227-QBoiler Upgrade
7,041,339 5,294,664 2011
Jamaica HS-QHVAC Comfort Controls
10,651,500 3,104,993 2012
Jamaica HS-QBoiler Upgrade
10,651,500 6,735,523 2012
PS 194-MBoiler Upgrade
7,672,770 5,105,600 2012
PS 12-XBoiler Upgrade
7,525,548 4,184,474 2011
IS 383-KBoiler Upgrade
6,138,420 3,854,139 2012
PS 50-MBoiler Upgrade
4,173,810 2,498,182 2012
IS 84-XHVAC Comfort Controls
5,256,055 2,676,202 2012
IS 216-XBoiler Upgrade
5,875,420 3,191,486 2012
IS 216-XHVAC Comfort Controls
5,875,420 2,236,591 2012
PS 198-XHVAC Comfort Controls
4,989,110 3,030,516 2012
Fort Hamilton HS-KBoiler Upgrade
10,909,240 9,059,580 2012
Notes for Table 4 and Key to Agency Acronyms: See Page 32

17
Notes for Table 4 and Key to Agency Acronyms: See Page 32
Table 4 (cont’d) - Projects Subject to System Specific Energy Cost Reduction Provisions
Budgeting Agency1
Managing Agency 2 Project Name and Type3 Project
Cost ($)4
Construction Cost of Work Subject to
System Specific Energy Cost Reduction Requirement ($)5
FY of Completion8
DOE SCA
IS 113-XBoiler Upgrade
5,465,140 3,276,647 2012
PS 253-KBoiler Upgrade
5,631,882 4,631,206 2012
IS 137-XBoiler Upgrade
5,374,394 4,310,322 2012
IS 61-KHVAC Comfort Controls
9,556,864 2,661,792 2012
IS 61-KBoiler Upgrade
9,556,864 7,056,665 2012
Murrow HS-KBoiler Upgrade
10,225,184 9,502,985 2010
IS 93-QLighting Upgrade
1,166,405 1,077,705 2011
JHS 157-QBoiler Upgrade
18,776,885 2,992,700 2012
PS 60-RLighting Upgrade
1,107,230 1,023,030 2011
IS 127-XLighting Upgrade
1,236,100 1,142,100 2011
JHS 141-XBoiler Upgrade
5,216,605 3,811,581 2012
PS 111-QBoiler Upgrade
5,011,465 3,634,373 2012
IS 285-KBoiler Upgrade
5,709,730 3,522,999 2012
JHS 168-QBoiler Upgrade
10,128,941 7,726,806 2012
PS 50-RBoiler Upgrade
5,734,626 4,632,516 2011
PS 18-RBoiler Upgrade
5,053,899 4,669,572 2012
IS 59-QLighting Upgrade
1,258,455 1,162,755 2012
PS 26-KHVAC Comfort Controls
6,759,713 2,537,125 2012
PS 26-KBoiler Upgrade
6,759,713 3,708,541 2012
IS 193-XHVAC Comfort Controls
7,187,059 2,955,644 2013
IS 184-XHVAC Comfort Controls
9,032,348 4,135,708 2013
IS 183-XHVAC Comfort Controls
7,335,809 3,518,141 2012
IS 147-XHVAC Comfort Controls
7,345,590 3,090,960 2013
TOTAL 647,795,142 276,118,849

Local Law 86 of 2005 Fiscal Year 2010 Annual Report
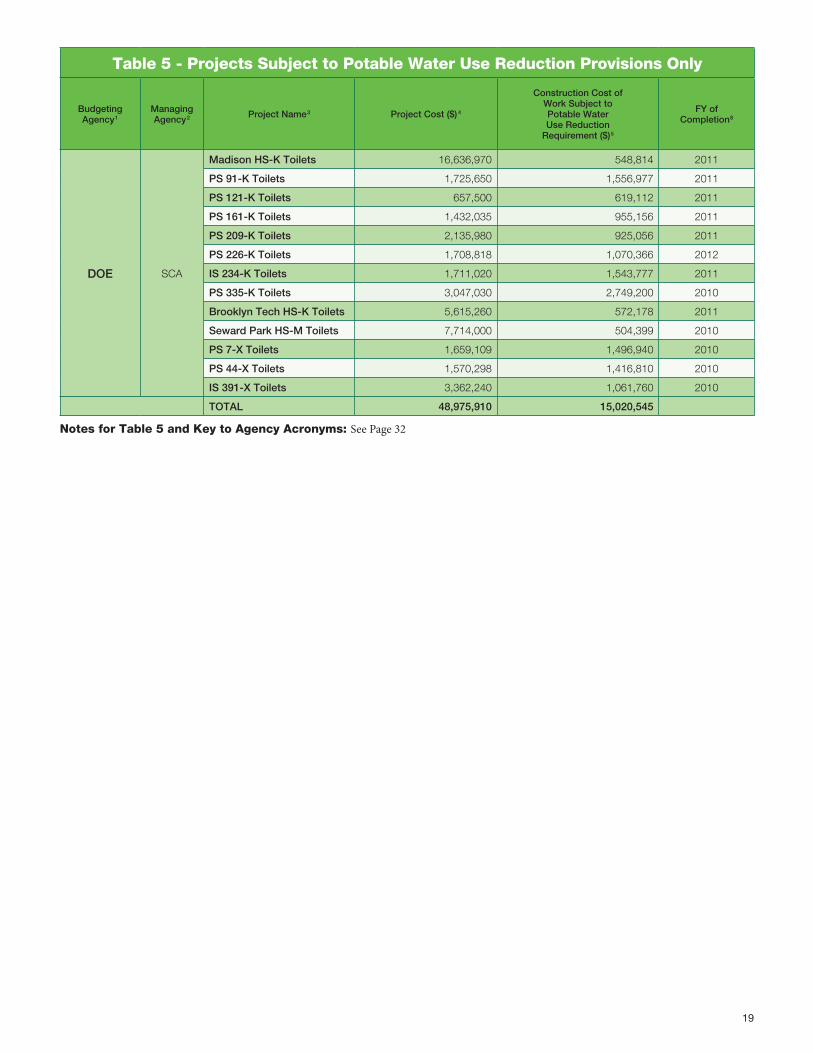
Projects Subject to Potable Water Use Reduction Provisions
By the end of FY 2010, LL86 had required 83 projects that involved work on plumbing systems with con-struction costs of $0.5M or more to reduce domestic water usage by a minimum of 20-30%. The total com-bined construction cost of such work was about $104,000,000.
Of these 83, 67 are among those listed in “Table 3 - Projects Subject to both LEED® Rating Level and Energy Cost Reduction Provisions”. Thirteen additional projects that are not subject to any other LL86 provisions are subject to the potable water use provisions. These are listed in “Table 5 - Projects Subject to Potable Wa-ter Use Reduction Provisions Only”, which follows (page 19). Two of the LEED® projects with construction costs from $2,000,000 to $12,000,000 and one that is subject to the System Specific Energy Cost Reduction Requirements, listed in Tables 2 and Table 4 respectively, are also subject to the potable water use reduction provisions.
Projects Subject to LL86 of 2005
McCarren Park Pool ReconstructionRogers Marvel Architects, PLLC
19
Notes for Table 5 and Key to Agency Acronyms: See Page 32
Table 5 - Projects Subject to Potable Water Use Reduction Provisions Only
Budgeting Agency1
Managing Agency2 Project Name3 Project Cost ($)4
Construction Cost of Work Subject to Potable Water Use Reduction
Requirement ($)5
FY of Completion8
DOE SCA
Madison HS-K Toilets 16,636,970 548,814 2011
PS 91-K Toilets 1,725,650 1,556,977 2011
PS 121-K Toilets 657,500 619,112 2011
PS 161-K Toilets 1,432,035 955,156 2011
PS 209-K Toilets 2,135,980 925,056 2011
PS 226-K Toilets 1,708,818 1,070,366 2012
IS 234-K Toilets 1,711,020 1,543,777 2011
PS 335-K Toilets 3,047,030 2,749,200 2010
Brooklyn Tech HS-K Toilets 5,615,260 572,178 2011
Seward Park HS-M Toilets 7,714,000 504,399 2010
PS 7-X Toilets 1,659,109 1,496,940 2010
PS 44-X Toilets 1,570,298 1,416,810 2010
IS 391-X Toilets 3,362,240 1,061,760 2010
TOTAL 48,975,910 15,020,545
Local Law 86 of 2005 Fiscal Year 2010 Annual Report
Completed Projects
For the purposes of LL86 reporting, a completed project has the following attributes: all the city funds that will be utilized for the project have been released from the city treasury, the project has achieved all appli-cable LL86 requirements, and the project is at least substantially complete. In the case of a project subject to the LEED® rating level requirement, this means it must have achieved at least the required rating level and, if required to apply to the USGBC for certification of a LEED® rating, it must have received this certification.
The 28 LL86 projects that have been completed in accordance with the criteria above are those listed in Tables 2 through 5 of this report with an FY of Completion of 2010 or earlier. Of those projects subject to the LEED® rating level requirement, listed in Tables 2 and 3, Building J achieved a LEED® Gold rating level that was certi-fied by the USGBC and Brooklyn Museum Climate Control Phase 1A received a Silver rating level that was also certified. One project, the addition and renovation of PS 59 in Manhattan, was completed in accordance with the requirements of the Green Schools Rating System 2007. An additional 25 projects, managed by the SCA for the Department of Education and subject to the various system specific energy and water use reduc-tion requirements, have also been completed.
Exempted Projects
LL86 allows MOEC to grant a full or partial exemption from any one of the 11 possible requirements in the law to the extent that the dollars allocated to those projects receiving such an exemption account for less than 20% of the city dollars allocated, i.e. released from the city treasury, each fiscal year to all the projects subject to the same requirement except in the case of a project granted a partial exemption from a requirement where the dollars allocated are adjusted in proportion to the incremental construction cost of partial compliance relative to that of full compliance. Since the Sephardic Community Center is the only one of three projects re-ceiving exemptions that actually spent city capital dollars in FY 2010, only the FY 2010 allocations to projects subject to the same requirements for which the Center received exemptions were considered in determining whether the related 20% thresholds in the law were reached this year. For each one of the three LL86 require-ments that apply to the Center, these values were found to be well within the 20% limits cited in the law. The background and justifications for the full exemptions granted to the Center and for the two other projects that have received partial exemptions to date are described below.
In FY 2008, the Sephardic Community Center, listed in Table 3, received full exemptions from all three of the LL86 requirements that applied to the project. Although it had completed design and started construction well before the law took effect, the Sephardic Community Center project technically was subject to the law be-cause it received a grant from the City after the law’s effective date, thereby triggering LL86. Compliance with
Projects Subject to LL86 of 2005

21
the law after the start of construction meant the project would have had to be redesigned and partially rebuilt, an outcome that was clearly “not in the public interest”, the standard for granting exemptions that is cited in the law.
For the YMCA Arverne project listed in Table 3, the Department of Housing Preservation and Develop-ment and the Young Men’s Christian Association (YMCA) requested and received several partial exemptions. Although the City had committed to providing city funds for this project early in design, the initial grant amount was not large enough to trigger the law. It was only after the design was nearly complete that the City agreed to increase its funding contribution in an amount sufficient to trigger several LL86 requirements: the LEED® rating level requirement, the minimum 20% energy cost reduction requirement for LEED® projects, and the minimum 30% potable water use reduction requirement. Since full compliance would have neces-sitated a significant redesign, the partial exemptions granted allowed the lessening to 5% of both the LEED® energy prerequisite minimum 10% energy cost reduction requirement and the LL86 LEED® project minimum 20% energy cost reduction requirement. The LL86 potable water reduction requirement was also relaxed from 30% to 20%. The third project to apply for an exemption was the Whitney Museum at Gansevoort Street. In the course of its land acquisition negotiations with the City and in conjunction with the Department of Cultural Affairs and the NYC Economic Development Corporation, the Whitney applied for a partial exemption from the LEED® project minimum 25% energy cost reduction requirement. The Museum indicated that the costs associated with meeting this requirement would have jeopardized the project’s viability due to the additional investment needed for compliance while maintaining the strict humidity and temperature levels necessary to protect a world class art collection. Upon review of the schematic design and cost/benefit analysis provided by the applicants, MOEC agreed that the full amount of the additional investment was not in the public interest. A lessening of this requirement to 14% from 25% was therefore granted, subject to several conditions, including MOEC review of revisions to the documentation upon which their determinaton was based, periodic review by MOEC of the team’s progress towards achieving a LEED® Gold rating level target under LEED® for New Construction 2009, and certification by the USGBC that the targeted rating was achieved. Note that, since one of the prerequisites for being included in the required LL86 annual report is the receipt of a Certificate to Proceed that has been approved by OMB, this third project does not yet appear in the project tables of this annual report.
Local Law 86 of 2005 Fiscal Year 2010 Annual Report
Benefits and Costs of LL86 of 2005
Projected Benefits and Costs of LEED® Rating Level, Energy Cost Reduction, and Potable Water Use Reduction Provisions
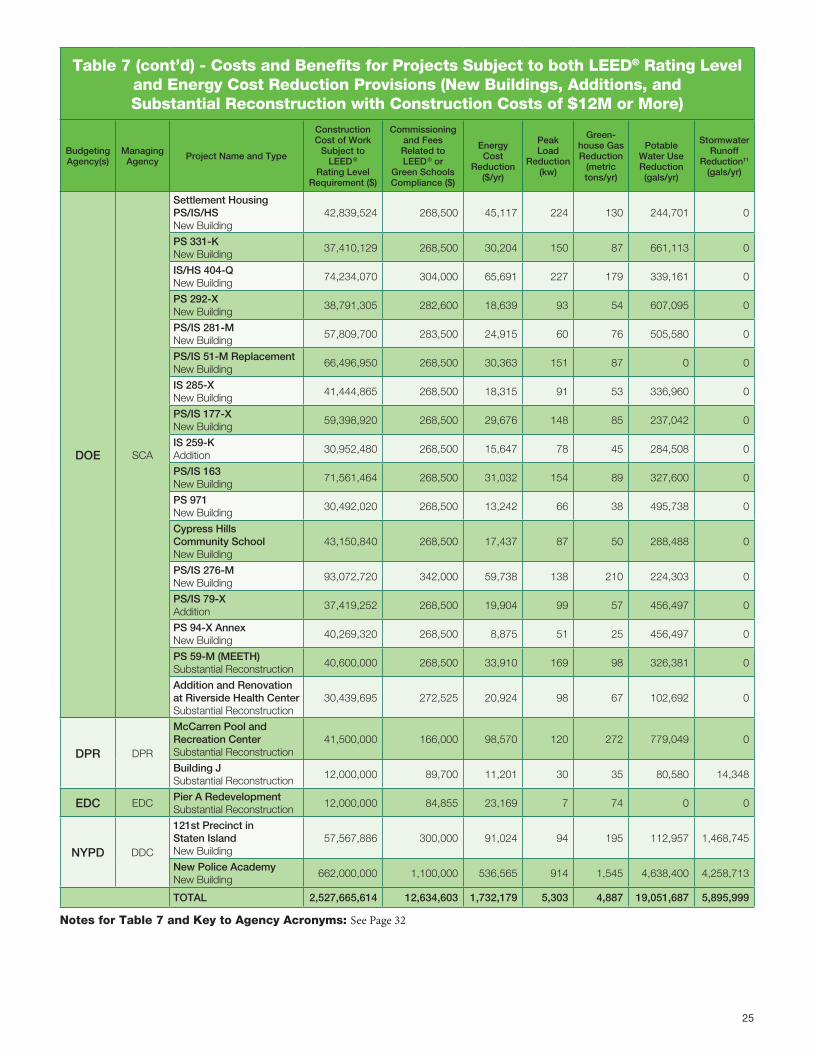
The following Tables 6, 7, 9, and 10, show estimated costs and benefits for the LL86 projects listed in Tables 2, 3, 4, and 5 that have started construction. Table 8 (page 26) describes the incremental cost, energy cost reduction, and payback for specific energy efficiency measures utilized by several projects in Table 7 (page 24) to achieve the LL86 minimum energy cost reduction requirements. Benefits quantified in these tables include energy cost savings1, greenhouse gas2 reduction, and peak electric demand reduction, as well as reductions in both stormwa-ter runoff and potable water use3. Costs indicated include the construction cost of the portion of projects sub-ject to LL86 requirements5, the cost of compliance with the LEED® rating level provisions6, and the incremental construction cost of compliance with the LL86 LEED® project energy cost reduction provisions. Table 6 (page 23) compiles the cost/benefit data reported for those projects subject to the LEED® rating level provisions with con-struction costs from $2M-$12M. The second table, Table 7 (page 24), covers LEED® projects that are valued over $12M and are therefore also subject to the 20-30% minimum energy cost reduction provisions. Table 9 (page 28) shows the benefits reported for work subject to the system specific energy cost reduction requirements4. And finally, Table 10 (page 30) shows the benefits reported for work subject only to the LL86 potable water use reduc-tion provisions, i.e. water use reduction benefits that are not covered in the other tables.
Footnotes:
1. The calculations for energy cost savings utilize the FY 2010 energy rates provided by the Division of Energy Management (DEM) of the NYC Department of Administrative Services (DCAS) for electricity, natural gas, and purchased steam. These rates are posted at nyc.gov/oec. In accordance with the LL86 Rules, energy cost and peak load reductions are relative to a baseline defined in the New York State Energy Conservation Construction Code.
2. Coefficients for greenhouse gas reduction calculations were provided by the NYC Mayor’s Office of Long Term Planning and Sustain-ability.
3. In accordance with the LL86 Rules, estimated reductions in potable water use and stormwater runoff are calculated relative to the base- lines defined in the applicable sections of the LEED® NC-2.1 or 2.2 rating systems.
4. The energy related benefits for DOE projects involving steam boiler upgrades may include benefits related to steam trap replacement work implemented, with prior MOEC approval, to meet the boiler upgrade energy cost requirements in the most cost effective manner.
5. Note that the costs indicated in the “Construction Cost” column of the Cost and Benefit tables represent the total construction cost of work subject to the provisions of LL86, i.e. not the incremental cost of the added construction needed to satisfy the LL86 energy cost re-duction provisions beyond the minimum construction necessary to meet the standards in the NYC Building Code, and therefore should not be divided by the the energy cost reduction indicated in order to calculate the simple payback of the investment mandated by LL86.
6. Variations in the reported cost of compliance with the LEED® rating level provisions, relative to overall construction cost, may be explained by several factors. First, the portion of project work that is comprised of commissioned systems and the level of precision required by the specific commissioning program may vary considerably from one project to another, resulting in significant variations in commissioning costs for projects of similar size. Second, the amount of experience a consultant may have with LEED® rating systems, as well the size of the project itself, may have a significant effect on the percentage of project costs devoted to achieving the required LEED® rating level. And finally, in the case of many school projects where commissioning and Green Schools compliance services are partially performed by SCA personnel, the professional fees reported are sometimes the outcome of averaging total commissioning and compli-ance costs for a group of projects in order to arrive at the costs per school indicated in the table.

23
Table 6 - Costs and Benefits for Projects Subject to LEED® Rating Level Provisions Only (New Buildings, Additions, and
Substantial Reconstruction with Construction Costs from $2M to $12M)
Budgeting Agency(s)
Managing Agency(s)
Project Name and Type
Construction Cost of
Work Subject to LEED
Rating Level Requirement ($)
Commissioning and Fees Related to LEED® or Green
Schools Compliance ($)
Energy Cost Reduction
($/yr)
Peak Load Reduction
(kw)
Greenhouse Gas
Reduction (metric tons/yr)
Potable Water Use
Reduction (gals/yr)
Stormwater Runoff
Reduction11
(gals/yr)
DCLA DDC
NYBG McQuillan FacilitySubstantial Reconstruction
2,018,070 75,000 3,940 3 13 30,124 1,730,107
NYBG Snuff MillSubstantial Reconstruction
8,486,000 75,000 8,653 38 20 29,358 55,042
Mind-Builders Creative Arts CenterSubstantial Reconstruction
6,033,825 144,455 7,275 19 24 50,711 0
DPR DPRMarine Park Community CenterNew Building
9,000,000 17,300 13,376 15 36 172,692 0
NYPL DDCMariners Harbor Branch LibraryNew Building
9,325,106 104,258 7,289 46 15 49,830 0
QPL DDCGlen Oaks Branch LibraryNew Building
11,658,000 146,317 8,770 54 30 102,643 0
TOTAL 46,521,001 562,330 49,304 174 138 435,358 1,785,149
Notes for Table 6 and Key to Agency Acronyms: See Page 32

Local Law 86 of 2005 Fiscal Year 2010 Annual Report
Notes for Table 7 and Key to Agency Acronyms: See Page 32
Table 7 - Costs and Benefits for Projects Subject to both LEED® Rating Level and Energy Cost Reduction Provisions (New Buildings, Additions, and
Substantial Reconstruction with Construction Costs of $12M or More)
Budgeting Agency
Managing Agency Project Name and Type
Construction Cost of Work
Subject to LEED®
Rating Level Requirement ($)
Commissioning and Fees Related to LEED® or
Green Schools Compliance ($)
Energy Cost
Reduction ($/yr)
Peak Load
Reduction (kw)
Green-house Gas Reduction
(metric tons/yr)
Potable
Water Use Reduction (gals/yr)
Stormwater Runoff
Reduction11 (gals/yr)
DCLA
DDC
Brooklyn Museum Climate Control - 4ASubstantial Reconstruction
13,580,128 89,960 13,965 90 31 148,457 151,193
SIIAS Buildings A & B at SHCCAddition
21,392,000 200,000 5,351 23 16 0 0
122 Community CenterSubstantial Reconstruction
25,540,000 260,418 34,339 32 69 219,200 0
EDC
Downtown Brooklyn Strand TheaterSubstantial Reconstruction
21,762,000 1,163,000 34,886 111 72 367,000 0
Orchestra of St. Luke’s - DiMenna CenterAddition
48,000,000 147,730 29,680 48 100 86,292 0
DHS DDCNew Family Intake Center - BronxNew Building
67,839,000 269,715 28,671 54 63 338,642 3,000
DOE SCA
PS 8-KAddition
22,779,016 283,500 5,457 27 16 79,722 0
PS/IS 48-QNew Building
62,776,844 268,500 28,729 143 83 449,118 0
PS 42-QAddition
32,490,536 268,500 16,222 81 47 644,454 0
PS 196-QAddition
27,048,736 268,500 10,904 54 31 324,450 0
Ampark Neighborhood School-XAddition
35,038,016 268,500 17,071 85 49 203,774 0
PS 133-KNew Building
79,203,904 268,500 35,898 179 103 434,079 0
PS 160-K AnnexAddition
37,877,320 268,500 18,936 94 55 227,633 0
PS 264-KNew Building
47,618,624 268,500 22,467 112 65 221,202 0
IS/HS @ Spring CreekNew Building
87,125,688 268,500 47,218 235 136 685,575 0
All City Leadership SchoolNew Building
35,041,604 268,500 16,247 81 47 202,766 0
PS 310-KNew Building
32,076,000 268,500 16,121 80 46 152,415 0
Community Health Academy (CLOTH)New Building
52,298,688 268,500 22,973 114 66 275,823 0
Maspeth HS 585-QNew Building
84,019,000 268,500 45,815 228 132 1,464,800 0
PS/IS 277-QNew Building
56,331,600 268,500 28,900 144 83 635,360 0
PS 29-QAddition
16,375,770 282,600 8,169 41 24 385,583 0
25
Notes for Table 7 and Key to Agency Acronyms: See Page 32
Table 7 (cont’d) - Costs and Benefits for Projects Subject to both LEED® Rating Level and Energy Cost Reduction Provisions (New Buildings, Additions, and Substantial Reconstruction with Construction Costs of $12M or More)
Budgeting Agency(s)
Managing Agency Project Name and Type
Construction Cost of Work
Subject to LEED®
Rating Level Requirement ($)
Commissioning and Fees Related to LEED® or
Green Schools Compliance ($)
Energy Cost
Reduction ($/yr)
Peak Load
Reduction (kw)
Green-house Gas Reduction
(metric tons/yr)
Potable
Water Use Reduction (gals/yr)
Stormwater Runoff
Reduction11 (gals/yr)
DOE SCA
Settlement Housing PS/IS/HSNew Building
42,839,524 268,500 45,117 224 130 244,701 0
PS 331-KNew Building
37,410,129 268,500 30,204 150 87 661,113 0
IS/HS 404-QNew Building
74,234,070 304,000 65,691 227 179 339,161 0
PS 292-XNew Building
38,791,305 282,600 18,639 93 54 607,095 0
PS/IS 281-MNew Building
57,809,700 283,500 24,915 60 76 505,580 0
PS/IS 51-M ReplacementNew Building
66,496,950 268,500 30,363 151 87 0 0
IS 285-XNew Building
41,444,865 268,500 18,315 91 53 336,960 0
PS/IS 177-XNew Building
59,398,920 268,500 29,676 148 85 237,042 0
IS 259-KAddition
30,952,480 268,500 15,647 78 45 284,508 0
PS/IS 163New Building
71,561,464 268,500 31,032 154 89 327,600 0
PS 971New Building
30,492,020 268,500 13,242 66 38 495,738 0
Cypress Hills Community SchoolNew Building
43,150,840 268,500 17,437 87 50 288,488 0
PS/IS 276-MNew Building
93,072,720 342,000 59,738 138 210 224,303 0
PS/IS 79-XAddition
37,419,252 268,500 19,904 99 57 456,497 0
PS 94-X AnnexNew Building
40,269,320 268,500 8,875 51 25 456,497 0
PS 59-M (MEETH)Substantial Reconstruction
40,600,000 268,500 33,910 169 98 326,381 0
Addition and Renovation at Riverside Health CenterSubstantial Reconstruction
30,439,695 272,525 20,924 98 67 102,692 0
DPR DPR
McCarren Pool and Recreation CenterSubstantial Reconstruction
41,500,000 166,000 98,570 120 272 779,049 0
Building JSubstantial Reconstruction
12,000,000 89,700 11,201 30 35 80,580 14,348
EDC EDCPier A RedevelopmentSubstantial Reconstruction
12,000,000 84,855 23,169 7 74 0 0
NYPD DDC
121st Precinct in Staten IslandNew Building
57,567,886 300,000 91,024 94 195 112,957 1,468,745
New Police AcademyNew Building
662,000,000 1,100,000 536,565 914 1,545 4,638,400 4,258,713
TOTAL 2,527,665,614 12,634,603 1,732,179 5,303 4,887 19,051,687 5,895,999

Local Law 86 of 2005 Fiscal Year 2010 Annual Report
Notes for Table 8 and Key to Agency Acronyms: See Page 32
Table 8 - Costs and Benefits of Energy Efficiency Measures (EEM) of Projects in Table 7
Budgeting Agency
Managing Agency Project Name Energy Efficiency
Measure Description
Incremental Construction Cost of
Individual EEM ($)
Energy Cost Reduction
of Individual EEM ($/yr)
Simple Payback of Individual EEM (yrs)
DCLA DDC 122 Community Center
Efficient Wall Assembly 16,000 1,309 12
Efficient Window Glazing 30,000 2,588 12
Efficient Lighting 0 4,188 0
CO2 Sensors 32,000 20,231 2
Geothermal Heat Pumps 1,083,000 24,391 44
TOTAL 1,161,000 52,707 22
DHS DDCNew Family Intake Center - Bronx
Efficient Wall Assembly 44,000 2,897 15
Glazing 189,980 3,070 62
Efficient Roof Assembly 21,600 546 40
Automated Interior Shades 44,480 2,611 17
Efficient Lighting 0 5,274 0
Daylight Dimming Controls 62,000 4,857 13
Occupancy Sensors 18,400 2,747 7
CO2 Sensors 12,000 1,332 9
Enthalpy Economizer 0 67 0
Heat Recovery 126,000 6,863 18
Premium Efficiency Motors 1,300 316 4
Hi Efficency Boilers 3,000 5,741 1
Variable Frequescy Drives on HW Pumps
19,600 3,363 6
TOTAL 542,360 39,684 14
DOHMH DDCAddition and Renovation at Riverside Health Center
Viracon VE1-2M Argon Filled Glazing for All Windows
75,000 10,108 7
Additional Insulation at Walls and Roofs
35,000 11,709 3
High Reflectance Roof 9,000 8,047 1
Automated Internal Shades 28,000 9,145 3
High Efficiency Lighting 20,000 11,621 2
Daylight Sensors 20,000 13,037 2
Occupancy Sensors 40,000 14,107 3
Variable Frequency Drives for Pumps and Fans
12,000 8,999 1
Premium Efficiency Motors 2,000 7,746 0
Enthalpy Wheel Heat Recovery 30,000 14,037 2
CO2 Sensors 75,000 13,951 5
Condensing Boilers 233,312 11,981 19
Temperature Controls 115,000 11,903 10
TOTAL 694,312 146,391 5

27
Notes for Table 8 and Key to Agency Acronyms: See Page 32
Table 8 (cont’d) - Costs and Benefits of Energy Efficiency Measures of Projects in Table 7
Budgeting Agency
Managing Agency Project Name Energy Efficiency
Measure Description
Incremental Construction Cost of
Individual EEM ($)
Energy Cost Reduction
of Individual EEM ($/yr)
Simple Payback of Individual EEM (yrs)
DPR EDC Building J
Additional Wall Insulation 11,000 3,049 4
Low-E Coating on Insulated Glazing
21,490 21,490 1
Additional Roof Insulation 11,300 1,972 6
87% Efficiency Condensing Boiler with VAV System
7,400 897 8
Low LPD (Lighting Power Densities)
0 449 0
Occupancy Sensors for Lighting Control
4,400 179 25
TOTAL 55,590 28,036 2
NYPD DDC121st Precinct in Staten Island
Lighting Efficiency 0 2,029 0
Motor Efficiency, Motor Control 35,645 2,796 13
Boiler Efficiency 14,850 3,998 4
Wall Insulation 48,000 4,930 10
Roof insulation 17,921 1,156 16
Low E-Glass 18,940 1,973 10
TOTAL 135,356 16,882 8
NYPD DDC New Police Academy
Economizer Controls (air & water side)
1,035,000 36,085 29
Demand Controlled Ventilation in Dense & Variable Occupancy Spaces
266,000 18,702 14
Exhaust Air Energy Recovery 972,000 12,809 76
Efficient Variable-Speed Chillers 150,000 170,981 1
Efficient Boilers with Improved Part Load Performance
240,000 6,149 39
Heat Recovery with Condenser Water for DHW Systems
155,000 70,203 2
Cogeneration System to Generate Electricity and Use Waste Heat for Domestic Hot Water
1,245,000 120,145 10
Reduced Lighting Power Densities
0 37,864 0
Daylight Responsive Controls for Typical Spaces
62,000 54,291 1
Increased Exterior Wall Insulation 120,380 17,087 7
Increased Roof Insulation 155,282 6,338 25
Increased Slab-on-Grade Insulation
217,458 568 383
High Performance Curtain Wall & Skylight Glazing
184,986 16,809 11
Exterior Shading Devices 1,444,999 10,663 136
TOTAL 4,125,000 578,694 7

Local Law 86 of 2005 Fiscal Year 2010 Annual Report
Notes for Table 9 and Key to Agency Acronyms: See Page 32
Table 9 - Costs and Benefits of Projects Subject to System Specific Energy Cost Reduction Provisions
Budgeting Agency1
Managing Agency2 Project Name3
Construction Cost of Work Subject to
System Specific Energy Cost Reduction Requirement ($)5
Electric Peak Demand
Reduction (kw)
Energy Cost Reduction ($)
Greenhouse Gas
Reduction (metric tons/yr)
CJC DDCKings County Criminal Court RenovationLighting Upgrade
1,339,000 0 1,491 3
DCAS DCAS60 Centre Heating UpgradeBoiler Upgrade
4,461,845 2 355 1
DCLA DDCAmerican Museum of Natural History Lighting Upgrade
1,100,000 39 33,374 68
DOE SCA
JHS 45-MBoiler Upgrade
3,603,853 0 4,148 18
PS 52-KBoiler Upgrade
3,055,749 0 2,254 10
PS 188-QBoiler Upgrade
3,875,714 0 1,453 6
PS 178-QBoiler Upgrade
3,757,320 0 1,423 6
PS 122-XBoiler Upgrade
4,287,025 0 1,738 7
W.E.B. DUBOIS HS-KBoiler Upgrade
5,289,944 0 1,159 5
PS 377-KBoiler Upgrade
4,019,192 0 2,583 11
PS 246-XBoiler Upgrade
4,548,792 0 1,437 6
PS 57-MBoiler Upgrade
3,137,596 0 3,093 13
JHS 10-QBoiler Upgrade
6,649,241 0 2,285 10
Gompers Vocational HS-XBoiler Upgrade
5,256,865 0 3,921 17
Taft HS-XBoiler Upgrade
8,321,518 0 6,609 28
IS 115-XBoiler Upgrade
5,121,710 0 2,575 11
PS 120-KBoiler Upgrade
3,516,976 0 1,209 5
PS 81-KBoiler Upgrade
3,137,470 0 2,668 11
PS 108-XBoiler Upgrade
4,299,624 0 896 4
PS 56-KBoiler Upgrade
3,898,560 0 2,079 9
PS 23-RBoiler Upgrade
2,916,467 0 1,631 7
PS 36-MBoiler Upgrade
3,422,167 0 1,645 7
PS 76-MBoiler Upgrade
3,467,388 0 2,081 9

29
Notes for Table 9 and Key to Agency Acronyms: See Page 32
Table 9 (cont’d) - Costs and Benefits of Projects Subject to System Specific Energy Cost Reduction Provisions
Budgeting Agency1
Managing Agency2 Project Name3
Construction Cost of Work Subject to
System Specific Energy Cost Reduction Requirement ($)5
Electric Peak Demand
Reduction (kw)
Energy Cost Reduction ($)
Greenhouse Gas
Reduction (metric tons/yr)
DOE SCA
PS 32-XBoiler Upgrade
3,633,340 0 2,060 9
John Jay HS-KBoiler Upgrade
7,426,219 0 6,453 28
PS 111-MBoiler Upgrade
4,562,867 0 2,138 9
PS 121-QBoiler Upgrade
3,257,033 0 1,844 8
IS 227-QBoiler Upgrade
5,294,664 0 4,160 18
Jamaica HS-QBoiler Upgrade
6,735,523 0 5,776 25
PS 194-MBoiler Upgrade
5,105,600 0 1,835 8
PS 12-XBoiler Upgrade
4,184,474 0 1,779 8
Fort Hamilton HS-KBoiler Upgrade
9,059,580 0 5,735 24
PS 253-KBoiler Upgrade
4,631,206 0 1,673 7
IS 93-QLighting Upgrade
1,077,705 23 9,834 20
IS 127-XLighting Upgrade
1,142,100 25 10,594 22
JHS 141-XBoiler Upgrade
3,811,581 0 2,896 12
PS 111-QBoiler Upgrade
3,634,373 0 2,075 9
TOTAL 156,040,279 89 140,960 478

Local Law 86 of 2005 Fiscal Year 2010 Annual Report
Table 10 - Costs and Benefits of Projects Subject to Potable Water Use Reduction Provisions Only
Budgeting Agency1
Managing Agency2 Project Name3
Construction Cost of Work Subject to
Potable Water Use Reduction Requirement ($)5
Potable Water Use Reduction
(gals/yr)
DOE SCA
Madison HS-K Toilets 548,814 902,467
PS 91-K Toilets 1,556,977 351,697
PS 121-K Toilets 619,112 157,248
PS 161-K Toilets 955,156 565,110
PS 209-K Toilets 925,056 369,192
PS 226-K Toilets 1,070,366 484,029
IS 234-K Toilets 1,543,777 1,100,736
PS 335-K Toilets 2,749,200 393,059
Brooklyn Tech HS-K Toilets 572,178 2,304,465
Seward Park HS-M Toilets 504,399 534,310
PS 7-X Toilets 1,496,940 329,238
PS 44-X Toilets 1,416,810 331,695
IS 391-X Toilets 1,061,760 768,427
TOTAL 15,020,546 8,591,673
Notes for Table 10 and Key to Agency Acronyms: See Page 32

31
BAM Fisher BuildingH3 Hardy Collaboration, Architecture, LLC

Local Law 86 of 2005 Fiscal Year 2010 Annual Report
1. The primary budgeting agency is the city agency whose budget carries most, if not all, city funding for a project until the Office of Management and Budget (OMB) authorizes the transfer of funds to the managing agency.
2. The managing agency is the city agency managing construction or that holds a funding agreement, lease, or other legal agreement with a non-city entity(s) that manages construction. It is also the city agency that provided data for this report. In some cases, the managing agency may also be the budgeting agency.
3. The projects in this report are limited to those subject to one or more provisions in LL86 that received their first approved Certif-cate to Proceed from the OMB during or before FY 2010.
4. Project cost is the total of all costs associated with an entire capital project regardless of funding source. It includes all capitally eligible costs as described in the NYC Comptroller’s Directive 10, such as costs related to site acquisition, site preparation, furniture, fittings, and equipment, as well as design and construc-tion. Note that project cost also covers capital investments on portions of the project that may not be covered by the provi-sions of LL86, such as “minor alterations and ordinary repairs” as defined in the NYC Building Code, or portions of a project that do not involve building spaces served by HVAC equipment.
5. Construction costs indicated here are only for that portion of the project work scope that is subject to the relevant LL86 provisions. For example, for a project that has a large landscaping component as well as a building component over $2,000,000, the construction cost reflects only the building portion of the project that is subject to the LEED® related provisions of the law, which may not neces-sarily include the landscaping component. Alternatively, for a project subject to a system specific energy cost reduction require-ment, the construction cost reflects only that work on the portion of the system that is subject to such requirement. Construction costs include all construction related costs, such as mark-ups related to general conditions, contractor overhead and profit, contingencies, and construction management fees. Note that the construction cost indicated here varies from the incremental construction cost discussed in Note 10 below.
6. Since projects may take several years to complete, each year the managing agency typically spends a portion of the total amount of city funds that are committed to the entire project. Note that the FY2010 allocation indicated here represents the amount released from the city treasury during FY 2010 to all portions of the proj-ect, not necessarily only to the portion that is subject to LL86.
7. Floor areas indicated refer to the portion of the project that is subject to the LL86 LEED® rating level provisions and includes
Notes for tables:
Key to agency acronyms:
BkBP Brooklyn Borough PresidentCME Chief Medical ExaminerCJC Criminal Justice CoordinatorDCAS Department of Citywide Administrative ServicesDCLA Department of Cultural AffairsDEP Department of Environmental ProtectionDOC Department of CorrectionsDOE Department of Education DOHMH Department of Health and Mental Hygiene DoITT Department of Information Technology and Telecommunications DHS Department of Homeless Services DPR Department of Parks and RecreationEDC New York City Economic Development CorporationFDNY New York City Fire DepartmentHHC Health and Hospitals CorporationNYBG New York Botanical GardenNYPD New York City Police DepartmentNYPL New York Public Library QBPL Queens Borough Public LibrarySCA New York City School Construction Authority
Table Notes:

33
the area for such projects that utilize either the LEED® or Green Schools 2007 rating system. For example, for a project that in-volves the substantial reconstruction of only a portion of a build-ing, the floor area indicated refers only to that area, not to the area of the entire building.
8. The FY of completion is defined as the FY that all city funds that will be utilized for the project have been released from the city treasury, all applicable LL86 requirements have been met, and the project is at least substantially complete.
9. Simple payback means the number of years, rounded to the near-est whole year, that it takes for the projected annual energy cost reduction, as estimated at the beginning of construction, to equal the estmated incremental construction cost of the energy con-servation measures, as determined by dividing such incremental cost by the reported annual energy cost reduction.
10. The phrase “Incremental Construction Cost of Energy Efficiency Measures” represents the difference in construction cost between the design that meets the energy cost reduction requirements in the law and the construction cost of a design that satisfies the minimum requirements in the NYS Energy Conservation Con-struction Code baseline cited in the LL86 Rules.
11. In order to limit the benefits reported here to those that are a direct result of achieving LL86 requirements, the reductions in stormwater runoff indicated are only for those projects that are targeting one or more points under the stormwater runoff reduc-tion credit in a LEED® rating system or in the Green Schools 2007 rating system.

Local Law 86 of 2005 Fiscal Year 2010 Annual Report
Conclusions
In the three and a half years since Local Law 86 of 2005 (LL86) took effect, 90 new buildings, additions, and reconstructions of existing buildings in New York City that together account for about $5,600,000,000 of project cost and 7,300,000 square feet of floor area have committed to meeting LEED® or NYC Green Schools construc-tion standards as a direct result of the laws’ enactment. Mechanical, electrical, and plumbing system upgrades will significantly exceed the minimum requirements of the NYS Energy Conservation Construction Code on 84 ad-ditional projects with combined project costs of about $700,000,000. Together, these 174 building projects account for over $6,300,000,000 of project costs and represent the foremost indication of the City’s commitment to lead by example with regard to green building. As such, they will serve as precedents for future public and private initia-tives dedicated to advancing the practice of building green in New York City.
The data presented in this report indicate that the overall value of all projects subject to LL86 continues to be higher than initially anticipated. The preamble to the 2005 law estimated that an average of $1.2 billion of project value would be subject to its provisions each year for each of the first ten years after it took effect. At the end of FY10, that annual rate stands at about $1.8 billion, about 50% more than the amount originally projected, though somewhat lower than the analogous $2 billion dollars of annual average project value that city agencies reported last year.
Available data for projects that have finished design show that the average investment to meet both the LEED® rating and energy cost reduction requirements for LEED® projects averages under 1.5% of construction cost, with roughly one third of that investment dedicated to the professional services needed to demonstrate compliance with the LEED® requirements and the other two thirds dedicated to the incremental cost of the investment in energy efficiency measures, an energy efficiency investment with an average simple payback of approximately 7 years.
The professional fees associated with meeting LL86 requirements appear to be trending downward on smaller projects. For the 17 projects with construction costs from $2 million to $12 million that utilize one of the selected LEED® rating systems, the added design and commissioning fees amount to approximately 1.2% of construction cost, considerably lower than the 2% that was reported on all such projects in FY 2009, a finding that suggests fees are lessening as consultants become more familiar with the law and with LEED® rating systems in general. While this amount represents a relatively small dollar value, these smaller projects still spend on average twice the amount, in percentage terms, for the professional fees necessary to satisfy the law’s LEED® provisions than such fees on LEED® projects with construction costs over $12M. The implementation of LL86 requirements continues to support the achievement of the goal, mandated by the New York City Climate Protection Act (Local Law 22 of 2008), to decrease the City’s annual greenhouse gas emis-sions rate by 30% by 2017 for municipal operations and by 30% by 2030 for the City as a whole. Extrapolating
35
from data reported here, the incremental investment in energy efficiency mandated by LL86 contributes toward both of these greenhouse gas reduction goals at an average annual reduction rate of approximately 2800 metric tons per year, representing more than 1% of the City’s 2017 greenhouse gas reduction target.
Extrapolating from projected energy savings reported for projects that have completed design, it is also estimated that LL86 energy efficiency mandates will significantly reduce city expenditures for building energy use. Complet-ed LL86 projects are projected to account for an annual decrease in energy costs of about $1.5M. Total savings, calculated by adding the $1.5M energy cost reduction from one year of completed LL86 projects to the cumulative savings of previous years, should amount to approximately $15M by 2017 and $150M by the year 2030. It is fur-ther worth noting that, due to the inevitablility of rising energy rates, energy cost savings attributable to completed LL86 projects will likely amount to considerably more as rates increase.
Though more challenging to quantify than greenhouse gas and energy cost reduction benefits, savings from the improved health and productivity of occupants in green buildings may exceed those for energy cost. This likeli-hood arises from recent and credible green building research that indicates substantial savings result when such improvements are monetized in terms of metrics such as reduced sick days and health care costs.
In conclusion, it is clear that, despite the moderate variability in the dollar value of building projects that receive city funds each year, LL86 remains an extremely cost-effective means by which to save taxpayer dollars over the life of the buildings and spaces covered by its provisions. The data in this report show that, as more and more LL86 projects are completed, the law’s contribution to reducing greenhouse gas and lowering city expenses, as well as to increasing the health and productivity of building occupants will become increasingly significant.
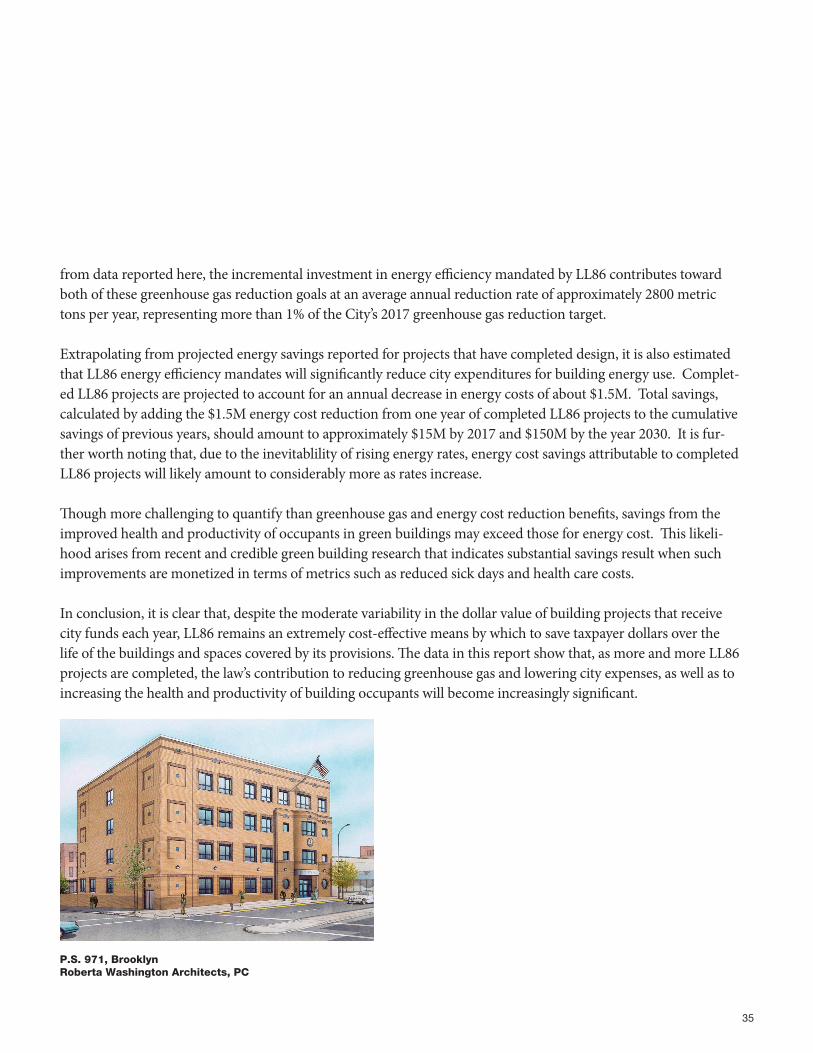
P.S. 971, Brooklyn Roberta Washington Architects, PC

The City of New YorkMichael R. Bloomberg, Mayor
Prepared by:Mayor’s Office of OperationsOffice of Environmental Coordination
www.nyc.gov/oec
Printed on paper containing 30% post-consumer material.