the city of new york · both generally accepted accounting principles and applicable legal...
TRANSCRIPT

For the Fiscal Year Ended June 30, 2017
The City of New York
Popular Annual Financial Report

The City of New York, New York | Popular Annual Financial Report FY 2017 2

Contents
Popular Annual Financial Report FY 2017 .............................................................................................................. 4
Awards .................................................................................................................................................................. 5
Economic Forecast ................................................................................................................................................. 8
General Tax Revenue Growth ................................................................................................................................ 9
Revenues: Where does the money come from? ................................................................................................... 10
Expenses: Where does the money go? ................................................................................................................. 13
The Budget – General Fund Revenues FY 2017..................................................................................................... 14
The Budget – General Fund Revenues FY 2016..................................................................................................... 15
The Budget – General Fund Expenditures FY 2017 ............................................................................................... 16
The Budget – General Fund Expenditures FY 2016 ............................................................................................... 17
Discretely Presented Component Units – Revenues............................................................................................. 18
Discretely Presented Component Units – Expenses ............................................................................................. 19
Capital Projects .................................................................................................................................................... 20
Benchmarks: How do we compare? ..................................................................................................................... 22
Borough-Wide Statistical Information ................................................................................................................. 23
Our Elected Officials ............................................................................................................................................ 24
The Government of the City of New York ............................................................................................................ 25
Acknowledgements ............................................................................................................................................. 27
Office of the New York City Comptroller Scott M. Stringer 3

Popular Annual Financial Report FY 2017
A Message from the New York City Comptroller I am pleased to present the third New York City Popular Annual Financial Report (PAFR) for the fiscal year ended June 30, 2017. The PAFR is designed to give citizens a window into their own government and its budget and is designed to serve as the user-friendly companion to New York City’s 2017 Comprehensive Annual Financial Report (CAFR), a comprehensive accounting of our City’s financials. The PAFR seeks to present much of the same financial information contained within the CAFR, but in a more succinct and simplified manner.
The City’s $85 billion Executive Budget funds critical services in all five boroughs, to New Yorkers of every conceivable background, and helps to build the schools, parks, and infrastructure that define our city. The size and complexity of our budget matches the scale and diversity of our city.
Alongside other important transparency tools, including our interactive Checkbook NYC website, this PAFR gives New Yorkers unprecedented access to the inner workings of our government. My aim is to provide citizens, businesses, and community groups with topline figures on revenues and expenses, as well as a snapshot of our City’s local economy.
This PAFR covers the City’s “primary government,” which is comprised of all City agencies, as well as the legally separate organizations for which the City is financially accountable, known as component units. It also includes a discussion of the City’s economy, comparative benchmarks with other cities, and borough-wide statistics.
Sincerely,
Scott M. Stringer
New York City Comptroller, Scott M. Stringer
The City of New York, New York | Popular Annual Financial Report FY 2017 4
Awards
Popular Annual Financial Report The Government Finance Officers Association of the United States and Canada (GFOA) has given an Award for Outstanding Achievement in Popular Annual Financial Reporting to The City of New York for its Popular Annual Financial Report for the fiscal year ended June 30, 2016. The Award for Outstanding Achievement in Popular Annual Financial Reporting is a prestigious national award recognizing conformance with the highest standards for preparation of state and local government popular reports.
In order to receive an Award for Outstanding Achievement in Popular Annual Financial Reporting, a government must publish a PAFR, whose contents conform to program standards of creativity, presentation, understandability, and reader appeal.
An award for Outstanding Achievement in Popular Annual Financial Reporting is valid for a period of one year only. The City of New York has received a Popular Award for the last two consecutive years (fiscal years ended 2015 and 2016). We believe our current report continues to conform to the Popular Annual Financial Reporting requirements, and we are submitting it to GFOA to determine its eligibility for another Award.
Comprehensive Annual Financial Report The City of New York’s Comprehensive Annual Financial Report (CAFR) for the fiscal year ended June 30, 2016, was awarded the Certificate of Achievement for Excellence in Financial Reporting by the Government Finance Officers Association of the United States and Canada (GFOA). The Certificate of Achievement is the highest form of recognition for excellence in state and local government financial reporting. The information on pages 9-20 has been drawn from the City’s June 30, 2017 CAFR, which reflects a restatement to the prior fiscal year’s 2016 Financial Statements as a result of the implementation of new accounting standards.
In order to be awarded a Certificate of Achievement, a government unit must publish an easily readable and efficiently organized CAFR, whose contents conform to program standards. The report must satisfy both generally accepted accounting principles and applicable legal requirements.
A Certificate of Achievement is valid for a period of one year only. We believe our CAFR continues to conform to the Certificate of Achievement program requirements, and we are submitting it to the GFOA to determine its eligibility for another certificate.
This PAFR and the CAFR are both available on the Comptroller’s website at www.comptroller.nyc.gov.
Office of the New York City Comptroller Scott M. Stringer 5

6Lower Manhattan Skyline Taken from Manhattan Bridge
Pho to Credit: Life in Pixels/Shutterstock.com


Economic Forecast
New York’s job recovery from the Great Recession in FY 2009 continued in FY 2017. New York City added 69,600 private sector jobs in FY 2017, a gain of 1.9 percent compared to a gain of 1.7 percent for the nation. While slower than the pace of job growth thus far in the cycle, demand for workers in the City continues to grow.
The City’s economy added over 31,000 jobs in middle and high income sectors paying $60,000 per year or more.
Sustained employment gains brought the unemployment rates in all five boroughs down to the lowest levels since before the Great Recession. The unemployment rate was 4.2 percent in Manhattan and Queens, 4.8 percent in Staten Island, 4.9 percent in Brooklyn, and 6.5 percent in the Bronx.
Economic growth is expected to continue at a moderate pace in FY 2018 in both the City and the U.S.
Factors that support growth both locally and nationally include strong consumer spending from a healthy employment market and wage increases; expected personal income tax cuts; and improvement in wealth from a strong stock market, increased business profits, and a healthy real estate market. Additionally, increased spending by the government and insurance payments to repair the damage after hurricanes Harvey, Irma, and Maria will further shore up the national economy.
Downside risks to the local and national economies include: excessive interest rate increases from the Federal Reserve that slow down spending and investment; a political stalemate in Washington, D.C. that prohibits tax reform and infrastructure spending; and/or geopolitical risks in the Middle East and Asia. We believe these risks to be minimal and that within the planning period the City should be able to maintain reasonable growth.
3,166.9 3,233.8 3,203.6 3,140.7
3,219.4
3,314.0 3,399.3
3,516.5
3,648.4
3,753.6 3,823.2
2,500
2,700
2,900
3,100
3,300
3,500
3,700
3,900
2007 2008 2009 2010 2011 2012 2013 2014 2015 2016 2017
New York City Private Sector Employment(in thousands)
The City of New York, New York | Popular Annual Financial Report FY 2017 8

General Tax Revenue Growth
Increases in income tax collections, the primary driver being new corporate tax reform legislation.
Increases in real estate tax revenues reflected growth in the billable assessed property value.
Increases in commercial rent taxes due to a strong commercial office market with declining vacancy rates.
Decreases in the sales and use tax revenues driven by a significant reduction of School Tax Relief collections, due to a decrease in mortgage financing activity as a result of a slow-down in commercial transaction activity.
Other taxes decreased because of a significant decrease in the conveyance of real property tax due to a slow-down in commercial transaction activity.
45% $24,587
15% $8,308
20% $11,257
14% $7,876
6% $3,346
Real estate taxes
Sales and use tax
Personal income tax
Income taxes
Other taxes
Total Tax Revenues FY 2017 (in millions)
Office of the New York City Comptroller Scott M. Stringer 9

Revenues: Where does the money come from?
The primary government consists of all organizations that make up the City’s legal entity. Component units are legally separate organizations for which the City is financially accountable. Component units that are operationally codependent upon the primary government are in substance the same as the primary government and are included, or blended, into the primary government. In addition to governmental activities, which accounts for services provided to the City’s citizenry, the primary government, for the first time, comprises a component unit distinction known as business-type activities. The business-type activities distinction accounts for fee-based services that the City provides to third parties.
When comparing the revenues and expenditures presented in the governmental fund financial statements to the revenues and expenses recorded in the government-wide – primary government statement, bear in mind that the differences that exist are due to the different methods of accounting used to prepare these statements. Financial reporting for the government-wide – primary government presentation is designed to provide readers with a broad, long-term, overview of the City’s finances in a manner similar to a private-sector business. The primary government’s long-term focus calls for the recording of both assets and liabilities that exceed one year. In contrast, the governmental fund financial statements reporting (discussed later) is limited to reporting on near-term resources, similar to the City’s budget; its near-term focus emphasizes the recording of liabilities that are expected to be due and assets that are available to be used within the year.
The programs and functions listed are funded by two major sources: program revenues, including grants, (see page 11) and general revenues (see page 12). Program revenues are collected and available for their respective programs and functions. General revenues are available to be used for any program or function.
Charging Bull Sculpture, New York Photo Credit: photo.ua/ shutterstock
The City of New York, New York | Popular Annual Financial Report FY 2017 10

Revenues: Where does the money come from? (Continued)
Program Revenues – Primary Government In FY 2017, program revenues were almost $29 billion. Education had the most program revenues, overwhelmingly from grants, consisting of over $12 billion, followed by social services, at over $5 billion. Program revenues increased in FY 2017 by almost $2.4 billion from FY 2016. Increases in program revenues in general government and education had the greatest effect on the increase.
1 Includes payments to the City for costs of the Water and Sewer system from water and sewer rate payments. 2 Business-Type Activities refers to the following entities: Brooklyn Bridge Park, Trust for Governor’s Island, World Trade Center
Captive Insurance Company, Inc., and Tax Lien Trusts. Please refer to the FY 2017 CAFR for additional information regarding the goods and services provided by these entities.
Grants and Other Program Revenues (in millions) FY 2017 FY 2016 FY 2015
Primary Government
General government $3,905 $2,632 $3,718
Public safety and judicial 996 1,015 986
Education 12,431 11,792 11,120
City University 665 644 621
Social services 5,375 4,901 4,717
Environmental protection1 1,464 1,362 1,575
Transportation services 1,771 1,809 1,655
Parks, recreation and cultural activities 172 280 344
Housing 995 966 929
Health 962 997 824
Debt Service interest 7 9 1
Total Governmental Activities $28,743 $26,407 $26,490
Total Business-Type Activities2 $199 $155 n/a
Total Program Revenues - Primary Government $28,942 $26,562 $26,490
Office of the New York City Comptroller Scott M. Stringer 11

Revenues: Where does the money come from? (Continued)
General Revenues – Primary Government In FY 2017, general revenues were over $56 billion. Real estate taxes were the greatest single source of general revenues, totaling almost $25 billion, followed by personal income tax, totaling over $11 billion. General revenues increased in FY 2017 by almost $1.7 billion from FY 2016, with real estate taxes, income taxes, and other taxes, having the greatest effect on the increase.
General Revenues (in millions) FY 2017 FY 2016 FY 2015
Real estate taxes - (RET) $24,587 $23,171 $21,448
Sales and use taxes - (SUT) 8,307 8,535 8,072
Personal income tax - (PIT) 11,257 11,565 11,560
Income taxes, other - (ITO) 7,876 6,761 7,965
Other taxes* - (OT) 3,346 3,541 3,479
Investment income* - (II) 227 195 161
Unrestricted Federal and State aid - (UFSA) 311 258 252
Other revenues* - (OR) 433 636 1,404
Total General Revenues - Primary Government $56,344 $54,662 $54,341
*Includes Business-Type Activities General Revenues
$0
$5
$10
$15
$20
$25
$30
RET SUT PIT ITO OT II UFSA OR
FY 2017 FY 2016 FY 2015
Taxes and Other General Revenues (in millions)
The City of New York, New York | Popular Annual Financial Report FY 2017 12

Expenses: Where does the money go?
Expenses – Primary Government FY 2017 expenses (including all related personnel and applicable pension and benefit costs) were over $86 billion. The City incurred the most expenses for education, at almost $29 billion, followed by public safety, at almost $19 billion. Expenses decreased in FY 2017 by almost $1 billion from FY 2016. The decrease was attributable to an overall decrease in pension expenses and a decrease in health expenses at the New York City Health and Hospitals Corporation, due to prepayments made in the prior fiscal year.
$0
$5
$10
$15
$20
$25
$30
$35
GG PS E CU SS EP TS PK HG H L DSI BTBCU
FY 2017 FY 2016 FY 2015
Expenses (in billions)
Expenses (in millions) FY 2017 FY 2016 FY 2015
General government - (GG) $5,360 $5,260 $5,480
Public safety and judicial - (PS) 18,962 19,681 13,841
Education - (E) 28,840 29,295 22,916
City University - (CU) 1,253 1,342 1,094
Social services - (SS) 15,402 14,969 14,514
Environmental protection - (EP) 3,570 3,710 3,189
Transportation services - (TS) 2,542 2,785 2,461
Parks, recreation and cultural activities - (PK) 1,265 1,150 1,250
Housing - (HG) 2,395 2,007 1,574
Health (including payments to HHC) - (H) 2,874 3,278 2,186
Libraries - (L) 421 458 350
Debt service interest - (DSI) 2,959 2,933 2,929
Business-Type Blended Component Unit - (BTBCU) 322 241 n/a
Total Expenses - Primary Government $86,165 $87,109 $71,783
Office of the New York City Comptroller Scott M. Stringer 13

The Budget – General Fund Revenues FY 2017
General Fund Revenues The General Fund is the main operating fund of the City used to account for all financial resources not accounted for and reported in other funds, such as the Capital Projects Fund or the Debt Services Fund. General Fund revenues, as listed below, include tax revenues, Federal and State aid (except aid for capital projects), and operating revenues. Revenue budgets help management set financial goals and assist management in planning for future needs and allocation of resources.
General Fund Revenues (in millions) Adopted Budget
Modified Budget Actual
Better (Worse) Than
Modified Budget
Real estate taxes - (RET) $24,229 $24,651 $24,680 $29
Sales and use taxes - (SUT) 8,328 8,260 8,297 37
Personal income tax - (PIT) 11,577 11,255 11,258 3
Income taxes, other - (ITO) 6,546 7,190 7,121 (69)
Other taxes - (OT) 3,964 3,244 3,308 64
Federal, State and other categorical aid - (FSOCA) 21,986 24,254 23,344 (910)
Unrestricted Federal and State aid - (UFSA) - 57 59 2
Charges for services - (CS) 2,615 2,657 2,711 54
Investment income - (II) 61 81 73 (8)
Other revenues - (OR) 1,843 2,689 2,179 (510)
Total Revenues $81,149 $84,338 $83,030 $(1,308)
$0
$5
$10
$15
$20
$25
$30
RET SUT PIT ITO OT FSOCA UFSA CS II OR
Adopted Budget Modified Budget Actual Budget
Budget and Actual - Revenues FY 2017 (in billions)
The City of New York, New York | Popular Annual Financial Report FY 2017 14

The Budget – General Fund Revenues FY 2016
General Fund Revenues (in millions) Adopted Budget
Modified Budget Actual
Better (Worse) Than
Modified Budget
Real estate taxes - (RET) $22,589 $23,120 $23,181 $61
Sales and use taxes - (SUT) 8,068 8,560 8,540 (20)
Personal income tax - (PIT) 11,154 11,454 11,392 (62)
Income taxes, other - (ITO) 6,662 7,171 6,948 (223)
Other taxes - (OT) 3,746 3,484 3,560 76
Federal, State and other categorical aid - (FSOCA) 20,766 21,963 20,898 (1,065)
Unrestricted Federal and State aid - (UFSA) - 6 6 -
Charges for services - (CS) 2,735 2,734 2,624 (110)
Investment income - (II) 29 65 79 14
Other revenues - (OR) 1,882 2,691 2,172 (519)
Total Revenues $77,631 $81,248 $79,400 $(1,848)
$0
$5
$10
$15
$20
$25
Adopted Budget Modified Budget Actual Budget
Buget and Actual - Revenues FY 2016 (in billions)
Office of the New York City Comptroller Scott M. Stringer 15

The Budget – General Fund Expenditures FY 2017
Budget and Actual – Expenditures The General Fund is the main operating fund of the City used to account for all uses of financial resources not accounted for and reported in other funds, such as the Capital Projects Fund or the Debt Services Fund. The General Fund accounts for all expenditures in the expense budget that provide for the City’s day-to-day operations. The expense budget helps management set financial goals and review actual performance against these goals.
$0
$5
$10
$15
$20
$25
GG PS E CU SS EP TS PK HG H L P JC FOBP LPDP O
Adopted Budget Modified Budget Actual
Budget and Actual - Revenues FY 2017 (in billions)
General Fund Expenditures FY 2017 (in millions) Adopted Budget
Modified Budget Actual
Better (Worse) Than Modified
Budget
General government - (GG) $3,398 $3,471 $3,247 $224 Public safety and judicial - (PS) 9,233 9,831 9,694 137 Education - (E) 23,179 23,465 23,318 147 City University - (CU) 1,042 1,114 1,067 47 Social Services - (SS) 14,281 14,817 14,485 332 Environmental protection - (EP) 3,044 2,967 2,923 44 Transportation services - (TS) 1,729 1,800 1,754 46 Parks, recreation and cultural activities - (PK) 587 610 599 11 Housing - (HG) 1,488 1,328 1,220 108 Health (including HHC) - (H) 1,813 2,271 2,233 38 Libraries - (L) 365 371 370 1 Pensions - (P) 9,310 9,283 9,281 2 Judgments and claims - (JC) 676 751 750 1 Fringe benefits and other benefit payments - (FOBP) 5,654 5,963 5,910 53
Lease payments for debt service - (LPDP) 59 30 30 - Other - (O) 2,087 269 147 122
Total Expenditures $77,945 $78,341 $77,028 $1,313
The Adopted Budget is the Mayor’s first Financial Plan issued in June of each fiscal year. The Modified Budget reflects all changes made to the budget after adoption.
The City of New York, New York | Popular Annual Financial Report FY 2017 16

The Budget – General Fund Expenditures FY 2016
$0
$5
$10
$15
$20
$25
GG PS E CU SS EP TS PK HG H L P JC FOBP LPDP O
Adopted Budget Modified Budget Actual
Budget and Actual - Revenues FY 2016 (in billions)
General Fund Expenditures FY 2016 (in millions) Adopted Budget
Modified Budget Actual
Better (Worse) Than Modified
Budget
General government - (GG) $3,267 $3,201 $2,985 $216 Public safety and judicial - (PS) 8,778 9,483 9,326 157 Education - (E) 21,894 22,374 21,974 400 City University - (CU) 978 1,003 956 47 Social Services - (SS) 14,027 13,980 13,801 179 Environmental protection - (EP) 2,748 2,796 2,569 227 Transportation services - (TS) 1,659 1,754 1,708 46 Parks, recreation and cultural activities - (PK) 525 549 534 15 Housing - (HG) 939 1,118 1,023 95 Health (including HHC) - (H) 1,673 2,712 2,666 46 Libraries - (L) 358 360 359 1 Pensions - (P) 8,643 9,173 9,171 2 Judgments and claims - (JC) 710 720 720 - Fringe benefits and other benefit payments - (FOBP) 5,310 5,692 5,512 180
Lease payments for debt service - (LPDP) 170 199 199 - Other - (O) 2,904 435 198 237
Total Revenues $74,583 $75,549 $73,701 $1,848
Office of the New York City Comptroller Scott M. Stringer 17

Discretely Presented Component Units – Revenues
Component units are legally separate organizations for which the City is financially accountable. The financial data of the following component units, which are supported by fees charged for goods or services, are presented separately (discretely) from the financial data of the primary government, which is composed of all 104that make up the City’s legally entity and its blended component units.
Discretely Presented Component Units Revenues (in millions) FY 2017 FY 2016 FY 2015
Health and Hospitals Corporation $9,706 $9,809 $8,374
Water and Sewer System 4,009 4,114 4,201
Housing Authority 3,910 3,748 3,525
Economic Development Corporation 684 914 719
Housing Development Corporation 429 429 573
All Other Discretely Presented Component Units 513 496 579
Total Revenues $19,251 $19,510 $17,971
50%
21%
20%
4%2% 3%
FY 2017
Discretely Presented Component Units Revenues
47%
23%
20%
4%3% 3%
FY 2015
50%
21%
19%
5%2% 3%
FY 2016
The City of New York, New York | Popular Annual Financial Report FY 2017 18

Discretely Presented Component Units – Expenses
Discretely Presented Component Units Expenses (in millions) FY 2017 FY 2016 FY 2015
Health and Hospitals Corporation $9,900 $9,779 $8,343
Water and Sewer System 3,686 3,510 3,912
Housing Authority 3,681 3,275 3,512
Economic Development Corporation 678 813 744
Housing Development Corporation 296 271 230
All Other Discretely Presented Component Units 450 431 447
Total Expenses $18,691 $18,079 $17,188
53%
20%
20%
4%1% 2%
FY 2017
Discretely Presented Component Units Expenses
54%
19%
18%
5%2%
2%
FY 2016
49%
23%
20%
4%1% 3%
FY 2015
Office of the New York City Comptroller Scott M. Stringer 19

Capital Projects
Twenty five agencies engage in some form of capital spending, although the City’s capital budget is largely concentrated among 13 budget agencies. Collectively these agencies accounted for approximately 97 percent of FY 2017 commitments.
Total capital commitments increased by $2.40 billion from FY 2016 to FY 2017, from $8.46 billion to $10.86 billion. Despite the increase, however, total FY 2017 commitments represented 56 percent of the FY 2017 Executive Budget, down from 57 percent in FY 2016.
The largest dollar decreases were in the City’s support to NYC Transit which dropped by $157 million from FY 2016 to $80 million, and the Department of Information Technology and Telecommunications commitments, which declined by $123.2 million from FY 2016 to $43.6 million.
Education 29%
$3,136
Environmental Protection 23%
$2,491
Transportation 15%
$1,603
Housing Preservation & Development
9%$962
Health and Hospitals2%
$202
Cultural Affairs 1%
$148
Small Business Services 3%
$342
Parks & Recreation 5%
$586
Correction 1%
$61
Information and Technology1%$44
Police 2%
$204
Citywide Administrative Services 4%
$461 Sanitation
2%$258
Other3%
$362
Actual FY 2017 Capital Commitments By Agency ($ in millions)
The City of New York, New York | Popular Annual Financial Report FY 2017 20

Unisphere at Flushing Meadows Corona Park, Flushing , New York
Photo Credit: Leonard Zhukovsky / Shutterstock.com
Benchmarks: How do we compare?
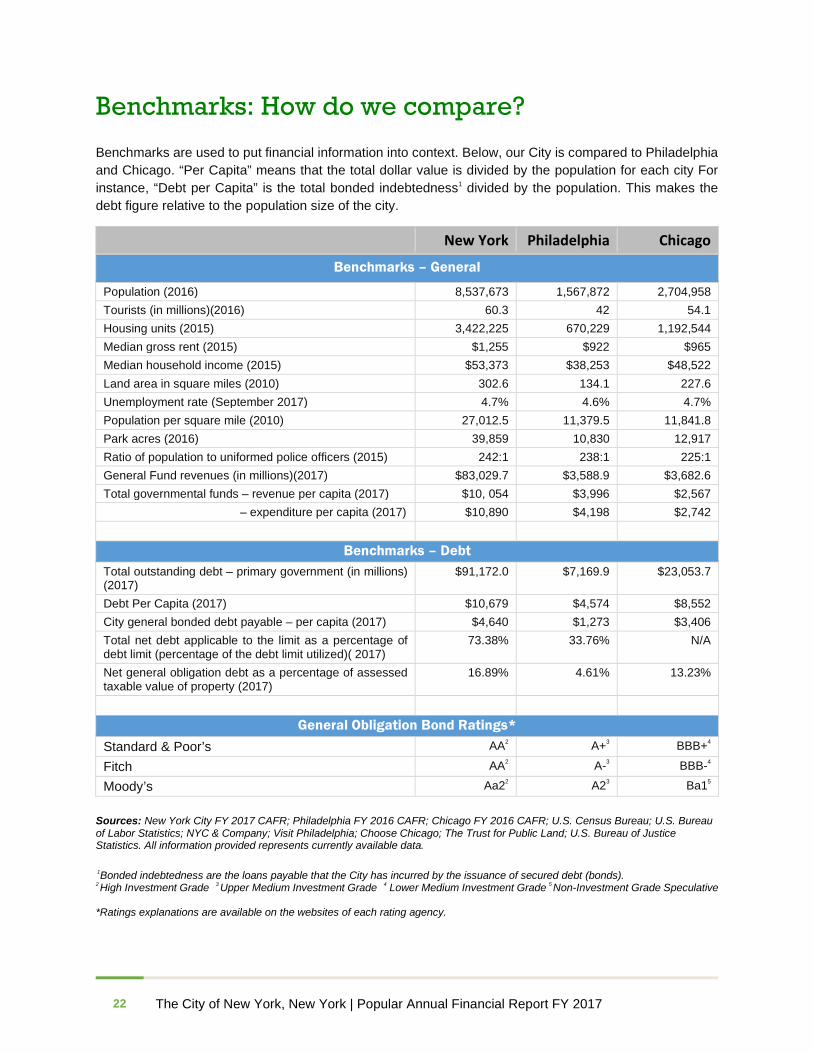
Benchmarks are used to put financial information into context. Below, our City is compared to Philadelphia and Chicago. “Per Capita” means that the total dollar value is divided by the population for each city For instance, “Debt per Capita” is the total bonded indebtedness1 divided by the population. This makes the debt figure relative to the population size of the city.
New York Philadelphia Chicago
Benchmarks – General
Population (2016) 8,537,673 1,567,872 2,704,958
Tourists (in millions)(2016) 60.3 42 54.1 Housing units (2015) 3,422,225 670,229 1,192,544
Median gross rent (2015) $1,255 $922 $965 Median household income (2015) $53,373 $38,253 $48,522 Land area in square miles (2010) 302.6 134.1 227.6
Unemployment rate (September 2017) 4.7% 4.6% 4.7%
Population per square mile (2010) 27,012.5 11,379.5 11,841.8
Park acres (2016) 39,859 10,830 12,917
Ratio of population to uniformed police officers (2015) 242:1 238:1 225:1
General Fund revenues (in millions)(2017) $83,029.7 $3,588.9 $3,682.6 Total governmental funds – revenue per capita (2017) $10, 054 $3,996 $2,567
– expenditure per capita (2017) $10,890 $4,198 $2,742
Benchmarks – Debt Total outstanding debt – primary government (in millions) (2017)
$91,172.0 $7,169.9 $23,053.7
Debt Per Capita (2017) $10,679 $4,574 $8,552 City general bonded debt payable – per capita (2017) $4,640 $1,273 $3,406 Total net debt applicable to the limit as a percentage of debt limit (percentage of the debt limit utilized)( 2017)
73.38% 33.76% N/A
Net general obligation debt as a percentage of assessed taxable value of property (2017)
16.89% 4.61% 13.23%
General Obligation Bond Ratings*
Standard & Poor’s AA2 A+3 BBB+4
Fitch AA2 A-3 BBB-4
Moody’s Aa22 A23 Ba15
Sources: New York City FY 2017 CAFR; Philadelphia FY 2016 CAFR; Chicago FY 2016 CAFR; U.S. Census Bureau; U.S. Bureau of Labor Statistics; NYC & Company; Visit Philadelphia; Choose Chicago; The Trust for Public Land; U.S. Bureau of Justice Statistics. All information provided represents currently available data.
1Bonded indebtedness are the loans payable that the City has incurred by the issuance of secured debt (bonds). 2 High Investment Grade 3 Upper Medium Investment Grade 4 Lower Medium Investment Grade 5 Non-Investment Grade Speculative
*Ratings explanations are available on the websites of each rating agency.
The City of New York, New York | Popular Annual Financial Report FY 2017 22
Borough-Wide Statistical Information
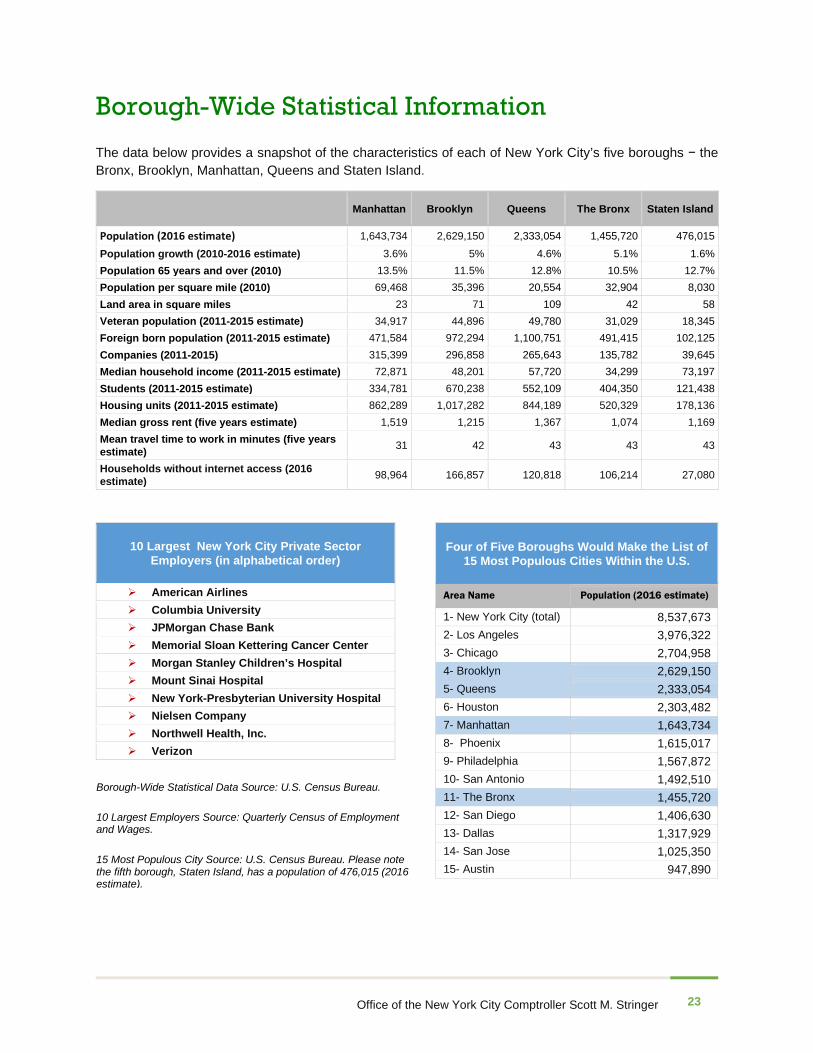
The data below provides a snapshot of the characteristics of each of New York City’s five boroughs − the Bronx, Brooklyn, Manhattan, Queens and Staten Island.
Manhattan Brooklyn Queens The Bronx Staten Island
Population (2016 estimate) 1,643,734 2,629,150 2,333,054 1,455,720 476,015 Population growth (2010-2016 estimate) 3.6% 5% 4.6% 5.1% 1.6% Population 65 years and over (2010) 13.5% 11.5% 12.8% 10.5% 12.7% Population per square mile (2010) 69,468 35,396 20,554 32,904 8,030 Land area in square miles 23 71 109 42 58 Veteran population (2011-2015 estimate) 34,917 44,896 49,780 31,029 18,345 Foreign born population (2011-2015 estimate) 471,584 972,294 1,100,751 491,415 102,125 Companies (2011-2015) 315,399 296,858 265,643 135,782 39,645 Median household income (2011-2015 estimate) 72,871 48,201 57,720 34,299 73,197 Students (2011-2015 estimate) 334,781 670,238 552,109 404,350 121,438 Housing units (2011-2015 estimate) 862,289 1,017,282 844,189 520,329 178,136 Median gross rent (five years estimate) 1,519 1,215 1,367 1,074 1,169 Mean travel time to work in minutes (five years estimate) 31 42 43 43 43
Households without internet access (2016 estimate) 98,964 166,857 120,818 106,214 27,080
10 Largest New York City Private Sector Employers (in alphabetical order)
American Airlines Columbia University JPMorgan Chase Bank Memorial Sloan Kettering Cancer Center Morgan Stanley Children’s Hospital Mount Sinai Hospital New York-Presbyterian University Hospital Nielsen Company Northwell Health, Inc. Verizon
Four of Five Boroughs Would Make the List of 15 Most Populous Cities Within the U.S.
Area Name Population (2016 estimate)
1- New York City (total) 8,537,673 2- Los Angeles 3,976,322 3- Chicago 2,704,958 4- Brooklyn 2,629,150 5- Queens 2,333,054 6- Houston 2,303,482 7- Manhattan 1,643,734 8- Phoenix 1,615,017 9- Philadelphia 1,567,872 10- San Antonio 1,492,510 11- The Bronx 1,455,720 12- San Diego 1,406,630 13- Dallas 1,317,929 14- San Jose 1,025,350 15- Austin 947,890
Borough-Wide Statistical Data Source: U.S. Census Bureau. 10 Largest Employers Source: Quarterly Census of Employment and Wages. 15 Most Populous City Source: U.S. Census Bureau. Please note the fifth borough, Staten Island, has a population of 476,015 (2016 estimate).
Office of the New York City Comptroller Scott M. Stringer 23

Our Elected Officials
Bill de Blasio Mayor
Scott M. Stringer Comptroller
Letitia James Public Advocate
Melissa Mark-Viverito Council Speaker
Jimmy Van Bramer Council Majority Leader
Steven Matteo Council Minority Leader
Ruben Diaz, Jr. Bronx Borough President
Eric L.Adams Brooklyn Borough President
Gale A. Brewer Manhattan Borough President
Melinda Katz Queens Borough President
James S. Oddo Staten Island Borough President
Darcel D. Clark Bronx District Attorney
Eric Gonzalez Acting Brooklyn District Attorney
Cyrus R. Vance, Jr. Manhattan District Attorney
Richard A. Brown Queens District Attorney
Michael E. McMahon Staten Island District Attorney
The elected officials depicted above are as of the fiscal year ended June 30, 2017
The City of New York, New York | Popular Annual Financial Report FY 2017 24
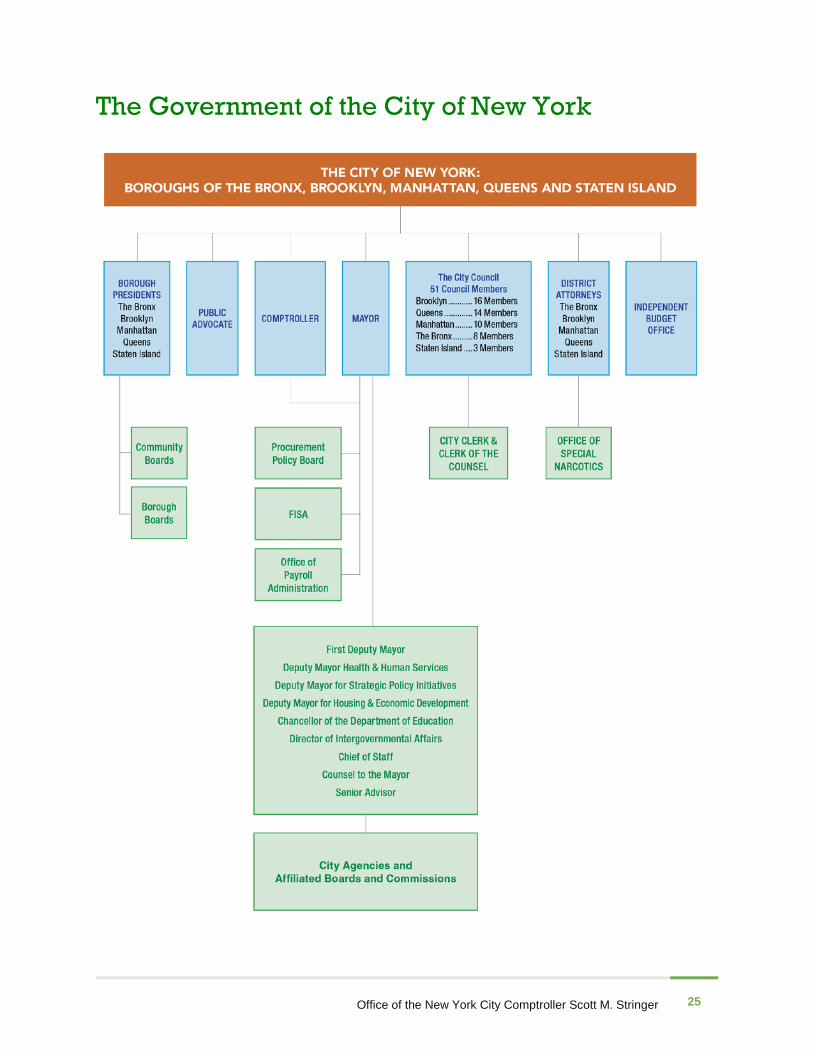
The Government of the City of New York
Office of the New York City Comptroller Scott M. Stringer 25

The City of New York, New York | Popular Annual Financial Report FY 2017 26
David N. Dinkins Building, New York, New York
Photo Credit: Sean Pavone/Shutterstock.com

Acknowledgements
Scott M. Stringer, Comptroller Bureau of Accountancy:
Preston Niblack, Acting Deputy Comptroller for Accountancy
Jacqueline Thompson, CFE, CIA, Bureau Chief
Leonel Ferreira, CPA, Division Chief of Capital, Technical and Professional Standards
Popular Annual Financial Report Developed and Prepared by:
Technical and Professional Standards Unit, Bureau of Accountancy
Susan Cornwall, CPA, Unit Head
Berta Lara, Budget Analyst
Joan Stapleton, Technical Writer/Project Coordinator
With Special Thanks to:
Bureau of Fiscal and Budget Studies Eng Kai Tan, Budget Chief Lawrence Mielnicki, Chief Economist Peter Flynn, Assistant Budget Chief
Bureau of Information Systems & Technology Michael Bott, Assistant Comptroller Troy Chen, Executive Director of App Development & Web Administration Antonnette Brumlik, Senior Web Administrator Angela Chen, Senior Web Administrator & Graphic Designer
Bureau of Policy & Research David Saltonstall, Assistant Comptroller for Policy Nichols Silbersack, Policy Analyst
Significant efforts were made by all staff of the Bureau of Accountancy and many others in the Office of the Comptroller and throughout the City to prepare the City’s FY 2017 Comprehensive Annual Financial Report, from which much of the contents of this report was adopted.
Comments or Suggestions Thank you for taking the time to learn about The City of New York’s financial strengths. If you have comments or suggestions on how we can improve the PAFR, please contact the Technical and Professional Standards Unit by email at [email protected], or by telephone at (212) 669-3675.
The David N. Dinkins Municipal Building
Office of the New York City Comptroller Scott M. Stringer 27

The City of New York, New York | Popular Annual Financial Report FY 2017 28
1 Centre Street, New York, NY 10007 • (212) 669-3500 • comptroller.nyc.gov
@NYCComptroller
NEW YORK CITY COMPTROLLER
SCOTT M. STRINGER