the chinese markets for recovered paper and plastics – an ... - 2011 update.pdf · market...
TRANSCRIPT

China as a UK trading partner
The Chinese economy Paper recycling in China Plastics recycling in China
Special Focus and Glossary Market Situation Report
page 1
forward | contents
The Chinese markets for recovered paper and plastics – an update
Market Situation Report – Spring 2011

forward | back | contents
China as a UK trading partner
The Chinese economy Paper recycling in China Plastics recycling in China
Special Focus and Glossary Market Situation Report
page 2
Market Situation Report - Spring 2011
IntroductionWelcome to the China market situation report update, part of our series of reports that examine current economic conditions in the markets for recovered materials.
We published our first China market situation report in spring 2009. This update looks at the key developments in the Chinese markets for recovered paper and plastic since that report was published, including trends in demand, prices and the balance between imported and domestically recovered material. In addition, the Special Focus explores the wide array of end uses for recovered plastics in China.
The main themes to emerge are:
� China remains the key trading partner of recovered paper and plastics for the UK;
� UK exports of recovered paper and plastic to China recovered quickly after the market disruption in late 2008. More recently, however, trends have diverged with exports of recovered paper to China falling while those of recovered plastics have continued to increase. The latter broadly mirror the trends in overall Chinese imports, with a significant decline in Chinese imports of recovered paper in 2010 contrasting with fast growth in Chinese imports of recovered plastics;
� prices of recovered paper and plastics have mostly recovered since the 2008 downturn, and many prices currently stand close to the peaks they reached in early to mid 2008;
� China’s economy seems poised for a soft landing. The economy is forecast to keep on growing at a solid, albeit slower, pace in the medium term;
� accordingly, Chinese demand for recovered materials is also expected to continue to grow;
� however, growth in Chinese demand for imported recovered materials may be somewhat slower than in recent years as its own collection and recycling systems develop.

forward | back | contents
China as a UK trading partner
The Chinese economy Paper recycling in China Plastics recycling in China
Special Focus and Glossary Market Situation Report
page 3
Market Situation Report - Spring 2011
ContentsMarket Situation Report – Spring 2011
The Chinese markets for recovered paper and plastics – an update
1. China as a UK trading partner 42. The Chinese economy 53. Paper recycling in China 5 3.1 Recent recovered paper market trends in China 5 3.1.1 Volumes 5 3.1.2 Prices 7 3.2 Looking ahead at Chinese recovered paper demand 74. Plastics recycling in China 8 4.1 Recent recovered plastics market trends in China 8 4.1.1 Volumes 8 4.1.2 Prices 10 4.2 Looking ahead at Chinese recovered plastics demand 11Special Focus: end markets for recovered plastics in China 12 Recovered plastics use by sector 12 End markets for UK materials 13 Conclusions 13Glossary 14

forward | back | contents
The Chinese economy Paper recycling in China Plastics recycling in China
Special Focus and Glossary Market Situation Report
page 4
Market Situation Report - Spring 2011
China as a UK trading partner
1. China as a UK trading partner China maintains its position as the single largest destination for UK exports of recovered plastics and paper. In the last ten years, China’s share of UK exports of recovered paper has risen from less than 10% to reach a high of 62% in 2009 before declining slightly to 61% in 2010 (Graph 1). The predominance of China as an end-market is even more marked for recovered plastics. In the last ten years, China’s share of UK exports of recovered plastics has increased from less than 60% to reach 88% in both 2009 and in 2010 (Graph 2).
UK materials account for 11%1 of the Chinese imports of recovered paper and slightly less (9%) for recovered plastics, keeping the UK significantly more reliant on China as an overseas end-market than China is reliant on the UK as a source of imported recovered paper and plastics.
The previous edition of this report was released in the wake of the period of market disruption in late 2008. Chinese markets were particularly affected as the effects of the global economic slowdown and credit crunch coincided with the end of the momentum provided by the Olympic Games. In the space of one month, UK exports to China of recovered paper and plastics fell by 40 – 45%, and prices fell even more dramatically, by up to 66% in some cases.
The period of disruption was relatively short-lived. Underlying Chinese demand for materials remained resilient, despite persisting uncertainty over global economic prospects, in part aided by the economic stimulus put in place by the Chinese government.
1. This figure underestimates the total amount originating from the UK, as it omits some of the UK materials that transit via Dutch ports.
2. The increase in UK exports of recovered paper to China in 2009 was more than offset by falls in exports to other destinations, such that total UK exports of recovered paper fell.
Chinese buyers soon returned to the market to take advantage of the low global prices for recovered materials. As a result, UK exports of recovered paper and plastics to China/Hong Kong recovered quickly, to reach 2.8 million tonnes of recovered paper2 and 628,000 tonnes of recovered plastics in 2009.
More recently, different trends have emerged for each material. Exports of recovered paper to China (2.7 million tonnes in 2010) still greatly exceed those of recovered plastic (736,000 tonnes over the same period). However, whereas exports of recovered plastics to China are still growing rapidly, exports of recovered paper to China have fallen slightly in 2010 in comparison to 2009. This reflects partly the differences in UK trends for each material: the UK recovered paper market is more mature, has far higher recovery rates and has seen levels of paper consumption, and therefore recovered paper arisings, fall in the last two years. It also reflects the difference in the pace of growth of demand in China between paper and plastics, which is explored further in the next section.
Source: HMRC
Source: HMRC
Graph 1: UK exports of recovered paper
Graph 2: UK exports of recovered plastics
2000 2001 2002 2003 2004 2005 2006 2007 2008 2009 20100
1000
2000
3000
4000
5000thousand tonnes
to other destinationsto China
thousand tonnes
to other destinationsto China/Hong Kong
0100200300400500600700800900
2000 2001 2002 2003 2004 2005 2006 2007 2008 2009 2010

forward | back | contents
China as a UK trading partner
Plastics recycling in China
Special Focus and Glossary Market Situation Report
page 5
Market Situation Report - Spring 2011
Paper recycling in ChinaThe Chinese economy
3. Paper recycling in China
3.1 Recent recovered paper market trends in China
3.1.1 VolumesBucking the global downward trend, China’s production of paper and board increased in 2009 to reach 86.4 million tonnes (Table 1). The China Paper Association reports that there has been further growth in 2010. On some measures, China has now overtaken the United States to become the world’s largest producer of paper and board.
Not all grades have benefited equally from the expansion. Production of packaging-related grades (which account for about 60% of production) and some printings and writing grades (24%) has risen. By contrast, early estimates suggested that newsprint production (about 6% of the total), which had been growing relatively slowly since 2007, started to fall in 2010, with some of the newsprint capacity being re-directed towards other grades.
The majority of China’s paper and board production (in particular, packaging-related grades and newsprint) relies heavily on recovered paper – old corrugated containers (OCC), old newspapers and magazines (ONP/OMG) and mixed paper grades – as feedstock.
Since the last edition of this report, the proportion of recycled pulp in the fibre mix used to make paper and board in China has increased slightly, from 59% to 62%, primarily at the expense of non-wood pulps.4
2. The Chinese economyOver the past three decades, Chinese economic growth has averaged around 10% a year. This has fuelled strong demand for raw materials, including recovered paper and plastics, to feed into a fast growing manufacturing sector.
Following the global economic slowdown, China appears to have achieved a soft landing, with inflation rather than economic growth the chief immediate policy concern. China now seems poised to be entering a phase of slightly slower (albeit still high by global standards) and more domestically-driven economic growth.
The International Monetary Fund forecasts GDP growth at 9.6% in 2011 and at 9.5% by 2015.3
The environmental protection sector is one of the sectors specifically earmarked for further development as part of the 2011-2015 Chinese Five Year plan, with a focus on energy-saving (a 17% reduction in energy intensity is targeted), environmental protection and recycling.
3. World Economic Outlook, IMF, October 20104. Estimates of the contribution of recovered paper based on tonnages
at the paper mill gate, rather than on percentage of the pulp mix, are higher: 67% of the fibre mix in 2009.
Million tonnes 2007 2009 Change (%)
Total paper and board production
73.5 86.4 18%
Recovered paper consumptionof which:
50.0 62.0 24%
domestic recovered paper 27.4 34.5 26%
imported recovered paper 22.6 27.5 22%
UK exports of recovered paper to China
2.5 2.8 12%
Table 1: Chinese paper sector in context
Sources: China Paper Association, RISI, HMRC, WRAP estimates

forward | back | contents
China as a UK trading partner
The Chinese economy Plastics recycling in China
Special Focus and Glossary Market Situation Report
page 6
Market Situation Report - Spring 2011
Paper recycling in China
3.1.1 Volumes Cont.However, owing to the increase in production, Chinese demand for recovered fibre has increased by almost one quarter.
This demand is met from both domestic and imported sources of recovered fibre. In 2009, China consumed around 62 million tonnes of recovered paper, 27.5 million tonnes (44%) of which was imported. This means China remains the world’s largest importer of recovered paper. The main grades imported remain OCC and ONP and the main countries imported from remain the US, Japan and the EU, in particular the UK (Graphs 3 and 4).
The proportion of China’s recovered paper consumption that was imported fell slightly between 2007 and 2009 (from 45% to 44%). It seems likely to have fallen again in 2010, with imports of recovered paper down 11%, against continued growth in overall paper and board production.
There are number of possible explanations for the decline in imports in 2010. First, there are base effects. Imports in 2009 were boosted by Chinese importers rebuilding stocks that had been run-down in late 2008 and to take advantage of the low prices that prevailed following the market downturn. A period of slightly lower imports might just reflect the unwinding of these effects. Second, there is reduced supply from some of the main exporters to China. In the UK for instance, total collections of recovered paper have fallen: by -7% in 2009 and -2% in the first eleven months of 2010. To the extent that paper consumption is on a long-term downward trend in developed economies, this trend looks set to continue.
However, the most striking factor is the substitution of imported material by paper recovered from the Chinese waste stream. Consumption of Chinese recovered paper grew more quickly than that of imported recovered paper between 2007 and 2009, and seems likely to have accelerated in 2010. One trigger for this might be Chinese paper mills’ attempts to control input costs in the face of high and rising imported paper prices. But it has been supported by some significant changes in the recovered paper supply chain (see Box 1).
Box 1: Trends in the Chinese recovered paper supply chain
One of the trends accompanying the reported increased reliance on domestically recovered paper is the streamlining of the supply chains used by the larger Chinese paper mills. With a view to secure stable resources and to reduce costs of securing feedstock, some of the larger paper mills have set up agreements/joint ventures with local collection operations to create their own supply network of domestic recovered fibre, whereby individuals will bring material to depots, from where it will be trucked to the paper mills. Market contacts report that these supply chains are getting more effective and the number of intermediaries in the chain is falling.
A separate, but related, trend is noticeable for imports, where the importance of Chinese trading companies as recipients of imported recovered paper continues to fall relative to Chinese paper mills, indicating that Chinese paper producers are trying to cut costs by directly managing the supply chain.
Source: China Customs, Business and Trade Statistics
Graph 3: Chinese imports of recovered paper by country of origin
UK
Japan
US
Netherlands
Other EU
Others
14%12%
14%11%
7%42%
Graph 4: Chinese imports of recovered paper by grade
High grades
Mixed grades
ONP
OCC
24% 58%
2%16%
Source: China Customs, Business and Trade Statistics

forward | back | contents
China as a UK trading partner
Plastics recycling in China
Special Focus and Glossary Market Situation Report
page 7
Market Situation Report - Spring 2011
Paper recycling in China
The Chinese economy
3.1.2 PricesThe demand and supply trends above are reflected in prices. By the end of 2010, Chinese prices for mixed paper grades and OCC had returned close to (and, in some cases, exceeded) their pre-2008 downturn levels. Moreover, consistent with the reports that demand for US OCC was stronger than that for OCC from other countries, prices for US OCC into China were significantly higher than those for European and Japanese OCC (Graph 5).
By contrast, more sluggish demand from the newsprint sector was reflected in Chinese ONP prices, which by end-2010 remained some 15%-20% below the pre-2008 downturn level.
3.2 Looking ahead at Chinese recovered paper demandThe level of consumption of paper per head in China is rising (60kg in 2008, 64kg in 2009) but remains well below current levels of consumption in advanced economies (e.g. 266kg in the US in 2008). Taken in conjunction with forecasts for continued, albeit slower, growth in the Chinese economy, this suggests that there is scope for continued growth in the Chinese paper sector.
This view is reflected in a wave of recent, and planned, capacity expansions, although some of this growth may be offset by capacity closures, either enforced by the government on grounds of pollution, safety or energy inefficiency, or because some mills cannot compete or cannot afford to invest to improve their environmental performance to meet new standards.
The containerboard market, in particular, is expected to grow strongly. Based on already- announced capacity expansion plans, pulp and paper information provider RISI estimate that China will add over 13 million tonnes of new containerboard capacity between 2010 and 2012.
By 2015, Pöyry forecast that Chinese paper producers could be using around 81 million tonnes of recovered paper, and close to 98 million tonnes by 2020 – a more than 50% increase on current levels.5 Despite the growth in production, Pöyry expect demand for imports of recovered fibre to remain at broadly the same level as currently owing to an increase in domestic paper recovery. However, some market commentators envisage even stronger growth in paper and board output, and potentially more scope for growth in imports.
The supply of domestic recovered fibre is expected to be boosted by a number of factors: rising paper consumption, waste management legislation and government support for recycling, and expectations of continued strong demand from paper mills; all of which will help to spur increases in paper recovery.
Already, the recovery rate has increased from 34% in 2006 to 40% in 2009. Pöyry forecast that the recovery rate will continue to grow over the next ten years, to reach 52% by 2020.
With paper and board consumption forecast at 135 million tonnes by 2020, this means a supply of 70 million tonnes of domestically recovered paper. This would mean that China might satisfy 72% of its demand with local material.
Graph 5: China’s OCC import prices
Source: www.chinapaperonline.com
0
50
100
150
200
250
300
USA JapanEurope
2006 2007 2008 2009 2010 2011
US$/tonne
5. Source: Pöyry Management Consulting (London) Ltd, management consultants in the pulp and paper supply chain.
forward | back | contents
China as a UK trading partner
The Chinese economy Paper recycling in China Special Focus and Glossary Market Situation Report
page 8
Market Situation Report - Spring 2011
Plastics recycling in China
4. Plastics recycling in China
4.1 Recent recovered plastics market trends in China
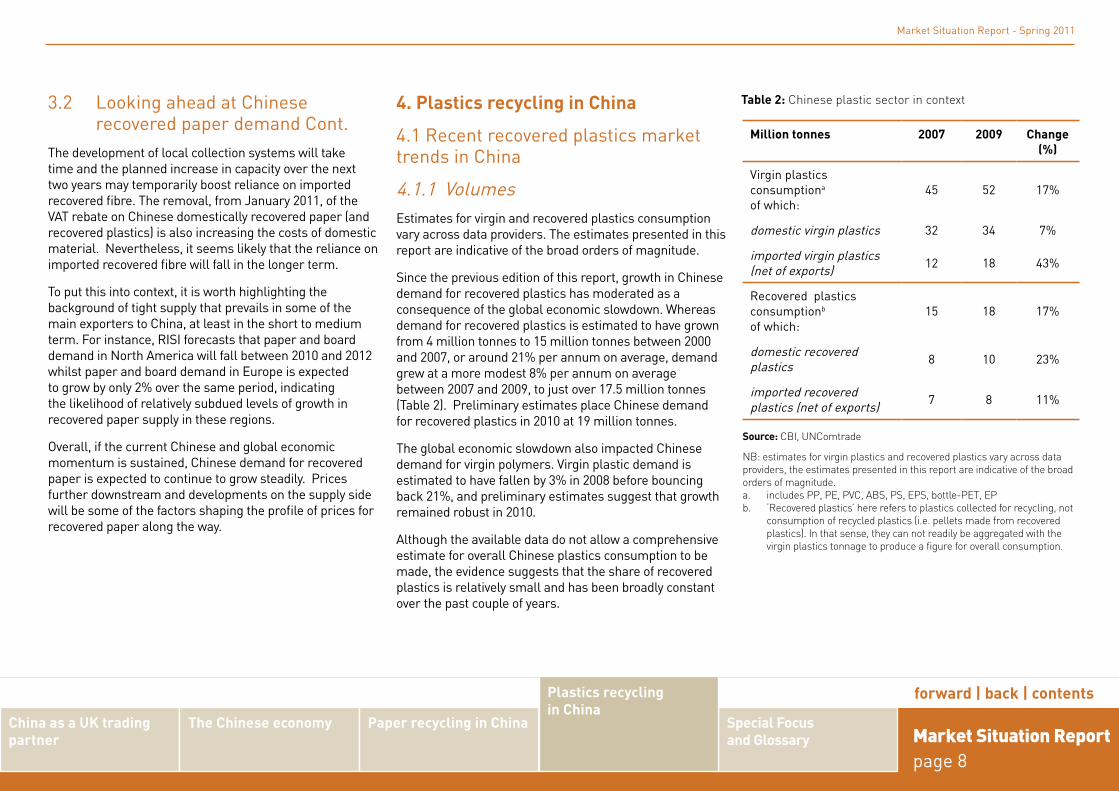
4.1.1 VolumesEstimates for virgin and recovered plastics consumption vary across data providers. The estimates presented in this report are indicative of the broad orders of magnitude.
Since the previous edition of this report, growth in Chinese demand for recovered plastics has moderated as a consequence of the global economic slowdown. Whereas demand for recovered plastics is estimated to have grown from 4 million tonnes to 15 million tonnes between 2000 and 2007, or around 21% per annum on average, demand grew at a more modest 8% per annum on average between 2007 and 2009, to just over 17.5 million tonnes (Table 2). Preliminary estimates place Chinese demand for recovered plastics in 2010 at 19 million tonnes.
The global economic slowdown also impacted Chinese demand for virgin polymers. Virgin plastic demand is estimated to have fallen by 3% in 2008 before bouncing back 21%, and preliminary estimates suggest that growth remained robust in 2010.
Although the available data do not allow a comprehensive estimate for overall Chinese plastics consumption to be made, the evidence suggests that the share of recovered plastics is relatively small and has been broadly constant over the past couple of years.
3.2 Looking ahead at Chinese recovered paper demand Cont.The development of local collection systems will take time and the planned increase in capacity over the next two years may temporarily boost reliance on imported recovered fibre. The removal, from January 2011, of the VAT rebate on Chinese domestically recovered paper (and recovered plastics) is also increasing the costs of domestic material. Nevertheless, it seems likely that the reliance on imported recovered fibre will fall in the longer term.
To put this into context, it is worth highlighting the background of tight supply that prevails in some of the main exporters to China, at least in the short to medium term. For instance, RISI forecasts that paper and board demand in North America will fall between 2010 and 2012 whilst paper and board demand in Europe is expected to grow by only 2% over the same period, indicating the likelihood of relatively subdued levels of growth in recovered paper supply in these regions.
Overall, if the current Chinese and global economic momentum is sustained, Chinese demand for recovered paper is expected to continue to grow steadily. Prices further downstream and developments on the supply side will be some of the factors shaping the profile of prices for recovered paper along the way.
Million tonnes 2007 2009 Change (%)
Virgin plastics consumptiona
of which:45 52 17%
domestic virgin plastics 32 34 7%
imported virgin plastics (net of exports) 12 18 43%
Recovered plastics consumptionb
of which:15 18 17%
domestic recovered plastics 8 10 23%
imported recovered plastics (net of exports) 7 8 11%
Table 2: Chinese plastic sector in context
Source: CBI, UNComtrade
NB: estimates for virgin plastics and recovered plastics vary across data providers, the estimates presented in this report are indicative of the broad orders of magnitude.a. includes PP, PE, PVC, ABS, PS, EPS, bottle-PET, EPb. ‘Recovered plastics’ here refers to plastics collected for recycling, not
consumption of recycled plastics (i.e. pellets made from recovered plastics). In that sense, they can not readily be aggregated with the virgin plastics tonnage to produce a figure for overall consumption.

forward | back | contents
China as a UK trading partner
The Chinese economy Paper recycling in China Special Focus and Glossary Market Situation Report
page 9
Market Situation Report - Spring 2011
Plastics recycling in China
4.1.1 Volumes Cont.Recovered plastics are used in a wide range of sectors including packaging, construction, home appliances, everyday plastic items6, agriculture, equipment and machinery, transport and textiles. These applications are explored in more detail in the Special Focus.
In 2009, it is estimated that around 45% of the recovered plastics consumed in China were imported. The main exporters of recovered plastics to China remain the US, Japan, Germany and the UK (Graph 6).
Imports continued to grow between 2007 and 2009 (Graph 7), although much more slowly than in the first part of the decade. However, the data suggest that the proportion of China’s recovered plastics consumption that was imported has not increased – a trend similar to that seen for paper.7 As with paper, one key explanation for this lies in the development in domestic collection systems which, coupled with higher consumption of plastics, is leading to increased supply of domestic recovered plastics (see Box 2).
The primary route for UK exports of recovered plastics to China remains via Hong Kong, however the proportion of UK exports travelling via this route has declined in recent years. In 2010, 66% of UK recovered plastics exports to China were via Hong Kong, compared with 73% in 2009 and 79% on average in the last ten years. There are various possible contributory factors, including adverse relative logistics costs for Hong Kong relative to some mainland ports (e.g. higher shipping costs). Market contacts also reported strong demand for agricultural film in the north west of China in 2010 as well as a developing trend for traders to expand their businesses to ports
6. Such as basins, plates, trays, buckets, hangers.7. Source: CBI. The numbers are from a different source from those
presented in our previous report and differ slightly but are of a similar magnitude.
Graph 7: China consumption of recovered plastics
Source: CBI China
2007 2008 2009 2010 (est.)
million tonnes
Imports (net of exports) Domestic
0
5
10
15
20
25
Graph 6: World exports of recovered plastics to China and Hong Kong, 2009
Source: UNComtrade
Others
Belgium
UK
Germany
Japan
US
15%19%
24%
9%4%
29%
further north in mainland China, in response to higher demand outside the southern areas typically served via Hong Kong.
Hong Kong, with faster customs clearance and less stringent requirements, is a popular route in for some of the other main exporters to China too, albeit to a much lesser extent. Looking forward, recent provisions to legitimatise imports of whole (rather than broken into pieces as was previously required) recovered PET bottles direct into mainland China may lead to a decline in the proportion of recovered PET bottles imported via Hong Kong. However, Hong Kong is expected to remain a significant route into China overall. Other recent developments in Chinese regulation and import controls are outlined in Box 3 (Page 11).

forward | back | contents
China as a UK trading partner
The Chinese economy Paper recycling in China Special Focus and Glossary Market Situation Report
page 10
Market Situation Report - Spring 2011
Plastics recycling in China
4.1.2 PricesThe upward pressure from strong demand from China is visible in the level of prices for recovered plastics in the UK, where domestic buyers compete with Chinese buyers for supplies. Strong demand, in conjunction with tight supply, and rising prices for virgin plastics (and cotton for which polyester fibre spun from rPET is a substitute) have driven prices for many grades near (in some cases above)
Box 2: Recovered plastics collection in China
There is relatively little in the way of official recycling statistics in China. However, the available data suggest the domestic plastics recycling rate is between 25% and 30%.8 The recovery rate is likely to increase in the future given the government’s commitment to developing recycling in its next Five-Year Plan.
In contrast to collection systems in countries like the UK which might focus on particular types of plastics, such as plastic bottles or packaging, a wide range of plastics are recovered in China. Recovered plastics from households can consist of packaging, bags, bottles, basins and buckets, toys, shoes, appliances, etc.
Recovered plastics from commercial and industrial sources include bags and buckets used in petrochemical industries, containers and waste synthetic fibres used in the textile industry, packaging from the appliances industry, pipes and plates from the construction sector, and films from the agriculture sector. The latter are typically preferred over recovered plastics from households, mostly for being cleaner and more readily reprocessed.
Recovered plastics are typically taken to salvage stations by households or private collectors, although some salvage stations also operate their own collections. Recycling companies then sort the plastics, for instance by polymer type and colour, and clean the materials. The recycling company then sells the material to reprocessors. Most recycling companies are small scale private companies focusing on regional businesses. However, the largest organisation is the state-owned China Recycling Development Company Ltd, which owns some 2,000 salvage stations, 32 sorting and cleaning centres, mostly in coastal provinces.
The government has taken a number of steps in the last few years to develop and standardise collection systems. Several ‘notifications ’ that set out guidelines, objectives, and fundamental principles for China’s waste material collection system development have been published, with pilot programmes announced in some municipalities. However, progress is hindered by the high degree of fragmentation of the industry.
Graph 8: UK prices for recovered plastic
Source: WRAP Materials Pricing Report
Graph 9: RPET prices (China domestic)
Source: PCI PET Packaging Resin & Recycling
Natural HDPE BottlesMixed HDPE BottlesClear PET Bottles
LDPE 98:2 Film
£ per tonne
050
100150200250300350
Coloured PET Bottles
2008 2009 2010 2011
Baled bottles (clear) - delivered
US$ per tonne
Post consumer flake (clear) - ex works
0200400600800
1000120014001600
2007 2008 2009 2010
8. Sources include a 2007 ‘notification’ on waste collection systems and CPPIA (2008).
their pre-autumn 2008 downturn level (Graph 8). Similarly, China’s own prices for recovered plastics have rebounded steadily (Graph 9).

forward | back | contents
China as a UK trading partner
The Chinese economy Paper recycling in ChinaMarket Situation Report page 11
Market Situation Report - Spring 2011
Plastics recycling in China
Special Focus and Glossary
4.2 Looking ahead at Chinese recovered plastics demandDemand for plastics is expected to grow strongly over the next five to ten years, in line with strong growth in the economy. CBI China forecasts that China’s demand for recovered plastic could reach 29 million tonnes by 2015, 65% more than in 2009 (equivalent to compound average annual growth of 8.7%).
High and rising demand for recovered plastics, together with the implementation of the government’s plans for localised pilot programmes for standardised collection and reprocessing schemes, is expected to provide momentum for domestic collection and an increase in the plastics recovery rate.
This, coupled with rising plastics consumption, is expected to yield fast growing supplies of domestic recovered plastics, which are forecast to reach more than 18 million tonnes by 2015, or 64% of Chinese demand for recovered plastics. Imports would remain a significant part of the supply mix and are expected to grow, but at a slower pace, to around 10.5 million tonnes.
Although a strong growth forecast, this estimate is significantly lower than that presented in our previous report. The revision reflects expectations for slower growth in the Chinese economy over the forecast horizon and the repercussions from the global economic downturn on the anticipated profile for Chinese demand for virgin and recovered plastics.
Box 3. Regulatory background
Anecdotally, the market perception is that China’s import controls have been tightening. Part of what seems to be happening is that where gaps exist between the published regulations and their implementation in practice, the authorities have been releasing more detailed measures to clarify the requirements. In that sense, measures and their implementation are typically becoming tighter. Moreover, as the focus on environment-related issues strengthens, this trend is likely to continue for the foreseeable future.
In the last few years, there have been several concrete signs of this trend, including: the announcement of bans on imports of some types of plastics (2008), stricter implementation requirements under the AQSIQ license for domestic importers (2009), for instance adding a requirement for compulsory field inspection for domestic importers, instead of spot checks, and increased requirements on the level of detail to be provided in the customs import declaration (2010). The examination and approval of import volumes under the SEPA-license approval process have also become stricter in order to deter reprocessors from applying for volumes larger than they can reprocess and selling the excess to unlicensed reprocessors.
The authorities have also increased the requirements on plastic reprocessors with regards to the qualifications of technicians, the equipment and technology related to the treatment of waste water, and energy consumption. Large reprocessors that are able to meet the national standards are encouraged by the authorities whereas some of the smaller outfits that do not meet environmental standards are required to shut down.

forward | back | contents
China as a UK trading partner
The Chinese economy Paper recycling in China Plastics recycling in China Market Situation Report
page 12
Market Situation Report - Spring 2011
Special Focus and Glossary
Special Focus: end markets for recovered plastics in ChinaThe main section of this report showed the continuing strong growth in Chinese demand for recovered plastics. This special focus explores the end uses of these recovered plastics.9 The lack of official statistics and fragmented nature of the sector complicate any analysis of the Chinese plastics reprocessing industry. This report uses existing data, interviews with industry experts and end-users in each sector to derive a broad overall picture, but there remain uncertainties in the data. Notwithstanding these caveats, what emerges is a vast range of applications for a variety of polymers across different sectors. There is a broad range of potential end markets in China, and strong competition for supplies of both domestic and imported recovered plastics.
Recovered plastics use by sector
Chinese demand for recovered plastics is spread across seven main sectors of the economy, with the top three, packaging, construction and appliances, accounting for three quarters of total demand (Graph 10). Estimates of the relative sizes of end-markets vary across data providers. For instance, there are different estimates of the balance of end uses of rPET between textiles and other applications, notably bottles; and some sources suggest that the proportion of recovered plastics used in textiles could be significantly higher than that shown in the graph, and packaging, accordingly, lower.
Packaging
The packaging sector accounts for over 40% of the demand for recovered plastics in China, mainly for use in the production of bottles and bags.
For bottles, most of the demand is for polyethylene (PE), which is typically used to make bottles (such as for shampoo and detergent or for industrial oil). RPET, until recently, was almost exclusively used in fibre applications, but its use in packaging is now growing.
For bags, rPE is used, but much of the demand is for polypropylene (PP), which is used to make cement bags and fertiliser bags.
Recovered plastics are also used to make plastic boxes (using rPE and rPP) and plastic salvers (using rPE).
Construction
Construction, which has been a fast growing sector in China, is the second largest user of recovered plastics, accounting for an estimated 20% of demand, mostly to make pipes and boards.
The main recovered polymer used for pipes is rPVC, but small amounts of rPE and rPP are also used. Drainage pipes are made using an estimated 60-70% recycled content, chiefly to make the external surface of the pipe while the internal surface uses virgin plastic to ensure tightness. Sewage pipes are made using up to 100% recycled content. The recycled content of other types of pipes, such as water supply or telecoms is significantly lower.
Extruded polystyrene (XPS) board, which is used as insulating material for walls, flat concrete roofs and steel roofs, is made using up to 90% recycled content (mostly rEPS as well as a small proportion of rPS).
Other applications in the construction sector include the use of rPE (up to 80% recycled content) to make waterproof
Graph 10: Recovered plastics demand by sector
Source: CBI China
OthersTextileTransportAgricultureEveryday itemsApplianceConstructionPackaging
43%
1%2%4%
20%
14%
8%9%
9. The sector breakdown and estimates in this section were commissioned by WRAP from CBI China, Research and Consulting.

forward | back | contents
China as a UK trading partner
The Chinese economy Paper recycling in China Plastics recycling in China Market Situation Report
page 13
Market Situation Report - Spring 2011
Special Focus and Glossary
film used to protect construction sites from the weather. Recovered PVC is also used to make the core (the surface layer is made from virgin plastic) of window and door profiles.
There are some newer applications too, such as wood-plastic composite which incorporates some recycled plastic content such as rPE and rPP and is processed into handrails, stairs and floors for outdoor decoration. Recovered plastics are also in demand to make aluminium composite panel, a type of decorative construction material.
Electrical and electronic appliances
The electrical appliances sector is the third largest user of recovered plastics, accounting for an estimated 14% of demand. Television shells, audio shells and computer peripherals (such as keyboards and mice) – all of which use rABS and rPS – are some of the key end-applications. Other uses include parts of fridges as well as the inner, non-visible components of some small appliances. The recycled content varies significantly, with items destined for the Chinese domestic market (or nearby Asian markets) typically having a higher recycled contents for than those destined for European/American markets.
Other applications
A wide range of recovered plastics are used to make everyday items, accounting for an estimated 9% of demand. The main raw materials are rPE, rPP, rPS and rPVC, which are used to make hangers, disposable items such as toothbrushes and combs, shoe material, plastic casks, low-end jewellery cases, and advertisement boards.
The agriculture sector accounts for 8% of demand for recovered plastics, in particular rPE, which is used to make mulch and greenhouse films (eg black greenhouse films,
such as those used to cultivate mushrooms). Other uses include water-supply pipes for agricultural irrigation use.
Other sectors using recovered plastics include transportation (4% of demand), textiles (2% of demand) and other sectors (the remainder, less than 1%). Recovered plastics are used in a variety of applications in these sectors, including automotive parts, non-woven fabrics used as pulp filters by the paper industry and fibre padding for toys.
End markets for UK materials
An indicative polymer breakdown of the recovered plastics exported from the UK to China (including Hong Kong) can be obtained from UK customs data. This suggests that UK exports to China primarily comprise recovered PE (63%) and ‘other plastics’ (28%).10 Other polymers separately identified include PS (7%), PP (2%), and PVC (1%).
Based on this, the end applications for UK recovered plastics in China can vary significantly. In addition, market participants noted that the characteristics of a country’s material will influence its specific application. However, the data and market feedback suggest that the main end uses are likely to include packaging (bottles, bags), pipes for the construction sector, greenhouse and mulch films for the agriculture sector.
Conclusions
It is impossible to track the specific end market applications for every consignment of recovered plastic sent to China for recycling. However, the available evidence suggests that there is strong Chinese demand for the full range of polymers exported from the UK. The sector analysis above shows that there is a wide array of end-uses for recovered plastics in China, the vast majority of which are displacing
the use of virgin polymer. It also appears that the main uses of recovered plastics are for the Chinese domestic market, linking future demand to growth in China.
10. Based on data from January 2008 – September 2010.

forward | back | contents
China as a UK trading partner
The Chinese economy Paper recycling in China Plastics recycling in China Market Situation Report
page 14
Market Situation Report - Spring 2011
Special Focus and Glossary
Glossary
ABS Acrylonitrile-butadiene-styrene
AQSIQ General Administration of Quality Supervision, Inspection and Quarantine
CPPIA China Plastic Processing Industry Association
EP Engineering plastic, e.g. polycarbonate (PC), Polyamide (PA), polyester
EPS Expanded polystyrene e.g. moulded white protective packaging for goods
OCC Old corrugated containers
ONP/OMG Old newspapers and magazines
PE Polyethylene e.g. high density polyethylene (HDPE) milk bottles
PET Polyethylene terephthalate e.g. soft drink bottles
PP Polypropylene e.g. margarine tubs
PS Polystyrene e.g. yogurt pots
PVC Polyvinyl chloride e.g. pipes, fittings
rPE / rPET etc. Recovered polyethylene / recovered PET etc.
SEPA State Environmental Protection Administration
XPS Extruded polystyrene

For more information
WRAP has launched a series of market situation reports providing in-depth information on the latest economic trends and developments facing the UK’s recycling industry.
Please visit www.wrap.org.uk/msr
Waste & Resources Action Programme
The Old Academy21 Horse FairBanbury, Oxon OX16 0AH
Tel: 01295 819 900Fax: 01295 819 911E-mail: [email protected]
Helpline freephone0808 100 2040www.wrap.org.uk
While steps have been taken to ensure its accuracy, WRAP cannot accept responsibility or be held liable to any person for any loss or damage arising out of or in connection with this information being inaccurate, incomplete or misleading. This material is copyrighted. It may be reproduced free of charge subject to the material being accurate and not used in a misleading context. The source of the material must be identified and the copyright status acknowledged. This material must not be used to endorse or used to suggest WRAP’s endorsement of a commercial product or service. For more details, please refer to our Terms & Conditions on our website – www.wrap.org.uk
back | contents