the changing world of network rail simon kirby, managing director infrastructure projects
TRANSCRIPT
The changing world of Network Rail
Simon Kirby, Managing Director Infrastructure Projects

Rail remains a growth industry
Passenger Journeys Since 1999-00
800
900
1,000
1,100
1,200
1,300
1,400
1999-00 2000-01 2001-02 2002-03 2003-04 2004-05 2005-06 2006-07 2007-08 2008-09 2009-10 2010-11
Year
No
of
Pas
sen
ger
s
Source: ORR, National Rail Trends, 2011
This compares to less than 10% for UK Air and Road over the same period

Record passenger numbers and reduced costs
Controllable OM&R costs vs passenger journeys
800
900
1,000
1,100
1,200
1,300
1,400
2002/03 2003/04 2004/05 2005/06 2006/07 2007/08 2008/09 2009/10 2010/11
Jou
rney
s
4,000
4,500
5,000
5,500
6,000
6,500
7,000
7,500
8,000
8,500
Co
sts
£m
Passenger Journeys Costs
Source: ORR, National Rail Trends, 2011; and Network Rail, 2011

A fundamentally different company in 2012
• Devolved route business units aligned with our customers
• National Centre
• A separate projects business working in collaboration with our supply chain
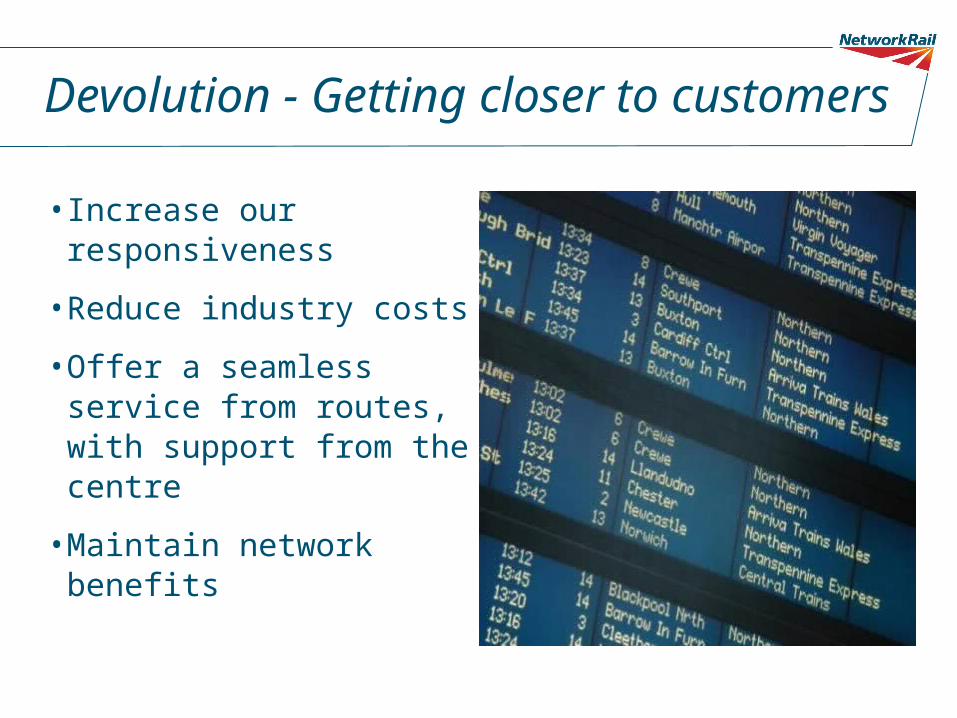
Devolution - Getting closer to customers
• Increase our responsiveness
• Reduce industry costs
• Offer a seamless service from routes, with support from the centre
• Maintain network benefits
Train image

National Centre - Milton Keynes

A separate projects business working in collaboration with our supply chain

Our aims
• Achieve lower unit costs/ greater
innovation
• A more open project market
• Greater / earlier supply chain engagement
and partnering
• Improve workforce safety
• Increase customer focus
• Wider pipeline of work income

Steve FeatherstoneProgrammeDirectorTrack
Ian IcetonHead of HR
•SCO•NE•EGIP
•Anglia•Kent•Sussex•Wessex•Platform Ext
•LNW•East Mid•BGP•Kings Cross
•Crossrail•Reading•Western•Wales•Electrification
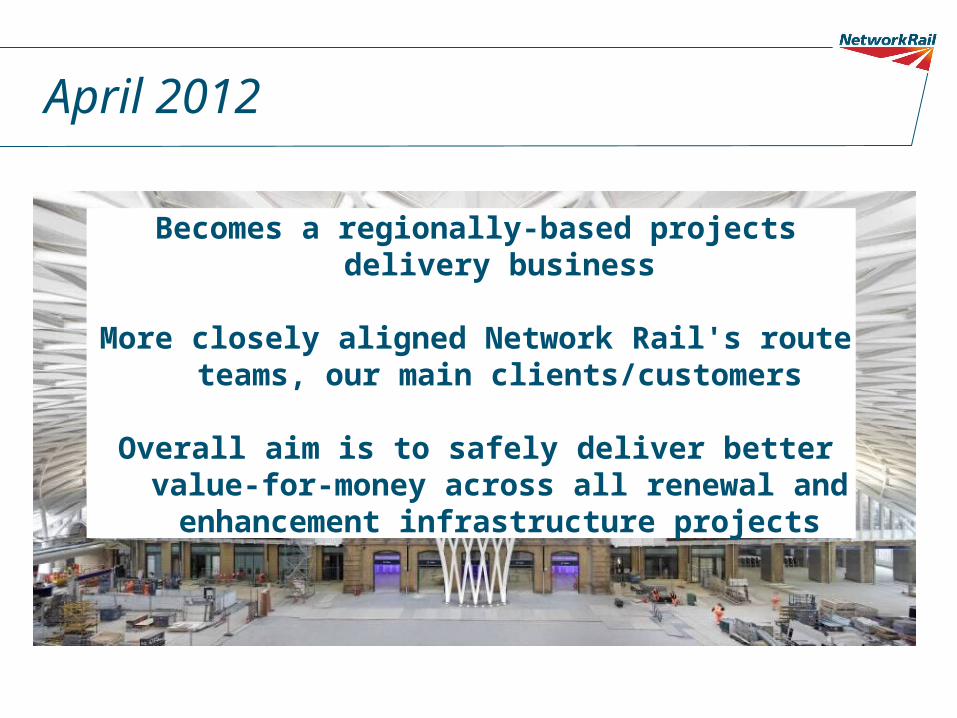
April 2012
Becomes a regionally-based projects delivery business
More closely aligned Network Rail's route teams, our main clients/customers
Overall aim is to safely deliver better value-for-money across all renewal and enhancement
infrastructure projects

Summer 2012
Pilot projects will examine the best way to open up our projects to competition and enable Network
Rail to further develop client capability

April 2013
IP becomes a subsidiary company of Network Rail able to forge new relationships with other (non-
Network Rail) clients
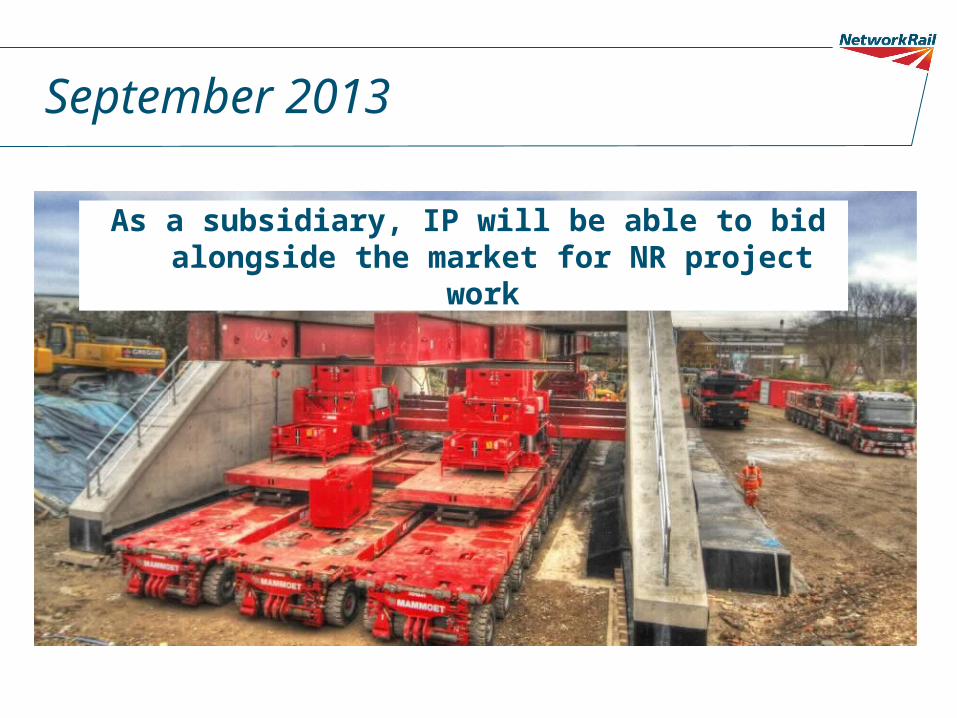
September 2013
As a subsidiary, IP will be able to bid alongside the market for NR project work
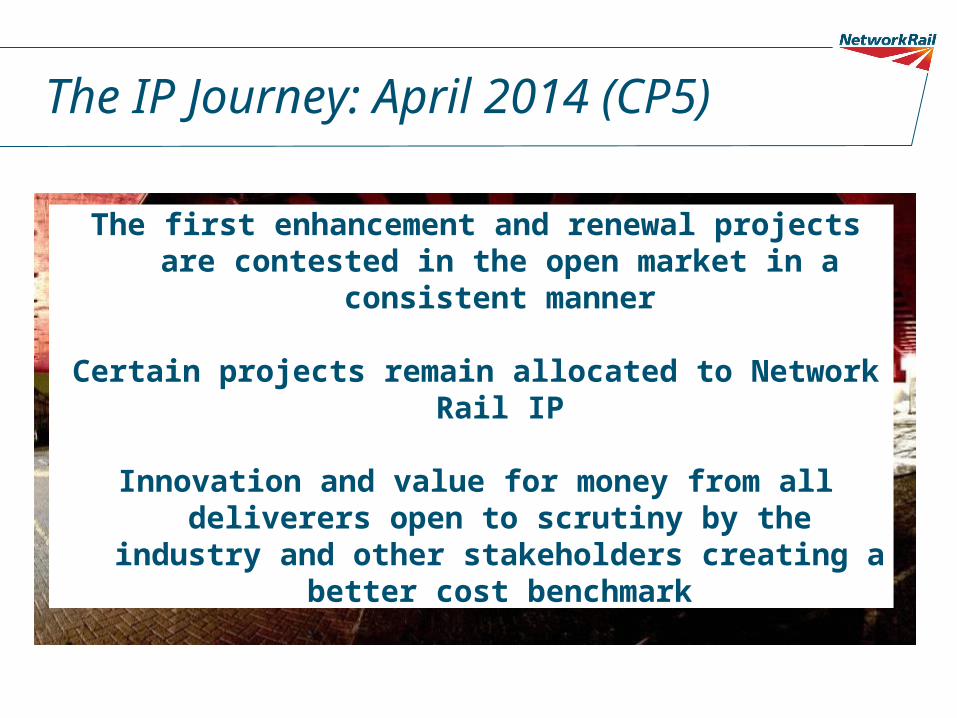
The IP Journey: April 2014 (CP5)
The first enhancement and renewal projects are contested in the open market in a consistent manner
Certain projects remain allocated to Network Rail IP
Innovation and value for money from all deliverers open to scrutiny by the industry and other stakeholders
creating a better cost benchmark
15
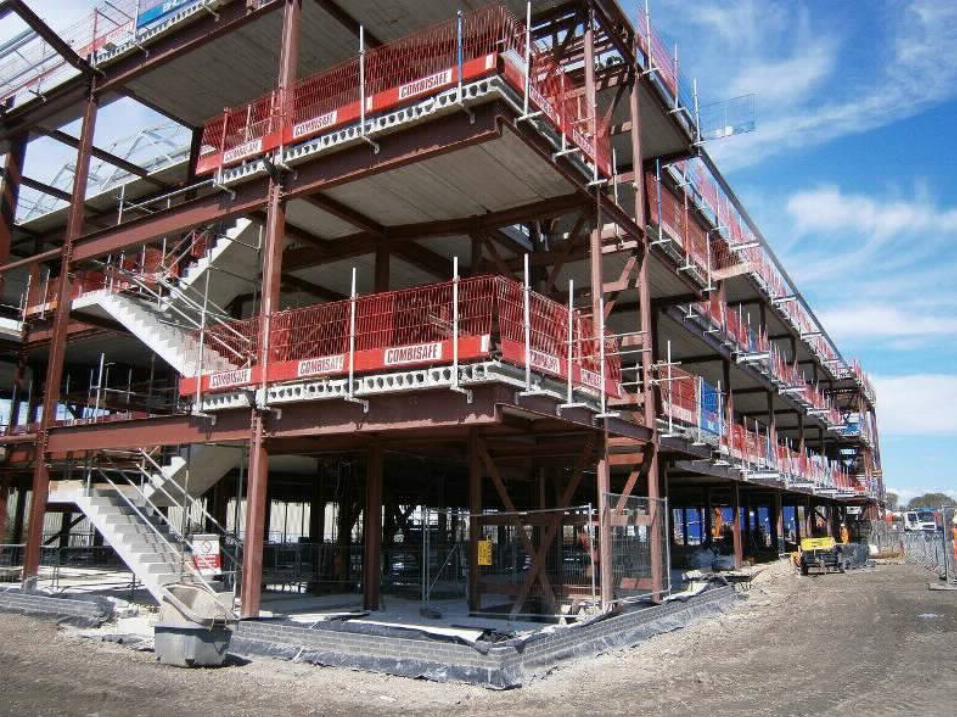
Collaborative working

Collaborative working - BS11000
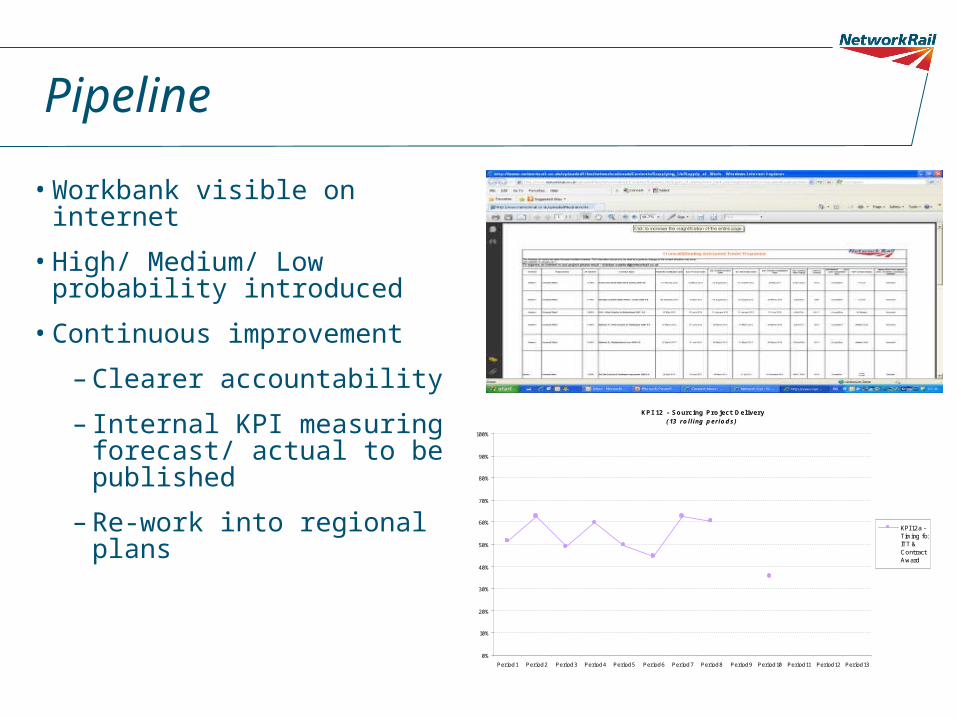
Pipeline
• Workbank visible on internet
• High/ Medium/ Low probability introduced
• Continuous improvement
– Clearer accountability
– Internal KPI measuring forecast/ actual to be published
– Re-work into regional plans
KPI 12 - Sourcing Project Delivery(13 rolling periods)
0%
10%
20%
30%
40%
50%
60%
70%
80%
90%
100%
Period 1 Period 2 Period 3 Period 4 Period 5 Period 6 Period 7 Period 8 Period 9 Period 10 Period 11 Period 12 Period 13
KPI 12a -Timing forITT &ContractAward

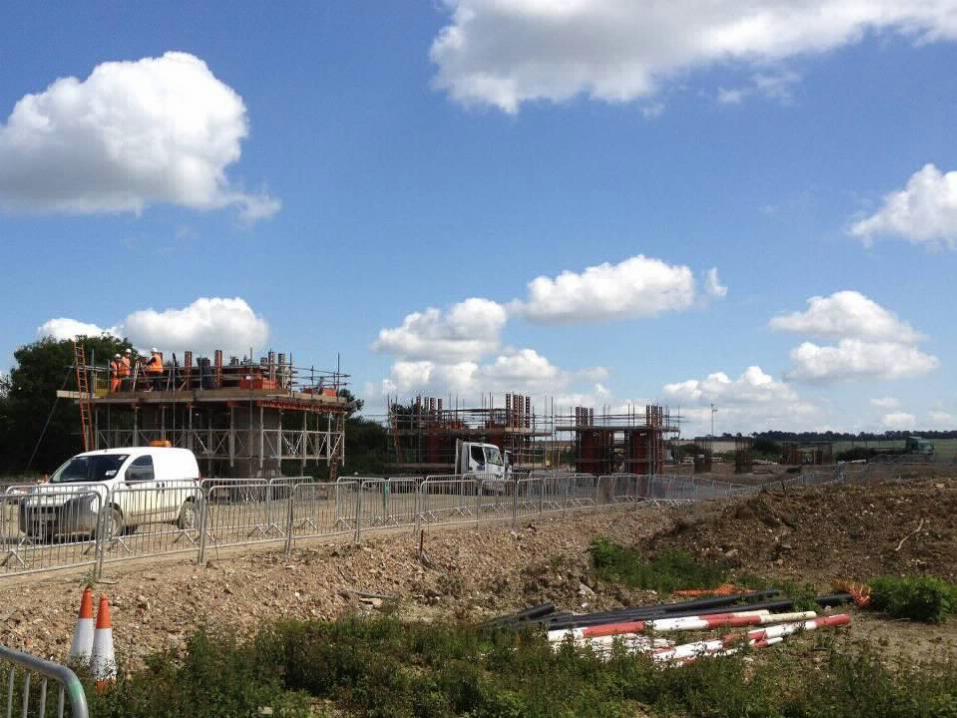
Aligned objectives drive innovation
Westbury Lane

© Ipsos MORI
19
Overall satisfaction
* = No. of respondent answers. Base for 2010= 64 respondents, 2011 = 72 respondents, 2012 = 70 respondents. Mean score calculated from 1-5 where 1 = very dissatisfied and 5 = very satisfied
Mean score
3.81
3.11
3.60
Taking into account all of your experiences with Network Rail over the past 12 months as a whole, how satisfied or dissatisfied are you with Network Rail?
Satisfaction continues to improve; the proportion who are dissatisfied is now below the benchmark target of 15%
Date 00.00.00 Presentation title to go here 2020

Building on strong delivery

Project performance is on plan
200
250
300
350
400
450
500
550
Cum Act/F.c 265 310 342 364 381 407 419 430 452 478 496 543
Cum Baseline 242 304 338 363 379 403 417 423 436 481 498 543
Prior Pds Current Pd Q4 Q1 Q2 Q3 Q4 Q1 Q2 Q3 Q4 Future
Jan 09 - Q2 2012 2011/12 2012/13 2013/14 Years
Sep-11 - ---------------------------------------------- FORECAST TO GO (CP4) ---------------------------------------------------- CP5

New King’s Cross Western Concourse opened 18th March

King’s Cross

King’s Cross

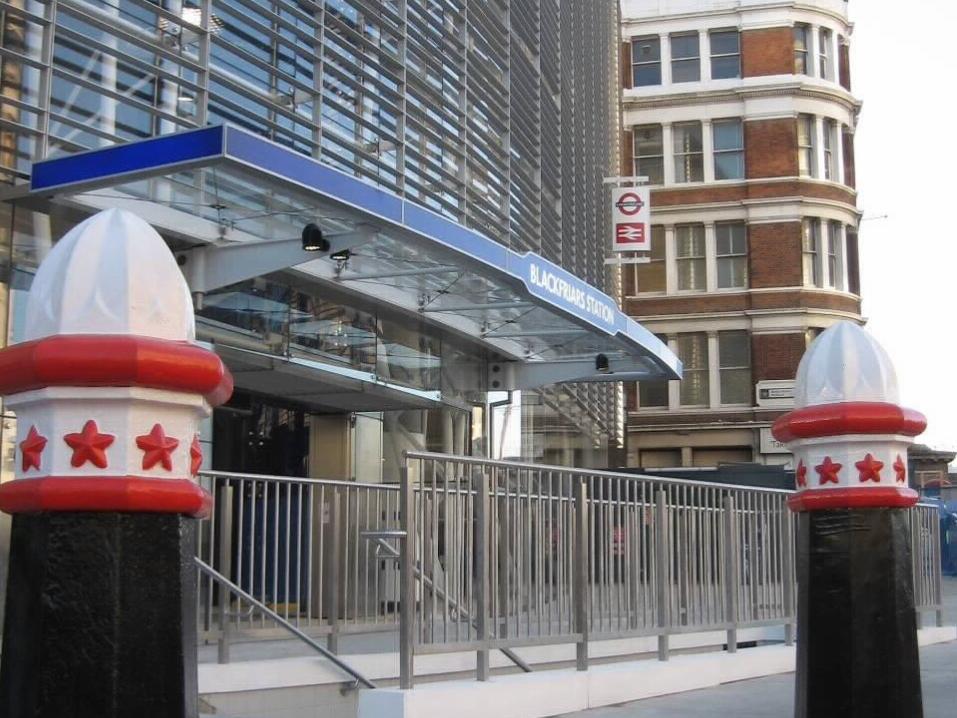

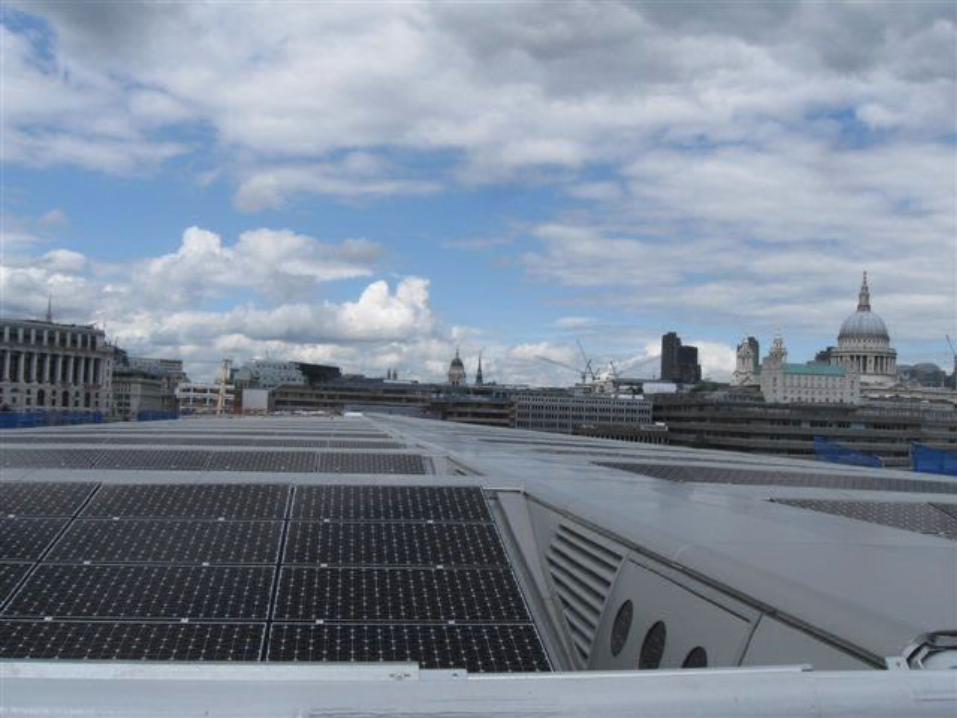
Blackfriars – PV cells

Date 00.00.00 Presentation title to go here 31

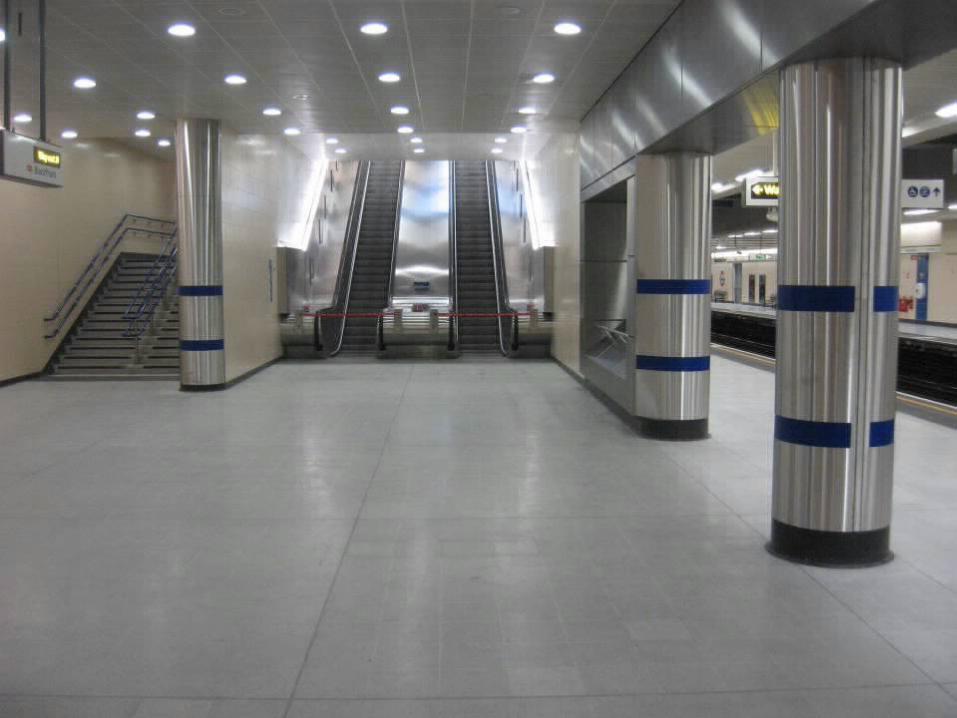
Integrated Ticket Hall – Concourse


Key Output 1 achieved, 10th December 2011


Waverley - West side Glazing view from below

Good progress on FTN/GSM-R
90.4% Complete 2934 sites
GSM-R ConstructionFTN Construction
98.4% Complete14,591 Km
NW Cornor

Reading Station Area Redevelopment

Hitchin
Three Bridges ROC (Rail Operating Centre) in Sussex


Salisbury to Exeter old and new signalling
Simon Kirby, Managing Director Infrastructure Projects
The changing world of Network Rail