the changing credit landscape: what it … changing credit landscape: what it means for originations...
TRANSCRIPT

Volume 2, Issue 5May, 2017© 2017 Strategic Mortgage Finance Group, LLC. All Rights Reserved.
FEATURING THE CHANGING CREDIT LANDSCAPE: WHAT IT MEANS FOR ORIGINATIONS

I’m welcoming you to May’s edition of STRATMOR Insights from the warm climate of Clearwater, Florida. I flew in from my home in Denver on Friday, May 19th, for a few days of “R&R.” My plan to get out of Denver turned into a big “IF” on Thursday given the big snowstorm that dumped more than a foot of snow on us. Who can explain it?
WELCOME
2©2017 by Strategic Mortgage Finance Group, LLC. All Rights Reserved.
IN THIS ISSUE
May, 2017
In-Focus .......................................................... 3The Changing Credit Landscape: What It Means For Originations
Mortgage Metrics Matter .............................. 7Document Preparation
In The Spotlight ............................................ 10Digital Mortgage: Benefits and Barriers
Speaking Borrower Satisfaction ................ 15National Satisfaction Index Plus Topic of the Month: Does Size Matter?
And who can explain the changing credit landscape better than our Senior Advisor Rob Chrisman who, in this month’s In-Focus feature article, discusses loosening credit underwriting standards and what this means for originations. If you’re counting on a significant origination lift from looser credit, you should give Rob’s piece a read.
In our Mortgage Metrics Matters section, we present results from our 2016 Technology Insights Survey dealing with Document Preparation, in particular, the extent to which lenders use the document generation capability of their LOS system versus a third-party solution.
The results of our March Spotlight survey addressing lender adoption and views of Digital Mortgage are now available. To give you a sense of these results, in this month’s In The Spotlight section, we review lender responses to the perceived benefits of and barriers to Digital Mortgage adoption.
The detailed report also includes the level of adoption of 28 unique digital capabilities and segregates results by Banks vs. Independents and Large vs. Mid-Size lenders. To purchase the report, click here: https://www.stratmorprograms.com/SLDigitalMtg.
This month’s Speaking Borrower Satisfaction section reports that April’s National Borrower Satisfaction Index for MortgageSAT lenders held steady at the February and March scores of 91, despite entering the peak homebuying season. And the Topic of the Month looks at the data relevant to the question of whether lender size matters as regards borrower satisfaction. You might be surprised!
Lisa Springer, CEO

3
THE CHANGING CREDIT LANDSCAPE: WHAT IT MEANS FOR ORIGINATIONS By Rob Chrisman
The vast majority of lenders will tell you that credit underwriting standards were too loose ten to fifteen years ago. Loans were made to people who did not deserve to obtain credit, and investors purchased loans given to those borrowers. Does that mean that credit standards were “too tight” prior to the early 2000s? What have credit guidelines, using credit scores as a proxy, done in the intervening years, and will the credit agency changes this summer help lenders? And most importantly, is the residential lending industry heading back to guidelines that make experienced loan officers shake their heads in disbelief? In this piece, I will try to shed some light on these questions and look at the changing credit landscape.
In-Focus
The Five Cs of Underwriting But first, a refresher in underwriting a loan. Some adhere to the “5 Cs” while others reduce this to the “3 Cs.” Components of the 5 Cs are:
Capacity: Defined as the ability to make monthly payments based on earnings, occupation, employment history and stability, opportunities for the future, age, educational background and training for the position he currently holds.
Character: The borrower’s willingness to make the monthly payments, or the ability to handle debt. When going over the borrower’s credit history,
underwriters won’t be looking for isolated problems as much as for a pattern of timely payments according to the agreed-upon terms.
Capital: The borrower’s liquid assets, including the cash for a down payment and closing costs, as well as reserves to make the initial payments or later payments if there is an interruption in income.
Collateral: The value of the property, verified by a third party.
Compliance: Whether or not the loan meets the lender’s eligibility standards?
REGISTER for STRATMOR InsightsMay, 2017

FICO Scores..................................................................................................................................................................................................................................................
760
750
740
730
720
710
700
690
680
670
Bank Lenders (Including CUs)
Non-Bank Lenders
All Lenders
2006
719
710
715
720
700
711
725
710
716
748
730
740
754
730
744
751
735
744
751
740
745
744
736
739
740
725
732
741
720
730
743
719
729
2007 2008 2009 2010 2011 2012 2013 2014 2015 2016
4
In-FocusTHE CHANGING CREDIT LANDSCAPE: WHAT IT MEANS FOR ORIGINATIONS
REGISTER for STRATMOR Insights
As mentioned on the preceding page, some lenders will stress three of these components: credit, capacity, and collateral.
FICO Scores Although it has many detractors, Fair Isaac’s FICO (Fair Isaac Co.) score has become a standard measure of credit worthiness. There are five elements of the FICO score which pretty much incorporate the 3 Cs: payment history (35%), amount of debt (30%), length of credit history (15%), new credit (10%) and credit mix (10%).
With reference to the chart below, STRATMOR data shows significant increases in FICO credit scores from 2009 to 2012, followed by a material decline in 2013 through 2016. Can we claim that the reason is lenders lowering standards within the Ability to Repay framework? Or that all the good borrowers refinanced or bought homes, and lenders are therefore left with borrowers of lesser credit quality?
STRATMOR’s experience with lenders of varying types and sizes suggests the latter explanation. More generally, as the industry experiences slower growth due to demographics, affordability, smaller family size, smaller homes, later marriages, higher health care costs, slower immigration, etc., looser underwriting standards (with higher prices) will be a source of growth and a way for lenders to “feed the beast.” In other words, lenders are adjusting guidelines to suit borrowers with an eye towards filling their lending capacity.
Even if the loan falls outside one lender’s standards, it may meet another’s. Also, for a higher rate or different terms, the lender might make the loan anyway.
5
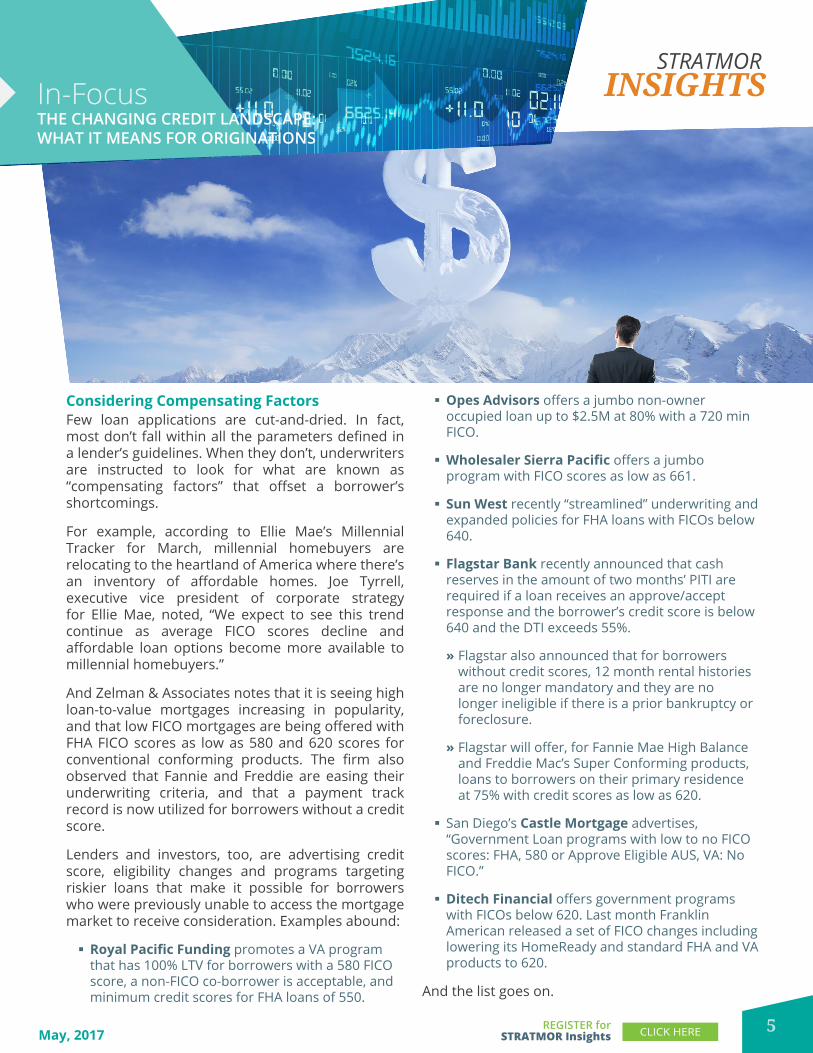
Considering Compensating FactorsFew loan applications are cut-and-dried. In fact, most don’t fall within all the parameters defined in a lender’s guidelines. When they don’t, underwriters are instructed to look for what are known as “compensating factors” that offset a borrower’s shortcomings.
For example, according to Ellie Mae’s Millennial Tracker for March, millennial homebuyers are relocating to the heartland of America where there’s an inventory of affordable homes. Joe Tyrrell, executive vice president of corporate strategy for Ellie Mae, noted, “We expect to see this trend continue as average FICO scores decline and affordable loan options become more available to millennial homebuyers.”
And Zelman & Associates notes that it is seeing high loan-to-value mortgages increasing in popularity, and that low FICO mortgages are being offered with FHA FICO scores as low as 580 and 620 scores for conventional conforming products. The firm also observed that Fannie and Freddie are easing their underwriting criteria, and that a payment track record is now utilized for borrowers without a credit score.
Lenders and investors, too, are advertising credit score, eligibility changes and programs targeting riskier loans that make it possible for borrowers who were previously unable to access the mortgage market to receive consideration. Examples abound:
§ Royal Pacific Funding promotes a VA program that has 100% LTV for borrowers with a 580 FICO score, a non-FICO co-borrower is acceptable, and minimum credit scores for FHA loans of 550.
§ Opes Advisors offers a jumbo non-owner occupied loan up to $2.5M at 80% with a 720 min FICO.
§ Wholesaler Sierra Pacific offers a jumbo program with FICO scores as low as 661.
§ Sun West recently “streamlined” underwriting and expanded policies for FHA loans with FICOs below 640.
§ Flagstar Bank recently announced that cash reserves in the amount of two months’ PITI are required if a loan receives an approve/accept response and the borrower’s credit score is below 640 and the DTI exceeds 55%.
» Flagstar also announced that for borrowers without credit scores, 12 month rental histories are no longer mandatory and they are no longer ineligible if there is a prior bankruptcy or foreclosure.
» Flagstar will offer, for Fannie Mae High Balance and Freddie Mac’s Super Conforming products, loans to borrowers on their primary residence at 75% with credit scores as low as 620.
§ San Diego’s Castle Mortgage advertises, “Government Loan programs with low to no FICO scores: FHA, 580 or Approve Eligible AUS, VA: No FICO.”
§ Ditech Financial offers government programs with FICOs below 620. Last month Franklin American released a set of FICO changes including lowering its HomeReady and standard FHA and VA products to 620.
And the list goes on.
REGISTER for STRATMOR InsightsMay, 2017
In-FocusTHE CHANGING CREDIT LANDSCAPE: WHAT IT MEANS FOR ORIGINATIONS

To contact Rob Chrisman for more information, click here. n
LEARN MORE
6
So we see that lenders are effectively loosening underwriting standards — lower FICO scores and easier eligibility requirements — in ways that will expand the pool of eligible borrowers. At the same time, credit bureaus are adopting changes in credit reports that are expected to improve the credit scores of riskier borrowers, thereby bringing more borrowers up into acceptable credit score ranges.
July 1st Credit Report ChangesFollowing a Consumer Financial Protection Bureau (CFPB) review, the Consumer Data Industry Association, a trade organization that represents the three nationwide credit reporting agencies, announced a plan that seeks to enhance the accuracy of credit reports. Credit reporting agencies have teamed up to enhance accuracy in reporting. In particular, they will be removing medical collections that have been paid, tax liens and civil judgments starting July 1st.
Pre-recession — back in 2005 to 2007 — originations with credit scores below 660 (a threshold FICO eligibility score for many lenders) accounted for about one-fifth of overall lending activity. Currently, however, the level remains at an historic low level of only about eight percent, notwithstanding steady improvement in the labor market and gradual increase in wage and salary growth.
A study done by the Urban Institute (UI), titled, Comparing Credit Profiles of American Renters and Owners, showed that there were 67 million consumers with a debt collection in 2015, and 33 million with a negative public record. More than half of reported debt collections are associated with medical bills.
For both debt categories (debt collections and negative public record), over the past 16 years, the largest group of consumers — accounting for more than 40 percent for each component — was renters without a mortgage, a group that has a median age of 30 and is the largest group of potential homeowners. This suggests that a systemic increase in their credit scores after the July 1 credit report changes, which could push many such consumers over the 650-660 FICO score eligibility threshold and begin to unleash first-time homebuyer demand.
What Does It Mean For Originations?And thus we find that credit reporting companies will improve credit scores this summer — perhaps by as much as 40 points — and that some lenders are moving down the credit curve for selected products at certain LTVs. But will these developments boost mortgage originations? Will they be enough to provide a “shot in the arm” for originators?
Unfortunately, they probably will not boost mortgage originations, at least in the near-to-mid-term. Originators have told STRATMOR staff that housing constraints are a bigger impediment to volumes than a lack of borrowers. So despite credit score movements, the housing market still faces exceptionally tight levels of inventories, lack of raw land near city centers, insufficient number of finished lots, and the lack of an available pool of construction workers. And the fabled millennials — young adult renters — tend to live in more expensive markets along the coasts where affordability remains a challenge to own a home.
May, 2017
In-FocusTHE CHANGING CREDIT LANDSCAPE: WHAT IT MEANS FOR ORIGINATIONS
REGISTER for STRATMOR Insights
7
Mortgage Metrics Matter
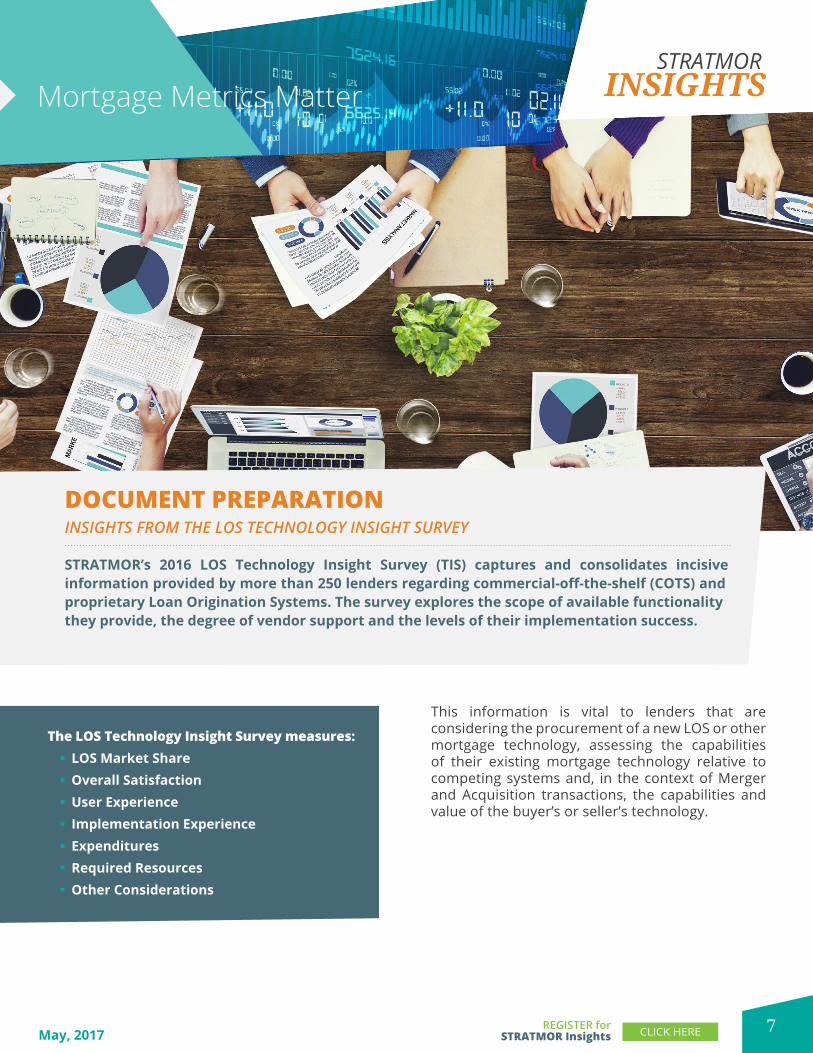
This information is vital to lenders that are considering the procurement of a new LOS or other mortgage technology, assessing the capabilities of their existing mortgage technology relative to competing systems and, in the context of Merger and Acquisition transactions, the capabilities and value of the buyer’s or seller’s technology.
DOCUMENT PREPARATION INSIGHTS FROM THE LOS TECHNOLOGY INSIGHT SURVEY
STRATMOR’s 2016 LOS Technology Insight Survey (TIS) captures and consolidates incisive information provided by more than 250 lenders regarding commercial-off-the-shelf (COTS) and proprietary Loan Origination Systems. The survey explores the scope of available functionality they provide, the degree of vendor support and the levels of their implementation success.
REGISTER for STRATMOR InsightsMay, 2017
The LOS Technology Insight Survey measures:§ LOS Market Share§ Overall Satisfaction§ User Experience§ Implementation Experience§ Expenditures§ Required Resources§ Other Considerations

8
Mortgage Metrics MatterLOS TECHNOLOGY INSIGHT SURVEY
Excerpts from the 2016 TIS Results
§ 23 percent of lenders use both native document generation and a third-party solution. Here, still, the native capabilities are not comprehensive or robust enough to meet the lender’s needs.
§ 45 percent (just under half) of lenders use one or more vendor solutions for document generation.
§ For the group of lenders using a third-party solution, 10 percent use multiple vendors. When asked why multiple vendors are used, the majority cite coverage of loan programs/loan types.
We did not ask whether lenders would prefer more robust document capabilities built into their LOS, but it is not hard to assume that if the LOS provided a robust document solution, the lenders would use it. This appears to be an area where an LOS could distinguish itself in the market. Overall, the assessment of document vendors was generally favorable. This may indicate that the market is providing adequate solutions and that lender are indifferent to the vendor of document generation software.
REGISTER for STRATMOR InsightsMay, 2017
-
The short answer is no. Less than one-third of the lenders who responded to the TIS reported that they exclusively used the document generation system provided by their LOS vendor. That means that two-thirds of the lenders do not have an LOS that provides document generation capabilities that fully meets their document needs.
Q
A
Do lenders use the document preparation built into their LOS?
Technology Insight Survey, 2016. ©STRATMOR Group, 2017.
Loan Document Generation..............................................................................................................................
Both native generation
and third-party
solution23%
The native documentgeneration capability
provided by your LOS
32%
One or more thirdparty
document preparation
providers45%

The 2017 STRATMOR LOS Technology Insight Survey is open now for participation and includes expanded questions on LOS Vendor support as well as lender opinions on cybersecurity. Don’t miss your chance to be part of the industry’s most important and comprehensive study of mortgage technology. To take the survey, click here. n
PARTICIPATE IN THE SURVEY NOW
9
Mortgage Metrics MatterLOS TECHNOLOGY INSIGHT SURVEY
According to the STRATMOR TIS, 85 percent of the lenders who use a third-party vendor use one of the following four vendors: DocMagic, IDS, Wolters Kluwer or DocuTech.
Q
A
Which third-party document providers are lenders using?
§ Within the survey, there were 18 unique document providers reported in use by over 200 lenders. (Lenders who exclusively use the LOS native functionality did not answer this question.)
§ Despite the large number of vendors within the space, the market share is highly concentrated with these four vendors.
§ DocMagic® was by far and away the market leader with 39 percent.
REGISTER for STRATMOR InsightsMay, 2017
If you are interested in learning what document preparation vendors are used by lenders on your LOS, or how lenders rate the functionality of the document preparation vendors, the 2016 STRATMOR Technology Insight Report is available for purchase here.
Technology Insight Survey, 2016. ©STRATMOR Group, 2017.
LOS TECHNOLOGY INSIGHT SURVEY
Doc Prep Vendor Market Share...........................................................................................................................................................
DocMagic®
IDS - idsDOC®
Wolter Kluwer -VMP® or Expere
DocuTech -ConformX®
All Others
39.1%
18.3%%
14.9%
12.9%
14.9%

ABOUT THE SURVEYThe STRATMOR Spotlight Survey addressing Digital Mortgage, including perceived benefits and barriers to adoption, was launched March 7, 2017, and remained open until April 25, 2017.
72 lenders participated (34 independents, 38 banks). Responses represented all production channels.
10
DIGITAL MORTGAGE: BENEFITS AND BARRIERSIn early March, STRATMOR launched a Spotlight survey addressing lender adoption of Digital Mortgage. Seventy-three lenders responded, offering their views on the many features and components of Digital Mortgage, the perceived benefits, and barriers to adoption. In this month’s In The Spotlight, we review lender responses to benefits and barriers questions.
In The Spotlight
REGISTER for STRATMOR InsightsMay, 2017

11
What are the biggest benefits your company expects from adoption of Digital Mortgage?
Both Banks and Independent lenders gave the highest scores (the combined percentage of those ranking a benefit either Very High or High) to the following:
Q
A
In The SpotlightDIGITAL MORTGAGE: BENEFITS AND BARRIERS
§ Increased Borrower Satisfaction (93%)
§ Faster Cycle Times (93%)
§ Increased Transparency for Borrowers (90%)
§ Greater Task, Service Orders and Workflow Automation (90%)
§ Competitive Differentiator (78%)
§ Based on the percentage of lenders ranking a benefit as Very High, the top three benefits — for which Banks and Independents gave almost identical Very High scores of about 53 percent — all involve aspects of customer service. This suggests that, first and foremost, lenders view Digital Mortgage as a big advance in improving the borrower’s experience.
§ Conversely, based on the percentage of lenders ranking a benefit as Very High, Banks and Independents had divergent perceptions of two Digital Mortgage benefits: 1) Greater Task, Service Orders and Workflow Automation, and 2) Competitive Differentiator.
REGISTER for STRATMOR InsightsMay, 2017
STRATMOR Spotlight Survey, 2016. ©STRATMOR Group, 2017.
45%47%
49%
47%47%
46%
92%93%
94%
47%45%
43%
42%45%
49%
89%90%91%
39%33%
26%
45%58%71%
84%90%
97%
34%40%
45%
39%38%
47%
74%78%
92%
55%53%
51%
37% 92%93%
94%40%
43%
COMPETITIVE DIFFERENTIATOR
GREATER TASK, SERVICE ORDERS ANDWORKFLOW AUTOMATION
INCREASED TRANSPARENCY FOR BORROWERS
FASTER CYCLE TIMES
INCREASED BORROWER SATISFACTION
Bank (38) All Lenders (73) Independent (35)
Very High High
Perceived Benefits of Digital Mortgage - Top 5
% Very High and High.........................................................................................................................................................................................................................................................................

In The Spotlight
12REGISTER for STRATMOR InsightsMay, 2017
DIGITAL MORTGAGE: BENEFITS AND BARRIERS
» In the first case, Banks had a significantly higher perception of the benefits than Independents. Banks registered a Very High score of 39 percent for Greater Task, Service Orders and Workflow Automation versus 26 percent for Independents.
» In the second case, Competitive Differentiator was scored Very High by 45 percent of Independent respondents versus 34 percent by Banks.
In regards to the Competitive Differentiator benefit, our own view is that at some point in time virtually every lender will have incorporated Digital Mortgage technology into their processes; and thus, it will cease to be a source of competitive differentiation. And, being an early Digital Mortgage adopter may result in long-lasting market share gains.
INTERNAL IT DEVELOPMENT CAPABILITIES
COMPLIANCE AND RISH PROCESSES
COSTS
DIFFICULTY OF GETTING LO’S TO CHANGE PROCESSES AND BEHAVIOR
SYSTEM VENDOR INTEGRATION REQUIREMENTS
Bank (38) All Lenders (73) Independent (35)
A Major Barrier A Moderate Barrier
37%
37%37%
18%16%
14%
8%
18%29%
21%19%
17%
26%23%
20%
39%41%
43%
50%48%
46%
63%
53%43%
45%55%
66%
37% 74%73%71%
63%71%
80%
71%71%71%
71%67%
63%
66%64%
63%
36%34%
Perceived Barriers of Digital Mortgage - Top 5
% Major Barrier and Moderate Barrier.........................................................................................................................................................................................................................................................................
STRATMOR Spotlight Survey, 2016. ©STRATMOR Group, 2017.

In The Spotlight
What are the largest barriers your company faces as to the adoption of Digital Mortgage?
Banks and Independents identified the following perceived barriers (major and moderate):
§ System and Vendor Integration Requirements (73%) § Difficulty of Getting LOs to Change Processes and Behavior (71%) § Costs (71%) § Compliance and Risk Approval Process (67%) § Internal IT Development Capabilities (64%)
Q
A
13REGISTER for STRATMOR InsightsMay, 2017
§ Thirty-seven percent of both Bank and Independent respondents cited System and Vendor Integration Requirements as a major barrier, far higher than the other barriers cited. This suggests that for both LOS and Digital Mortgage application vendors, there is an opportunity to capture more of the market by easing the difficulties of system integration.
§ Only 63 percent of Bank versus 80 percent of Independent respondents saw Getting LOs to Change Processes and Behavior as a major or moderate barrier. This reflects the long-standing cultural difference between Bank and Independent LOs. Whereas Bank LOs tend to see themselves as employees, LOs at Independents often see themselves as entrepreneurs.
§ Also interesting — albeit not surprising — is that costs are more of a major issue for Independents than for Banks. Only 8 percent of Bank respondents cite costs as a major barrier versus 29 percent of Independents.
» Generally speaking, Banks will have a stronger capital base than Independents and can simply afford more.
» Conversely, Banks see internal IT Development Capabilities as a higher barrier than do Independents. Often, Bank mortgage operations must compete with other Bank business units for the attention of a centralized IT capability whereas Independents have their own IT function.
DIGITAL MORTGAGE: BENEFITS AND BARRIERS

In The Spotlight
14
The complete survey results for the 2017 Digital Mortgage Survey are available for purchase and download at click here. n
Find Out What Your Peers Are Doing About Key Industry IssuesDo you wish you could quickly find out what your peers at other lenders think about key issues and developments? And what actions they are considering, planning or have taken? If so, then you should consider participating in our STRATMOR Spotlight Surveys program, a fast turnaround, short survey program that gives senior mortgage executives a unique way to obtain the information they need to formulate effective strategy. Click here to learn more.
REGISTER for STRATMOR InsightsMay, 2017
DIGITAL MORTGAGE: BENEFITS AND BARRIERS
PARTICIPATE IN THE SURVEY NOW
For further details on the perceived benefits and barriers to adoption of Digital Mortgage, purchase the full results report. The detailed report also includes the level of adoption of 28 unique digital capabilities and segregates results by Banks vs. Independents and Large vs. Mid-Size lenders. To purchase the report, click here.

15
OVERVIEWEach month’s edition of STRATMOR Insights includes a Speaking Borrower Satisfaction section containing a National Borrower Satisfaction Index plus a Topic of The Month based on data collected by STRATMOR’s MortgageSAT Borrower Satisfaction Program.
Speaking Borrower Satisfaction
National Borrower Satisfaction IndexThe National Borrower Satisfaction Index Chart below displays the Total Borrower Satisfaction Score for MortgageSAT participating lenders over a 12 month look-back period — starting the look-back with the April 2017 satisfaction score for this May 2017 edition of STRATMOR Insights.
Borrower Satisfaction Remained Steady Satisfaction dropped during the Holiday season in late 2016. We opined at the time that this two point satisfaction decline resulted from back-office staff taking time-off during the holidays and speculated that satisfaction would recover by February 2017. In fact, the satisfaction score bounced back from 88 in December 2016 to 89 in January 2017 and jumped an additional point to reach 91 in February 2017 and March 2017.
As we move deeper into the 2017 home buying season that began in March, we would typically expect loan applications to
REGISTER for STRATMOR InsightsMay, 2017
12-Month Satisfaction History..........................................................................................................................................................................................
92
91
90
89
88
87
86
Satisfaction
May,2016
90 89 89 90 90 90 90 88 89 91 91 91
June,2016
July,2016
Aug,2016
Sept,2016
Oct,2016
Nov,2016
Dec,2016
Jan,2017
Feb,2017
March,2017
April,2017
MortgageSAT, April 2017 ©STRATMOR Group, 2017.

16
increase, putting greater demands on fulfillment operations, potentially resulting in lower service levels and a decline in borrower satisfaction. As can be seen from the chart, this is exactly what happened in the Spring of 2016. But rather than decline in April 2017, the average satisfaction score of MortgageSAT lenders remained at 91, a very good score.
This suggests to us that when lenders make borrower satisfaction a key performance metric, service levels rise. Indeed, since MortgageSAT allows lenders to measure satisfaction both by branch and back-office units, these units will begin to compete to achieve the highest satisfaction scores. And, as we have previously observed, there’s a lot of “low hanging fruit” steps by which to improve borrower satisfaction.
TOPIC OF THE MONTH: DOES SIZE MATTER?Based On Mortgage SAT Data – Size Isn’t A Key FactorWe all know that in business, size matters. Which of us, for example, hasn’t heard of both economies and diseconomies of scale. So it’s not unreasonable to ask whether mortgage lender size affects borrower satisfaction. Smaller lenders, for example, often claim to provide better service than their large “assembly-line” competitors. But is that true?
Speaking Borrower SatisfactionTOPIC OF THE MONTH: DOES SIZE MATTER?
REGISTER for STRATMOR InsightsMay, 2017
MortgageSAT, February 2017 ©STRATMOR Group, 2017.
Satisfaction vs. Lender Size.................................................................................................................................................................................................................................
92
91
90
89
88
87
86
85
Satisfaction
Less than0.5 billion
87 89 91 87 89 91
0.5 - 1.0billion
1.0 - 2.5billion
2.5 - 5.0billion
5.0 - 10.0billion
Greaterthan 10billion

If you are interested in learning more about STRATMOR’s MortgageSAT Borrower Satisfaction Program, click here. Or to reach out directly to Mike Seminari, Director of MortgageSAT, at 614.284.4030 or [email protected] n
17
Based on MortgageSAT data for the last 12-months, including the responses of over one hundred thousand borrowers, the answer seems to be that if size matters, it doesn’t matter that much.
For example, lenders originating less than $500 million generated a satisfaction score of 87 (as did lenders originating between $2.5 and $5.0 billion), four points less than the satisfaction score of 91 generated by lenders originating between $1.0 and $2.5 billion and lenders originating more than $10.0 billion.
Is a four point satisfaction difference a lot? In this context, we think not, especially since larger MortgageSAT lenders tend to have been in the program longer and have had more time to improve their borrower satisfaction performance. As is obvious from the above chart, there is no apparent correlation between size and satisfaction.
When it comes to borrower satisfaction, what does matter, we think, is culture; in particular, a culture that puts an intense focus on improving the borrower’s experience.
Speaking Borrower SatisfactionTOPIC OF THE MONTH: DOES SIZE MATTER?
REGISTER for STRATMOR InsightsMay, 2017

TELL US YOUR THOUGHTSWe invite you to take a quick 2 question survey so that we can continue to provide you with valuable information in our STRATMOR Insights report.
18
GET THE DATA-DRIVEN ADVANTAGESTRATMOR Group offers a suite of data products and mortgage advisory services to power your performance.
SURVEYSWe invite you to download survey results or learn more about our open surveys and available survey results.
Surveys
SPOTLIGHTSURVEYS
CLICK HERE
Get Spotlight Survey Results
Follow Us on
CLICK HERE
Survey Now Open
CLICK HERE
May, 2017