the cg package for comparison of groups - r: the r project for ... · the cg package for comparison...
TRANSCRIPT

The cg package for comparison of groups
useR! 2010 conference
Bill PikounisJohn Oleynick
Non-Clinical Statistics group
21 July 2010

Slide 2 / 23 21 July 2010The cg package for comparison of groupsBill Pikounis & John Oleynick, Non-Clinical Statistics
Non-Clinical Statistics collaborations with Johnson & Johnson pharmaceutical research
• Portion of Studies focused on Comparisons
• In-vivo, In-vitro
• Not Clinical, so do-it-yourself perspectives

Slide 3 / 23 21 July 2010The cg package for comparison of groupsBill Pikounis & John Oleynick, Non-Clinical Statistics
Issues, even for one-factor linear model / unpaired samples• Data Graphs• Percent Differences• Logarithmic Scaling• Multiple Comparisons• Outliers• Censoring• Error Bars• Magnitudes of Effects and Differences• Sample Size• Digit Display

Slide 4 / 23 21 July 2010The cg package for comparison of groupsBill Pikounis & John Oleynick, Non-Clinical Statistics
Strategy of cg EvaluationData Source
prepare()
fit()Exploratorygraphs, tables
Estimations, comparisons, graphs
Diagnostics

Slide 5 / 23 21 July 2010The cg package for comparison of groupsBill Pikounis & John Oleynick, Non-Clinical Statistics
Data Set # 1: canineRhodes, L., Ding, V.D.H., Kemp, R.K., Khan, M.S., Nakhla, A.M.,
Pikounis, B., Rosner, W., Saunders, H.M. and Feeney, W.P. (2000). “Estradiol causes a dose dependent stimulation of prostate growth in castrate beagle dogs.” The Prostate, Volume 44, 8-18.
Endpoint Measure of Prostate Volume (cc3)
One Factor, 5 levels (groups)
AE: castration plus estradiol and androstanediol E1: castration plus low dose estradiol, E2: castration plus high estradiol CC: castration alone,
NC: No treatment (normal controls).
AE E1 E2 CC NC9.132 10.356 37.2 1.975 9.30110.07 6.313 12.639 3.125 13.53120.077 21.708 16.791 4.433 12.8414.691 12.651 36.996 6.154 14.33623.698 15.464 22.808 4.175 25.102

Slide 6 / 23 21 July 2010The cg package for comparison of groupsBill Pikounis & John Oleynick, Non-Clinical Statistics
Data Set # 2: gmcsfcensShealy, D. et al. (2010). “Characterization of Golimumab (CNTO148), a
human monoclonal antibody specific for human tumor necrosis factor α”, mAbs, Volume 2, Issue 4, 428-439.
One Factor, 6 levels (groups)
Endpoint Measure of GM-CSF (pg/ml): Granulocyte macrophage colony-stimulating factor
Tg197: Transgenic mouse model for TNFα expression
PBS: Phosphate buffered saline control
WT: Wild Type
PBS/Tg 197 1mg/kg/Tg 197 3mg/kg/Tg 197 10 mg/kg/Tg 197 30 mg/kg/Tg 197 PBS/WT1 143.535 116.515 <82.5 97.31 <74.94 <74.942 108.51 207.785 <82.5 <82.5 75.53 76.683 124.575 109.94 102.525 <82.5 88.94 78.864 91.6 168.595 <82.5 <82.5 <74.94 99.635 161.575 166.99 <82.5 <82.5 102.805 <74.946 <82.5 <82.5 <82.5 <82.5 95.71 77.87 <82.5 135.34 <82.5 <82.5 80.91 8 106.4 <82.5 <82.5 <74.94

Slide 7 / 23 21 July 2010The cg package for comparison of groupsBill Pikounis & John Oleynick, Non-Clinical Statistics
Data Set Preparations> canine.data <‐ prepareCGOneFactorData(canine.dfr, format="groupcolumns",
analysisname="Canine",endptname="Prostate Volume (cc3)",logscale=TRUE,stamps=FALSE, refgrp="CC")
## OR something similar
> prepare(type="onefactor",dfr=canine.dfrlisted, format=“listed",analysisname="Canine",endptname=expression(
paste("Prostate Volume (", plain(cc)^3, ")", sep="")),logscale=TRUE,stamps=FALSE, refgrp="CC")

Slide 8 / 23 21 July 2010The cg package for comparison of groupsBill Pikounis & John Oleynick, Non-Clinical Statistics
Exploratory> pointGraph(canine.data)> # boxplot(canine.data)> descriptiveTable(canine.data)

Slide 9 / 23 21 July 2010The cg package for comparison of groupsBill Pikounis & John Oleynick, Non-Clinical Statistics
Exploratory> descriptiveTable(canine.data)
Descriptive Table of Canine Endpoint: Prostate Volume (cc3)
n Min 25%ile Median 75%ile Max Mean StdDev StdErr GeoMean SEGeoMean1 5 9.132 10.070 14.691 20.077 23.698 15.534 6.302 2.818 14.508 2.7032 5 6.313 10.356 12.651 15.464 21.708 13.298 5.772 2.582 12.266 2.5293 5 12.639 16.791 22.808 36.996 37.200 25.287 11.372 5.086 23.159 4.9524 5 1.975 3.125 4.175 4.433 6.154 3.972 1.559 0.697 3.710 0.7085 5 9.301 12.840 13.531 14.336 25.102 15.022 5.954 2.663 14.220 2.284

Slide 10 / 23 21 July 2010The cg package for comparison of groupsBill Pikounis & John Oleynick, Non-Clinical Statistics
Fit & Evaluations> canine.fit <- fit(canine.data)
> ## Comparisons Tables> canine.comps0 <- comparisonsTable(canine.fit)> canine.comps1 <- comparisonsTable(canine.fit, mcadjust=TRUE,
type="allgroupstocontrol", refgrp="CC")
## Comparisons Graphs> comparisonsGraph(canine.comps0)> comparisonsGraph(canine.comps1, ticklabels=list(mod="add", marks=300))
## Error Bar GraphserrorBarGraph(canine.fit)errorBarGraph(canine.fit, mcadjust=TRUE, model="olsonly")
## Group Summary TablegrpSummaryTable(canine.fit)
Slide 11 / 23 21 July 2010The cg package for comparison of groupsBill Pikounis & John Oleynick, Non-Clinical Statistics
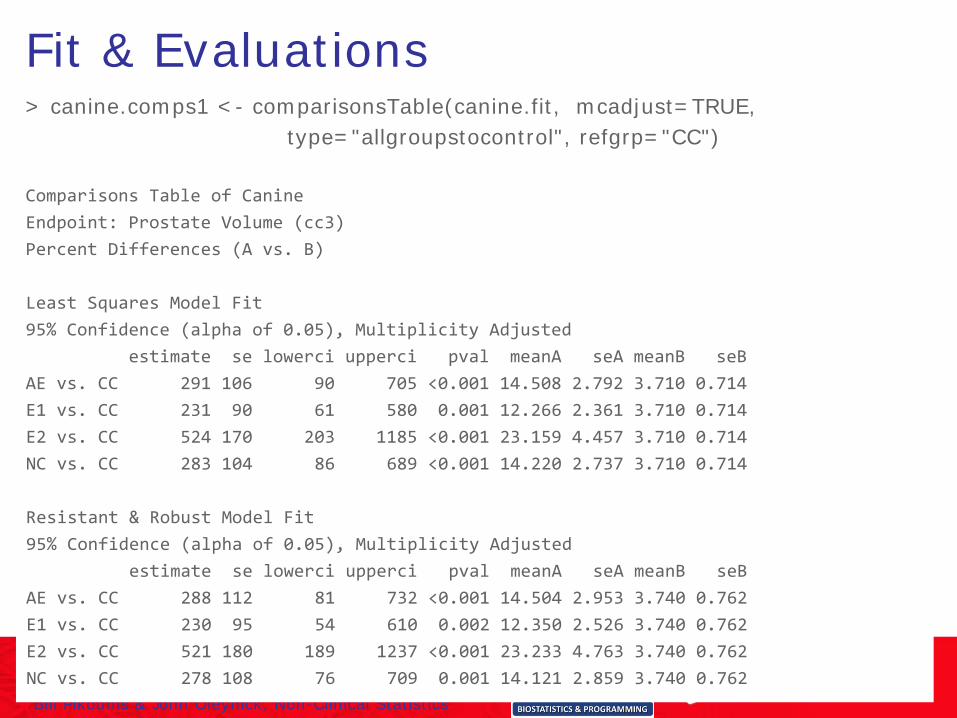
Fit & Evaluations> canine.comps1 <- comparisonsTable(canine.fit, mcadjust=TRUE,
type="allgroupstocontrol", refgrp="CC")
Comparisons Table of Canine Endpoint: Prostate Volume (cc3) Percent Differences (A vs. B)
Least Squares Model Fit95% Confidence (alpha of 0.05), Multiplicity Adjusted
estimate se lowerci upperci pval meanA seA meanB seBAE vs. CC 291 106 90 705 <0.001 14.508 2.792 3.710 0.714E1 vs. CC 231 90 61 580 0.001 12.266 2.361 3.710 0.714E2 vs. CC 524 170 203 1185 <0.001 23.159 4.457 3.710 0.714NC vs. CC 283 104 86 689 <0.001 14.220 2.737 3.710 0.714
Resistant & Robust Model Fit95% Confidence (alpha of 0.05), Multiplicity Adjusted
estimate se lowerci upperci pval meanA seA meanB seBAE vs. CC 288 112 81 732 <0.001 14.504 2.953 3.740 0.762E1 vs. CC 230 95 54 610 0.002 12.350 2.526 3.740 0.762E2 vs. CC 521 180 189 1237 <0.001 23.233 4.763 3.740 0.762NC vs. CC 278 108 76 709 0.001 14.121 2.859 3.740 0.762
Slide 12 / 23 21 July 2010The cg package for comparison of groupsBill Pikounis & John Oleynick, Non-Clinical Statistics
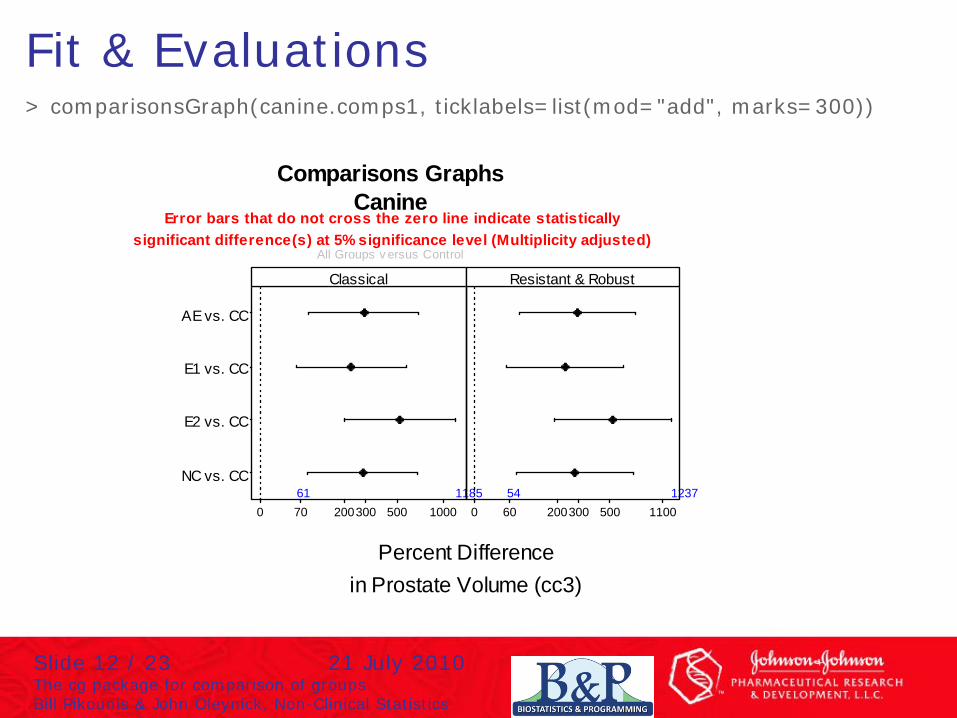
Fit & Evaluations> comparisonsGraph(canine.comps1, ticklabels=list(mod="add", marks=300))
Comparisons GraphsCanine
Percent Difference
0 70 200300 500 1000
AE vs. CC
E1 vs. CC
E2 vs. CC
NC vs. CC61 1185
Classical
0 60 200300 500 110054 1237
Resistant & Robust
in Prostate Volume (cc3)
Error bars that do not cross the zero line indicate statistically significant difference(s) at 5% significance level (Multiplicity adjusted)
All Groups v ersus Control

Slide 13 / 23 21 July 2010The cg package for comparison of groupsBill Pikounis & John Oleynick, Non-Clinical Statistics
Fit & Evaluations> errorBarGraph(canine.fit, mcadjust=TRUE, model="olsonly")Some time may be needed as the critical point from the multcomp::summary.glhtfunction call is calculated. Please wait...
... Done. Critical point from Least Squares fit is calculated.
Pro
stat
e V
olum
e (c
c3)
log-
spac
ed
5
10
15
20
2530
0.4
0.6
0.8
1
1.2
1.4
Log1
0 sc
ale
ofPr
osta
te V
olum
e (c
c3)
AE E1 E2 CC NC
2.469
34.801
Error Bar Graph, Classical analysisCanine
Non-overlapping error bars indicate statistically significant difference(s) at 5 % significance level (Multiplicity adjusted)

Slide 14 / 23 21 July 2010The cg package for comparison of groupsBill Pikounis & John Oleynick, Non-Clinical Statistics
Statistical Notes• Andrews, Sarner and Snee (1980) method
used in Error Bar Graphs
• Purposeful Avoidance of Skyscraper/Antennae/Dynamite Error Bar Chart Depiction
• MASS:::rlm() with method=“MM” used for resistant / robust
• multcomp package used for multiple comparisons to avoid slot machine of procedure choices

Slide 15 / 23 21 July 2010The cg package for comparison of groupsBill Pikounis & John Oleynick, Non-Clinical Statistics
Censoring to Handle Limits of Detection• Accelerated Failure Time (AFT) model,
lognormal / Gaussian distribution assumed
• Accommodate Left, Right, and Interval Censoring, courtesy of survival:::survreg().
• Once the AFT model is fit, proceed as before for comparison evaluations.

Slide 16 / 23 21 July 2010The cg package for comparison of groupsBill Pikounis & John Oleynick, Non-Clinical Statistics
Exploration> boxplot(gmcsfcens.data)
Boxplot Graphcytokine
GM
-CS
F (p
g/m
l)
<<<< << <
< <<
<< < < < <<<<<
< <
log-
spac
ed
80
100
120
140
160
180
200
1.9
2
2.1
2.2
2.3
Log1
0 sc
ale
of G
M-C
SF (p
g/m
l)
PBS/Tg 19
7 1m
g/kg/T
g 197
3m
g/kg/T
g 197
10 m
g/kg/T
g 197
30 m
g/kg/T
g 197
PBS/W
T
74.940
207.785
Slide 17 / 23 21 July 2010The cg package for comparison of groupsBill Pikounis & John Oleynick, Non-Clinical Statistics
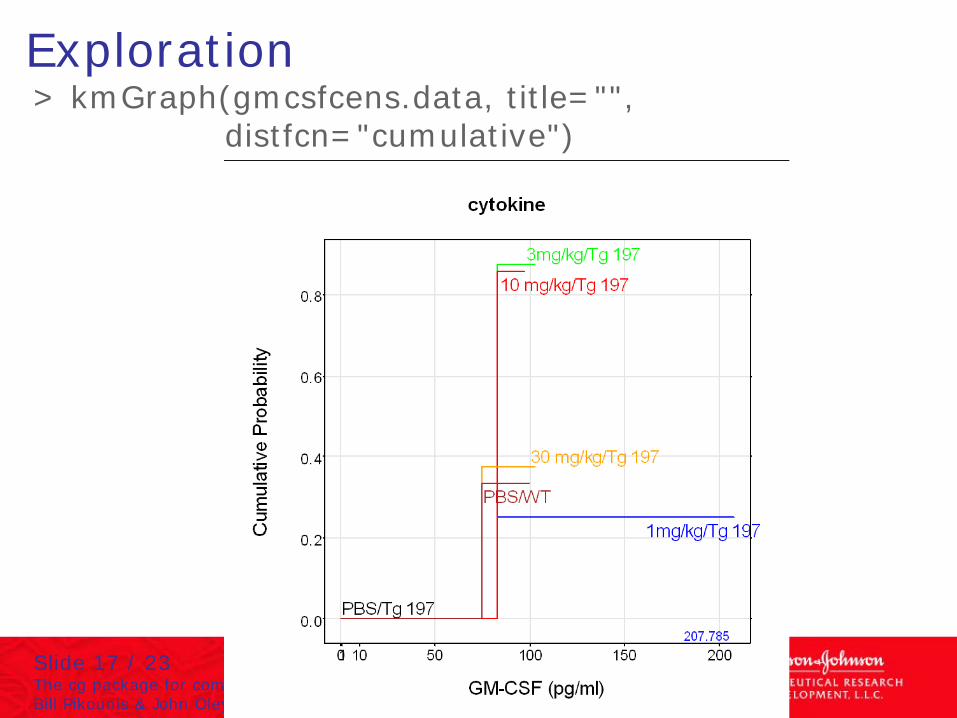
Exploration> kmGraph(gmcsfcens.data, title="",
distfcn="cumulative")

Slide 18 / 23 21 July 2010The cg package for comparison of groupsBill Pikounis & John Oleynick, Non-Clinical Statistics
Exploration> descriptiveTable(gmcsfcens.data)
Descriptive Table of cytokine Endpoint: GM‐CSF (pg/ml)
n ncensored ncomplete Min 25%ile Median 75%ile Max Mean StdDev StdErr GeoMean SEGeoMean1 8 2 6 <82.500 106.400 107.455 134.055 161.575 <NA> <NA> <NA> <NA> <NA>2 8 2 6 <82.500 109.940 125.927 167.792 207.785 <NA> <NA> <NA> <NA> <NA>3 8 7 1 <82.500 102.525 102.525 102.525 102.525 <NA> <NA> <NA> <NA> <NA>4 7 6 1 <82.500 82.500 82.500 82.500 97.310 <NA> <NA> <NA> <NA> <NA>5 8 3 5 <74.940 102.805 102.805 102.805 102.805 <NA> <NA> <NA> <NA> <NA>6 6 2 4 <74.940 74.940 77.240 78.860 99.630 <NA> <NA> <NA> <NA> <NA>

Slide 19 / 23 21 July 2010The cg package for comparison of groupsBill Pikounis & John Oleynick, Non-Clinical Statistics
Diagnostics> # qqGraph(canine.fit)> varianceGraph(canine.fit)

Slide 20 / 23 21 July 2010The cg package for comparison of groupsBill Pikounis & John Oleynick, Non-Clinical Statistics
Sample Sizecanine.samp <- samplesizeTable (canine.fit, direction = "increasing",
model = "olsonly",mmdvec = c (5, 10, 25, 50, 75, 100) )
The nmax threshold specified at 1000 was reached for at least one of thespecified differences.
Sample Size Table for Canine Endpoint: paste(plain("Prostate Volume (cc3)")) Percent Differences 80% Power and 5% Significance LevelVariability Estimate (Log scale) of 0.43032 Groupsn per group N Total
5 >1000 >200010 321 64225 60 12050 19 3875 11 22
100 8 16

Slide 21 / 23 21 July 2010The cg package for comparison of groupsBill Pikounis & John Oleynick, Non-Clinical Statistics
Sample Size
Tota
l Sam
ple
Siz
e fro
m 2
gro
ups
Percent INCREASE: Minimum Detectable Differencein Prostate Volume (cc3)
20
50
100
200
500
1000
1500
10
25
50
100
250
500
750
16
2000
5.00 20 30 40 50 60 80 100
Sam
ple
size
per
eac
h of
the
2 gr
oups
For at least one difference the sample size calculations w ere truncated at 1000 per group.
Sample Size GraphCanine
80 % Pow er ; 5 % Signif icance Level ; Classical Variability Estimate (Log scale) of 0.4303
> samplesizeGraph (canine.samp)

Slide 22 / 23 21 July 2010The cg package for comparison of groupsBill Pikounis & John Oleynick, Non-Clinical Statistics
Summary• Package cg “almost there” for CRAN
publishing later this year
• Flow of wrapper functions to guide the full analysis and interpretation of the data.
• Motivated to address common “in practice” issues

Slide 23 / 23 21 July 2010The cg package for comparison of groupsBill Pikounis & John Oleynick, Non-Clinical Statistics
Acknowledgments• Authors of MASS, survival, multcomp,
lattice, grid, rms, …
• R core packages and the team
• R community
• Conference organizers