the causes and consequences of test score …wdobbie/files/regents...the causes and consequences of...
TRANSCRIPT
The Causes and Consequences of Test Score Manipulation:
Evidence from the New York Regents Examinations∗
Thomas S. DeeStanford University and NBER
Will DobbiePrinceton University and NBER
Brian A. JacobUniversity of Michigan and NBER
Jonah RockoffColumbia University and NBER
March 2018
Abstract
We show that the design and decentralized scoring of New York’s high school exit exams –the Regents Examinations – led to systematic manipulation of test scores just below importantproficiency cutoffs. Exploiting a series of reforms that eliminated score manipulation, we findheterogeneous effects of test score manipulation on academic outcomes. While inflating a scoreincreases the probability of a student graduating from high school by about 17 percentagepoints, the probability of taking advanced coursework declines by roughly 10 percentage points.We argue that these results are consistent with test score manipulation helping less advancedstudents on the margin of dropping out but hurting more advanced students that are not pushedto gain a solid foundation in the introductory material.
∗We are extremely grateful to Don Boyd, Jim Wyckoff, and personnel at the New York City Department ofEducation and New York State Education Department for their help and support. We also thank Josh Angrist,David Deming, Rebecca Diamond, Roland Fryer, Larry Katz, Justin McCrary, Crystal Yang, and numerous seminarparticipants for helpful comments and suggestions. Elijah De la Campa, Kevin DeLuca, Samsun Knight, JamesReeves, Sean Tom, and Yining Zhu provided excellent research assistance. Correspondence can be addressed tothe authors by e-mail: [email protected] [Dee], [email protected] [Dobbie], [email protected] [Jacob], [email protected] [Rockoff]. All remaining errors are our own.

In the United States and across the globe, educational quality is increasingly measured using
standardized test scores. These standardized test results can carry extremely high stakes for both
students and educators, often influencing grade retention, high school graduation, school closures,
and teacher and administrator pay. The tendency to place high stakes on student test scores has led
to concerns among both researchers and policymakers about the fidelity of standardized test results
(e.g., National Research Council 2011, Neal 2013). A particular concern is that the consequences
associated with these tests can sometimes lead to outright cheating as evidenced by incidents such
as the 2009 cheating scandal in Atlanta.1
Despite widespread concerns over test validity and the manipulation of scores, we know little
about the factors that lead educators to manipulate student test scores or the long-run effect of such
manipulation for students. In early work, Jacob and Levitt (2003) find that test score manipulation
occurs in roughly five percent of elementary school classrooms in the Chicago public schools, with
the frequency of manipulation responding strongly to relatively small changes in incentives. Outside
of the United States, Lavy (2009) finds that a teacher incentive program in Israel did not affect test
score manipulation, and Angrist, Battistin, and Vuri (2017) find that small classes increase test
score manipulation in Southern Italy due to teachers shirking when they transcribe answer sheets.
A related literature finds that student characteristics often influence teacher grading of exams, with
girls and students with higher social status often receiving better marks (Lavy 2008, Hinnerich,
Hoglin and Johannesson 2011, Hanna and Linden 2012, Burgess and Greaves 2013). Most recently,
Lavy and Sand (2015) and Terrier (2016) find that teachers’ grading biases can have important
impacts on subsequent achievement and enrollment.
In this paper, we examine the causes and consequences of test score manipulation in the context
of the New York State Regents Examinations, high-stakes exit exams that measure student per-
formance for New York’s secondary-school curricula. The Regents Examinations carry important
stakes for students, teachers, and schools, based largely on students meeting strict score cutoffs.
Moreover, the Regents Examinations were graded locally for most of our sample period (i.e., by
teachers in a student’s own school), making it relatively straightforward for teachers to manipulate
the test scores of students whom they know and whose scores may directly affect them.
We begin our empirical analysis by documenting sharp discontinuities in the distribution of
student scores at the proficiency cutoffs, demonstrating that teachers purposefully manipulated
Regents scores in order to move marginal students over the performance thresholds. Formal es-
timates suggest that teachers inflated more than 40 percent of scores that would have been just
below the cutoffs on core academic subjects between the years 2004 and 2010, or approximately 6
percent of all tests taken during this time period. However, test score manipulation was reduced
by approximately 80 percent in 2011 when the New York State Board of Regents ordered schools
1See http://www.nytimes.com/2013/03/30/us/former-school-chief-in-atlanta-indicted-in-cheating-scandal.html.In related work, there is evidence that test-based accountability pressures lead some teachers to narrow their in-struction to the tested content (Jacob 2005) and target students who are near a performance threshold (Neal andSchanzenbach 2010). There is also evidence some schools sought to manipulate the test-taking population advan-tageously following the introduction of test-based accountability (Figlio and Getzler 2006, Cullen and Reback 2006,Jacob 2005).
1
to stop re-scoring exams with scores just below proficiency cutoffs, and disappeared completely
in 2012 when the Board ordered that Regents exams be graded by teachers from other schools
in a small number of centrally administered locations. These results suggest that both re-scoring
policies and local grading are key factors in teachers’ willingness or ability to manipulate test scores
around performance cutoffs.
We find that manipulation was present in all New York schools prior to the reforms, but that
the extent of manipulation varied considerably across students and schools. We find higher rates
of manipulation for Black and Hispanic students, students with lower baseline scores, and students
with worse behavioral records. Importantly, however, this is entirely due to the fact that these
students are more likely to score close to the proficiency threshold – these gaps largely disappear
conditional on a student scoring near a proficiency cutoff.
There is also notable across-school variation in rates of manipulation, ranging from 24 percent
of “marginal” scores at the 10th percentile school to almost 60 percent of such scores at the 90th
percentile school. This across-school variation in test score manipulation is not well explained
by school-level demographics or characteristics, and there are several pieces of evidence suggesting
that institutional incentives (e.g., school accountability systems, teacher performance pay, and high
school graduation rules) cannot explain either the across-school variation in manipulation or the
system-wide manipulation. However, we do find evidence that the extent of manipulation within a
school depended on the set of teachers within a school grading a particular exam. We argue that,
taken together, these results suggest that “altruism” among teachers is an important motivation
for teachers’ manipulation of test scores (i.e., helping students avoid sanctions involved with failing
an exam).
In the second part of the paper, we estimate the impact of test score manipulation on subsequent
student outcomes such as high school graduation and advanced course taking. Our empirical
strategy exploits the arguably exogenous timing of the decision to prohibit the re-scoring of exams
and, then later, to centralize the initial scoring of these exams.2 Using a difference-in-differences
research design, we find that having an exam score manipulated to fall above a performance cutoff
increases the probability of graduating from high school by 16.7 percentage points, a 21.1 percent
increase from the pre-reform mean. The effects on high school graduation are economically and
statistically significant for all student subgroups. These results suggest that test score manipulation
had important effects on the graduation outcomes of students in New York City.
While students on the margin of dropping out are “helped” by test score manipulation, we also
find evidence that some students are “hurt” by this teacher behavior. Specifically, we find that
having an exam score manipulated decreases the probability of taking the requirements for a more
advanced high school diploma by 9.8 percentage points, a 26.6 percent decrease from the pre-reform
2An important limitation of our difference-in-differences analysis is that we are only able to estimate the effect ofeliminating manipulation in partial equilibrium. There may also be important general equilibrium effects of test scoremanipulation that we are unable to measure using our empirical strategy. For example, it is possible that widespreadmanipulation may change the way schools teach students expected to score near proficiency cutoffs. It is also possiblethat test score manipulation can change the signaling value of course grades or a high school diploma.
2

mean, with larger effects for students with lower baseline test scores. As discussed in greater detail
below, we find evidence suggesting that these negative effects stem from the fact that marginal
students who are pushed over the threshold by manipulation do not gain a solid foundation to the
introductory material that is required for more advanced coursework. These results are consistent
with the idea that test score manipulation has heterogeneous effects on human capital accumulation.
Our paper is closely related to three papers conducted in parallel to our own that examine
the long-term consequences of test score manipulation. Two of these papers find results consistent
with the positive effects of manipulation on educational attainment we find for some students.
Diamond and Persson (2016) document significant manipulation of test scores around discrete
grade cutoffs in Sweden. Using a cross-sectional approach, where students scoring just outside
the manipulable range serve as the control group for students inside the manipulable range, they
find that having a score inflated increases educational attainment by 0.5 to 1 year, with larger
attainment effects and some evidence of earnings effects for low-skill students. Borcan, Lindahl,
and Mitrut (2017) find similar results when studying an intervention to reduce test-manipulation in
Romania by installing CCTV monitoring of the high-stakes high school exit exam. They find that
this centralized oversight significantly reduced fraud but, in turn, led to decreased college access for
poor students. A third paper, by Apperson, Bueno, and Sass (2016), finds negative effects of test
manipulation on students’ later academic outcomes. Specifically, students who attended middle
schools where cheating occurred are more likely to drop out of high school. Combined with the
results of our study, these recent papers support the idea that test manipulation can have either
positive or negative effects on different students and in different contexts.3
The remainder of the paper is structured as follows. Section I describes the Regents Exami-
nations and their use in student and school evaluations. Section II details the data used in our
analysis. Section III presents a statistical model to formalize our research questions and motivate
the estimating equations for our empirical analysis. Section IV describes our empirical measure-
ment of manipulation, documents the extent of manipulation system-wide, and explores variation in
manipulation, and possible drivers of this variation in behavior. Section V presents our difference-
in-differences approach and estimates the impact of manipulation on student outcomes. Section VI
concludes.
I. New York Regents Examinations
In 1878, the Regents of the University of the State of New York implemented the first statewide
system of standardized, high-stakes secondary school exit exams. Its goals were to assess student
performance in the secondary-school curricula and award differentiated graduation credentials to
secondary school students (Beadie 1999, NYSED 2008). This practice has continued in New York
3In related work on the long-term impacts of high stakes testing, Ebenstein, Lavy, and Roth (2016) find thatquasi-random declines in exam scores due to pollution exposure have a negative effect on post-secondary educationalattainment and earnings, and Dustmann, Puhani, and Schonberg (2017) show that the significant, built-in flexibilityof the German tracking system allows for initial tracking mistakes to be corrected over time.
3

state to the present day. In this section, we describe the features of these exams that are most
relevant for our study. Additional details can be found in Appendix B.
A. Regents Examinations and High School Graduation
During the period we examine, public high school students in New York must meet certain perfor-
mance thresholds on Regents examinations in five “core” subjects to graduate from high school:
English, Mathematics, Science, U.S. History and Government, and Global History and Geogra-
phy.4 Regents exams are also given in a variety of other non-core subject areas, including advanced
math, advanced science, and a number of foreign languages. Regents exams are administered within
schools in January, June, and August of each calendar year, with students typically taking each
exam at the end of the corresponding course.
An uncommon and important feature of the Regents exams is that they were graded by teachers
from students’ own schools–although not necessarily each student’s actual teacher–during most of
our sample period. The State Education Department of New York provides explicit guidelines
for how the teacher-based scoring of each Regents exam should be organized (e.g., NYSED 2009),
which we discuss in greater detail below. After the exams are graded locally at schools, the results
are sent to school districts and, ultimately, to the New York State Education Department.
Regents exams are scored on a scale from 0 to 100. In order to qualify for a “local diploma,”
the lowest available in New York, students entering high school before the fall of 2005 were required
to score at least 55 on all five core examinations. The score requirements for a local diploma were
then raised for each subsequent entry cohort until the local diploma was eliminated altogether for
students entering high school in the fall of 2008. For all subsequent cohorts, the local diploma has
only been available to students with disabilities. In order to receive a (more prestigious) Regents
Diploma, students in all entry cohorts were required to score at least 65 on all five core Regents
exams. To earn the even more prestigious Advanced Regents Diploma, students must also score at
least a 65 on additional elective exams in math, science, and foreign language. Appendix Table A1
provides additional details on the degree requirements for each cohort in our sample.5
B. The Design and Scoring of Regents Examinations
In addition to multiple choice items, Regents examinations contain open-response or essay questions.
For example, the English exam typically asks students to respond to essay prompts after reading
4The mathematics portion of the Regents exam has undergone a number of changes during our sample period(2004-2013). However, while there is some variation in how the material was organized, the required exam forgraduation essentially always covered introductory algebra as well as a limited number of topics in other fields suchas geometry and trigonometry.
5In addition to the important proficiency cutoffs at 55 and 65, cutoffs at 75 and 85 scale score points are used bysome NY state public colleges as either a prerequisite or qualification for credit towards a degree and by some highschools as a prerequisite for non-Regents courses such as International Baccalaureate. The cutoffs at 75 and 85 arenot used to determine eligibility for Advanced Regents coursework. While we focus on the relatively more importantcutoffs at 55 and 65 in our analysis, there is also visual evidence of a small amount of manipulation around scores of75 and 85.
4

passages such as speeches or literary texts. Each of the foreign language exams also contains a
speaking component. Scoring materials provided to schools include the correct answers to multiple-
choice questions and detailed instructions for evaluating each open-response and essay question.6
The number of correct multiple-choice items, the number of points awarded on open-response
questions, and the final essay scores are then converted into a final scale score using a “conversion
chart” that is specific to each exam.7 While scores range from 0 to 100 on all Regents exams, all
101 scale scores are typically not possible on any single exam. Indeed, there are even some exams
where it is not possible to score exactly 55 or 65, and, as a result, the minimum passing score is
effectively just above those scale scores (e.g., 56 or 66).
During our primary sample period (2003-2004 to 2009-2010), grading guidelines for math and
science Regents exams specified that exams with scale scores between 60 and 64 must be scored
a second time to ensure the accuracy of the score, but with different teachers rating the open-
response questions. Principals at each school also had the discretion to mandate that math and
science exams with initial scale scores from 50 to 54 be re-scored. Although we find evidence of
manipulation in every Regents exam subject area, the policy of re-scoring math and science exams
may influence how principals and teachers approach scoring Regents exams more generally and is
clearly important for our study. We discuss this in greater depth in Section V, where we examine
changes in the Regents re-scoring policies that occurred in 2011.
C. Regents Examinations and School Accountability
Beginning in 2002-2003, high schools in New York state have been evaluated under the state
accountability system developed in response to the federal No Child Left Behind Act (NCLB).
Whether a public high school in New York is deemed to be making Adequate Yearly Progress
(AYP) towards NCLB’s proficiency goals depends on several measures, but all are at least partially
based on the Regents Examinations and some are specifically linked to students meeting the 55 and
65 thresholds. Motivated by perceived shortcomings with NCLB, the New York City Department
of Education (NYCDOE) implemented its own accountability system starting in 2006-2007. The
central component of the NYCDOE accountability system is the school progress reports, which
assigns schools a letter grade, ranging from A to F. For high schools, the school grades depend
heavily on Regents pass rates, particularly pass rates in the core academic subjects that determine
high school graduation. Details on the use of Regents in NCLB and NYCDOE accountability
systems are provided in Appendix B. We examine the role of these accountability systems in
motivating test score manipulation in Section IV.D.
6To help ensure consistent scoring, essays are given a numeric rating of one to four by two independent graders.If the ratings are different but contiguous, the final essay score is the average of the two independent ratings. If theratings are different and not contiguous, a third independent grader rates the essay. If any two of the three ratingsare the same, the modal rating is taken. The median rating is taken if each of the three ratings is unique.
7Only graders have access to these conversion charts, so students are generally unable to know how their testanswers will translate into the final scale score. As a result, it is virtually impossible for a student to target preciselyan exact scale score (e.g., 55 or 65).
5

II. Data
Here we summarize the most relevant information regarding our administrative enrollment and test
score data from the New York City Department of Education (NYCDOE). Further details on the
cleaning and coding of variables are contained in Appendix C.
The NYCDOE data contain student-level administrative records on approximately 1.1 million
students and include information on student race, gender, free and reduced-price lunch eligibility,
behavior, attendance, matriculation, state math and English Language Arts test scores (for students
in grades three through eight), and Regents test scores. Regents data include exam-level information
on the subject, month, and year of the test, the scale score, and a school identifier. Importantly,
they do not include raw scores broken out by multiple choice and open-response, nor do they
include an identifier for the teacher(s) who graded the exams. We have complete NYCDOE data
spanning the school years 2003-2004 to 2012-2013, with Regents test score and basic demographic
data available starting in the school year 2000-2001.
We also collected the charts that convert raw scores (i.e., number of multiple choice correct,
number of points from essays and open response items), to scale scores for all Regents exams taken
during our sample period. We use these conversion charts in three ways. First, we identify a
handful of observations in the New York City data that do not correspond to possible scale scores
on the indicated exam and must contain an error in either the scale score or test identifier. Second,
we use the mapping of raw scores into scale scores for math and science exams to account for
predictable spikes in the distribution of scale scores when this mapping is not one to one. Third,
we identify scale scores that are most likely to be affected by manipulation around the proficiency
cutoffs. See Section IV.B for additional details on both the identification of manipulable scores and
the mapping of raw to scale scores.
We make several restrictions to our main sample. First, we focus on Regents exams starting
in 2003-2004 when tests can be reliably linked to student enrollment files. We return to tests
taken in the school years 2000-2001 and 2001-2002 in Section D to assess manipulation prior to the
introduction of NCLB and the NYC school accountability system. Second, we use each student’s
first exam for each subject to avoid any mechanical bunching around the performance thresholds
due to re-taking behavior. In practice, however, results are nearly identical when we include re-
tests. Third, we drop August exams, which are far less numerous and typically taken after summer
school, but our results are again similar if we use all test administrations. Fourth, we drop students
who are enrolled in middle schools, a special education high school, or any other non-standard high
school (e.g., dropout prevention schools). Fifth, we drop observations with scale scores that are not
possible on the indicated exam (i.e., where there are reporting errors), and all school-exam cells
where more than five percent of scale scores are not possible. Finally, we drop special education
students, who are subject to a different set of accountability standards during our sample period
(see Appendix Table A1), although our results are again similar if we include these students. These
sample restrictions leave us with 1,629,910 core exams from 514,632 students in our primary window
of 2003-2004 to 2009-2010. Table 1 contains summary statistics for the resulting dataset.
6

III. Conceptual Framework
In this section, we develop a stylized model of test score manipulation and later educational at-
tainment, abstracting from other inputs, such as teachers or peers, which are typically the focus
of education production functions (Todd and Wolpin 2003, Cunha and Heckman 2010, Cunha,
Heckman, and Schennach 2010, Chetty, Friedman, and Rockoff 2014). Using this model, we define
a measure of test score manipulation that we can estimate using our data. Later, we show how
we can estimate the impact of this test score manipulation on later educational attainment using
a sharp policy reform.
A. Setup
Our model is characterized by a specification for test scores and a specification for later educational
attainment outcomes such as high school graduation. Let sieth denote student i’s observed test score
for exam subject e taken at time t and graded by grader h. Let c denote a performance threshold
such that a student passes an exam if sieth ≥ c.Test scores are determined by the following function:
sieth = s∗iet + ξieth + φ(i, h, c) (1)
Here s∗iet represents the test score that the student would get in expectation on test submissions if
reviewed by “unbiased” graders who have no information about the student (e.g., name, demograph-
ics, prior achievement) and simply apply the instructions for marking individual test questions to
the test submissions. This persistent component of the test score reflects factors such as a student’s
subject knowledge at time t, the student’s test taking ability, and so on. The term ξieth represents
idiosyncratic factors at the student-exam-time-grader level that affect the perceived quality of any
given test submission but are not persistent across test submissions and are equal to zero in expec-
tation. This noise component includes factors such as guessing on multiple choice items, arbitrary
alignment of questions with the local curriculum, classical measurement error by graders, and so on.
Finally, φ(i, h, c) represents potential “bias” by exam graders, who may manipulate the final test
score sieth based on additional information they possess about student i, the beliefs and incentives
of grader h, and the grader’s knowledge of the cutoff c. For example, graders might inflate the
exam scores of particularly well-liked students or in order to boost measured performance under a
school accountability system.8
High school graduation Gi is a binary outcome determined by whether a student passes a
required set of E exam subjects (which can be retaken multiple times) as well as performing other
8Unlike Diamond and Persson (2016), we do not explicitly model graders’ incentives, but one may have in minda model where graders benefit from increasing the number of students passing exams but pay a cost for introducingtest score bias φ(i, c, h). Student or grader specific variation in the benefits or costs of introducing bias generatesvariation in test score manipulation across those dimensions.
7

required work (e.g., accumulating course credits):
Gi = 1[ηi > 0] ∗E∏
e=1
1[maxt(sieth) ≥ c] (2)
where ηi reflects individual heterogeneity in students’ abilities to complete non-exam graduation
requirements and may be correlated with the bias component φ(i, h, c). For example, it is possible
that exams are graded more leniently for well-behaved students.
Later outcomes in life Yi such as college enrollment or earnings depend on students’ abilities to
complete non-exam graduation requirements, students’ knowledge and skills across various subject
areas, and high school graduation itself:
Yi = fi(ηi, s∗i , Gi) (3)
where s∗i is the set of student skills and knowledges across all subjects. The influence of these
variables on outcomes may be heterogeneous across individuals i. For example, it is possible that
the impact of high school graduation Gi will be different for high- and low-ability students.
One limitation of our simple framework is that we do not specify a role for student effort and
learning over time in the determination of s∗iet. If students fail an exam and are forced to re-take a
course, it is likely that their knowledge s∗iet will increase, resulting in a higher test score sieth. For
this reason, our measures of manipulation are based on students’ first test administration. Another
limitation of our framework is we do not specify a relationship among test scores in different sub-
jects. For example, if a student acquires higher skills s∗iet in a subject such as Algebra, that student
will likely perform better on the exam in Algebra 2/Trigonometry. This issue becomes relevant
when we consider the impact of manipulation on students’ enrolling in and passing advanced Re-
gents courses. If a student fails a required Regents’ exam, such as Algebra, and is forced to re-take
the course, the students’ knowledge may increase, resulting in both higher test scores in Algebra
and better preparation for advanced coursework such as Algebra 2/Trigonometry. This highlights
a key tension involved in test score manipulation; raising a student’s score sieth may help them
graduate from high school but could impede accumulation of skills and knowledge. We return to
this issue in Section V.
B. Defining Test Score Manipulation
Our first empirical challenge is to estimate the fraction of exams that are manipulated by grading
bias so that they reach or exceed the passing cutoff c instead of falling just below the cutoff. We
simplify the analysis by assuming that graders only consider manipulating exam scores that are
below the performance threshold and are “close enough” so that a small amount of manipulation
would allow the student to meet the high school graduation requirements. In the context of our
8

framework, we impose the following restrictions on the bias term φ:
φ(i, h, c)
0 if s∗iet + ξieth ≥ c
0 if s∗iet + ξieth < M−cet
{0, c− s∗iet − ξieth} if c > s∗iet + ξieth ≥M−cet
(4)
Grading bias is equal to zero for exam scores that would have already been at or above the threshold
c, as well as for exam scores that would fall strictly below some score M−cet beneath the threshold
c. For the range of potentially manipulable scores from M−cet to c, bias can be either zero (i.e.,
no manipulation) or equal to the additional points needed to meet the threshold c. Conditional
on an exam score falling in this manipulable range, the grader can consider various student- and
school-level factors when deciding whether to inflate a score to the threshold c.9
The amount of manipulation at cutoff c, βcet, is defined as the fraction of exams inflated to
meet the cutoff c:
βcet =
∑Ieti=1 1[φ(i, h, c) = c− s∗iet − ξieth]
Iet(5)
where Iet is the total number of test takers for exam e at time t.
Let Fset denote the fraction of students with the observed test score of s on exam subject e at
time t:
Fset =
∑Ieti=1 1[sieth = s]
Iet(6)
Similarly, let F ∗set denote the expected fraction of students who would have received the test
score s on exam e at time year t in absence of any grading bias:
F ∗set =
∑Ieti=1 1[s∗iet = s]
Iet(7)
It is straightforward to see that:
βcet = E
∑s∈[M−
cet,c)
(F ∗set − Fset)
= E [Fcet − F ∗cet] (8)
In other words, manipulation can be measured using either the number of “missing exams” in the
manipulable range from M−cet to just below the threshold score c, or the number of “extra exams”
exactly at the threshold score. Estimates of the amount of manipulation βcet therefore require
information on both the observed test score distribution Fset and the unobserved, counterfactual
9The simplification of zero bias outside of the range near the cutoff makes the exposition of the model and empiricalstrategy more transparent. In practice, however, our empirical measure of manipulation relies on the discontinuity inthe distribution of test scores around the cutoff c. It is therefore possible to relax the above assumptions so long asany factors related to grading bias trend smoothly through c. In this scenario, our estimates identify the additionalmanipulation around c, rather than the total amount of manipulation across all test scores. We are not able to useour empirical strategy to separate any potential continuous sources of bias from any other continuously distributedfactor that affects test scores such as student ability or knowledge.
9

test score distribution F ∗set. In the next section we provide details on our method for estimating
F ∗set and describe our findings on the magnitude of test score manipulation.
IV. The Manipulation of Regents Exam Scores
A. Estimating Test Score Manipulation
As noted above, the actual test score distribution Fset is observed, but the counterfactual test score
distribution F ∗set must be estimated. We follow an approach similar to Chetty et al. (2011), who
examine manipulation of taxable income at certain thresholds where marginal tax rates change
discontinuously. Specifically, we calculate the counterfactual distribution of scores by fitting a
polynomial to the frequency count of exams by test score s, excluding data near the proficiency
cutoffs with a set of indicator variables, using the following regression specification (dropping exam
e and time t subscripts for simplicity):
Fs =
Q∑q=0
πq · sq +∑
j∈[M−c ,c]
λj · 1[s = j] + εs (9)
where q is the order of the polynomial and εs captures sampling error. We define an estimate
of the counterfactual distribution {Fs} as the predicted values from Equation (9) omitting the
contribution of the indicator variables around the cutoffs: Fs =∑Q
q=0 πq · sq. In practice, we
estimate {Fs} using a sixth-degree polynomial (Q = 6) interacted with the exam subject e and
time t.10
A key step in estimating Equation (9) is identifying the potentially manipulable test scores
around each cutoff. In other applications of “bunching” estimators, such as constructing counter-
factual distributions of taxable income around a kink in marginal tax rates, it has not generally
been possible to specify ex-ante the range of the variable in which manipulation might take place.
However, in our case we are able to identify potentially manipulable or manipulated test scores
ex-ante based on knowledge of the Regents grading rules.
Recall that math and science exams scored between 60-64 are automatically re-graded during
our sample period, with many principals also choosing to re-grade exams scored between 50-54.
The widespread knowledge of these norms for math and science may well have influenced grading
norms on in other subject areas. We therefore define the lower bound of the manipulable range on
all Regents exams to be a score of 50 for the cutoff at 55 and a score of 60 for the cutoff at 65. The
only exceptions are a few cases in which the exact score of 50 or 60 is not a possible scale score,
and 51 or 61 is used instead as the lower bound for the manipulable range around that cutoff.
10Given the empirical distribution of exam scores, it is obvious that a fairly high-order polynomial is needed, but itis unclear whether a sixth-degree polynomial is sufficiently flexible. Appendix Table A2 shows the Akaike InformationCriterion (AIC) for fitting the data with polynomials of order 1 through 7; we see the criterion fall monotonicallyuntil the sixth-order polynomial (indicating a better fit) and then increase when we add a seventh degree. Our resultsare not sensitive to small changes in the polynomial order.
10

For the upper bound of the manipulable range we follow the framework laid out above and
assume that teachers manipulate in order to push a student’s score above a passing threshold. We
also assume that teachers would, all else equal, prefer to manipulate a score through changing their
subjective ratings of essays and open-response items, as opposed to changing or filling in multiple
choice answers. These assumptions lead us to define the upper bound of the manipulable range as
the highest score a student could receive if the student was initially within the 50-54 (or 60-64)
range and a teacher awarded one additional raw point on an essay or open-response item. In other
words, the top of the manipulable range is the best score a student could get if they initially were
failing but a teacher awarded them the minimum credit needed to pass.
These assumptions, coupled with the scoring rules for different subjects, lead to specific defini-
tions of the upper bound of the manipulable range for each exam. On math and science exams, the
upper bound is typically the exact cutoff c, since it is generally possible to award enough additional
raw points through partial credit on open-response questions in order to move a student from just
below the cutoff to exactly a score of 55 or 65. The only exceptions on math and science exams
are a few cases in which the exact cutoff of 55 is not a possible scale score, and 56 is used instead
as the upper bound for the manipulable range around that cutoff. For exams in English and social
studies, the scoring rules generally result in an upper bound beyond the exact cutoff c. This is
because manipulating a score to be exactly 55 or 65 can be challenging if not impossible for any
given student. Changes in essay ratings of just one raw point typically change the scale score by
four points. For example, a student that initially scores a 63 would be moved to a 67 if a grader
awards an additional point on one of the essay prompts.11 This means that the upper bound for
English and social studies is usually 67, 68, or (in a few cases) 69.
Defining the manipulable range in this manner is highly consistent with the patterns we observe
in the data (see, for example, Appendix Figure A2). We also provide more formal specification
checks and tests for the robustness of our results to changes in the manipulable score region.
For purposes of transparency, Appendix Table A3 shows exactly which scores are included in the
manipulable range above the proficiency cutoffs for each of the June exams in each of the pre-reform
years in the core subjects.
If our ex-ante demarcation of the manipulable range is accurate, then the unadjusted counter-
factual distribution from Equation (9) should satisfy the integration constraint, i.e., the area under
the counterfactual distribution should equal the area under the empirical distribution. Consistent
with this assumption, we find that the missing mass from the left of each cutoff is always of similar
magnitude to the excess mass to the right of each cutoff.12 In contrast, Chetty et al. (2011) must
11The conversion chart for the June 2009 English Exam shown in Appendix Figure A1 illustrates this point. Astudent that has 17 correct multiple choice items and originally receives 15 raw points on the essay questions wouldend up with a scale score of 63. If a teacher awards that student one additional raw point on one of the essay responses(for a total of 16 raw points), the scale score will jump to 67. The same situation arises for a student who had 6multiple choice items correct and an initial essay total of 18 raw points, which translates to a scale score 53. Movingthat student’s essay total to 19 points will shift his or her final scale score to 57.
12We regress the estimated excess mass to the right of the cutoff on the estimated missing mass to the left, weightingby the number of tests used to generate the estimates, and find a coefficient of -0.99 with an R-squared of 0.53. Addingsubject fixed effects raises the R-squared to 0.63 and the coefficient remains stable at -1.02. This supports our view
11

use an iterative procedure to shift the counterfactual distribution from Equation (9) to the right
of the tax rate kink to satisfy the integration constraint. Given that the integration constraint is
satisfied in our context, we estimate manipulation using an average of the missing mass just to the
left of the cutoff and excess mass at each cutoff:
βc =1
2
∑s∈[M−
c ,c)
Fs − Fs
+
(∑s∈c
Fs − Fs
) =1
2
∑s∈[M−
c ,c)
−λs
+
(∑s∈c
λs
) (10)
As seen in Equation (8), we could use either the “missing mass” or the “excess mass” to characterize
the extent of manipulation. Since both of these measures will contain sampling error, we combine
the two in order to increase the precision of our estimates, but our main results are nearly identical
if we only use information from one side of the cutoff.
We also report an estimate of “in-range” manipulation, or the probability of manipulation condi-
tional on scoring just below a proficiency cutoff, which is defined as the excess mass around the cutoff
relative to the average counterfactual density in the manipulable score range: βc/∑
s∈[M−c ,c] Fs. We
calculate both total and in-range manipulation at the cutoff-exam-year level to account for the fact
that each test administration potentially has a different set of manipulable scores. In specifications
that pool multiple exams, we report the average manipulation across all cutoff-exam-year admin-
istrations weighted by the number of exams in each exam-year. In practice, our results are not
sensitive to specification changes such as the polynomial order, the manipulable score region, or
the weighting across exams.
We calculate standard errors for test score manipulation βc using a version of the parametric
bootstrap procedure developed in Chetty et al. (2011). Specifically, we draw with replacement
from the distribution of estimated vector of errors εs in Equation (9) at the score-exam-test admin-
istration level to generate a new set of scale score counts from which we can generate bootstrapped
estimates of βc. We define the standard error as the standard deviation of 200 of these bootstrapped
estimates.
B. Documenting the Extent of Manipulation: Estimates from 2004-2010
We begin by examining the distribution of core Regents exam scores near the proficiency thresholds
at 55 and 65 points in Figure 1. We first focus on all core Regents exams taken between 2003-2004
and 2009-2010, as exams taken after 2009-2010 are subject to a different set of grading policies that
we discuss in Section V.A.
To construct figures of test score distributions, we first collapse the data to the subject-year-
month-score level (e.g., Living Environment, June 2004, 77 points). We then make two minor
adjustments to account for two mechanical issues that affect the smoothness of the distribution of
scale scores.13 The results are similar but slightly less precise if we do not make these adjustments.
that both of these estimates of manipulation are measured with error but capture the same underlying behavior, andthat taking the average is likely to yield more precise estimates.
13First, we adjust for instances when the number of raw scores that map into each scale score is not one to one,
12
Finally, we collapse the adjusted counts to the scale score level and plot the fraction of tests in each
scale score around the proficiency thresholds, demarcated by the vertical lines at 55 and 65 points.
Figure 1 shows that there are clear spikes around the proficiency cutoffs in the otherwise smooth
test score distribution, and the patterns are strongly suggestive of manipulation. Scores immedi-
ately below the cutoffs appear less frequently than one would expect from a well-behaved empirical
distribution, and the scores at or just above the cutoffs appear more frequently than one would
expect. In Appendix Figures A2 and A3, we show that this pattern is still apparent if we examine
test scores separately by subject or by year.14
Figure 1 includes the counterfactual density {Fs} predicted using Equation (9), shown by the
dotted line, as well as our point estimates for manipulation and standard errors. We estimate
the average amount of manipulation on the Regents core exams to be 5.7 (se=0.02). That is,
approximately 6 percent of all Regents core exams between 2004 and 2010 were manipulated to
meet the proficiency cutoff. Within the range of potentially manipulable scores, we estimate that
an average of 43.9 (se=0.13) percent of Regents core exams were manipulated. We also look
separately at all subjects and test administrations and find economically and statistically significant
manipulation of all Regents core exams in our sample (see Appendix Table A4). Math and science
exams tend to have somewhat lower levels of manipulation than English and social science exams.
This is consistent with the notion that teachers view manipulation on multiple choice items – which
have relatively high weight in the math and science exams – as more costly than on open-response
items, but we lack sufficient variation for a formal test of this idea.15
To explore the robustness of our method for selecting the manipulable range, we also estimate
manipulation allowing scale scores immediately above and below our chosen manipulable regions to
be potentially manipulable. In other words, we add additional indicators 1[s = j] to the regression
shown in Equation (9) for scores j just outside of our manipulable range [M−c , c]. This effectively
removes those scores from contributing to the estimated counterfactual density. Appendix Figure
which causes predictable spikes in the scale score frequency, by dividing the scale score frequency by the number ofraw scores that map into it. For example, on the June 2004 Living Environment Exam, a scale score of 77 pointscorresponds to either a raw score of 57 or 58 points, while scale scores of 76 or 78 points correspond only to rawscores of 56 or 59 points, respectively. Thus, the frequency of scale score 77 (1,820 exams) is roughly two times higherthan the frequency of scale scores of 76 (915) or 78 (917). Our approach is based on the assumption of continuityin underlying student achievement, and thus we adjust the frequencies when raw to scale score mappings are notone to one. We also adjust Integrated Algebra and Math A exams for an alternating frequency pattern at very low,even scores (i.e., 2, 4, 6, etc.) likely due to students who only received credit for a small number of multiple choicequestions, worth two scale score points each. For these exams, we average adjacent even and odd scores below 55,which generates total smoothness at this part of the distribution.
14Appendix Figure A3 shows that the amount of manipulation around the 55 cutoff is decreasing over time. Thispattern is most likely due to the decreasing importance of the 55 cutoff for graduation over time (see Appendix TableA1). We therefore focus on the 65 cutoff when examining manipulation after 2010.
15The weight on multiple choice items varies almost exclusively across subjects, rather than over time withinsubjects, leaving little room to separate differences in weighting of multiple choice from other differences acrosssubjects. One interesting and informative observation comes from the June 2001 Chemistry exam, which is theonly test in our data that consists solely of multiple-choice questions. In Appendix Figure A4, one can see cleardiscontinuities in the distribution of scores at the 55 and 65 cutoffs despite the lack of open-response questions.However, the amount of manipulation is significantly less than similar elective exams from that time period, suggestingthat the cost of manipulation of multiple choice items is higher than manipulation of open-response, but not so highas to eliminate manipulation entirely.
13

A5 shows that the amount of excess (or missing) mass estimated to occur at these points is small
and statistically insignificant; moreover, the point estimates at scores just below and just above
our chosen range are of the incorrect sign. This provides us with confidence that our selection of
upper and lower bounds for the manipulable range accurately capture the scope of manipulation
by exam graders.
To provide further evidence that Regents scores near cutoffs were being manipulated, Appendix
Figure A6 shows the score distributions for math and English exams taken by New York City
students in the third through eighth grades, which also involve high stakes around specific cutoffs
but are graded centrally by the state. These distributions are smooth through the proficiency cutoff,
and estimates of a discontinuity in the distribution at the proficiency cutoff produce very small point
estimates that are statistically insignificant. Thus, there seems to be nothing mechanical about the
construction of high stakes tests in New York State that could reasonably have lead to the patterns
we see in Figure 1.
A related concern is that the patterns we see in Figure 1 are the result of classical measurement
error combined with a policy of re-grading exams with scores between 50-54 and 60-64. Several
pieces of evidence suggest that this kind of mechanical relationship is not driving our results. First,
such a practice would lead to a hollowing out within the marginal range and excess mass both above
and below the re-grading thresholds, yet the test score distribution is clearly smooth just below
50 points (see Figure 1). Second, on the math and science exams, where it is generally possible to
add points to open-ended questions in order to meet the 55 or 65 cutoffs exactly, we can easily see
that almost all of the excess mass occurs exactly at 55 and 65, while the missing mass is spread
smoothly across the 50-54 and 60-64 ranges (see Appendix Figure A2). This strongly supports the
notion that manipulation is designed with the cutoffs in mind.16 A third piece of evidence comes
from the English exams, where the only way to increase a student’s score (other than changing
a multiple choice answer) is to add a raw point on an essay question. As mentioned above, each
raw essay point is typically worth four scale points, so (focusing on the 65 cutoff for simplicity)
any initial score from 61 to 64 requires just one essay point to cross the cutoff and land in the
range from 65 to 68, while adding an essay point to an initial score of 60 brings the student to 64.
Correction of measurement error in the 60-64 range would imply a smaller amount of missing mass
at 64 than in the range 61-63, since exams moved from 60 to 64 will fill in for exams moved up
from 64 to 68. However, this pattern of results is not what we observe in Appendix Figure A2. If
anything, there appears to be somewhat greater missing mass at 64 and, likewise 54. The data are
far more consistent with teachers viewing initial English scores of 50 and 60 as much more costly
to manipulate, as they require two separate changes to essay scores in order to meet the cutoff.17
16One could say that teachers are “correcting measurement errors” in the range below the cutoffs but (a) onlycorrecting negative errors while ignoring positive ones and (b) applying corrections just up to the point that studentsmeet the cutoff. This is, in our view, just a different characterization of the “manipulation” we describe.
17It is worth noting that evidence from the U.S. History and Global History exams also supports our argumentthat mechanical correction of measurement error is not consistent with the data. The scoring of these exams bearssimilarities in scoring to both math/science – i.e., changing open answer ratings can raise a student’s score by exactlyone scale score point – and English – i.e., there are also essays where one raw point translates to four scale score
14
Finally, it is important to note that the practice of manipulation on Regents exams was not
unique to New York City. In an early version of this research (see Dee et al. 2011), we present
evidence that a similar manipulation rate (i.e., 3 to 5 percent) occurred across the state of New
York.
C. Heterogeneity in Manipulation Across Schools and Students
Not all students with scores just below the cutoffs have their scores manipulated, raising the question
of whether test score manipulation varies systematically across students and schools. We examine
this issue in a number of ways. First, we estimate manipulation for each high school in our sample
and plot these distributions in Figure 2.18 Notably, the practice of manipulation appears to have
been quite widespread, as we see no significant subset of schools with estimated manipulation near
zero. At the same time, the intensity with which manipulation was practiced varied widely across
schools; the ranges from the 10th to 90th percentiles are 3.7 to 9.6 percent for total manipulation
and 24.4 to 55.6 percent for in-range manipulation.19 Thus, the probability of a marginally failing
exam being manipulated clearly depended on which school the student attended.
Regressions of school-level manipulation on school characteristics are shown in Table 2, where
we examine the correlation of manipulation with serving disadvantaged student populations as well
as with school size, since teachers in larger schools may be less likely to know students personally.
We find that total manipulation is positively associated with Black and Hispanic enrollment, en-
rollment of students eligible for free or reduced-price lunch, and enrollment of students with lower
baseline test scores (Columns 1-3).20 This is not surprising given that these schools are likely to
points. Thus, in line with our explanations above, the scoring distributions for the social science tests look likehybrids of the other distributions, with noticeable peaks exactly at 55 and 65, extended but smaller ranges of excessmass through 58 and 68, and missing mass at 54 and 64 that is slightly larger than at lower in-range scores.
18Because some high schools are small, we estimate the counterfactual distribution for each test subject by splittingall high schools into five quintiles based on average Regents scores and generating a counterfactual for all exams inthe quintile using Equation (9). We then calculate manipulation at the school-exam level and aggregate these toestimate manipulation across all exam administrations at the school. We also limit our analysis to observations withat least 10 students scoring in the manipulable range for the school x year x month x cutoff, which leaves us with9,392 observations spread across 279 schools from 2004 to 2010. Consistent with our results from Figure 1, totalmanipulation estimates are centered around 6 percent while in-range manipulation estimates are centered at around 40percent. Results are qualitatively similar if we generate counterfactuals using either fewer or more quantiles, or if werestrict our sample to the subset of large high schools where we can estimate school x subject-specific counterfactualdistributions.
19Of course, because each of these individual school estimates is measured with error, the distribution shown inFigure 2 could overstate the true variance in the population (Jacob and Rothstein 2016). To show that samplingerror is not a major factor, Figure 2 also plots how the number of exams, both total and only in-range, varies withmanipulation. While schools at the extreme tails of the distributions have lower sample sizes, consistent with largermeasurement errors, schools near the 10th and 90th percentiles have at least 4,000 exams, around 1,000 of whichare in the manipulable range. Additionally, we calculated manipulation at the school x subject level rather thanthe school level and tested for the significance of school effects in a random effects regression that controlled onlyfor exam subject. School effects were highly significant, with a standard deviation of 2.1 percentage points for totalmanipulation and 11.3 percentage points for in-range manipulation, very much in line with 90-10 ranges mentionedabove.
20Regressions are weighted by the number of in-range exams, but weighting by total exams provides quite similarresults. For reference, the (weighted) standard deviations of the independent variables are 24.5 percent (for per-cent Black/Hispanic), 16.3 percent (for percent free lunch), 28.8 (for test score percentile), and 1,237 students (for
15
have higher proportions of exams with scores near the cutoffs. Indeed, when we examine in-range
manipulation, schools whose students have higher 8th grade test scores exhibit (slightly) less in-
range manipulation, while the estimated relationships between in-range manipulation and schools’
fractions of racial minorities or students from poor households are small and not statistically dif-
ferent from zero (Columns 6-8). We also find that total manipulation is negatively associated with
school size (Column 4), but the coefficient becomes positive when we control for student char-
acteristics (Column 5) and when we examine in-range manipulation (Column 9). Thus, school
level manipulation varied widely, but observables predict only a small amount of variation in total
manipulation and little or no variation in in-range manipulation.21
We also estimate manipulation splitting the sample by student subgroup, regardless of the
school they attended (Appendix Figure A8). Differences in total manipulation across student
subgroups are as expected, with larger percentages manipulated for lower scoring groups. For in-
range manipulation, we find fairly small differences when comparing students by gender or eligibility
for free and reduced-price lunch. However, we estimate that lower percentages of in-range exams
were manipulated for Black and Hispanic students, students with poor behavior (defined as having
a behavioral violation or more than 20 absences), and, to a lesser extent, students with higher 8th
grade test scores.
These gaps reflect both within- and across-school variation in manipulation, so we gauge the
magnitude of the within-school component using a simple but intuitive Monte Carlo technique
where we reassign characteristics randomly among students taking the same exam within each
school.22 Gaps by synthetic subgroup only reflect across-school differences in manipulation. Thus,
if gaps disappear in the synthetic results then we have evidence of within-school differences in
manipulation across students. This is precisely what happens when we assign high baseline test
scores or good behavior randomly within schools (Table 3), suggesting significant within-school
differences in how they are treated and supporting the idea that teachers use some soft information
about students when deciding to manipulate a score near the cutoff.23
enrollment).21We find similar results if we simply split the sample by various school characteristics and re-estimate manipulation
using all core exams (see Appendix Figure A7). Schools whose populations tend to have lower average achievement(i.e., Black/Hispanic, free lunch, low 8th grade test scores) are estimated to have manipulated higher fractions ofexams overall. For example, total manipulation is twice as large for high schools with low 8th grade test scores (6.9percent) than schools with high 8th grade scores (3.4 percent). When we compare in-range manipulation, there isless evidence of major systematic difference; rates are fairly similar across school groups and some gaps reverse sign.For example, schools with high enrollment of Black/Hispanic students show estimated in-range manipulation of 43.3percent, while those with low Black/Hispanic enrollment have in-range manipulation of 45.0 percent. Additionally,while smaller schools’ total manipulation is slightly higher than large schools’, rates of in-range manipulation are 5.0percentage points lower. We split schools using the exam-weighted median for each characteristic, although resultsare qualitatively similar if we split using student- or school-level medians.
22We reassign characteristics keeping the fraction of students with each subgroup designation constant both withinschools and across all schools. We then re-estimate manipulation for the randomly assigned subgroups, repeatingthis process 100 times. Note that one limitation of this approach is that reassignment of student characteristicswill lead to differences among students both within and outside the manipulable range, thus altering our estimatedcounterfactual distributions.
23The “synthetic gap” is still present (though about half as large) when ethnicity is assigned randomly withinschools, suggesting that it is partially due to differences across the schools these students attend and partially due to
16

Finally, we examine variation in manipulation across subjects and across time within a school,
and whether this variation can be linked to specific groups of teachers. Although Figure 2 shows
substantial heterogeneity at the school level in the extent of manipulation, the reality is that
only a subset of teachers in specific subject areas are responsible for scoring each Regents exam.
Thus, manipulation may be driven to some degree by the particular groups of individual teachers
doing the grading, rather than a general school-wide culture or administrative policy. Here we
present some evidence in favor of this idea, using estimates of in-range manipulation at the school
x subject (rather than school) level, calculated using the same methodology used to create Figure
2. Appendix Table A5 presents the mean and standard deviation of these estimates by subject,
as well as the within-school correlations across each subject-pair. Average in-range manipulation
is higher and more varied in English and social studies exams, but both the level of manipulation
and variation across schools is still considerable in math and science. All of the within-school
correlations are positive, indicating some consistency in the practice across groups of teachers
within the school. However, all of the correlations except one are fairly low, with a range extending
from below 0.1 to 0.3, suggesting that particular groups of teachers within a school may be more
or less inclined to manipulate. Further support for this idea comes from the very high correlation
(0.78) in manipulation estimates between the two history exams, which are likely to be graded by
members of the same group of (social studies) teachers.24 Thus, the culture of manipulation can
vary within the school, and may be closely tied to the particular set of teachers performing grading
duties.
In order to investigate further the importance of teachers driving manipulation, we examine the
extent to which persistence over time in manipulation within a subject area and school is mediated
by teacher turnover. We therefore estimate (1) manipulation at the school x subject level in two
separate periods, 2004-2006 and 2007-2009, and (2) the fraction of teachers with the relevant license
area for each exam (e.g., English license for the English exam, Mathematics license for the Math
A and Algebra exams, etc.) who were employed at the school in both periods.25 We begin by
regressing manipulation in 2007-2009 on its “lagged” value from 2004-2006, as well as indicators
for subject area, and find a coefficient on lagged manipulation of 0.50 (se=0.09) (Table 4, Column
1). Adding school fixed effects (Column 2) decreases this measure of persistence slightly, to 0.42
(se=0.09), but clearly shows that variation in manipulation across subjects within the same school
reflects real differences in culture that persist over time.
within-school differences in how students are treated, conditional on having a score close to the cutoff. Of course, anywithin-school difference in manipulation by racial/ethnic groups may be driven by other characteristics correlatedwith race and ethnicity.
24The high correlation between the two history exams may also alleviate the concern that the lower correlationsfor other pairs are simply due to a large degree of measurement error in school x subject estimates.
25We assign teachers to a subject area based on license: English licenses for the English exam, Mathematics forthe Math A and Integrated Algebra exams, Social Studies for the Global and U.S. History Exams, and Biology,Chemistry, Earth Science, Physics, and General Science for the Living Environment Exam. We calculate the fractionin both periods as the number within each school x subject employed in both three-year periods divided by the totalnumber of teachers within each school x subject employed at any time during these six years. Note that while we couldperform this analysis at the school x subject-year level, pooling across several years and, thus, exam administrations,greatly reduces noise in the manipulation estimates.
17

We then add controls for the fraction of teachers employed in both periods and its interaction
with lagged manipulation (Column 3). If teachers are an important driver of manipulation practices,
we would expect this interaction to be positive, i.e., greater persistence when the set of teachers
remains the same. Consistent with this hypothesis, the interaction term is 0.84 (se=0.25) and highly
significant, while the coefficient estimate for the main effect of manipulation (i.e., for a school with
complete teacher turnover between the two periods) is just 0.08 (se=0.08) and not statistically
different from zero. Of course, schools with greater teacher turnover may be changing culturally
for other reasons (e.g., changes in school principal), but we find this result is robust to the addition
of school fixed effects (Column 4), where the identifying variation is based on variation in the rates
of turnover across subjects within the same school.26 Thus, while school-wide culture is a likely
factor, both the correlations across subject areas and the influence of teacher turnover at the school
x subject level support the notion that the extent of manipulation also depended greatly on the set
of teachers within a school grading a particular exam.
D. Exploring Institutional Explanations for Manipulation
We have shown that test score manipulation was widespread among schools in New York, although
clearly there was variation due to particular “cultures” which existed at the school or among
groups of teachers. Here we briefly explore three additional potential drivers of the system-wide
manipulation of Regents exams that relate to potentially important institutional incentives.
Test-Based Accountability: There is a large literature documenting how schools may engage in
various undesirable behaviors in response to formal test-based accountability systems (e.g., Figlio
and Getzler 2006, Cullen and Reback 2006, Jacob 2005, Neal and Schanzenbach 2010, Neal 2013).
It is therefore natural to ask whether the implementation of NCLB in the school year 2002-2003
and implementation of New York City’s accountability system in 2007-2008, both based heavily
on Regents exams, may have driven school staff to manipulate student exam results. Panel A of
Figure 3 explores this hypothesis by plotting the distribution of core exams taken between 2001 and
2002, before the implementation of either school accountability system, and exams taken between
2008 and 2010, after the implementation of both accountability systems. Manipulation was clearly
prevalent well before the rise of school accountability, with an estimated 60.0 (se=0.68) percent of
in-range exams manipulated before the implementation of these accountability systems, compared
to the 42.4 (se=0.27) percent in the years after the implementation of these systems.27
26Greater teacher turnover over this period could also be associated with decreases in teacher experience, whichmay in turn be linked to changes in manipulation. Indeed, when we calculate the change in average teacher experiencewithin each school-subject cell, we find a positive and significant correlation of about 0.2 with the fraction of teacherspresent in both periods. However, including the change in experience and its interaction with lagged manipulationdoes not change the results shown in Table 4, and the coefficients on the variables related to experience are notstatistically significant.
27Results are similar if we exclude the math core exams that changed from Sequential Math 1 to Math A over thistime period. Results are also similar if we exclude both the math and science core exams that required teachers tore-score exams close to the proficiency cutoffs.
18
To provide additional evidence on this issue, we take advantage of the fact that different schools
face more or less pressure to meet the accountability standards during our sample period. Panel B
of Figure 3 plots distribution of core exams for schools that did and did not make Adequate Yearly
Progress (AYP) in the previous year under the NCLB accountability system, and Panel C of Figure
3 presents results for schools receiving an A or B grade compared to schools receiving a D or F in
the previous year under the New York City accountability system. Consistent with our results from
Panel A, we find no evidence that test score manipulation varied significantly with pressure from
test-based accountability. Schools not meeting AYP manipulate 44.1 (se=0.13) percent of in-range
exams, compared to 43.8 (se=0.35) percent for schools meeting AYP. Similarly, schools receiving a
D or F from the NYC accountability system manipulate 43.4 (se=0.35) percent of in-range exams,
compared to 42.1 (se=0.28) percent for schools receiving an A or B. Thus, we find no evidence that
pressure from test-based school accountability systems was a primary driver of the manipulation
documented above.
Teacher Incentives: A closely related explanation for the system-wide manipulation of Regents
exams is that teachers may benefit directly from high test scores, even in the absence of account-
ability concerns. To test whether manipulation is sensitive to teacher incentives in this way, Panel
D of Figure 3 plots the distribution of core Regents exam scores for schools participating in a
randomized experiment that explicitly linked Regents scores to teacher pay for the 2007-2008 to
2009-2010 school years (Fryer 2013).28 We find that control schools manipulated 44.2 (se=0.27)
percent of in-range exams taken during the experiment, which is higher than our estimate of 41.3
(se=0.23) percent manipulated in treated schools. These results further suggest that manipulation
is not driven by formal teacher incentives, at least not as implemented in New York City during
this time period.
High School Graduation: A final explanation we consider is that teachers manipulate simply to
permit students to graduate from high school, even if it is with the lowest diploma type available to
them. To see whether manipulation is driven mainly by a desire just to get students over the bar
for high school graduation, we examine the distribution of scores for optional tests that students
take to gain greater distinction on their diploma and possibly strengthen their college application.
Appendix Figure A9 plots frequency distributions for scores on exams in Chemistry, Physics, and
Math B (an advanced math exam). On all three exams, we see clear patterns consistent with
manipulation, particularly at the 65 cutoff, which does not support the idea that the goal of
manipulation is mainly geared towards meeting basic graduation requirements. Using information
from only the 65 point cutoff, we estimate that 3.4 (se=0.03) percent of these elective Regents
exams were manipulated in total, and that 37.3 (se=0.19) percent were manipulated among those
28The experiment paid treated schools up to $3,000 for every union-represented staff member if the school met theannual performance target set by the DOE. The performance target for high schools depended on student attendance,credit accumulation, Regents exam pass rates in the core subjects, and graduation rates. Fryer (2013) finds no effectof the teacher incentive program on teacher absences or student attendance, behavior, or achievement. See Fryer(2013) for additional details.
19

with scores within the range just below the cutoff. The latter is only a few percentage points less
than the amount of in-range manipulation for core Regents exams.
In sum, these estimates suggest that manipulation was unrelated to the institutional incentives
created by school accountability systems, formal teacher pay-for-performance programs, or concerns
about high school graduation. Instead, it seems that the manipulation of test scores may have
simply been a widespread “cultural norm” among New York high schools, in which students were
often spared any sanctions involved with barely failing exams, including retaking the test or being
ineligible for a more advanced high school diploma. It is of course possible that a more specific
cause of the manipulation may be uncovered, but, perhaps due to limitations in our data, we are
unable to do so. For example, we do not have information on the specific administrators and
teachers responsible for grading each exam. Perhaps with this information, one might be able to
identify systematic characteristics of individuals whose behavior drives this practice.
V. The Causal Effect of Test Score Manipulation on Educational Attainment
A. The End of Manipulation: Estimates from 2011-2013
On February 2, 2011, the Wall Street Journal published an expose piece regarding manipulation
on the Regents exams, including an analysis of state-wide data that reporters had obtained via
a FOIA request and shared with the authors of this paper. The New York Times published a
similar story and the results of its own analysis on February 18th, including a statement by a
New York State Education Department official that acknowledged the existence of anomalies in
the Regents score distribution had been known for some time. In May 2011, the New York State
Board of Regents ordered schools to end the longstanding practice of re-scoring math and science
exams with scores just below the proficiency cutoffs, and included explicit instructions on June
2011 exams in all subject areas specifying that “schools are no longer permitted to re-score any of
the open-ended questions on this exam after each question has been rated once, regardless of the
final exam score.”29
In October 2011, the Board of Regents further mandated that teachers would no longer be
able to score their own students’ state assessments starting in January 2013. In response, the
NYCDOE implemented a pilot program to grade various January 2012 and June 2012 core exams
at centralized locations. Out of the 330 high schools in our sample offering Regents exams in 2012,
27 participated in the pilot program for the January exams, and 164 high schools participated for
the June exams. Our comparisons of pilot and non-pilot schools (see Appendix Table A6) and our
conversations with NYCDOE officials suggests there was no systematic selection of pilot schools
and no major differences in their observable characteristics.30
29See for example: http://www.nysedregents.org/integratedalgebra/811/ia-rg811w.pdf30Specifically, while students in pilot schools are more likely to be white and less likely to be Hispanic than students
in non-pilot schools, there are not statistically significant differences in 8th grade test scores or performance on coreRegents exams in the baseline period. NYCDOE officials indicated there was no targeting or specific formula used
20
In this section, we explore the implications of these swift, widespread, and arguably exogenous
changes to the Regents grading policies on the extent of manipulation. Figure 4 plots the empirical
distribution of test scores for core Regents exams taken in June between 2010, prior to the expose,
and 2013, by which time all of New York City’s high schools used centralized scoring. We plot the
results separately by participation in the 2012 pilot program to grade exams centrally. We also
calculate manipulation only around the 65 cutoff, as the score of 55 was no longer a relevant cutoff
for the vast majority of students in these cohorts (see Appendix Table A1). In June 2010, pilot
and non-pilot schools manipulated 73.2 (se=0.99) and 62.4 (se=0.52) percent of in-range exams,
respectively.31 When schools were told not to re-score exams below the cutoff in June 2011, in-range
manipulation dropped to 17.2 (se=0.46) and 13.0 (se=0.26) percent in pilot and non-pilot schools,
respectively. Thus, the extent of manipulation was greatly reduced, but clearly not eliminated,
when state officials explicitly proscribed the practice of re-scoring exams with scores just below the
proficiency cutoffs. Using the variation created by the pilot program, we find a clear role for the
centralization of scoring in eliminating score manipulation. In June 2012, in-range manipulation
dropped from 17.2 (se=0.46) percent to a statistically insignificant 0.44 (se=0.31) percent in pilot
schools, but remained fairly steady in non-pilot schools at 12.3 (se=0.27) percent compared to
13.0 (se=0.26) percent in the prior year. In June 2013, when both pilot and non-pilot schools had
adopted centralized grading, manipulation appears to have been completely eliminated. Of course,
we cannot say whether centralization by itself would have eliminated manipulation in absence of
the state’s statements regarding re-scoring marginal exams, since we do not observe high schools
operating under these conditions.
At the time that policy changes eliminated the practice of score manipulation, it was unclear
if this would have important long-term implications for students’ academic achievement and at-
tainment. After all, students whose exams would have been manipulated may simply have retaken
and passed the test shortly thereafter. Only now are we able to observe key outcomes, like high
school graduation, for the cohorts of students potentially impacted by these policy changes. In the
next section, we use these arguably exogenous policy changes to help identify the causal impact
of manipulation. Armed with these estimates, we then gauge the degree to which the longstand-
ing practice of manipulation may have distorted levels and gaps in academic achievement among
various groups of students.
to select schools, and that recruitment was driven through high school “networks,” i.e., mandatory but self-selectedaffiliations of 20-25 schools who collaborate on administrative tasks. Network affiliation explains roughly 30 percentof pilot participation using random effects regressions. About half of the high schools in the NYCDOE share theirbuilding with another high school, and it is clear that co-located schools exhibited similar participation. For example,among the roughly one-third of high schools that co-located in buildings with four or more high schools, buildinglocation explains almost 90 percent of the variation in participation.
31As can be seen in Figure 4, in-range manipulation in 2010 across both the 55 and 65 cutoffs was above 60percent, although manipulation had greatly decreased at the 55 cutoff (which was no longer relevant for almost allstudents taking exams in 2010) and manipulation at 65 was substantial. Appendix Figure A10 shows manipulationfor pilot and non-pilot schools for each of the pre-reform years 2004 to 2009. Manipulation is fairly stable over thistime period, with the decreasing (increasing) importance of the 55 (65) cutoff becoming apparent starting in 2008.
21
B. Estimating the Effect of Test Score Manipulation on Later Outcomes
The goal of our analysis is to estimate the impact of having a score inflated above cutoff c on
outcomes such as high school graduation Gi. Two important issues complicate direct estimation of
these effects. First, we do not observe the bias component φ(i, h, c) for any particular student or
school, making it impossible to distinguish students who would have passed an exam on their own
from students who only passed due to test score manipulation. Second, the bias component φ(i, h, c)
is likely to be correlated with unobserved determinants of high school graduation such as student
ability or motivation. For example, it is plausible that teachers are more likely to inflate the test
scores of high-performing students that just had a “bad day” on a particular exam administration.
The correlation between grading bias φ(i, h, c) and unobserved student traits εiet could potentially
bias cross-sectional estimates even if the bias term φ(i, h, c) was observed.
Rather than try to distinguish individual students whose scores were manipulated, we use a
difference-in-differences approach that exploits the sharp reduction in score manipulation following
New York’s policy changes starting in 2011. Intuitively, we compare the evolution of outcomes for
students with scores in the manipulable range, pre- and post-reform, to the evolution of outcomes
for students with scores just above the manipulable range. The latter group of students helps us
establish a counterfactual of what would have happened to the outcomes of students scoring in the
manipulable range if the grading reforms had not been implemented. We focus on the margin of
scoring 65 points or above, the most relevant score cutoff for high school graduation in this time
period (see Appendix Table A1).
Formally, we estimate the reduced form impact of the grading reforms using the following
specification:
yiet = Wietα11 +Xiθ11 + γ11 · 1[ce ≥ siet ≥M−ce] ·Reformt + εiet (11)
where yiet is the outcome of interest for student i who took exam e at time t and Reformt is
an indicator for exam e being taken following the grading reforms implemented in 2011. Wiet
represents a set of control variables including high school fixed effects, 10-point score bin (i.e.,
30-39, 40-49, etc.) by subject fixed effects, year by subject fixed effects, and 10-point score bin by
subject linear trends, where scores in the range [ce + 1, 70) are included together in the same bin
as scores from 70-79.32 We add these controls for secular time trends by subject and achievement
level to account for the increasingly stringent graduation requirements during this time period (see
Appendix Table A1). Xi includes individual controls for gender, ethnicity, free lunch eligibility, and
8th grade test scores.33 We also control for any effect of the grading reforms on students scoring
32An important assumption is that students with scores within the manipulable range[M−
ce, ce]
are comprised ofa students with similar “expected” scores (s∗ in our framework) over time. For math and science,
[M−
ce, ce]
is alwaysthe range from 60 to 65. But for Global History, the manipulable range is either 60-67 or 60-68 depending on theyear of test administration. For consistency, we always use the range 60-68 in defining the set of students “treated”by the reforms for Global History. Similarly, for English and U.S. History (which are not used in our main resultsbut are included in some appendices), we use the range 60-69.
33Importantly, our results are quite stable even if we drop all of our controls for students’ pre-existing observable
22

between 0-59, as these students are also likely to be affected by the reform if or when they retake
the exam. Results are similar if we drop all students scoring at or below 59 (see Section V.D). We
stack student outcomes across Regents exams (i.e., include multiple exams for each student) and
adjust our standard errors for clustering at both the student and school level.
The parameter γ11 can be interpreted as the differential effect of the reform on students scoring
in the range [M−ce, ce] on an exam compared to students scoring in the range [ce + 1, 100] on the
same exam. As the reform eliminated manipulation, we might expect our estimates of γ11 to be
negative for outcomes such as passing the exam and graduating from high school. However, the
key identifying assumption is that changes in outcomes for students scoring in the manipulable
range at the time of the reforms would have been identical to changes for students scoring above
the manipulable range in the absence of the Regents grading reforms (and conditional on our other
controls). This assumption would be violated if the implementation of the grading reforms was
coincident with unobservable changes in the types of students in each group. For example, our
identifying assumption would be violated if unobservably better students initially scoring a 65
(which is always in the manipulable range) had their scores manipulated to 70 (which is always
above the manipulable range) prior to but not after the reform. However, the evidence discussed
above and presented in Appendix Figure A5 shows no evidence of test score manipulation outside
our defined manipulable range. In Section V.D, we also present several tests in support of our
approach.
We also present two-stage least squares estimates that provide the local average treatment effect
of passing a Regents exam due to test score manipulation. The first stage regression takes the form:
Passiet = Wietα12 +Xiθ12 + γ12 · 1[ce ≥ siet ≥M−ce] ·Reformt + εiet (12)
where γ12s measures the effect of the grading reform on the probability of scoring at 65 points or
above on the Regents exam. The associated second stage regression takes the form:
yiet = Wietα13 +Xiθ13 + γ13 · Passiet + εiet (13)
Data limitations prevent us from measuring impacts on later outcomes such as college graduation
or labor market earnings.34 A number of studies estimate significant positive returns to a high
school diploma (e.g., Jaeger and Page 1996, Ou 2010, Papay, Willett, and Murnane 2010) and to
additional years of schooling around the dropout age (e.g., Angrist and Krueger 1991, Oreopoulos
characteristics. For example, in unreported results, we find that the estimated two-stage least squares coefficientfor the effect of manipulation on graduating high school without controls is 0.158. Controlling for both observablecharacteristics and school fixed effects only slightly increases our estimate to 0.167 (Column 5 of Table 6). Theseresults suggest that, under the reasonable assumption that students’ unobservable characteristics are correlated withobservable characteristics (e.g., Altonji, Elder, and Taber 2005), our results are unlikely to be driven by studentselection into our sample.
34We lack college attendance information on recent cohorts affected by the grading reforms that drive our iden-tification strategy. A previous draft of this study (Dee et al. 2016) includes an examination of college attendancefor earlier cohorts using cross-sectional regressions that rely on much stronger assumptions and produced somewhatimprecise results.
23

2007, Brunello, Fort, and Weber 2009). A recent study also finds positive returns to passing the
Baccalaureate high school exit exam in France using a regression discontinuity design (Canaan and
Mouganie 2018). Conversely, an important study by Clark and Martorell (2014) finds negligible
returns to passing “last chance” high school exit exams in the state of Texas. Note that Texas’ last
chance exam takers are an extremely negatively selected sample, i.e., students who failed high school
exit exams multiple times and exit high school regardless of the outcome of their last attempt, and
the results from their study may not be applicable to our setting.
C. Main Results
Before turning to our difference-in-differences estimates, we begin with a descriptive examination
of student test outcomes over the period between 2004 and 2013 for students with scores in the
range [M−ce, ce] (i.e., students likely to be affected by test score manipulation). We focus on the
Science, Math, and Global History core exams which are typically taken first in 9th or 10th grade.35
Using this sample, we run a regression of student outcomes on interactions of exam subject and
year indicators. This allows us to examine differential pre-trends in the outcomes of students with
exam scores that may have been subject to manipulation, and to assess visually whether there is
a post-reform change in outcomes consistent with the change in manipulation documented above.
Recall that we stack student outcomes across Regents exams (i.e., include multiple exams for each
student) and adjust our standard errors for clustering at both the student and school level.
Coefficient estimates from these regressions for student test outcomes are presented in Figure
5. In Panel A we see results for whether a student passed with a score of 65 or above the first
time they took the exam, the first stage dependent variable in Equation (12). The figure shows a
smooth upward trend in the probability of passing during the pre-reform period and then a sudden
drop of more than 25 percentage points following the implementation of the grading reforms in
2011. The pre-trend is consistent with the greater emphasis on the 65 point cutoff during the pre-
reform period and supports our inclusion of controls for differential linear trends for students with
marginal scores in our difference-in-differences specification. The post-2011 drop strongly supports
the idea that the Regents grading reforms significantly decreased test score manipulation. Panel
A also shows results for whether a student was able to pass with a score of 65 or more within
one year and within two years of taking the exam for the first time. These plots provide a visual
assessment of whether students who did not pass due to the reforms were eventually able to do so.
The post-2011 drop in passing rates within one and two years are around 20 percentage points and
10 percentage points, respectively, suggesting that a majority of the students who failed because
the reforms caused teachers not to manipulate their scores were able to retake and pass the exam
35As will be shown below, the policy reforms made it more difficult to pass Regents exams, and this could in turnchange the composition of students who “make it” to the English and U.S. History exams taken closer to graduation.Consistent with this argument, we find no systematic changes in the characteristics of students taking the LivingEnvironment, Math A/Integrated Algebra, and Global History exams following the reforms (see Appendix TableA7), but we find a shift towards higher 8th grade test scores for students taking the English and U.S. History exams.These results are available on request. For completeness, we also present difference-in-difference estimates based onall core exams and based on each core exam separately in Appendix Table A8.
24

within two years.
Panel B of Figure 5 explores the issue of re-taking further by plotting rates of test retaking within
one and two years of a student’s first exam attempt.36 There is a clear spike upward in re-taking
behavior after the reforms and re-taking within two years rises by even more, with magnitudes
suggesting that the majority of marginal students who failed due to the lack of manipulation in
the post-reform period tried to re-take the exam after further study. Panels C and D of Figure
5 shows results for the probability of scoring well in excess of the passing cutoff (70+ and 75+)
within two years of the first-time taking the exam. This plot shows visual evidence of the extent
to which students who (due to the reforms) failed and re-took exams eventually demonstrated a
significantly higher level of subject matter knowledge. These plots show increases in the fraction
of high eventual scores among students who had initially scored in the manipulable range around
the cutoff, with larger increases at lower thresholds like 70+ but still a noticeable increase even at
scores of 75+.
Altogether, the descriptive evidence in Figure 5 suggests that the policy reforms had three
short-run effects: (1) a significant fraction of students with scores near the 65 cutoff failed because
their scores were not manipulated; (2) the majority, but not all, of these marginal failing students
re-took the exams and eventually passed; (3) the marginal failing students re-taking exams, on
average, increased their knowledge of the tested subject matter and some achieved reasonably
high test scores. We provide more evidence of these effects in difference-in-differences regressions;
these include all test takers and additional controls discussed above for Equation (11), including
linear trends for each score bin. The “reduced form” regression results are quite consistent with
our graphical analysis (Table 5). Initial pass rates are estimated to have fallen by 27.2 (se=1.0)
percentage points, while pass rates within one and two years fell by 20.2 (se=0.9) and 11.0 (se=0.8)
percentage points, respectively. Retaking within one year and two years rose by an estimated
15.4 (se=1.1) and 18.7 (se=1.1) percentage points. Finally, the probability of achieving higher
scores (70+, 75+, 80+, and 85+) are all estimated to have increased after the reforms, with
estimated effects of 9.6 (se=0.5) percent for 70+, 3.8 (se=0.4) percent for 75+, and between 1.3
(se=0.2) and 0.6 (se=0.2) percentage points for even higher scores. We also provide two-stage
least squares estimates which scale up the reduced form coefficients by the first-stage coefficient of
-0.27 (se=0.01) and can be interpreted as the impact of test score manipulation on students whose
scores were manipulated. For example, we estimate that manipulation reduced two-year re-taking
rates by 70.3 (se=2.6) percentage points, increased passing rates within two years by 41.5 (se=2.3)
percentage points, and decreased the probability of scoring 75 or higher within two years by 14.4
(se=1.5) percentage points.
We now turn to examine the impact of the reforms on high school graduation and coursework
completion. We focus on students entering high school between 2003-2004 and 2010-2011 for
whom we can observe these outcomes.37 Again, before turning to the full difference-in-difference
36We do not look beyond two years since two of the three exams on which focus are typically taken in 10th grade.37For completeness, Appendix Figure A11 displays graphical evidence of the impacts on test-taking outcomes for
the same sample that we use to estimate effects on graduation and advanced course taking.
25
regressions, we present plots that help assess our identifying assumption of parallel trends and
visually illustrate changes in outcomes coincident with the grading reforms. Figure 6 shows year-
specific coefficients for having a test score in the manipulable range in the range [M−ce, ce], taken from
regressions that include test takers with scores in the range [ce + 1, 100], score bin fixed effects, and
year effects. Our omitted year is 2010, the year prior to the reform, so these coefficients should thus
be interpreted as the year-specific differences in outcomes between students with marginal scores
and those safely above the manipulable range in each year, relative to 2010. In Panel A, we see that
graduation rate differences between these groups of test-takers were fairly stable between 2004 and
2010 but then fall by almost 4 percentage points between 2010 and 2011 and remain significantly
lower thereafter. Panel B shows results for students completing the course requirements for a
Regents diploma; here we see no trends and no break after the reform period, suggesting no overall
effect on this margin of course-taking for the marginal failing students. Panel C shows results for
students completing the Advanced Regents diploma course requirements. Here there is evidence of
a slight upward trend prior to 2011 and then a clear rise in Advanced Regents course taking in the
post-reform years.
Table 6 shows results from our difference-in-difference regressions, which include all test-takers,
score-bin fixed effects and linear trends, and controls for student characteristics.38 The “reduced
form” coefficient indicates that students scoring in the manipulable range are 4.6 (se=0.6) per-
centage points less likely to graduate high school following the grading reforms. Two-stage least
squares estimates suggest that the local average treatment effect of passing a Regents exam due
to test score manipulation is an increase in the probability of graduating from high school of 16.7
(se=2.1) percentage points. In other words, we estimate that one out of every six “marginal” Re-
gents passers would not have graduated from high school if their scores had not been manipulated.
In line with Figure 6, having an exam manipulated does not have a statistically significant effect
on the probability of taking the requirements for a Regents diploma, the lowest diploma for most
students during this time period, but reduces the probability of taking the requirements for the
Advanced Regents diploma by 9.8 (se=5.1) percentage points.
Together these results provide clear evidence that the grading reforms’ elimination of manipu-
lation led to many additional students failing Regents exams. Broadly speaking, only a minority of
these “marginal failures” saw changes in ultimate outcomes such as graduation and course comple-
tion. Many of these students – roughly 50 percent according to our estimates – re-took and passed
the exams within two years and went on to graduate from high school with a normal Regents
diploma. Many others – about 23 percent by our estimation – were never able to pass the exam
but would not have graduated from high school regardless (e.g., they would have failed another re-
quired exam or some other graduation requirement). For those remaining students whose outcomes
were altered by the reforms, we find evidence of two very different causal effects. We estimate that
about 17 percent of these students were never able to pass and did not graduate from high school,
38We also present results with and without school fixed effects, but these controls have very little impact on ourestimates.
26
but would have if their scores had been manipulated.39 Thus the reforms, by eliminating manipula-
tion, had a clear negative effect on academic attainment for this subset of test-takers. However, our
estimates also suggest that about 10 percent of students re-took and passed the exams at a later
date, some likely scoring considerably higher than before due to additional study, and went on to
take the coursework required for an Advanced Regents diploma.40 For this subset of students, the
elimination of manipulation seems to have had a positive effect on academic attainment, although
it did require additional effort to pass the required exams.
We attempt to shed further light on the mechanisms underlying our results by examining
additional outcomes and focusing on individual exams (see Appendix Table A8). First, the impacts
on high school graduation were not driven by a particular exam among the three used in our
main results (Living Environment, Math A/Integrated Algebra, and Global History). Second, the
estimated effects on Advanced Regents course taking appear to be driven by enrollment in advanced
math (rather than science) courses, and by students “marginally failing” the Math A/Integrated
Algebra exam due to the grading reforms (Appendix Table A8). We also note that manipulation
on the Global History exam is estimated to have a positive impact on taking advanced math; this
could be driven by failing students having to re-take Global History when they otherwise would
enroll in advanced math.
Overall, our results support the idea that test score manipulation has somewhat nuanced effects.
Some students are “helped” by test score manipulation because they are not forced to retake and
pass an exam or a course required to leave high school. Others are “hurt” by test score manipulation
because they are not pushed to gain a solid foundation in the introductory material that the more
advanced coursework requires. It is difficult to ascertain which students are likely to be affected
by manipulation in these ways, but we run several tests to see if the effects of manipulation were
heterogeneous across different types of students. We explore this in Table 7, which reports two-stage
least squares estimates for mutually exclusive student subgroups.41 Estimated effects on high school
graduation are not statistically different by gender or race; they are somewhat larger for students
with higher baseline test scores, but these are marginally significant and we have not adjusted
p-values for multiple comparisons. Unfortunately, data on absences and disciplinary incidents is
not available for the most recent cohorts, so we cannot test heterogeneity along this dimension.
39The magnitude of our estimate is broadly consistent with related results from other states. Clark and Martorell(2014) find an increase of 40 to 50 percentage points in Texas but these students are taking their “last chance” exam.In contrast, Papay et al. (2010) find an increase of about 8 percentage points in Massachusetts for students who canre-take the exam up to four times.
40It would be ideal if we could link directly those students who went on to re-take and get higher scores toadvanced coursework but this is of course not possible given our estimation method. However, we can ask thequestion of whether the additional higher scores we estimate were caused by re-taking among marginal failures mightreasonably explain higher rates of Advanced course-taking. To do so, we take the estimated percentage of marginalfailures scoring [70, 75), [75,80), [80,85), and [85-90) – i.e., we assume those above 85 are lower than 90 – and multiplyby the average Advanced regents course-taking for all students with scores each of these bins. This calculation wouldimply an increase of 14.1 percentage points in Advanced Regents coursework, well within the confidence range forour difference-in-difference estimate of 9.8 percentage points.
41For completeness, Appendix Figure A12 shows our year-specific coefficients for having a test score in the ma-nipulable range
[M−
ce, ce], taken from regressions that include test takers with scores in the range [ce + 1, 100], score
bin fixed effects, and year effects by subgroup.
27

D. Robustness Checks
Alternative Attainment Measures: Most Regents exams are taken well before the end of high
school, and failing an exam may affect whether students progress towards graduation or drop out,
i.e., potentially altering their educational investments. This is one of the ways in which our setting
is different than the “last chance” exams examined by Clark and Martorell (2014). We therefore
examine two additional measures of secondary school attainment: the highest high school grade in
which the student is enrolled in NYC public schools and the number of years the student is enrolled
in NYC public high schools.42 We select these two measures because they represent two opposing
ways to address the issue of grade repetition, i.e., if a student is forced to repeat a grade, does
this repeated year of education represent additional educational attainment? Attainment based on
highest grade does not count repetition as attainment, while attainment based on years enrolled
counts repetition fully. Two-stage least squares estimates (Panel C of Appendix Table A9) show
large effects of manipulation on both of these attainment measures: 0.29 (se=0.03) grade levels
and 0.39 (se=0.03) school years. These results suggest that manipulation lengthened the extent
of secondary educational investment for marginal students and did not just provide diplomas to
students who were already at the very end of their high school careers. These positive effects are
notable given that manipulation allows students to avoid re-taking a course and might have been
expected to shorten the number of years spent in school for some students.
Our main estimates focus on four-year graduation. However, it is possible that test score
manipulation reduces time to graduation while having little impact on longer run educational
attainment. Panel D of Appendix Table A9 shows that having a score manipulated also increases
the probability of graduating from high school in five years by 20.3 (se=2.2) percentage points,
and the probability of graduating from high school in six years by 15.6 (se=1.9) percentage points.
While it is possible that the reforms also affected GED receipt, only about 1 percent of students
in our sample appear to receive a GED within six years of starting high school. This suggests that
either GED is an unimportant margin or, more likely, our data on GED receipt is of poor quality.
Alternative Specifications: Appendix Table A10 presents estimates using a variety of specifications
and instruments to assess the robustness of our main two-stage least squares results further. Column
1 replicates our main results. Column 2 limits the control group to students scoring from just above
the manipulable range to 80. Column 3 limits the control group to students scoring between 81-
100. Column 4 uses the interactions of scoring in the manipulable range and year-specific indicators
for taking the test between 2011-2013 for a total of three instrumental variables. Column 5 adds
an interaction with an indicator for participating in the centralized grading pilot program for a
total of six instrumental variables. None of the point estimates are meaningfully different from our
preferred estimates in Table 6.
Placebo Estimates: To test for potential sources of bias in our main specification, we estimate a
42Since we only observe the most recent cohort for four years since high school entry, we calculate highest gradeattained within four years of entry and cap the number of years enrolled in high school at four.
28
series of placebo regressions where the dependent variable is a fixed student characteristic, rather
than a student outcome. These estimates are shown in Panel A of Appendix Table A7. We
find a statistically significant coefficient for only one out of seven student characteristics (a 2.45
(se=0.76) percentage point increase in students eligible for free or reduced-price lunch), and all of
the estimates are small and economically trivial. We also examine differences in predicted outcomes
(i.e., graduation, Regents, and Advanced Regents), where predictions are based on pre-reform cross-
sectional regressions using all of the baseline characteristics listed in Panel A of Appendix Table A7.
Consistent with our identifying assumption, we find no statistically significant differences following
the elimination of re-scoring.
E. Aggregate Implications
Our estimates from this section suggest that test score manipulation had economically important
effects on student outcomes. In light of the differential benefits of manipulation documented in
Section IV.C, our estimates suggest that test score manipulation also had important distributional
effects. To quantify these effects, we multiply the two-stage least squares estimate from Table 7
by the subgroup-specific total manipulation estimates from Appendix Figure A8. We calculate all
numbers at the student level, not the student by exam level.
These back-of-the-envelope calculations suggest that test score manipulation has important
implications for aggregate graduation rates in New York. Our point estimates suggest that the
fraction of students in our sample graduating from high school would have decreased from 76.6
percent to 75.6 percent without test score manipulation. In other words, test score manipulation
allowed about 1,000 additional students to graduate each year from the New York City school
system.43
In contrast, our results suggest that test score manipulation only modestly affected relative
performance measures in New York City. For example, we estimate that the black-white gap in
graduation rates would have increased from 15.6 percentage points to 16.1 percentage points in
the absence of test score manipulation, while the graduation gap between high- and low-achieving
students would have increased from 25.0 percentage points to 25.1 percentage points.
VI. Conclusion
In this paper, we show that the design and decentralized, school-based scoring of New York’s high-
stakes Regents Examinations led to the systematic manipulation of student test scores just below
important performance cutoffs. We find that approximately 40 percent of student test scores near
the performance cutoffs are manipulated. Our findings indicate that test score manipulation was
widespread and that it had significant effects on the overall performance of students across and
within New York public schools.
43The high school graduation rate is higher in our sample compared to the district as a whole (65.2 percent)because we drop students in special education, students in non-traditional high schools, and students without at leastone core Regents score.
29

Exploiting a series of exogenous grading reforms, we find that test score manipulation has a
substantial impact on educational attainment for students on the margin of passing an exam. For
these marginal students, having a score manipulated above a cutoff increases the probability of
graduating from high school by approximately 17 percentage points, or more than 21 percent. In
other words, while about 80 percent of marginal students would have eventually passed the exam
without test score manipulation, a significant number would have dropped out of school. However,
we also find that having a score manipulated above a cutoff leads a subset of marginal students, who
no longer have to study for and retake the exam, to opt out of more advanced coursework. These
mixed results serve as an important reminder that lowering the bar for high school graduation
can increase attainment for students who would otherwise struggle, but decrease attainment for
students who may benefit from a “push” towards higher achievement.
Why did the practice of manipulation of Regents exams become so widespread prior to the
reforms? While we are unable to answer this question in a definitive manner, we are able to
exclude a number of potential causes, such as test-based school accountability systems or test-
based teacher incentive programs. A remaining explanation, consistent with the evidence, is that
manipulation is simply driven by teachers’ common desire to help their students avoid the costs
associated with failing an exam.
A clear advantage of studying manipulation on a standardized exam with clear rules is that
we can be precise in our measurement of the magnitude of manipulation and how this magnitude
varies across students and settings. While New York was unusual in allowing high-stakes exams
to be locally graded by teachers, it is important to keep in mind that the primary measures of
student achievement in most educational settings are course grades, which are almost exclusively
locally graded and are often a requirement for advanced high school course eligibility, high school
graduation, and college admissions. Our results suggest that teachers are also likely to manipulate
to some degree on course exams and grades in order to help students avoid failure. Our evidence
on the patterns of manipulation (e.g., more likely for marginal students who are white and Asian
than for those who are Black or Hispanic) may be relevant in other dimensions of teacher behavior,
such as discipline, classroom engagement, and grading.
An important limitation of our analysis is that we are only able to estimate the effect of elim-
inating manipulation on educational attainment. While we find clear evidence that manipulation
leads many marginal students to spend more time in school and graduate from high school, we also
find that a subset of these students are less likely to take more advanced courses. There may also
be important general equilibrium effects of eliminating test score manipulation, such as changing
the signaling value of course grades or a high school diploma. Estimating the long-run impacts of
manipulation on labor market outcomes remains an important area for future research.
30

References
[1] Altonji, Joseph G., Todd E. Elder, and Christopher R. Taber. 2005. “Selection on Observed and
Unobserved Variables: Assessing the Effectiveness of Catholic Schools.” Journal of Political
Economy, 113(1): pp. 151-184.
[2] Apperson, Jarod, Carycruz Bueno, and Tim R. Sass. 2016. “Do the Cheated Ever Prosper? The
Long-Run Effects of Test-Score Manipulation by Teachers on Student Outcomes.” CALDER
Working Paper 155.
[3] Angrist, Joshua, and Alan Krueger. 1991. “Does Compulsory Schooling Attendance Affect
Schooling and Earnings?” Quarterly Journal of Economics, 106(4): 979-1014.
[4] Angrist, Joshua, Erich Battistin, and Daniela Vuri. 2017. “In a Small Moment: Class Size and
Moral Hazard in the Mezzogiorno.” American Economic Journal: Applied Economics, 9(4):
216-249.
[5] Beadie, Nancy. 1999. “From Student Markets to Credential Markets: The Creation of the
Regents Examination System in New York State, 1864-1890.” History of Education Quarterly,
39(1): 1-30.
[6] Borcan, Oana, Mikael Lindahl, and Andreea Mitrut. 2017. “Fighting Corruption in Education:
What Works and Who Benefits?” American Economic Journal: Economic Policy, 9(1): 180-
209.
[7] Brunello, Giorgio, Margherita Fort, and Guglielmo Weber. 2009. “Changes in Compulsory
Schooling, Education and the Distribution of Wages in Europe.” The Economic Journal,
119(536): 516-539.
[8] Burgess, Simon, and Ellen Greaves. 2013. “Test Scores, Subjective Assessment and Stereotyp-
ing of Ethnic Minorities.” Journal of Labor Economics, 31(3): 535-576.
[9] Canaan, Serena, and Pierre Mouganie. 2018. “Returns to Education Quality for Low-Skilled
Students: Evidence from a Discontinuity.” Journal of Labor Economics, 36(2) 395-436.
[10] Chetty, Raj, John Friedman, Tore Olsen, and Luigi Pistaferri. 2011. “Adjustment Costs,
Firm Responses, and Micro vs. Macro Labor Supply Elasticities: Evidence from Danish Tax
Records.” The Quarterly Journal of Economics, 126(2): 749-804.
[11] Chetty, Raj, John Friedman, and Jonah Rockoff. 2014. “Measuring the Impacts of Teachers
I: Evaluating Bias in Teacher Value-Added Estimates.” American Economic Review, 104(9):
2593-2632.
[12] Chudowsky, Naomi, Nancy Kober, Keith Gayler, and Madlene Hamilton. 2002. “State High
School Exit Exams: A Baseline Report.” Center on Education Policy, Washington DC.
31

[13] Clark, Damon, and Paco Martorell. 2014. “The Signaling Value of a High School Diploma.”
Journal of Political Economy, 122(2): 282-318.
[14] Cunha, Flavio and James J. Heckman. 2010. “Investing in Our Young People.” NBER Working
Paper No. 16201.
[15] Cunha, Flavio, James J. Heckman, and Susanne M. Schennach. 2010. “Estimating the Tech-
nology of Cognitive and Noncognitive Skill Formation.” Econometrica, 78(3): 883-931.
[16] Cullen, Julie, and Randall Reback. 2006. “Tinkering Toward Accolades: School Gaming Under
a Performance Accountability System.” Advances in Applied Microeconomics, vol 14., eds.
Timothy J. Gronberg & Dennis W. Jansen.
[17] Dee, Thomas, Brian A. Jacob, Justin McCrary, and Jonah Rockoff. 2011. “Rules and Discretion
in the Evaluation of Students and Schools: The Case of the New York Regents Examinations.”
Mimeo.
[18] Dee, Thomas, Will Dobbie, Brian Jacob, and Jonah Rockoff. 2016. “The Causes and Conse-
quences of Test Score Manipulation: Evidence from the New York Regents Examinations.”
NBER Working Paper No. 22165.
[19] Diamond, Rebecca, and Petra Persson. 2016. “The Long-term Consequences of Teacher Dis-
cretion in Grading of High-stakes Tests.” NBER Working Paper No. 22207.
[20] Dobbie, Will, and Roland Fryer. 2014. “The Impact of Attending a School with High-Achieving
Peers: Evidence from the New York City Exam Schools.” American Economic Journal: Applied
Economics, 6(3): 58-75.
[21] Dustmann, Christian, Patrick Puhani, and Uta Schonberg. 2017 “The Long-Term Effects of
Early Track Choice.” Economic Journal, 127(603): 1348-1380.
[22] Ebenstein, Avraham, Victor Lavy, and Sefi Roth. 2016 “The Long-Run Economic Conse-
quences of High-Stakes Examinations: Evidence from Transitory Variation in Pollution.”
American Economic Journal: Applied Economics, 8(4): 35-65.
[23] Figlio, David, and Lawrence Getzler. 2006. “Accountability, Ability and Disability: Gaming
the System.” Advances in Applied Microeconomics, vol 14., eds. Timothy J. Gronberg &
Dennis W. Jansen.
[24] Fryer, Roland. 2013. “Teacher Incentives and Student Achievement: Evidence from New York
City Public Schools.” Journal of Labor Economics, 31(2): 373-407.
[25] Hanna, Rema, and Leigh Linden. 2012. “Discrimination in Grading.” American Economic
Journal: Economic Policy, 4(4): 146-168.
32
[26] Hinnerich, Bjorn, Erik Hoglin, and Magnus Johannesson. 2011. “Are Boys Discriminated in
Swedish High School?” Economics of Education Review, 30(4): 682-690.
[27] Jacob, Brian A. 2005. “Accountability, Incentives and Behavior: Evidence from School Reform
in Chicago.” Journal of Public Economics, 89(5-6): 761-769.
[28] Jacob, Brian A., and Steven Levitt. 2003. “Rotten Apples: An Investigation of the Prevalence
and Predictors of Teacher Cheating.” Quarterly Journal of Economics, 118(3): 843-877.
[29] Jacob, Brian A., and Jesse Rothstein. 2016. “The Measurement of Student Ability in Modern
Assessment Systems.” Journal of Economic Perspectives, 30(3): 85-107.
[30] Jaeger, David A., and Marianne E. Page. 1996. “Degrees Matter: New Evidence on Sheepskin
Effects in the Returns to Education.” Review of Economics and Statistics, 78(4): 733-740.
[31] Lavy, Victor. 2008. “Do Gender Stereotypes Reduce Girls’ or Boys’ Human Capital Outcomes?
Evidence from a Natural Experiment.” Journal of Public Economics, 92(10-11): 2083-2105.
[32] Lavy, Victor. 2009. “Performance Pay and Teachers’ Effort, Productivity, and Grading Ethics.”
American Economic Review, 99(5): 1979-2011.
[33] Lavy, Victor, and Edith Sand. 2015. “On the Origins of Gender Human Capital Gaps: Short
and Long Term Consequences of Teachers’ Stereotypical Biases.” NBER Working Paper No.
20909.
[34] National Research Council. 2011. Incentives and Test-Based Accountability in Education.
Committee on Incentives and Test-Based Accountability in Public Education, M. Hout and
S.W. Elliott, Editors. Board on Testing and Assessment, Division of Behavioral and Social
Sciences and Education. Washington, D.C.: The National Academies Press.
[35] Neal, Derek, and Diane Whitmore Schanzenbach. 2010. “Left Behind by Design: Proficiency
Counts and Test-Based Accountability.” Review of Economics and Statistics, 92(2): 263-283.
[36] Neal, Derek. 2013. “The Consequences of Using One Assessment System to Pursue Two Ob-
jectives.” NBER Working Paper No. 19214.
[37] New York State Education Department. 2008. History of Elementary, Middle, Secondary &
Continuing Education. http://www.regents.nysed.gov/about/history-emsc.html, last updated
November 25, 2008, accessed January 29, 2011.
[38] New York State Education Department. 2009. Information Booklet for Scoring the Regents
Examination in English. Albany, NY.
[39] New York State Education Department. 2010. General Education & Diploma Requirement,
Commencement Level (Grades 9-12). Office of Elementary, Middle, Secondary, and Continuing
Education. Albany, NY.
33
[40] Oreopoulos, Philip. 2007. “Do Dropouts Drop Out Too Soon? Wealth, Health and Happiness
from Compulsory Schooling.” Journal of Public Economics, 91(11-12): 2213-2229.
[41] Ou, Dongshu. 2010. “To Leave or Not to Leave? A Regression Discontinuity Analysis of
the Impact of Failing the High School Exit Exam.” Economics of Education Review, 29(2):
171-186.
[42] Papay, John P., Richard J. Murnane, and John B. Willett. 2010. “The Consequences of
High School Exit Examinations for Low-Performing Urban Students: Evidence from Mas-
sachusetts.” Educational Evaluation and Policy Analysis, 32(1): 5-23.
[43] Rockoff, Jonah, and Lesley Turner. 2010. “Short-Run Impacts of Accountability on School
Quality.” American Economic Journal: Economic Policy, 2(4): 119-147.
[44] Terrier, Camille. 2016. “Boys Lag Behind: How Teachers’ Gender Biases Affect Student
Achievement.” IZA Working Paper 10343.
[45] Tinkelman, Sherman. 1965. “Regents Examinations in New York After 100 Years.” Albany,
NY.
[46] Todd, Petra E., and Kenneth I. Wolpin. 2003. “On the Specification and Estimation of the
Production Function for Cognitive Achievement.” The Economic Journal, 113(485): F3-F33.
34

Figure 1: Test Score Distributions for Core Regents Exams, 2004-2010
Total Manipulation = 5.72 (0.02)In-Range Manipulation = 43.89 (0.13)
0.0
2.0
4Fr
actio
n
5 15 25 35 45 55 65 75 85 95Regents Exam Score
Non-Manipulable Score Manipulable Score
Note: This figure shows the test score distribution around the 55 and 65 score cutoffs for New York City highschool test takers between 2004-2010. Core exams include English Language Arts, Global History, U.S. History,Math A/Integrated Algebra, and Living Environment. We include the first test in each subject for each student inour sample. Each point shows the fraction of test takers in a score bin with solid points indicating a manipulablescore. The dotted line beneath the empirical distribution is a subject-by-year specific sixth-degree polynomial fittedto the empirical distribution excluding the manipulable scores near each cutoff. The shaded area represents eitherthe missing or excess mass for manipulable scores as we define based on the scoring guidelines described in SectionIII. Total manipulation is the fraction of test takers with manipulated scores. In-range manipulation is the fractionof test takers with manipulated scores normalized by the average height of the counterfactual distribution to the leftof each cutoff. Standard errors are calculated using the parametric bootstrap procedure described in the text. Seethe data appendix for additional details on the sample and variable definitions.
35

Figure 2: Distribution of School Manipulation Estimates, 2004-2010
(a) Total Manipulation
10th Pctile = 3.7
90th Pctile = 9.6
100
500
1000
5000
1000
0N
umbe
r of E
xam
s (L
og S
cale
)
0.0
25.0
5.0
75.1
Frac
tion
of S
choo
ls
0 5 10 15Total Manipulation
Total Exams In-Range Exams
(b) In-Range Manipulation
10th Pctile = 24.4 90th Pctile = 55.6
010
0020
0030
0040
0050
0060
00N
umbe
r of E
xam
s
0.0
25.0
5.0
75.1
Frac
tion
of S
choo
ls
0 25 50 75 100In-range Manipulation
Total Exams In-Range Exams
Note: These figures show the distribution of school manipulation estimates for core Regents exams around the 55and 65 score cutoffs for New York City high school test takers between 2004-2010. Panel (a) is total manipulationestimates aggregated across both cutoffs. Panel (b) is in-range manipulation estimates averaged across both cutoffs.The smooth lines show the relationship between the number of both total and in-range exams and manipulation atthe school level. See the text for additional details on the sample and empirical specification.
36

Figure 3: Results by School Accountability Pressure, 2001-2010
(a) Before and After School Accountability (b) NCLB Adequate Yearly Progress
Before School Accountability_________________________Total = 7.35 (0.04)In-Range = 59.98 (0.68)
After School Accountability________________________Total = 5.01 (0.04)In-Range = 42.38 (0.27)
0.0
2.0
4
5 15 25 35 45 55 65 75 85 95
Before School Accountability After School Accountability
Did Not Meet AYP________________Total = 6.31 (0.02)In-Range = 44.08 (0.13)
Met AYP________Total = 4.12 (0.03)In-Range = 43.81 (0.35)
0.0
2.0
4
5 15 25 35 45 55 65 75 85 95
Did Not Meet AYP Met AYP
(c) NYC Accountability Grade (d) Teacher Incentive Pay Experiment
Grade of D or F______________Total = 6.84 (0.03)In-Range = 43.42 (0.35)
Grade of A or B______________Total = 4.35 (0.03)In-Range = 42.06 (0.28)
0.0
2.0
4
5 15 25 35 45 55 65 75 85 95
Grade of D or F Grade of A or B
No Incentive Pay________________Total = 6.97 (0.04)In-Range = 44.16 (0.27)
Incentive Pay_____________Total = 6.62 (0.03)In-Range = 41.27 (0.23)
0.0
2.0
4
5 15 25 35 45 55 65 75 85 95
No Incentive Pay Incentive Pay
Note: These figures show the test score distribution around the 55 and 65 score cutoffs for New York City high schooltest takers. Panel (a) plots non-math core exams taken in 2000-2001 before the implementation of NCLB and theNYC Accountability System and in 2008-2010 after the implementation of both accountability systems. Panel (b)plots all core exams for schools that in the previous year did not make AYP under NCLB and schools that did makeAYP under NCLB for 2004-2010. Panel (c) plots all core exams for schools that in the previous year received aNYC accountability grade of A or B and schools that received a NYC accountability grade of D or F for 2008-2010.Panel (d) plots all core exams for schools in the control and treatment groups of an experiment that paid teachersfor passing Regents scores for 2008-2010. See the Figure 1 notes for additional details on the empirical specificationand the data appendix for additional details on the sample and variable definitions.
37

Figure 4: Test Score Distributions Before and After Grading Reforms, 2010-2013
(a) 2010: Re-Scoring and Decentralized Grading (b) 2011: No Re-Scoring and Decentralized Grading
Pilot School___________Total = 5.02 (0.03)In-Range = 73.17 (0.99)
Non-Pilot School________________Total = 4.95 (0.02)In-Range = 62.35 (0.52)
0.0
2.0
4Fr
actio
n
5 15 25 35 45 55 65 75 85 95
Pilot School Non-Pilot School
Pilot School___________Total = 1.13 (0.02)In-Range = 17.24 (0.46)
Non-Pilot School________________Total = 0.99 (0.02)In-Range = 13.01 (0.26)
0.0
2.0
4Fr
actio
n
5 15 25 35 45 55 65 75 85 95
Pilot School Non-Pilot School
(c) 2012: No Re-Scoring and Pilot of Centralized Grading (d) 2013: No Re-Scoring and Centralized Grading
Pilot School___________Total = -0.01 (0.02)In-Range = 0.44 (0.31)
Non-Pilot School________________Total = 0.95 (0.02)In-Range = 12.33 (0.27)
0.0
2.0
4Fr
actio
n
5 15 25 35 45 55 65 75 85 95
Pilot School Non-Pilot School
Pilot School___________Total = 0.03 (0.03)In-Range = 0.64 (0.29)
Non-Pilot School________________Total = 0.18 (0.02)In-Range = 1.44 (0.20)
0.0
2.0
4Fr
actio
n
5 15 25 35 45 55 65 75 85 95
Pilot School Non-Pilot School
Note: These figures show the test score distribution around the 65 score cutoff for New York City high school testtakers between 2010-2013 in June. Included core exams include English Language Arts, Global History, U.S. History,Integrated Algebra, and Living Environment. Panel (a) considers exams taken in 2010 when re-scoring was allowedand grading was decentralized in both pilot and non-pilot schools. Panel (b) considers exams taken in 2011 whenre-scoring was not allowed and grading was decentralized in both pilot and non-pilot schools. Panel (c) considersexams taken in 2012 when re-scoring was not allowed and grading was centralized in pilot schools but decentralizedin the non-pilot schools. Panel (d) considers exams taken in 2013 when re-scoring was not allowed and grading wascentralized in both pilot and non-pilot schools. See the Figure 1 notes for additional details on the sample andempirical specification.
38

Figure 5: Regents Grading Reforms and Regents Outcomes
(a) Scoring 65+ on Exam (b) Retaking of Exams-.4
-.3-.2
-.10
.1Re
duce
d Fo
rm C
oeffi
cient
2005 2007 2009 2011 2013Exam Year
Passed Exam: On First AttemptWithin 1 Year Within 2 Years
-.10
.1.2
.3.4
Red
uced
For
m C
oeffi
cien
t
2005 2007 2009 2011 2013Exam Year
Retake Exam: Within 1 YearWithin 2 Years
(c) Scoring 70+ on Exam (d) Scoring 75+ on Exam
-.10
.1.2
.3.4
Red
uced
For
m C
oeffi
cien
t
2005 2007 2009 2011 2013Exam Year
Scored 70+: Within 1 YearWithin 2 Years
-.10
.1.2
.3.4
Red
uced
For
m C
oeffi
cien
t
2005 2007 2009 2011 2013Exam Year
Scored 75+: Within 1 YearWithin 2 Years
Note: These figures plot the reduced form impact of the Regents grading reforms on Regents outcomes. The sampleincludes students taking core Regents exams between 2004-2013. We report reduced form results using the interactionof taking the test in the indicated year and score in the manipulable range. We control for an indicator for scoringbetween 0-59 in 2011-2013, 10-point scale score effects, and exam by year-of-test effects. We stack student outcomesacross the Living Environment, Math A/Algebra, and Global History exams and cluster standard errors at theindividual and school levels. See the text for additional details.
39

Figure 6: Regents Grading Reforms and High School Graduation
(a) Graduate High School (b) Regents Requirements Taken-.1
5-.1
-.05
0.0
5.1
.15
Red
uced
For
m C
oeffi
cien
t
2005 2007 2009 2011 2013Exam Year
-.15
-.1-.0
50
.05
.1.1
5R
educ
ed F
orm
Coe
ffici
ent
2005 2007 2009 2011 2013Exam Year
(c) Advanced Regents Requirements Taken
-.15
-.1-.0
50
.05
.1.1
5R
educ
ed F
orm
Coe
ffici
ent
2005 2007 2009 2011 2013Exam Year
Note: These figures plot the reduced form impact of the Regents grading reforms on high school graduation. Thesample includes students entering high school between 2003-2004 and 2010-2011 and taking core Regents examsbetween 2004-2013. We report reduced form results using the interaction of taking the test in the indicated year andscore in the manipulable range. We control for an indicator for scoring between 0-59 in 2011-2013, 10-point scalescore effects, and exam by year-of-test effects. We stack student outcomes across the Living Environment, MathA/Algebra, and Global History exams and cluster standard errors at the individual and school levels. See the textfor additional details.
40

Table 1: Summary Statistics
Full All Exams 1+ Exam All ExamsSample 0-49 50-69 70-100
Characteristics: (1) (2) (3) (4)Male 0.477 0.525 0.477 0.467White 0.145 0.055 0.096 0.243Asian 0.165 0.061 0.103 0.285Black 0.331 0.414 0.387 0.223Hispanic 0.353 0.461 0.407 0.243Free Lunch 0.552 0.602 0.589 0.483Above Median 8th Test Scores 0.516 0.053 0.331 0.886
Core Regents Performance:Living Environment 69.622 38.835 63.214 82.725Math A 69.835 40.459 65.040 84.522Int. Algebra 66.052 40.830 61.947 79.990Global History 67.814 32.559 60.165 86.376Comprehensive English 69.422 29.914 63.111 85.255U.S. History 72.499 33.010 65.201 88.994
High School Graduation:High School Graduate 0.730 0.129 0.672 0.926Local Diploma 0.041 0.035 0.070 0.007Regents Diploma 0.503 0.178 0.599 0.430Advanced Regents Diploma 0.232 0.001 0.042 0.507
Students 514,632 36,677 295,260 182,695
Note: This table reports summary statistics for students in New York City taking a core Regents exam between2004-2010. High school graduation records are only available for cohorts entering high school between 2001-2010 (N= 457,587). High school diploma records are only available for cohorts entering high school between 2007-2009 (N= 143,222). Enrollment, test score, and high school graduation information comes from Department of Educationrecords. Column 1 reports mean values for the full estimation sample. Column 2 reports mean values for studentswith all Regents score less than 50. Column 3 reports mean values for students with at least one Regents scorebetween 50 and 69. Column 4 reports mean values for students with all Regents scores 70 or above. See the dataappendix for additional details on the sample construction and variable definitions.
41

Tab
le2:
Sch
ool
Man
ipu
lati
onan
dS
chool
Ch
arac
teri
stic
s
Tota
lM
an
ipu
lati
on
In-R
an
ge
Man
ipu
lati
on
(1)
(2)
(3)
(4)
(5)
(6)
(7)
(8)
(9)
(10)
Per
cent
Bla
ck/H
isp
anic
4.89
6∗∗
∗2.8
08∗∗
∗2.
152
3.5
20
(0.5
11)
(0.8
27)
(2.6
69)
(4.7
24)
Per
cent
Fre
eL
un
ch4.
248∗∗
∗−
0.4
36
0.191
−1.
052
(0.8
50)
(0.9
34)
(4.0
18)
(5.3
37)
8th
Tes
tS
core
Per
centi
le−
0.051∗∗
∗−
0.0
40∗∗
∗−
0.051∗∗
−0.
064∗∗
(0.0
04)
(0.0
05)
(0.0
23)
(0.0
29)
En
roll
men
t(i
n1,
000s
)−
0.489∗∗
∗0.2
20∗
0.737
1.720∗∗
(0.1
13)
(0.1
22)
(0.5
28)
(0.6
99)
Con
stan
t2.4
72∗∗
∗3.5
33∗∗
∗9.
197∗∗
∗7.
035∗∗
∗6.3
06∗∗
∗39.0
80∗∗
∗40.5
47∗∗
∗43.8
37∗∗
∗39.2
07∗∗
∗39.
259∗∗
∗
(0.3
96)
(0.5
26)
(0.2
72)
(0.2
63)
(0.9
37)
(2.0
67)
(2.4
88)
(1.5
35)
(1.2
29)
(5.3
53)
R2
0.25
00.
083
0.3
69
0.0
64
0.3
98
0.0
02
0.0
00
0.0
19
0.0
07
0.0
43
Dep
.V
ar.
Mea
n6.
071
6.07
16.0
71
6.0
71
6.0
71
40.6
61
40.6
61
40.6
61
40.6
61
40.6
61
Ob
serv
atio
ns
277
277
277
277
277
277
277
277
277
277
Note
:T
his
table
rep
ort
ses
tim
ate
sfr
om
are
gre
ssio
nof
school
manip
ula
tion
on
aver
age
school
chara
cter
isti
cs.
Sch
ool-
exam
-adm
inis
trati
on-c
uto
ff-l
evel
manip
ula
tion
ises
tim
ate
dusi
ng
all
New
York
Cit
yhig
hsc
hool
test
taker
sb
etw
een
2004-2
010.
All
spec
ifica
tions
ab
ove
use
the
num
ber
of
exam
sin
-range
of
manip
ula
tion
at
each
school
as
wei
ghts
.Sch
ool
chara
cter
isti
csare
mea
sure
dusi
ng
the
aver
age
for
all
enro
lled
studen
tsb
etw
een
2004-2
010,
incl
udin
gnon-e
xam
taker
s.***
=si
gnifi
cant
at
1p
erce
nt
level
,**
=si
gnifi
cant
at
5p
erce
nt
level
,*
=si
gnifi
cant
at
10
per
cent
level
.See
the
data
app
endix
for
addit
ional
det
ails
on
the
sam
ple
const
ruct
ion
and
vari
able
defi
nit
ions.
42
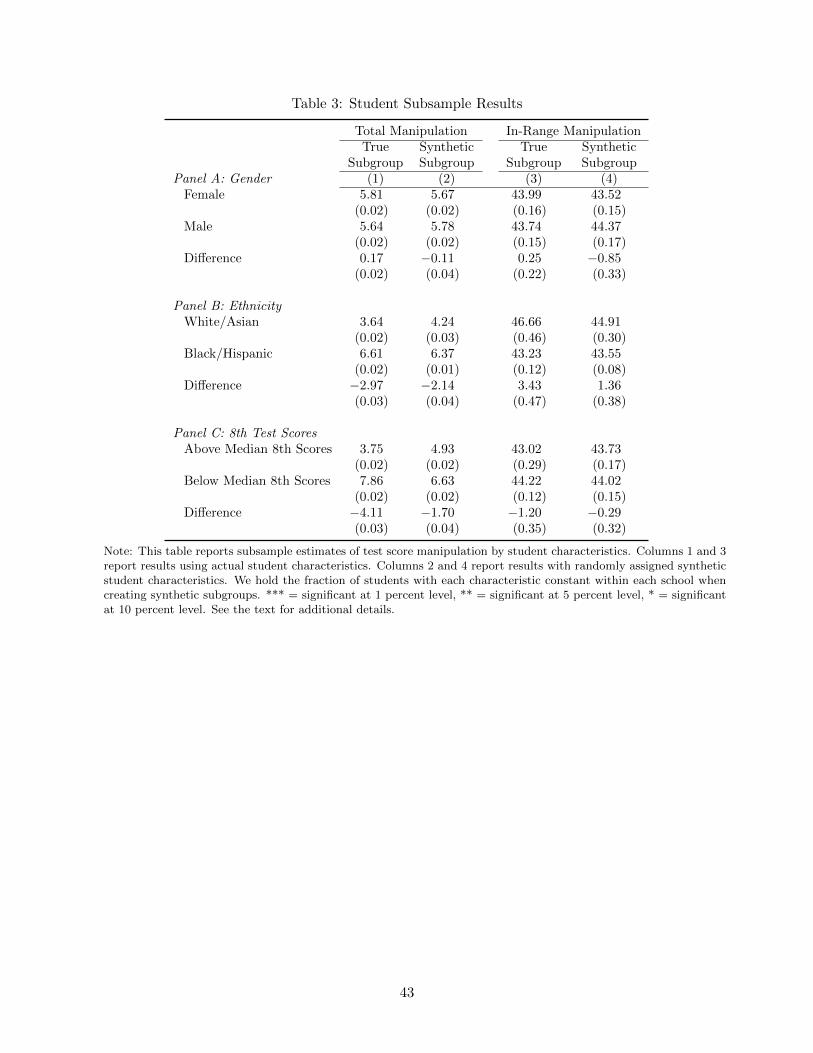
Table 3: Student Subsample Results
Total Manipulation In-Range ManipulationTrue Synthetic True Synthetic
Subgroup Subgroup Subgroup SubgroupPanel A: Gender (1) (2) (3) (4)
Female 5.81 5.67 43.99 43.52(0.02) (0.02) (0.16) (0.15)
Male 5.64 5.78 43.74 44.37(0.02) (0.02) (0.15) (0.17)
Difference 0.17 −0.11 0.25 −0.85(0.02) (0.04) (0.22) (0.33)
Panel B: EthnicityWhite/Asian 3.64 4.24 46.66 44.91
(0.02) (0.03) (0.46) (0.30)Black/Hispanic 6.61 6.37 43.23 43.55
(0.02) (0.01) (0.12) (0.08)Difference −2.97 −2.14 3.43 1.36
(0.03) (0.04) (0.47) (0.38)
Panel C: 8th Test ScoresAbove Median 8th Scores 3.75 4.93 43.02 43.73
(0.02) (0.02) (0.29) (0.17)Below Median 8th Scores 7.86 6.63 44.22 44.02
(0.02) (0.02) (0.12) (0.15)Difference −4.11 −1.70 −1.20 −0.29
(0.03) (0.04) (0.35) (0.32)
Note: This table reports subsample estimates of test score manipulation by student characteristics. Columns 1 and 3report results using actual student characteristics. Columns 2 and 4 report results with randomly assigned syntheticstudent characteristics. We hold the fraction of students with each characteristic constant within each school whencreating synthetic subgroups. *** = significant at 1 percent level, ** = significant at 5 percent level, * = significantat 10 percent level. See the text for additional details.
43

Table 4: School-Subject Manipulation and Teacher Turnover
In-Range Manipulation(1) (2) (3) (4)
Lagged Manipulation 0.504∗∗∗ 0.416∗∗∗ 0.077 −0.029(0.091) (0.093) (0.079) (0.100)
Fraction of Teachers Present in Both Periods 14.060∗∗ 2.664(5.751) (8.626)
Lagged Manipulation x Fraction Present 0.836∗∗∗ 0.870∗∗∗
(0.254) (0.276)Constant 41.525∗∗∗ 42.114∗∗∗ 33.539∗∗∗ 40.244∗∗∗
(2.445) (2.086) (3.515) (5.095)R2 0.439 0.661 0.471 0.679Dep. Var. Mean 46.420 46.420 46.420 46.420Observations 984 984 984 984School Fixed Effects No Yes No Yes
Note: This table reports estimates from a regression of school x subject in-range manipulation between 2007-2009 onschool x subject lagged in-range manipulation between 2004-2006 and subject effects. All specifications above use thenumber of exams in-range of manipulation as weights. The fraction of teachers in each subject who were employedduring both periods is calculated by dividing teachers based on license area: English licenses for the English exam,Mathematics for the Math A and Integrated Algebra exams, Social Studies for the Global and US History Exams,and Biology, Chemistry, Earth Science, Physics, and General Science for the Living Environment Exam. We dropteachers who provide instruction only to special education or bilingual populations. Standard errors are clustered byschool. *** = significant at 1 percent level, ** = significant at 5 percent level, * = significant at 10 percent level.See the data appendix for additional details on the sample construction and variable definitions.
44
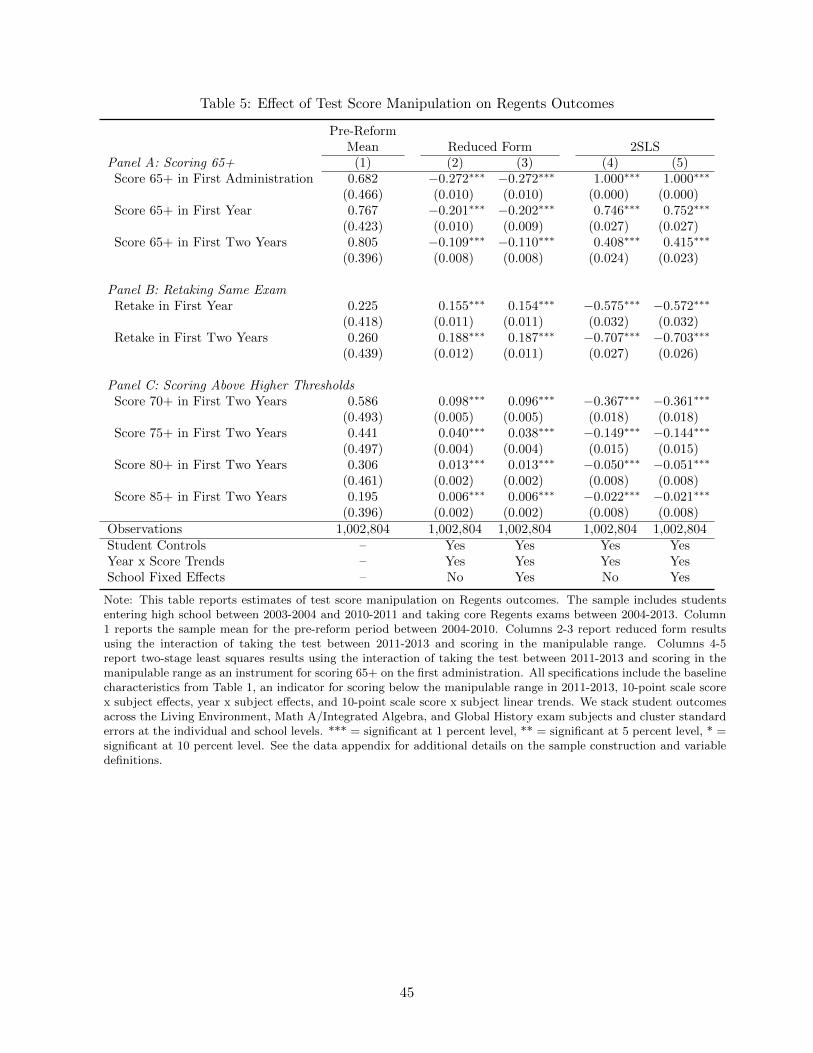
Table 5: Effect of Test Score Manipulation on Regents Outcomes
Pre-ReformMean Reduced Form 2SLS
Panel A: Scoring 65+ (1) (2) (3) (4) (5)Score 65+ in First Administration 0.682 −0.272∗∗∗ −0.272∗∗∗ 1.000∗∗∗ 1.000∗∗∗
(0.466) (0.010) (0.010) (0.000) (0.000)Score 65+ in First Year 0.767 −0.201∗∗∗ −0.202∗∗∗ 0.746∗∗∗ 0.752∗∗∗
(0.423) (0.010) (0.009) (0.027) (0.027)Score 65+ in First Two Years 0.805 −0.109∗∗∗ −0.110∗∗∗ 0.408∗∗∗ 0.415∗∗∗
(0.396) (0.008) (0.008) (0.024) (0.023)
Panel B: Retaking Same ExamRetake in First Year 0.225 0.155∗∗∗ 0.154∗∗∗ −0.575∗∗∗ −0.572∗∗∗
(0.418) (0.011) (0.011) (0.032) (0.032)Retake in First Two Years 0.260 0.188∗∗∗ 0.187∗∗∗ −0.707∗∗∗ −0.703∗∗∗
(0.439) (0.012) (0.011) (0.027) (0.026)
Panel C: Scoring Above Higher ThresholdsScore 70+ in First Two Years 0.586 0.098∗∗∗ 0.096∗∗∗ −0.367∗∗∗ −0.361∗∗∗
(0.493) (0.005) (0.005) (0.018) (0.018)Score 75+ in First Two Years 0.441 0.040∗∗∗ 0.038∗∗∗ −0.149∗∗∗ −0.144∗∗∗
(0.497) (0.004) (0.004) (0.015) (0.015)Score 80+ in First Two Years 0.306 0.013∗∗∗ 0.013∗∗∗ −0.050∗∗∗ −0.051∗∗∗
(0.461) (0.002) (0.002) (0.008) (0.008)Score 85+ in First Two Years 0.195 0.006∗∗∗ 0.006∗∗∗ −0.022∗∗∗ −0.021∗∗∗
(0.396) (0.002) (0.002) (0.008) (0.008)Observations 1,002,804 1,002,804 1,002,804 1,002,804 1,002,804Student Controls – Yes Yes Yes YesYear x Score Trends – Yes Yes Yes YesSchool Fixed Effects – No Yes No Yes
Note: This table reports estimates of test score manipulation on Regents outcomes. The sample includes studentsentering high school between 2003-2004 and 2010-2011 and taking core Regents exams between 2004-2013. Column1 reports the sample mean for the pre-reform period between 2004-2010. Columns 2-3 report reduced form resultsusing the interaction of taking the test between 2011-2013 and scoring in the manipulable range. Columns 4-5report two-stage least squares results using the interaction of taking the test between 2011-2013 and scoring in themanipulable range as an instrument for scoring 65+ on the first administration. All specifications include the baselinecharacteristics from Table 1, an indicator for scoring below the manipulable range in 2011-2013, 10-point scale scorex subject effects, year x subject effects, and 10-point scale score x subject linear trends. We stack student outcomesacross the Living Environment, Math A/Integrated Algebra, and Global History exam subjects and cluster standarderrors at the individual and school levels. *** = significant at 1 percent level, ** = significant at 5 percent level, * =significant at 10 percent level. See the data appendix for additional details on the sample construction and variabledefinitions.
45
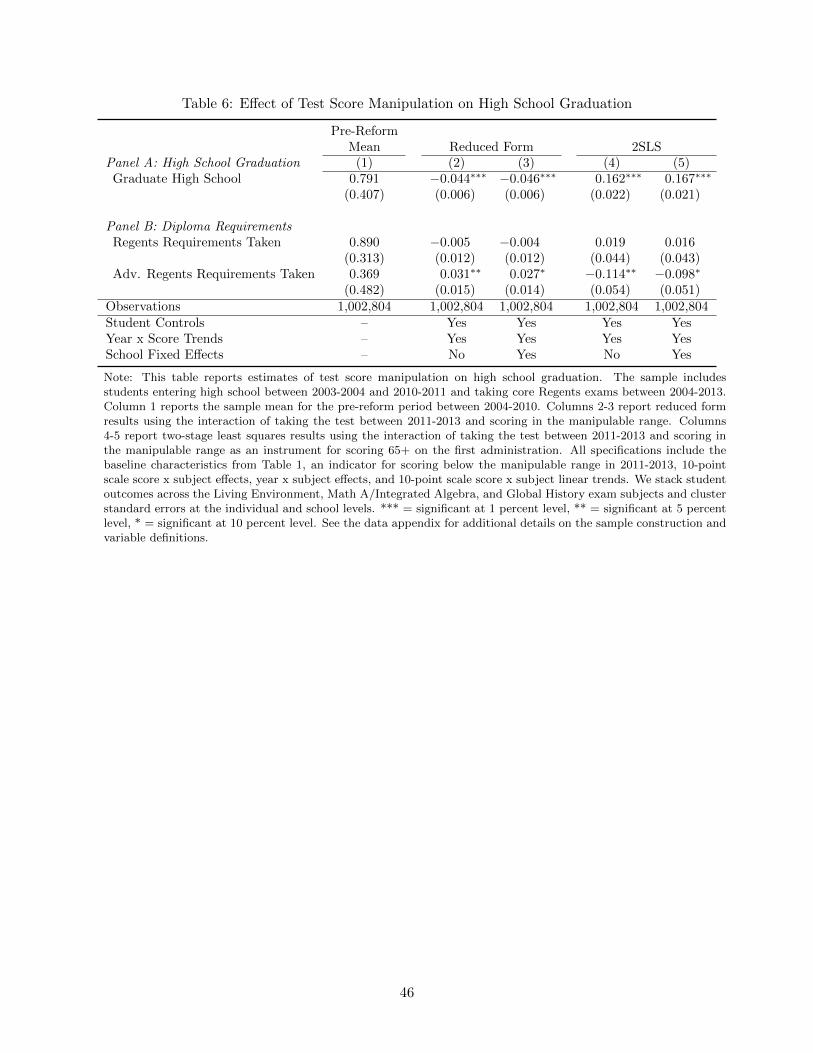
Table 6: Effect of Test Score Manipulation on High School Graduation
Pre-ReformMean Reduced Form 2SLS
Panel A: High School Graduation (1) (2) (3) (4) (5)Graduate High School 0.791 −0.044∗∗∗ −0.046∗∗∗ 0.162∗∗∗ 0.167∗∗∗
(0.407) (0.006) (0.006) (0.022) (0.021)
Panel B: Diploma RequirementsRegents Requirements Taken 0.890 −0.005 −0.004 0.019 0.016
(0.313) (0.012) (0.012) (0.044) (0.043)Adv. Regents Requirements Taken 0.369 0.031∗∗ 0.027∗ −0.114∗∗ −0.098∗
(0.482) (0.015) (0.014) (0.054) (0.051)Observations 1,002,804 1,002,804 1,002,804 1,002,804 1,002,804Student Controls – Yes Yes Yes YesYear x Score Trends – Yes Yes Yes YesSchool Fixed Effects – No Yes No Yes
Note: This table reports estimates of test score manipulation on high school graduation. The sample includesstudents entering high school between 2003-2004 and 2010-2011 and taking core Regents exams between 2004-2013.Column 1 reports the sample mean for the pre-reform period between 2004-2010. Columns 2-3 report reduced formresults using the interaction of taking the test between 2011-2013 and scoring in the manipulable range. Columns4-5 report two-stage least squares results using the interaction of taking the test between 2011-2013 and scoring inthe manipulable range as an instrument for scoring 65+ on the first administration. All specifications include thebaseline characteristics from Table 1, an indicator for scoring below the manipulable range in 2011-2013, 10-pointscale score x subject effects, year x subject effects, and 10-point scale score x subject linear trends. We stack studentoutcomes across the Living Environment, Math A/Integrated Algebra, and Global History exam subjects and clusterstandard errors at the individual and school levels. *** = significant at 1 percent level, ** = significant at 5 percentlevel, * = significant at 10 percent level. See the data appendix for additional details on the sample construction andvariable definitions.
46
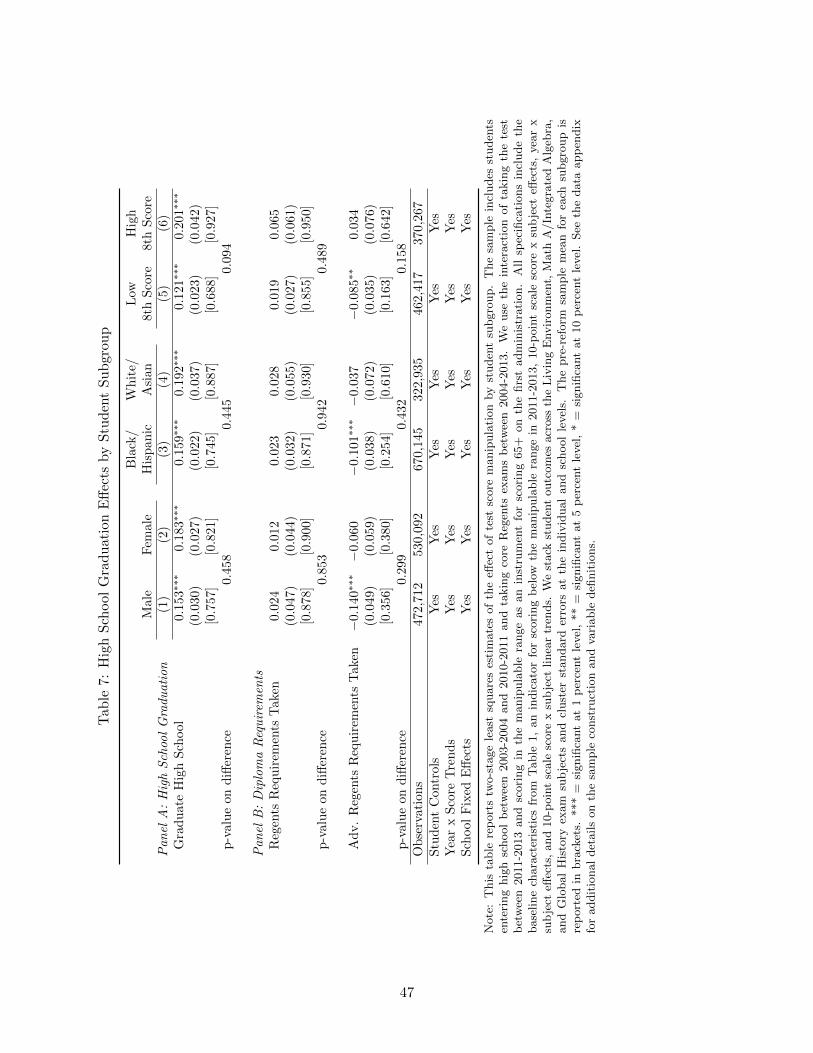
Tab
le7:
Hig
hS
chool
Gra
du
atio
nE
ffec
tsby
Stu
den
tS
ub
grou
p
Bla
ck/
Wh
ite/
Low
Hig
hM
ale
Fem
ale
His
pan
icA
sian
8th
Sco
re8th
Sco
reP
an
elA
:H
igh
Sch
ool
Gra
du
ati
on
(1)
(2)
(3)
(4)
(5)
(6)
Gra
du
ate
Hig
hS
chool
0.1
53∗∗
∗0.
183∗∗
∗0.
159∗∗
∗0.
192∗∗
∗0.
121∗∗
∗0.
201∗∗
∗
(0.0
30)
(0.0
27)
(0.0
22)
(0.0
37)
(0.0
23)
(0.0
42)
[0.7
57]
[0.8
21]
[0.7
45]
[0.8
87]
[0.6
88]
[0.9
27]
p-v
alu
eon
diff
eren
ce0.4
58
0.4
45
0.0
94
Pan
elB
:D
iplo
ma
Req
uir
emen
tsR
egen
tsR
equ
irem
ents
Tak
en0.
024
0.012
0.023
0.028
0.0
19
0.0
65
(0.0
47)
(0.0
44)
(0.0
32)
(0.0
55)
(0.0
27)
(0.0
61)
[0.8
78]
[0.9
00]
[0.8
71]
[0.9
30]
[0.8
55]
[0.9
50]
p-v
alu
eon
diff
eren
ce0.8
53
0.9
42
0.4
89
Ad
v.
Reg
ents
Req
uir
emen
tsT
aken
−0.
140∗∗
∗−
0.060
−0.
101∗∗
∗−
0.037
−0.
085∗∗
0.034
(0.0
49)
(0.0
59)
(0.0
38)
(0.0
72)
(0.0
35)
(0.0
76)
[0.3
56]
[0.3
80]
[0.2
54]
[0.6
10]
[0.1
63]
[0.6
42]
p-v
alu
eon
diff
eren
ce0.2
99
0.4
32
0.1
58
Ob
serv
atio
ns
472,7
12
530,0
92
670,1
45
322,9
35
462,4
17
370,2
67
Stu
den
tC
ontr
ols
Yes
Yes
Yes
Yes
Yes
Yes
Yea
rx
Sco
reT
ren
ds
Yes
Yes
Yes
Yes
Yes
Yes
Sch
ool
Fix
edE
ffec
tsY
esY
esY
esY
esY
esY
es
Note
:T
his
table
rep
ort
stw
o-s
tage
least
square
ses
tim
ate
sof
the
effec
tof
test
score
manip
ula
tion
by
studen
tsu
bgro
up.
The
sam
ple
incl
udes
studen
tsen
teri
ng
hig
hsc
hool
bet
wee
n2003-2
004
and
2010-2
011
and
takin
gco
reR
egen
tsex
am
sb
etw
een
2004-2
013.
We
use
the
inte
ract
ion
of
takin
gth
ete
stb
etw
een
2011-2
013
and
scori
ng
inth
em
anip
ula
ble
range
as
an
inst
rum
ent
for
scori
ng
65+
on
the
firs
tadm
inis
trati
on.
All
spec
ifica
tions
incl
ude
the
base
line
chara
cter
isti
csfr
om
Table
1,
an
indic
ato
rfo
rsc
ori
ng
bel
owth
em
anip
ula
ble
range
in2011-2
013,
10-p
oin
tsc
ale
score
xsu
bje
cteff
ects
,yea
rx
sub
ject
effec
ts,
and
10-p
oin
tsc
ale
score
xsu
bje
ctlinea
rtr
ends.
We
stack
studen
toutc
om
esacr
oss
the
Liv
ing
Envir
onm
ent,
Math
A/In
tegra
ted
Alg
ebra
,and
Glo
bal
His
tory
exam
sub
ject
sand
clust
erst
andard
erro
rsat
the
indiv
idual
and
school
level
s.T
he
pre
-ref
orm
sam
ple
mea
nfo
rea
chsu
bgro
up
isre
port
edin
bra
cket
s.***
=si
gnifi
cant
at
1p
erce
nt
level
,**
=si
gnifi
cant
at
5p
erce
nt
level
,*
=si
gnifi
cant
at
10
per
cent
level
.See
the
data
app
endix
for
addit
ional
det
ails
on
the
sam
ple
const
ruct
ion
and
vari
able
defi
nit
ions.
47
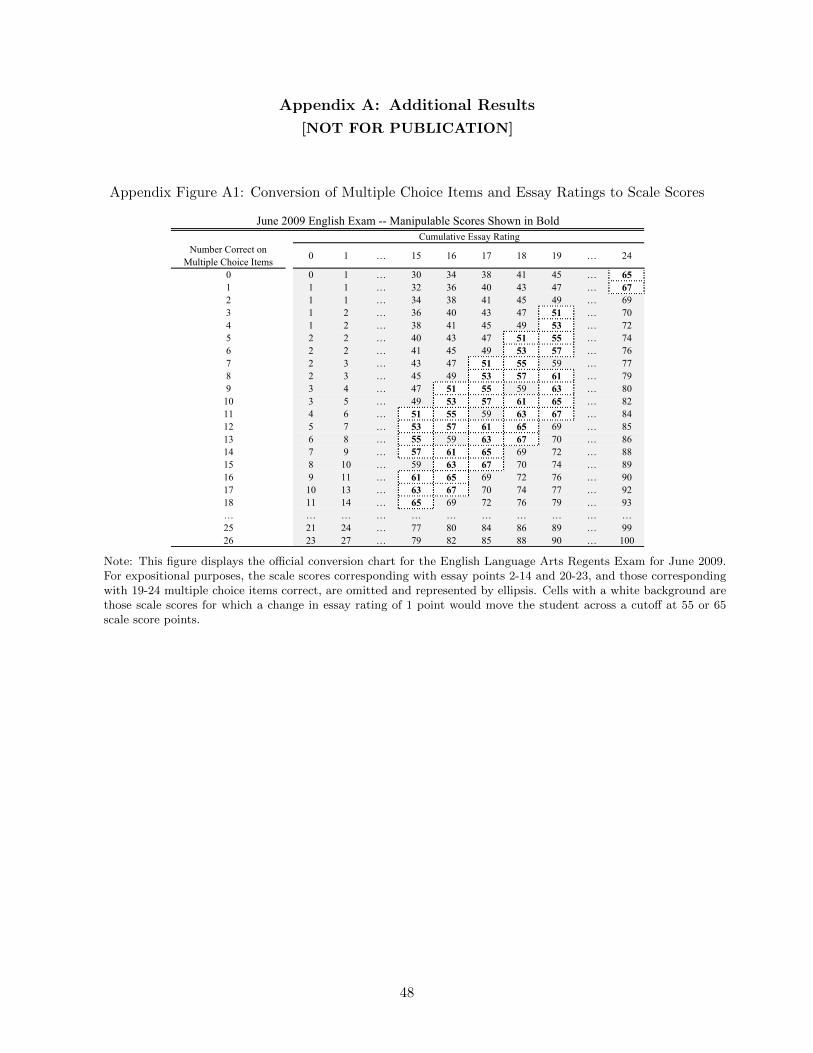
Appendix A: Additional Results
[NOT FOR PUBLICATION]
Appendix Figure A1: Conversion of Multiple Choice Items and Essay Ratings to Scale Scores
Number Correct onMultiple Choice Items 0 1 … 15 16 17 18 19 … 24
0 0 1 … 30 34 38 41 45 … 651 1 1 … 32 36 40 43 47 … 672 1 1 … 34 38 41 45 49 … 693 1 2 … 36 40 43 47 51 … 704 1 2 … 38 41 45 49 53 … 725 2 2 … 40 43 47 51 55 … 746 2 2 … 41 45 49 53 57 … 767 2 3 … 43 47 51 55 59 … 778 2 3 … 45 49 53 57 61 … 799 3 4 … 47 51 55 59 63 … 80
10 3 5 … 49 53 57 61 65 … 8211 4 6 … 51 55 59 63 67 … 8412 5 7 … 53 57 61 65 69 … 8513 6 8 … 55 59 63 67 70 … 8614 7 9 … 57 61 65 69 72 … 8815 8 10 … 59 63 67 70 74 … 8916 9 11 … 61 65 69 72 76 … 9017 10 13 … 63 67 70 74 77 … 9218 11 14 … 65 69 72 76 79 … 93… … … … … … … … … … …25 21 24 … 77 80 84 86 89 … 9926 23 27 … 79 82 85 88 90 … 100
Cumulative Essay RatingJune 2009 English Exam -- Manipulable Scores Shown in Bold
Note: This figure displays the official conversion chart for the English Language Arts Regents Exam for June 2009.For expositional purposes, the scale scores corresponding with essay points 2-14 and 20-23, and those correspondingwith 19-24 multiple choice items correct, are omitted and represented by ellipsis. Cells with a white background arethose scale scores for which a change in essay rating of 1 point would move the student across a cutoff at 55 or 65scale score points.
48
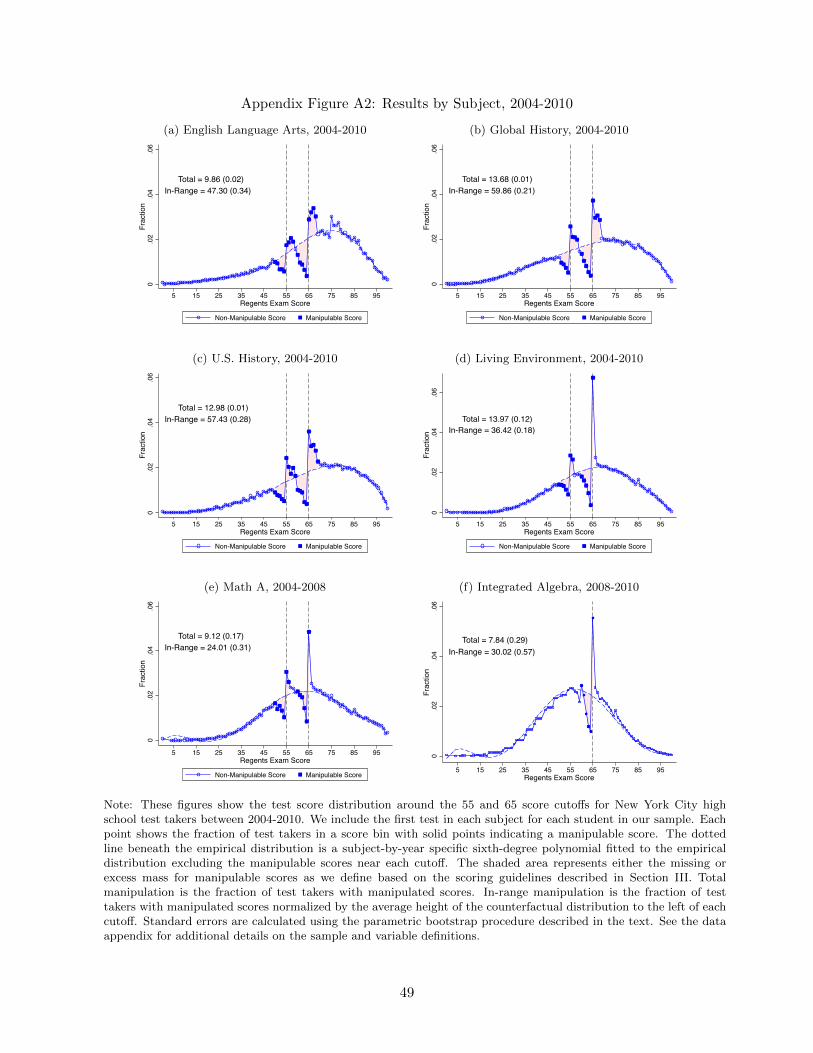
Appendix Figure A2: Results by Subject, 2004-2010
(a) English Language Arts, 2004-2010 (b) Global History, 2004-2010
Total = 9.86 (0.02)In-Range = 47.30 (0.34)
0.0
2.0
4.0
6Fr
actio
n
5 15 25 35 45 55 65 75 85 95Regents Exam Score
Non-Manipulable Score Manipulable Score
Total = 13.68 (0.01)In-Range = 59.86 (0.21)
0.0
2.0
4.0
6Fr
actio
n
5 15 25 35 45 55 65 75 85 95Regents Exam Score
Non-Manipulable Score Manipulable Score
(c) U.S. History, 2004-2010 (d) Living Environment, 2004-2010
Total = 12.98 (0.01)In-Range = 57.43 (0.28)
0.0
2.0
4.0
6Fr
actio
n
5 15 25 35 45 55 65 75 85 95Regents Exam Score
Non-Manipulable Score Manipulable Score
Total = 13.97 (0.12)In-Range = 36.42 (0.18)
0.0
2.0
4.0
6Fr
actio
n
5 15 25 35 45 55 65 75 85 95Regents Exam Score
Non-Manipulable Score Manipulable Score
(e) Math A, 2004-2008 (f) Integrated Algebra, 2008-2010
Total = 9.12 (0.17)In-Range = 24.01 (0.31)
0.0
2.0
4.0
6Fr
actio
n
5 15 25 35 45 55 65 75 85 95Regents Exam Score
Non-Manipulable Score Manipulable Score
Total = 7.84 (0.29)In-Range = 30.02 (0.57)
0.0
2.0
4.0
6Fr
actio
n
5 15 25 35 45 55 65 75 85 95Regents Exam Score
Note: These figures show the test score distribution around the 55 and 65 score cutoffs for New York City highschool test takers between 2004-2010. We include the first test in each subject for each student in our sample. Eachpoint shows the fraction of test takers in a score bin with solid points indicating a manipulable score. The dottedline beneath the empirical distribution is a subject-by-year specific sixth-degree polynomial fitted to the empiricaldistribution excluding the manipulable scores near each cutoff. The shaded area represents either the missing orexcess mass for manipulable scores as we define based on the scoring guidelines described in Section III. Totalmanipulation is the fraction of test takers with manipulated scores. In-range manipulation is the fraction of testtakers with manipulated scores normalized by the average height of the counterfactual distribution to the left of eachcutoff. Standard errors are calculated using the parametric bootstrap procedure described in the text. See the dataappendix for additional details on the sample and variable definitions.
49

Appendix Figure A3: Results by Year
(a) 2004 Core Exams (b) 2005 Core Exams
Total = 5.82 (0.04)In-Range = 42.36 (0.55)
0.0
2.0
4Fr
actio
n
5 15 25 35 45 55 65 75 85 95Regents Exam Score
Non-Manipulable Score Manipulable Score
Total = 6.45 (0.03)In-Range = 47.12 (0.31)
0.0
2.0
4Fr
actio
n
5 15 25 35 45 55 65 75 85 95Regents Exam Score
Non-Manipulable Score Manipulable Score
(c) 2006 Core Exams (d) 2007 Core Exams
Total = 6.25 (0.04)In-Range = 44.88 (0.32)
0.0
2.0
4Fr
actio
n
5 15 25 35 45 55 65 75 85 95Regents Exam Score
Non-Manipulable Score Manipulable Score
Total = 6.42 (0.04)In-Range = 46.61 (0.35)
0.0
2.0
4Fr
actio
n
5 15 25 35 45 55 65 75 85 95Regents Exam Score
Non-Manipulable Score Manipulable Score
(e) 2008 Core Exams (f) 2009 Core Exams
Total = 4.73 (0.04)In-Range = 37.98 (0.26)
0.0
2.0
4Fr
actio
n
5 15 25 35 45 55 65 75 85 95Regents Exam Score
Non-Manipulable Score Manipulable Score
Total = 5.45 (0.06)In-Range = 45.68 (0.37)
0.0
2.0
4Fr
actio
n
5 15 25 35 45 55 65 75 85 95Regents Exam Score
Non-Manipulable Score Manipulable Score
50

(g) 2010 Core Exams
Total = 5.05 (0.04)In-Range = 43.44 (0.46)
0.0
2.0
4Fr
actio
n
5 15 25 35 45 55 65 75 85 95Regents Exam Score
Non-Manipulable Score Manipulable Score
Note: These figures show the test score distribution around the 55 and 65 score cutoffs for New York City highschool test takers between 2004-2010. We include the first test in each subject for each student in our sample. Eachpoint shows the fraction of test takers in a score bin with solid points indicating a manipulable score. The dottedline beneath the empirical distribution is a subject-by-year specific sixth-degree polynomial fitted to the empiricaldistribution excluding the manipulable scores near each cutoff. The shaded area represents either the missing orexcess mass for manipulable scores as we define based on the scoring guidelines described in Section III. Totalmanipulation is the fraction of test takers with manipulated scores. In-range manipulation is the fraction of testtakers with manipulated scores normalized by the average height of the counterfactual distribution to the left of eachcutoff. Standard errors are calculated using the parametric bootstrap procedure described in the text. See the dataappendix for additional details on the sample and variable definitions.
51
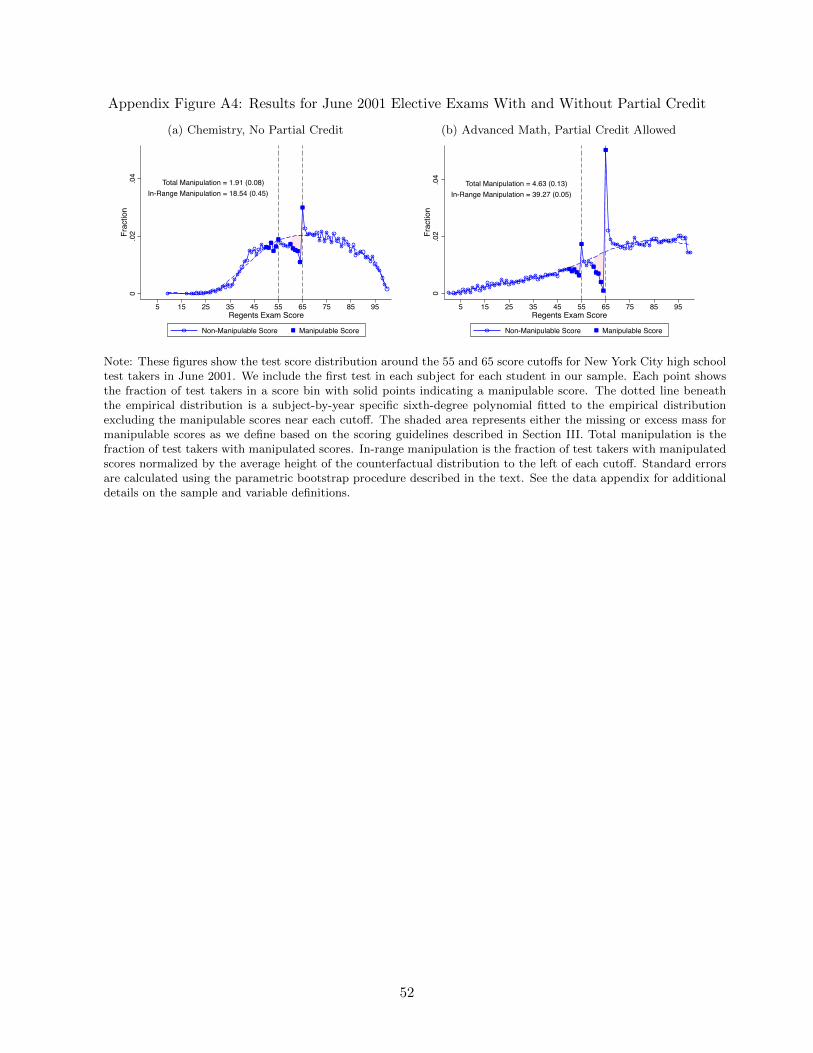
Appendix Figure A4: Results for June 2001 Elective Exams With and Without Partial Credit
(a) Chemistry, No Partial Credit (b) Advanced Math, Partial Credit Allowed
Total Manipulation = 1.91 (0.08)In-Range Manipulation = 18.54 (0.45)
0.0
2.0
4Fr
actio
n
5 15 25 35 45 55 65 75 85 95Regents Exam Score
Non-Manipulable Score Manipulable Score
Total Manipulation = 4.63 (0.13)In-Range Manipulation = 39.27 (0.05)
0.0
2.0
4Fr
actio
n
5 15 25 35 45 55 65 75 85 95Regents Exam Score
Non-Manipulable Score Manipulable Score
Note: These figures show the test score distribution around the 55 and 65 score cutoffs for New York City high schooltest takers in June 2001. We include the first test in each subject for each student in our sample. Each point showsthe fraction of test takers in a score bin with solid points indicating a manipulable score. The dotted line beneaththe empirical distribution is a subject-by-year specific sixth-degree polynomial fitted to the empirical distributionexcluding the manipulable scores near each cutoff. The shaded area represents either the missing or excess mass formanipulable scores as we define based on the scoring guidelines described in Section III. Total manipulation is thefraction of test takers with manipulated scores. In-range manipulation is the fraction of test takers with manipulatedscores normalized by the average height of the counterfactual distribution to the left of each cutoff. Standard errorsare calculated using the parametric bootstrap procedure described in the text. See the data appendix for additionaldetails on the sample and variable definitions.
52
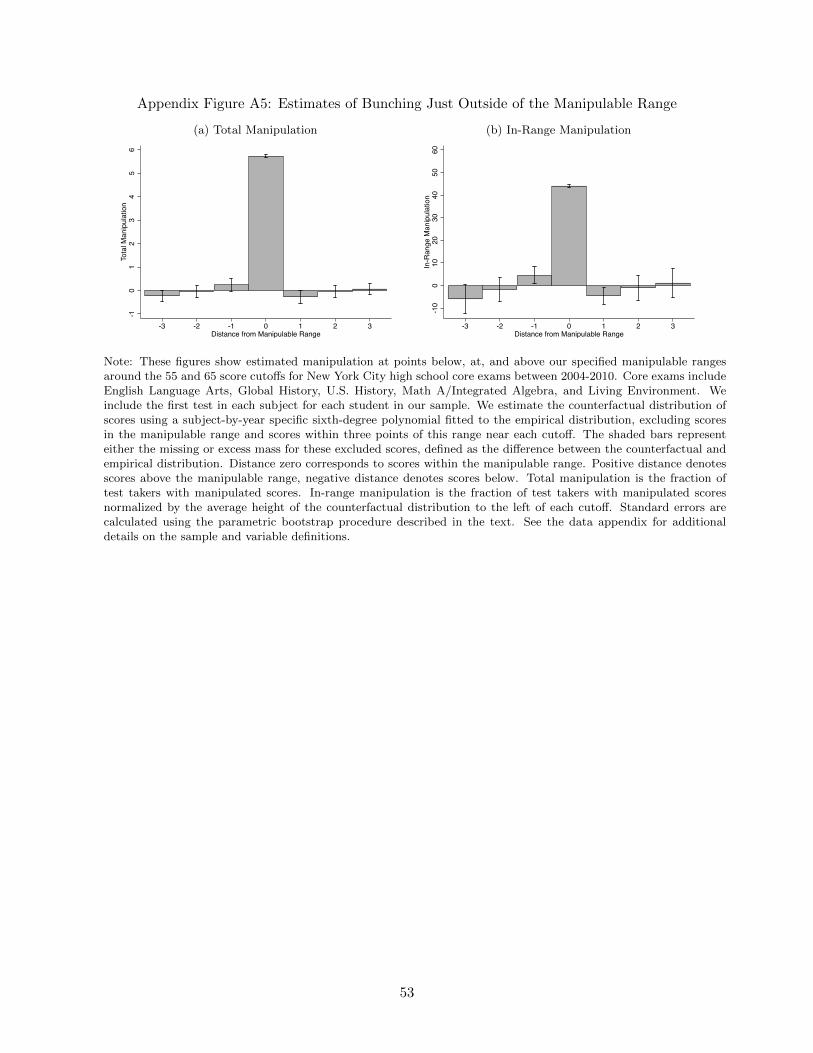
Appendix Figure A5: Estimates of Bunching Just Outside of the Manipulable Range
(a) Total Manipulation (b) In-Range Manipulation-1
01
23
45
6To
tal M
anip
ulat
ion
-3 -2 -1 0 1 2 3Distance from Manipulable Range
-10
010
2030
4050
60In
-Ran
ge M
anip
ulat
ion
-3 -2 -1 0 1 2 3Distance from Manipulable Range
Note: These figures show estimated manipulation at points below, at, and above our specified manipulable rangesaround the 55 and 65 score cutoffs for New York City high school core exams between 2004-2010. Core exams includeEnglish Language Arts, Global History, U.S. History, Math A/Integrated Algebra, and Living Environment. Weinclude the first test in each subject for each student in our sample. We estimate the counterfactual distribution ofscores using a subject-by-year specific sixth-degree polynomial fitted to the empirical distribution, excluding scoresin the manipulable range and scores within three points of this range near each cutoff. The shaded bars representeither the missing or excess mass for these excluded scores, defined as the difference between the counterfactual andempirical distribution. Distance zero corresponds to scores within the manipulable range. Positive distance denotesscores above the manipulable range, negative distance denotes scores below. Total manipulation is the fraction oftest takers with manipulated scores. In-range manipulation is the fraction of test takers with manipulated scoresnormalized by the average height of the counterfactual distribution to the left of each cutoff. Standard errors arecalculated using the parametric bootstrap procedure described in the text. See the data appendix for additionaldetails on the sample and variable definitions.
53

Appendix Figure A6: Test Score Distributions for Centrally Graded Exams in Grades 3-8
(a) English Language Arts (b) Math0
.02
.04
.06
Frac
tion
-40 -30 -20 -10 0 10 20 30 40English Language Arts Score
0.0
2.0
4.0
6Fr
actio
n
-40 -30 -20 -10 0 10 20 30 40Math Score
Note: These figures show the test score distribution around the proficiency score cutoff for New York City grade 3-8test takers between 2004-2010. Each point shows the fraction of test takers in a score bin. See the data appendix foradditional details on the variable definitions.
54

Appendix Figure A7: Results by School Characteristics, 2004-2010
(a) High vs. Low Black/Hispanic Enrollment (b) High vs. Low Free Lunch Enrollment
Low Fraction Black/Hispanic_________________________Total = 4.48 (0.02)In-Range = 44.95 (0.25)
High Fraction Black/Hispanic_________________________Total = 6.90 (0.02)In-Range = 43.27 (0.11)
0.0
2.0
4
5 15 25 35 45 55 65 75 85 95
Low Fraction Black/Hispanic High Fraction Black/Hispanic
Low Fraction Free Lunch_______________________Total = 4.92 (0.02)In-Range = 45.33 (0.27)
High Fraction Free Lunch_______________________Total = 6.52 (0.02)In-Range = 42.79 (0.12)
0.0
2.0
4
5 15 25 35 45 55 65 75 85 95
Low Fraction Free Lunch High Fraction Free Lunch
(c) Low vs. High 8th Test Scores (d) Small vs. Large Schools
High 8th Test Scores___________________Total = 3.36 (0.03)In-Range = 42.25 (0.43)
Low 8th Test Scores___________________Total = 6.88 (0.02)In-Range = 44.16 (0.11)
0.0
2.0
4
5 15 25 35 45 55 65 75 85 95
High 8th Test Scores Low 8th Test Scores
Small School_____________Total = 6.11 (0.02)In-Range = 41.74 (0.11)
Large School_____________Total = 5.37 (0.02)In-Range = 46.73 (0.24)
0.0
2.0
4
5 15 25 35 45 55 65 75 85 95
Small School Large School
Note: These figures show the test score distribution for core Regents exams around the 55 and 65 score cutoffs forNew York City high school test takers between 2004-2010. Panel (a) considers exams taken in schools above andbelow median in the fraction of black/Hispanic students. Panel (b) considers exams taken in schools above and belowmedian in the fraction of free lunch students. Panel (c) considers exams taken in schools above and below median inaverage 8th grade test scores. Panel (d) considers exams taken in schools with above and below median enrollments.See the Figure 1 notes for additional details on the sample and empirical specification.
55
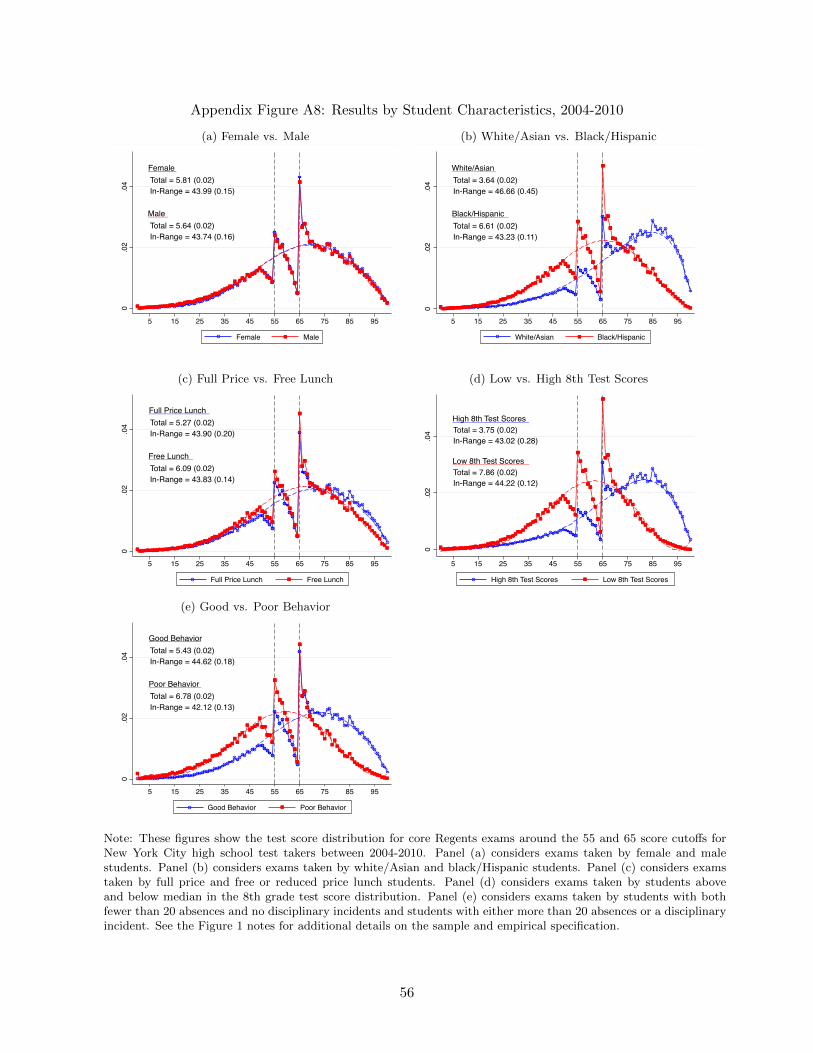
Appendix Figure A8: Results by Student Characteristics, 2004-2010
(a) Female vs. Male (b) White/Asian vs. Black/Hispanic
Female_______Total = 5.81 (0.02)In-Range = 43.99 (0.15)
Male_____Total = 5.64 (0.02)In-Range = 43.74 (0.16)
0.0
2.0
4
5 15 25 35 45 55 65 75 85 95
Female Male
White/Asian___________Total = 3.64 (0.02)In-Range = 46.66 (0.45)
Black/Hispanic______________Total = 6.61 (0.02)In-Range = 43.23 (0.11)
0.0
2.0
4
5 15 25 35 45 55 65 75 85 95
White/Asian Black/Hispanic
(c) Full Price vs. Free Lunch (d) Low vs. High 8th Test Scores
Full Price Lunch_______________Total = 5.27 (0.02)In-Range = 43.90 (0.20)
Free Lunch___________Total = 6.09 (0.02)In-Range = 43.83 (0.14)
0.0
2.0
4
5 15 25 35 45 55 65 75 85 95
Full Price Lunch Free Lunch
High 8th Test Scores___________________Total = 3.75 (0.02)In-Range = 43.02 (0.28)
Low 8th Test Scores___________________Total = 7.86 (0.02)In-Range = 44.22 (0.12)
0.0
2.0
4
5 15 25 35 45 55 65 75 85 95
High 8th Test Scores Low 8th Test Scores
(e) Good vs. Poor Behavior
Good Behavior_____________Total = 5.43 (0.02)In-Range = 44.62 (0.18)
Poor Behavior_____________Total = 6.78 (0.02)In-Range = 42.12 (0.13)
0.0
2.0
4
5 15 25 35 45 55 65 75 85 95
Good Behavior Poor Behavior
Note: These figures show the test score distribution for core Regents exams around the 55 and 65 score cutoffs forNew York City high school test takers between 2004-2010. Panel (a) considers exams taken by female and malestudents. Panel (b) considers exams taken by white/Asian and black/Hispanic students. Panel (c) considers examstaken by full price and free or reduced price lunch students. Panel (d) considers exams taken by students aboveand below median in the 8th grade test score distribution. Panel (e) considers exams taken by students with bothfewer than 20 absences and no disciplinary incidents and students with either more than 20 absences or a disciplinaryincident. See the Figure 1 notes for additional details on the sample and empirical specification.
56

Appendix Figure A9: Results for Elective Regents Exams, 2004-2010
Total Manipulation = 3.40 (0.03)In-Range Manipulation = 37.33 (0.19)
0.0
2.0
4.0
6Fr
actio
n
5 15 25 35 45 55 65 75 85 95Elective Exam Score
Non-Manipulable Score Manipulable Score
Note: This figure shows the test score distribution around the 65 score cutoff for New York City high school testtakers between 2004-2010. Included elective exams include Chemistry, Math B, and Physics. We include the first testin each subject for each student in our sample. Each point shows the fraction of test takers in a score bin with solidpoints indicating a manipulable score. The dotted line beneath the empirical distribution is a subject-by-year specificsixth-degree polynomial fitted to the empirical distribution excluding the manipulable scores near each cutoff. Theshaded area represents either the missing or excess mass for manipulable scores as we define based on the scoringguidelines described in Section III. Total manipulation is the fraction of test takers with manipulated scores. In-range manipulation is the fraction of test takers with manipulated scores normalized by the average height of thecounterfactual distribution to the left of each cutoff. Standard errors are calculated using the parametric bootstrapprocedure described in the text. See the data appendix for additional details on the sample and variable definitions.
57

Appendix Figure A10: Additional Test Score Distributions Before Grading Reforms, 2004-2009
(a) 2004: Re-Scoring and Decentralized Grading (b) 2005: Re-Scoring and Decentralized Grading
Pilot School___________Total = 3.95 (0.04)In-Range = 49.50 (0.76)
Non-Pilot School________________Total = 3.55 (0.05)In-Range = 39.65 (0.55)
0.0
2.0
4Fr
actio
n
5 15 25 35 45 55 65 75 85 95
Pilot School Non-Pilot School
Pilot School___________Total = 4.48 (0.05)In-Range = 54.77 (0.94)
Non-Pilot School________________Total = 4.15 (0.05)In-Range = 47.66 (0.74)
0.0
2.0
4Fr
actio
n
5 15 25 35 45 55 65 75 85 95
Pilot School Non-Pilot School
(c) 2006: Re-Scoring and Decentralized Grading (d) 2007: Re-Scoring and Decentralized Grading
Pilot School___________Total = 4.42 (0.05)In-Range = 56.45 (1.15)
Non-Pilot School________________Total = 4.44 (0.05)In-Range = 49.96 (0.89)
0.0
2.0
4Fr
actio
n
5 15 25 35 45 55 65 75 85 95
Pilot School Non-Pilot School
Pilot School___________Total = 4.52 (0.04)In-Range = 59.68 (1.25)
Non-Pilot School________________Total = 4.39 (0.06)In-Range = 49.73 (0.77)
0.0
2.0
4Fr
actio
n
5 15 25 35 45 55 65 75 85 95
Pilot School Non-Pilot School
(e) 2008: Re-Scoring and Decentralized Grading (f) 2009: Re-Scoring and Decentralized Grading
Pilot School___________Total = 3.82 (0.02)In-Range = 51.82 (0.72)
Non-Pilot School________________Total = 3.94 (0.03)In-Range = 46.82 (0.53)
0.0
2.0
4Fr
actio
n
5 15 25 35 45 55 65 75 85 95
Pilot School Non-Pilot School
Pilot School___________Total = 4.80 (0.03)In-Range = 67.43 (1.06)
Non-Pilot School________________Total = 4.60 (0.03)In-Range = 55.09 (0.59)
0.0
2.0
4Fr
actio
n
5 15 25 35 45 55 65 75 85 95
Pilot School Non-Pilot School
Note: These figures show the test score distribution around the 65 score cutoff for New York City high school testtakers between 2004-2009 in June. Included core exams include English Language Arts, Global History, U.S. History,Integrated Algebra, and Living Environment. See the Figure 1 notes for additional details on the sample and empiricalspecification.
58
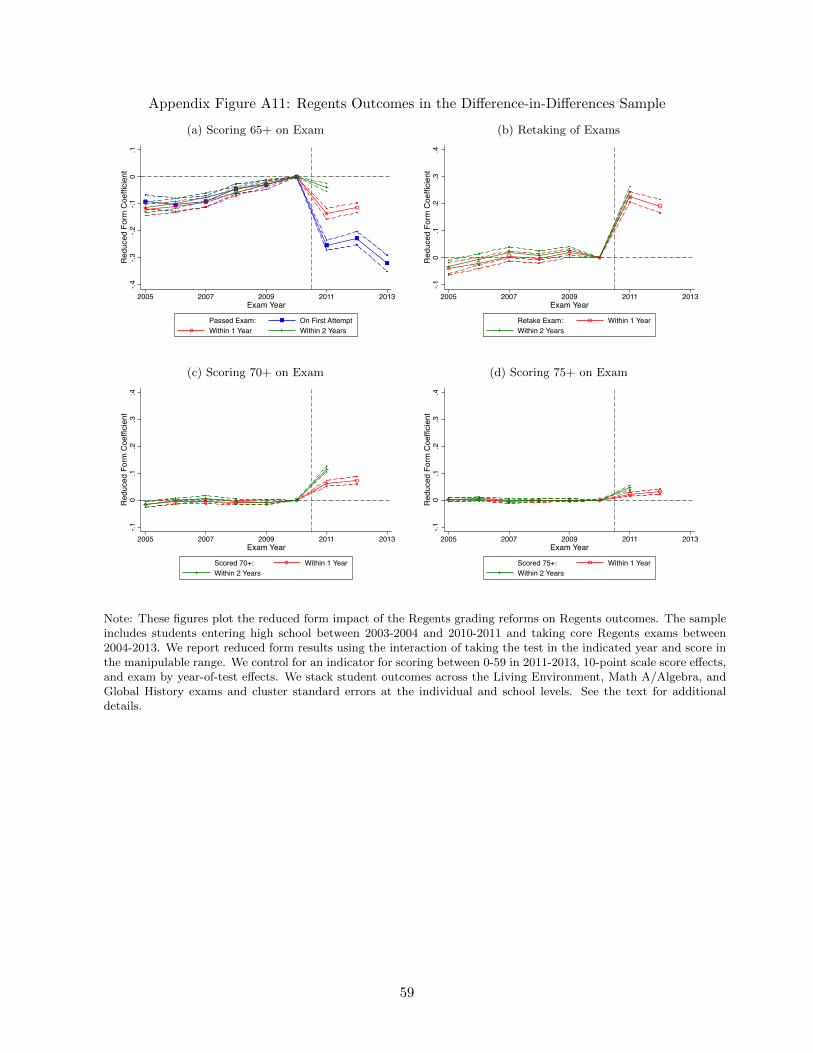
Appendix Figure A11: Regents Outcomes in the Difference-in-Differences Sample
(a) Scoring 65+ on Exam (b) Retaking of Exams-.4
-.3-.2
-.10
.1Re
duce
d Fo
rm C
oeffi
cient
2005 2007 2009 2011 2013Exam Year
Passed Exam: On First AttemptWithin 1 Year Within 2 Years
-.10
.1.2
.3.4
Red
uced
For
m C
oeffi
cien
t
2005 2007 2009 2011 2013Exam Year
Retake Exam: Within 1 YearWithin 2 Years
(c) Scoring 70+ on Exam (d) Scoring 75+ on Exam
-.10
.1.2
.3.4
Red
uced
For
m C
oeffi
cien
t
2005 2007 2009 2011 2013Exam Year
Scored 70+: Within 1 YearWithin 2 Years
-.10
.1.2
.3.4
Red
uced
For
m C
oeffi
cien
t
2005 2007 2009 2011 2013Exam Year
Scored 75+: Within 1 YearWithin 2 Years
Note: These figures plot the reduced form impact of the Regents grading reforms on Regents outcomes. The sampleincludes students entering high school between 2003-2004 and 2010-2011 and taking core Regents exams between2004-2013. We report reduced form results using the interaction of taking the test in the indicated year and score inthe manipulable range. We control for an indicator for scoring between 0-59 in 2011-2013, 10-point scale score effects,and exam by year-of-test effects. We stack student outcomes across the Living Environment, Math A/Algebra, andGlobal History exams and cluster standard errors at the individual and school levels. See the text for additionaldetails.
59

Ap
pen
dix
Fig
ure
A12
:R
egen
tsG
rad
ing
Ref
orm
san
dS
tud
ent
Outc
omes
by
Stu
den
tS
ub
gro
up
(a)
Male
s:Sco
re65+
on
Fir
stA
dm
in.
(b)
Male
s:G
raduate
Hig
hSch
ool
(c)
Male
s:A
dv.
Reg
ents
Req
.T
aken
-.4-.3-.2-.10.1Reduced Form Coefficient
2005
2007
2009
2011
2013
Exam
Yea
r
-.15-.1-.050.05.1.15Reduced Form Coefficient
2005
2007
2009
2011
2013
Exam
Yea
r
-.15-.1-.050.05.1.15Reduced Form Coefficient
2005
2007
2009
2011
2013
Exam
Yea
r
(d)
Fem
ale
s:Sco
re65+
on
Fir
stA
dm
in.
(e)
Fem
ale
s:G
raduate
Hig
hSch
ool
(f)
Fem
ale
s:A
dv.
Reg
ents
Req
.T
aken
-.4-.3-.2-.10.1Reduced Form Coefficient
2005
2007
2009
2011
2013
Exam
Yea
r
-.15-.1-.050.05.1.15Reduced Form Coefficient
2005
2007
2009
2011
2013
Exam
Yea
r
-.15-.1-.050.05.1.15Reduced Form Coefficient
2005
2007
2009
2011
2013
Exam
Yea
r
(g)
Bla
ck/H
ispanic
:Sco
re65+
on
Fir
stA
dm
in.
(h)
Bla
ck/H
ispanic
:G
raduate
Hig
hSch
ool
(i)
Bla
ck/H
ispanic
:A
dv.
Reg
ents
Req
.T
aken
-.4-.3-.2-.10.1Reduced Form Coefficient
2005
2007
2009
2011
2013
Exam
Yea
r
-.15-.1-.050.05.1.15Reduced Form Coefficient
2005
2007
2009
2011
2013
Exam
Yea
r
-.15-.1-.050.05.1.15Reduced Form Coefficient
2005
2007
2009
2011
2013
Exam
Yea
r
60
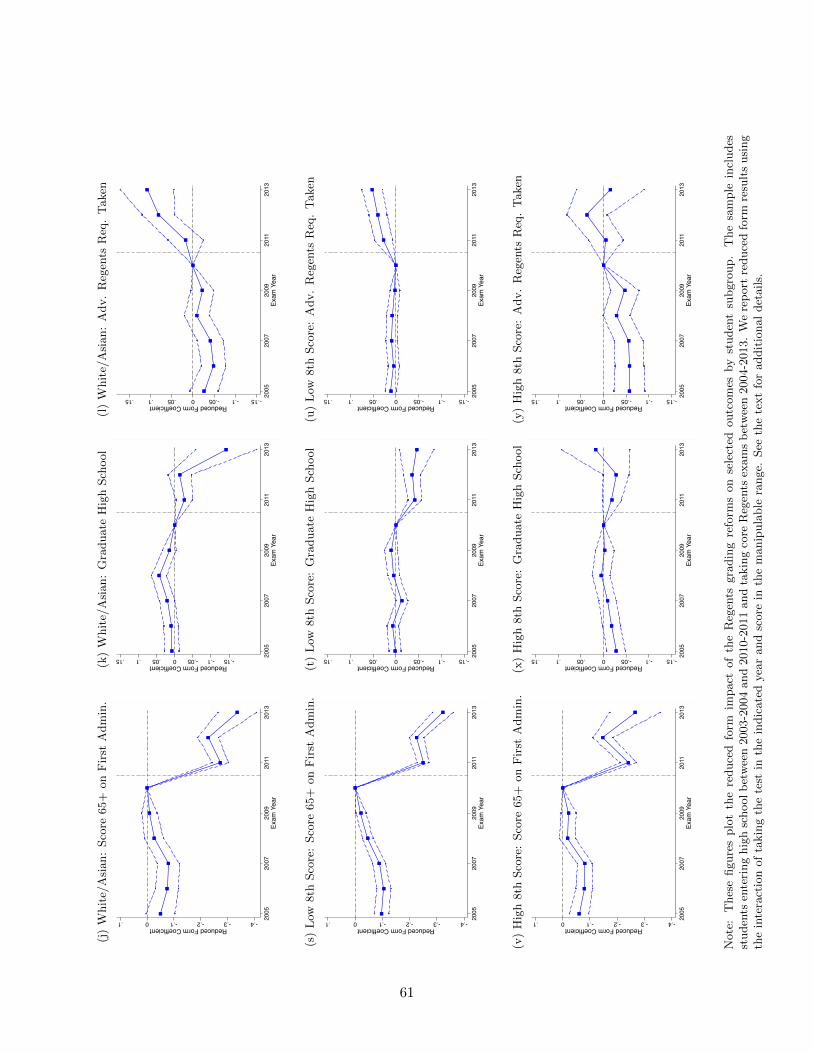
(j)
Whit
e/A
sian:
Sco
re65+
on
Fir
stA
dm
in.
(k)
Whit
e/A
sian:
Gra
duate
Hig
hSch
ool
(l)
Whit
e/A
sian:
Adv.
Reg
ents
Req
.T
aken
-.4-.3-.2-.10.1Reduced Form Coefficient
2005
2007
2009
2011
2013
Exam
Yea
r
-.15-.1-.050.05.1.15Reduced Form Coefficient
2005
2007
2009
2011
2013
Exam
Yea
r
-.15-.1-.050.05.1.15Reduced Form Coefficient
2005
2007
2009
2011
2013
Exam
Yea
r
(s)
Low
8th
Sco
re:
Sco
re65+
on
Fir
stA
dm
in.
(t)
Low
8th
Sco
re:
Gra
duate
Hig
hSch
ool
(u)
Low
8th
Sco
re:
Adv.
Reg
ents
Req
.T
aken
-.4-.3-.2-.10.1Reduced Form Coefficient
2005
2007
2009
2011
2013
Exam
Yea
r
-.15-.1-.050.05.1.15Reduced Form Coefficient
2005
2007
2009
2011
2013
Exam
Yea
r
-.15-.1-.050.05.1.15Reduced Form Coefficient
2005
2007
2009
2011
2013
Exam
Yea
r
(v)
Hig
h8th
Sco
re:
Sco
re65+
on
Fir
stA
dm
in.
(x)
Hig
h8th
Sco
re:
Gra
duate
Hig
hSch
ool
(y)
Hig
h8th
Sco
re:
Adv.
Reg
ents
Req
.T
aken
-.4-.3-.2-.10.1Reduced Form Coefficient
2005
2007
2009
2011
2013
Exam
Yea
r
-.15-.1-.050.05.1.15Reduced Form Coefficient
2005
2007
2009
2011
2013
Exam
Yea
r
-.15-.1-.050.05.1.15Reduced Form Coefficient
2005
2007
2009
2011
2013
Exam
Yea
r
Note
:T
hes
efigure
splo
tth
ere
duce
dfo
rmim
pact
of
the
Reg
ents
gra
din
gre
form
son
sele
cted
outc
om
esby
studen
tsu
bgro
up.
The
sam
ple
incl
udes
studen
tsen
teri
ng
hig
hsc
hool
bet
wee
n2003-2
004
and
2010-2
011
and
takin
gco
reR
egen
tsex
am
sb
etw
een
2004-2
013.
We
rep
ort
reduce
dfo
rmre
sult
susi
ng
the
inte
ract
ion
of
takin
gth
ete
stin
the
indic
ate
dyea
rand
score
inth
em
anip
ula
ble
range.
See
the
text
for
addit
ional
det
ails.
61

Ap
pen
dix
Tab
leA
1:R
egen
tsE
xam
Req
uir
emen
tsby
Dip
lom
aT
yp
ean
dC
oh
ort
Yea
rof
9th
Gra
de
Entr
yL
oca
lD
iplo
ma
Reg
ents
Dip
lom
aA
dva
nce
dR
egen
tsD
iplo
ma
Fal
l20
01-2
004
55+
in5
core
sub
ject
s
65+
in5
core
sub
ject
s
65+
in5
core
sub
ject
s;
65+
in1
Ad
v.
Math
,
1P
hysi
cal
Sci
ence
,
1L
an
gu
age
Fal
l20
0565+
in2
core
sub
ject
s,
55+
in3
core
sub
ject
s
Fal
l20
0665+
in3
core
sub
ject
s,
55+
in2
core
sub
ject
s
Fal
l20
0765+
in4
core
sub
ject
s,
55+
in1
core
sub
ject
s65+
in5
core
sub
ject
s;
65+
inA
dv.
Math
Seq
uen
ce,
1P
hysi
cal
Sci
ence
,1
Lan
gu
age
Fal
l20
08-p
rese
nt
Ava
ilab
leon
lyto
Dis
ab
led
Stu
den
ts
Note
:T
he
five
core
Reg
ents
-Exam
inati
on
sub
ject
sare
English
,M
ath
emati
cs,
Sci
ence
,U
.S.
His
tory
and
Gov
ernm
ent,
and
Glo
bal
His
tory
and
Geo
gra
phy.
Stu
den
tsw
ho
hav
e10
cred
its
of
Care
erand
Tec
hnic
al
Educa
tion
(CT
E)
or
Art
scl
ass
esare
exem
pt
from
the
Language
requir
emen
tof
the
Adva
nce
dR
egen
tsD
iplo
ma.
62

Appendix Table A2: AIC for Different Polynomial Choices
PolynomialOrder AIC
(1) (2)First 51410.0Second 50119.7Third 48320.8Fourth 48025.1Fifth 47980.9Sixth 47888.6Seventh 47927.6
Note: This table reports Akaike Information Criteria for a series of regressions of test score frequency on variouspolynomials of test score. All polynomials are fully interacted with indicators for each test-year combination.
63

Appendix Table A3: Manipulable Scores by Test Subject x Year
Comp. Living U.S. Global Int.English Env. Math A History History Algebra
June 2004: (1) (2) (3) (4) (5) (6)55 Cutoff 50-58 50-56 51-55 51-58 50-5865 Cutoff 61-67 60-65 60-65 61-68 60-68
June 2005:55 Cutoff 51-57 50-56 51-55 50-59 50-5865 Cutoff 60-68 60-65 60-65 61-68 60-68
June 2006:55 Cutoff 51-57 50-55 50-56 50-58 50-5865 Cutoff 61-67 60-65 60-65 61-69 60-68
June 2007:55 Cutoff 50-58 50-55 50-56 51-58 51-5765 Cutoff 61-67 60-65 60-65 60-67 60-67
June 2008:55 Cutoff 51-57 51-55 50-55 50-58 51-58 51-5665 Cutoff 60-66 60-65 60-65 61-68 60-67 60-65
June 2009:55 Cutoff 51-57 50-55 50-58 50-5865 Cutoff 61-67 60-65 60-68 61-67 60-65
June 2010:55 Cutoff 50-58 50-55 50-59 51-5865 Cutoff 61-67 60-65 60-67 60-68 60-65
Note: This table reports the manipulable scores around the 55 and 65 score cutoffs for New York City high schooltest takers between 2004-2010. See the text for details.
64
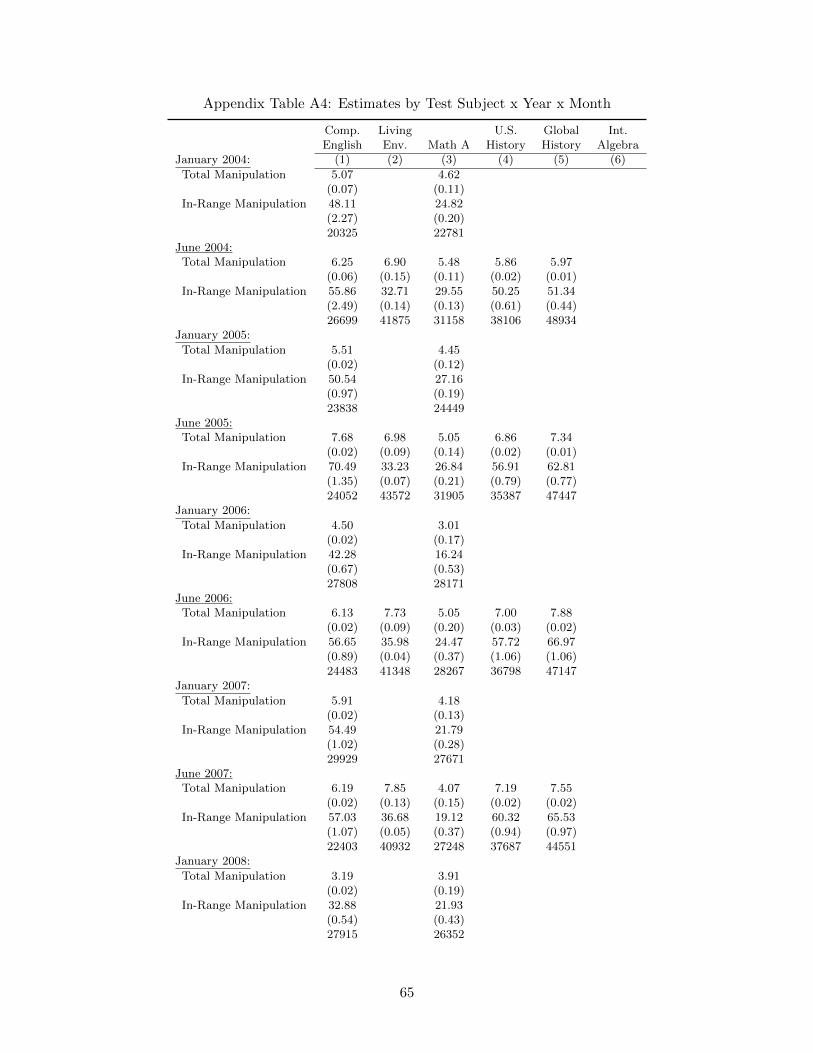
Appendix Table A4: Estimates by Test Subject x Year x Month
Comp. Living U.S. Global Int.English Env. Math A History History Algebra
January 2004: (1) (2) (3) (4) (5) (6)
Total Manipulation 5.07 4.62(0.07) (0.11)
In-Range Manipulation 48.11 24.82(2.27) (0.20)20325 22781
June 2004:Total Manipulation 6.25 6.90 5.48 5.86 5.97
(0.06) (0.15) (0.11) (0.02) (0.01)In-Range Manipulation 55.86 32.71 29.55 50.25 51.34
(2.49) (0.14) (0.13) (0.61) (0.44)26699 41875 31158 38106 48934
January 2005:
Total Manipulation 5.51 4.45(0.02) (0.12)
In-Range Manipulation 50.54 27.16(0.97) (0.19)23838 24449
June 2005:Total Manipulation 7.68 6.98 5.05 6.86 7.34
(0.02) (0.09) (0.14) (0.02) (0.01)In-Range Manipulation 70.49 33.23 26.84 56.91 62.81
(1.35) (0.07) (0.21) (0.79) (0.77)24052 43572 31905 35387 47447
January 2006:
Total Manipulation 4.50 3.01(0.02) (0.17)
In-Range Manipulation 42.28 16.24(0.67) (0.53)27808 28171
June 2006:Total Manipulation 6.13 7.73 5.05 7.00 7.88
(0.02) (0.09) (0.20) (0.03) (0.02)In-Range Manipulation 56.65 35.98 24.47 57.72 66.97
(0.89) (0.04) (0.37) (1.06) (1.06)24483 41348 28267 36798 47147
January 2007:
Total Manipulation 5.91 4.18(0.02) (0.13)
In-Range Manipulation 54.49 21.79(1.02) (0.28)29929 27671
June 2007:Total Manipulation 6.19 7.85 4.07 7.19 7.55
(0.02) (0.13) (0.15) (0.02) (0.02)In-Range Manipulation 57.03 36.68 19.12 60.32 65.53
(1.07) (0.05) (0.37) (0.94) (0.97)22403 40932 27248 37687 44551
January 2008:
Total Manipulation 3.19 3.91(0.02) (0.19)
In-Range Manipulation 32.88 21.93(0.54) (0.43)27915 26352
65

Comp. Living U.S. Global Int.English Env. Math A History History Algebra
June 2008: (1) (2) (3) (4) (5) (6)Total Manipulation 3.94 5.85 4.99 5.46 6.37 3.03
(0.02) (0.08) (0.26) (0.02) (0.02) (0.12)In-Range Manipulation 40.68 36.84 21.76 52.98 56.55 22.13
(0.66) (0.03) (0.52) (1.02) (0.69) (0.39)23618 42073 18044 38289 44951 34185
January 2009:
Total Manipulation 3.86 3.84(0.03) (0.20)
In-Range Manipulation 38.53 30.55(0.87) (0.34)27547 10489
June 2009:Total Manipulation 4.10 5.32 7.49 6.44 4.33
(0.03) (0.16) (0.02) (0.02) (0.20)In-Range Manipulation 40.89 32.41 69.91 57.17 34.08
(0.92) (0.18) (1.56) (0.76) (0.23)23697 41261 39470 43283 39513
January 2010:
Total Manipulation 3.46 3.78(0.04) (0.10)
In-Range Manipulation 38.10 38.75(1.30) (0.17)27099 13956
June 2010:Total Manipulation 3.50 6.10 5.60 6.32 4.07
(0.04) (0.14) (0.03) (0.03) (0.15)In-Range Manipulation 38.49 36.42 53.41 58.77 31.11
(1.32) (0.07) (1.22) (1.20) (0.23)22771 41477 37435 42707 34132
Note: This table reports manipulation around the 55 and 65 score cutoffs for New York City high school test takersbetween 2004-2010. See the Figure 1 notes for details on the empirical specification and the data appendix foradditional details on the sample and variable definitions.
66

Appendix Table A5: Summary Statistics for School x Subject In-Range Manipulation
In-Range Manipulation Within-School CorrelationU.S. Global Living
Obs. Mean S.D. History History English Math Env.(1) (2) (3) (4) (5) (6) (7) (8)
U.S. History 259 54.2 33.7 1.00Global History 263 59.1 36.3 0.78 1.00English 258 47.1 23.4 0.30 0.25 1.00Math 271 26.2 15.3 0.21 0.22 0.21 1.00Living Environment 273 36.1 16.8 0.06 0.07 0.14 0.25 1.00
Note: This table presents summary statistics for our estimates of in-range manipulation at the school x subjectlevel. Columns 1-3 present the number of estimates and means and standard deviations by subject area. Columns4-8 present pairwise correlations weighted by the number of in-range exams for each subject area pair, where mathincludes both Math A and Integrated Algebra exams. See the data appendix for additional details on the sampleconstruction and variable definitions and the text for additional details on the calculation of the school x subjectin-range manipulation estimates.
67

Appendix Table A6: Comparison of Pilot and Non-Pilot High Schools
Pilot Non-PilotSchools Schools Difference
Characteristics: (1) (2) (3)Male 0.484 0.466 0.018White 0.197 0.107 0.090∗∗
Asian 0.206 0.204 0.003Black 0.276 0.302 −0.026Hispanic 0.315 0.383 −0.068∗
Free Lunch 0.651 0.699 −0.0488th Grade Test Scores 0.199 0.161 0.038
Core Regents Performance:Comprehensive English 76.890 75.215 1.675Living Environment 74.932 74.569 0.364Int. Algebra 68.795 69.484 −0.689U.S. History 77.513 76.542 0.971Global History 72.184 70.781 1.403
Students 54,852 73,416
Note: This table reports summary statistics for students in New York City taking a core Regents exam in 2010-2011.Column 1 reports mean values for students enrolled in a school that is in the distributed scoring pilot program.Column 2 reports mean values for students not enrolled in a school that is in the distributed scoring pilot program.Column 3 reports the difference in means with standard errors clustered at the school level. *** = significant at1 percent level, ** = significant at 5 percent level, * = significant at 10 percent level. See the data appendix foradditional details on the sample construction and variable definitions.
68

Appendix Table A7: Difference-in-Differences Placebo Estimates
Pre-ReformMean Reduced Form
Panel A: Characteristics (1) (2) (3)Male 0.470 0.0100 0.0092
(0.499) (0.0074) (0.0066)White 0.144 −0.0004 −0.0049
(0.351) (0.0058) (0.0034)Asian 0.177 0.0049 0.0001
(0.382) (0.0072) (0.0054)Black 0.321 −0.0121 0.0013
(0.467) (0.0101) (0.0054)Hispanic 0.352 0.0101 0.0057
(0.478) (0.0091) (0.0061)Free Lunch 0.582 0.0225∗∗ 0.0245∗∗∗
(0.493) (0.0092) (0.0076)Above Median 8th Score 0.546 −0.0027 −0.0063
(0.498) (0.0068) (0.0064)
Panel B: Predicted OutcomesPredicted Graduation 0.795 −0.0002 −0.0017
(0.137) (0.0019) (0.0017)Predicted Regents Requirements 0.885 −0.0005 −0.0010
(0.054) (0.0007) (0.0007)Predicted Adv. Regents Requirements 0.369 0.0001 −0.0040
(0.247) (0.0035) (0.0030)Observations 1,002,804 1,002,804 1,002,804Student Controls – No NoYear x Score Trends – Yes YesSchool Fixed Effects – No Yes
Note: This table reports placebo estimates of test score manipulation on student characteristics. The sample includesstudents entering high school between 2003-2004 and 2010-2011 and taking core Regents exams between 2004-2013.Column 1 reports the sample mean for the pre-reform period between 2004-2010. Columns 2-3 report reducedform results using the interaction of taking the test between 2011-2013 and scoring in the manipulable range. Allspecifications include an indicator for scoring below the manipulable range in 2011-2013, 10-point scale score x subjecteffects, year x subject effects, and 10-point scale score x subject linear trends. We stack student outcomes across theLiving Environment, Math A/Integrated Algebra, and Global History exam subjects and cluster standard errors atthe individual and school levels. *** = significant at 1 percent level, ** = significant at 5 percent level, * = significantat 10 percent level. See the data appendix for additional details on the sample construction and variable definitions.
69

Appendix Table A8: Difference-in-Differences Results by Subject
All Core Living Int. Global U.S.Exams Env. Algebra History English History
Panel A: High School Grad. (1) (2) (3) (4) (5) (6)Graduate High School 0.215∗∗∗ 0.181∗∗∗ 0.138∗∗ 0.182∗∗∗ 0.315∗∗∗ 0.292∗∗∗
(0.023) (0.037) (0.055) (0.025) (0.078) (0.047)[0.799] [0.826] [0.759] [0.795] [0.800] [0.835]
Panel B: Diploma RequirementsRegents Req. Taken 0.037 0.019 −0.054 0.053∗∗ 0.082∗ 0.043
(0.032) (0.050) (0.095) (0.026) (0.048) (0.029)[0.896] [0.912] [0.861] [0.905] [0.884] [0.938]
Adv. Regents Req. Taken −0.106∗∗ −0.132∗∗ −0.453∗∗∗ 0.087∗ −0.212∗∗ −0.064(0.044) (0.059) (0.101) (0.049) (0.101) (0.059)[0.366] [0.415] [0.327] [0.374] [0.350] [0.373]
Panel C: Advanced Science and Math ExamsTake Physical Science Exam 0.028 0.008 −0.055 0.038 0.013 0.076
(0.027) (0.046) (0.075) (0.030) (0.079) (0.050)[0.722] [0.786] [0.674] [0.725] [0.697] [0.744]
Take Adv. Math Sequence −0.066∗ −0.077∗ −0.367∗∗∗ 0.135∗∗∗ −0.181∗ −0.069(0.038) (0.045) (0.092) (0.046) (0.098) (0.059)[0.389] [0.430] [0.352] [0.398] [0.376] [0.401]
Observations 1,674,762 301,881 367,517 333,406 376,374 295,584Student Controls Yes Yes Yes Yes Yes YesYear x Score Trends Yes Yes Yes Yes Yes YesSchool Fixed Effects Yes Yes Yes Yes Yes Yes
Note: This table reports two-stage least squares estimates of the effect of test score manipulation by subject. Thesample includes students entering high school between 2003-2004 and 2010-2011 and taking core Regents examsbetween 2004-2013. We use the interaction of taking the test between 2011-2013 and scoring in the manipulable rangeas an instrument for scoring 65+ on the first administration. All specifications include the baseline characteristicsfrom Table 1, an indicator for scoring below the manipulable range in 2011-2013, 10-point scale score x subject effects,year x subject effects, and 10-point scale score x subject linear trends. Standard errors are clustered at both thestudent and school level. The pre-reform sample mean for each subgroup is reported in brackets. *** = significantat 1 percent level, ** = significant at 5 percent level, * = significant at 10 percent level. See the data appendix foradditional details on the sample construction and variable definitions.
70
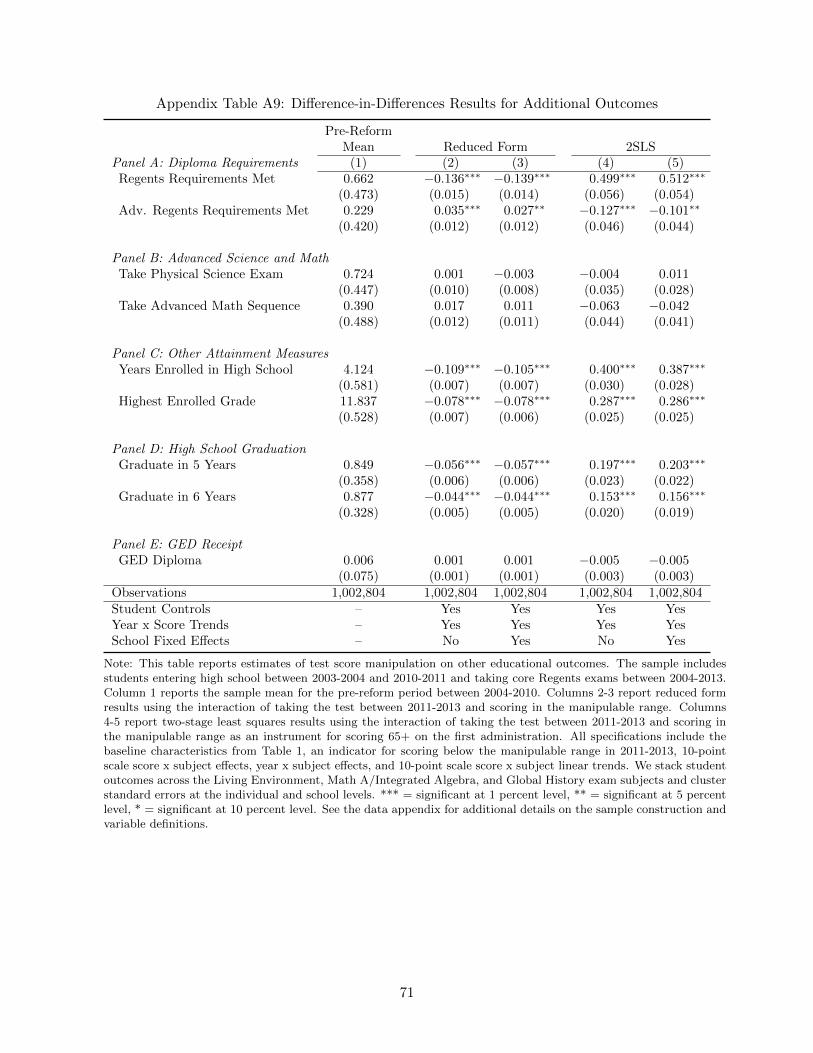
Appendix Table A9: Difference-in-Differences Results for Additional Outcomes
Pre-ReformMean Reduced Form 2SLS
Panel A: Diploma Requirements (1) (2) (3) (4) (5)Regents Requirements Met 0.662 −0.136∗∗∗ −0.139∗∗∗ 0.499∗∗∗ 0.512∗∗∗
(0.473) (0.015) (0.014) (0.056) (0.054)Adv. Regents Requirements Met 0.229 0.035∗∗∗ 0.027∗∗ −0.127∗∗∗ −0.101∗∗
(0.420) (0.012) (0.012) (0.046) (0.044)
Panel B: Advanced Science and MathTake Physical Science Exam 0.724 0.001 −0.003 −0.004 0.011
(0.447) (0.010) (0.008) (0.035) (0.028)Take Advanced Math Sequence 0.390 0.017 0.011 −0.063 −0.042
(0.488) (0.012) (0.011) (0.044) (0.041)
Panel C: Other Attainment MeasuresYears Enrolled in High School 4.124 −0.109∗∗∗ −0.105∗∗∗ 0.400∗∗∗ 0.387∗∗∗
(0.581) (0.007) (0.007) (0.030) (0.028)Highest Enrolled Grade 11.837 −0.078∗∗∗ −0.078∗∗∗ 0.287∗∗∗ 0.286∗∗∗
(0.528) (0.007) (0.006) (0.025) (0.025)
Panel D: High School GraduationGraduate in 5 Years 0.849 −0.056∗∗∗ −0.057∗∗∗ 0.197∗∗∗ 0.203∗∗∗
(0.358) (0.006) (0.006) (0.023) (0.022)Graduate in 6 Years 0.877 −0.044∗∗∗ −0.044∗∗∗ 0.153∗∗∗ 0.156∗∗∗
(0.328) (0.005) (0.005) (0.020) (0.019)
Panel E: GED ReceiptGED Diploma 0.006 0.001 0.001 −0.005 −0.005
(0.075) (0.001) (0.001) (0.003) (0.003)Observations 1,002,804 1,002,804 1,002,804 1,002,804 1,002,804Student Controls – Yes Yes Yes YesYear x Score Trends – Yes Yes Yes YesSchool Fixed Effects – No Yes No Yes
Note: This table reports estimates of test score manipulation on other educational outcomes. The sample includesstudents entering high school between 2003-2004 and 2010-2011 and taking core Regents exams between 2004-2013.Column 1 reports the sample mean for the pre-reform period between 2004-2010. Columns 2-3 report reduced formresults using the interaction of taking the test between 2011-2013 and scoring in the manipulable range. Columns4-5 report two-stage least squares results using the interaction of taking the test between 2011-2013 and scoring inthe manipulable range as an instrument for scoring 65+ on the first administration. All specifications include thebaseline characteristics from Table 1, an indicator for scoring below the manipulable range in 2011-2013, 10-pointscale score x subject effects, year x subject effects, and 10-point scale score x subject linear trends. We stack studentoutcomes across the Living Environment, Math A/Integrated Algebra, and Global History exam subjects and clusterstandard errors at the individual and school levels. *** = significant at 1 percent level, ** = significant at 5 percentlevel, * = significant at 10 percent level. See the data appendix for additional details on the sample construction andvariable definitions.
71
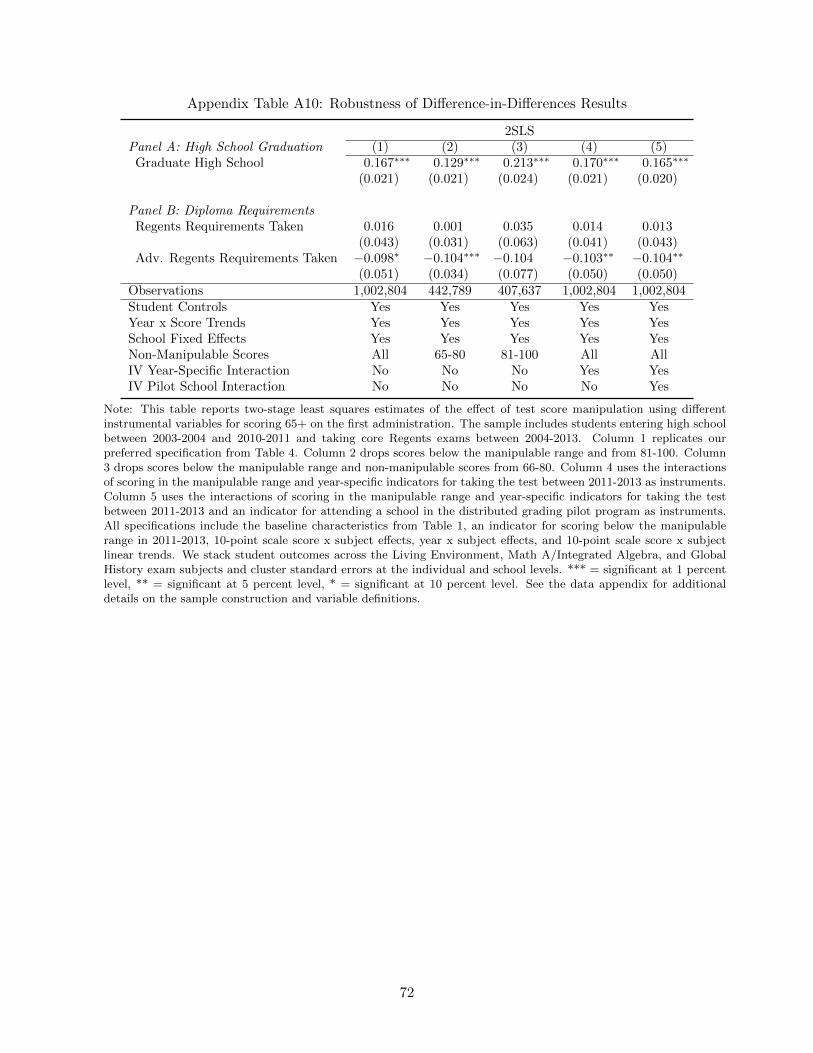
Appendix Table A10: Robustness of Difference-in-Differences Results
2SLSPanel A: High School Graduation (1) (2) (3) (4) (5)Graduate High School 0.167∗∗∗ 0.129∗∗∗ 0.213∗∗∗ 0.170∗∗∗ 0.165∗∗∗
(0.021) (0.021) (0.024) (0.021) (0.020)
Panel B: Diploma RequirementsRegents Requirements Taken 0.016 0.001 0.035 0.014 0.013
(0.043) (0.031) (0.063) (0.041) (0.043)Adv. Regents Requirements Taken −0.098∗ −0.104∗∗∗ −0.104 −0.103∗∗ −0.104∗∗
(0.051) (0.034) (0.077) (0.050) (0.050)Observations 1,002,804 442,789 407,637 1,002,804 1,002,804Student Controls Yes Yes Yes Yes YesYear x Score Trends Yes Yes Yes Yes YesSchool Fixed Effects Yes Yes Yes Yes YesNon-Manipulable Scores All 65-80 81-100 All AllIV Year-Specific Interaction No No No Yes YesIV Pilot School Interaction No No No No Yes
Note: This table reports two-stage least squares estimates of the effect of test score manipulation using differentinstrumental variables for scoring 65+ on the first administration. The sample includes students entering high schoolbetween 2003-2004 and 2010-2011 and taking core Regents exams between 2004-2013. Column 1 replicates ourpreferred specification from Table 4. Column 2 drops scores below the manipulable range and from 81-100. Column3 drops scores below the manipulable range and non-manipulable scores from 66-80. Column 4 uses the interactionsof scoring in the manipulable range and year-specific indicators for taking the test between 2011-2013 as instruments.Column 5 uses the interactions of scoring in the manipulable range and year-specific indicators for taking the testbetween 2011-2013 and an indicator for attending a school in the distributed grading pilot program as instruments.All specifications include the baseline characteristics from Table 1, an indicator for scoring below the manipulablerange in 2011-2013, 10-point scale score x subject effects, year x subject effects, and 10-point scale score x subjectlinear trends. We stack student outcomes across the Living Environment, Math A/Integrated Algebra, and GlobalHistory exam subjects and cluster standard errors at the individual and school levels. *** = significant at 1 percentlevel, ** = significant at 5 percent level, * = significant at 10 percent level. See the data appendix for additionaldetails on the sample construction and variable definitions.
72

Appendix B: Additional Details for the New York Regents Examinations
[NOT FOR PUBLICATION]
This appendix contains additional details on the history and structure of the New York Regents
Examinations and their recent use in state and city school accountability policies.
A. Historical and Structural Details
The original Regents exams were administered as high school entrance exams for 8th grade stu-
dents as early as 1865. These entrance exams were phased out relatively quickly, however, and in
1878 the Regents began offering advanced academic exams in various subjects to be used in college
admissions. A fuller accounting of the Regents first 100 years can be found in Tinkelman (1965).
Among the most important changes in recent years was the introduction of a new minimum com-
petency test in the late 1970s that students were required to pass in order to graduate from high
school. This competency test was replaced in the late 1990s by graduation requirements tied to
the more demanding, end-of-course Regents Examinations we examine in this paper (Chudowsky
et al. 2002).
While requirements in the English, science, and social studies exams remained fairly constant
during our sample period, there were important changes to Regents’ math requirements. Until
2002, students were required to pass the Sequential Math 1 exam, which covered primarily algebra,
to graduate from high school. Sequential Math 2 and Sequential Math 3 were optional math courses
available for students wanting to cover more advanced material. From 2003 to 2009, students were
required to pass the Math A exam, which covered approximately the same material as the first 1.5
courses in the Sequential Math sequence, to graduate. Compared to Sequential Math 1, Math A
had fewer multiple choice questions and more long-answer questions, and included a number of new
subjects like geometry and trigonometry. An additional exam (Math B) was also available during
this period for more advanced students. From 2009 to the present, the Regents exams reverted back
to year-long math courses separated into Algebra, Geometry, and Algebra 2. Students are only
required to pass the first Algebra exam to graduate from high school. There was a year of overlap
between the Math A/B exams and the current math exams because while Math A was typically
taken by 10th grade students, the first Algebra course under the current system is typically taken
by 9th grade students.
Scoring of regents exams followed very explicit policies. For the English and social studies
exams, principals are required to designate a scoring coordinator who is responsible for managing
the logistics of scoring, assigning exams to teachers, and providing teachers with necessary training.
For essay questions, the materials available to support this training include scoring rubrics and
pre-scored “anchor papers” that provide detailed commentary on why the example essays merited
different scores. For open-ended questions, the materials include a rubric to guide scoring. A single
qualified teacher grades the open-ended questions on the social science exams. In the math exams,
the school must establish a committee of three mathematics teachers to grade the examinations,
73

and no teacher should rate more than a third of the open-ended questions in mathematics. In
the science exams, the school must establish a committee of two science teachers to grade the
examinations, and no teacher should rate more than a half of the open-ended questions.
During our primary sample period (2003-2004 to 2009-2010), grading guidelines distributed to
teachers typically included the following text explaining this policy: “All student answer papers
that receive a scale score of 60 through 64 must be scored a second time to ensure the accuracy
of the score. For the second scoring, a different committee of teachers may score the student’s
paper or the original committee may score the paper, except that no teacher may score the same
open-ended questions that he/she scored in the first rating of the paper. The school principal
is responsible for assuring that the student’s final examination score is based on a fair, accurate
and reliable scoring of the student’s answer paper.” See for example: https://www.jmap.org/
JMAPRegentsExamArchives/INTEGRATEDALGEBRAEXAMS/0610ExamIA.pdf.
Two exceptions to these grading guidelines that we are aware of are the Chemistry exam in
June 2001, which was only based on multiple choice questions, and the Living Environment exam
in June 2001, where exams with scale scores from 62 to 68 were to be re-scored.
B. Use in School Accountability
In order to meet requirements for Adequate Yearly Progress (AYP) under the 2002 No Child Left
Behind Act, high schools in New York must meet several criteria related to Regents examination
participations and performance. First, 95 percent of a school’s 12th graders must have taken the
Regents Examinations in mathematics and English or an approved alternative (NYSED 2010). Sec-
ond, the same must be true for all sub-groups with at least 40 students, where subgroups are based
on race/ethnicity, poverty status, and program receipt. Third and fourth, a school’s performance
indices based on the Regents examinations in math and English must meet the statewide objectives
for both its overall student population and among accountability sub-groups. The subject-specific
performance indices are increasing in the share of students whose scale scores on the Regents Ex-
amination exceed 55, with students whose scores exceed 65 having twice the impact on this index.
Specifically, the performance index equals 100*[(count of cohort with scale scores ≥ 55 + count of
cohort with scale scores ≥ 65) / cohort size] (NYSED 2010). Thus, the performance index ranges
from 0 (i.e., all students have scale scores below 55) to 200 (i.e., all students have scale scores of
65 or higher). These state-mandated performance objectives increased annually in order to meet
NCLB’s mandated proficiency goals for the school year 2013-2014. The fifth measure relevant to
whether a high school makes AYP is whether its graduation rate meets the state standard, which
is currently set at 80 percent. Like the other criteria, this standard is also closely related to the
Regents Examinations, since eligibility for graduation is determined in part by meeting either the
55 or 65 scale score thresholds in the five core Regents Examinations.
New York City’s separate accountability system awarded grades (A to F) to high schools starting
in 2007. To form the school grades, the NYCDOE calculated performance within three separate
elements of the progress report: school environment (15 percent of the overall score), student
74

performance (20-25 percent), and student progress (55-60 percent). The school environment score
was determined by responses to surveys of students (in grades 6 and above), parents, and teachers,
as well as student attendance rates. For high schools, student performance is measured using the
four year graduation rate, the six year graduation rate, a ‘weighted’ four year graduation rate,
and a ‘weighted’ six year graduation rate. The weighted graduation rates assign higher weights to
more advanced diploma types based on the relative level of proficiency and college readiness the
diploma indicates. Student progress is measured using a variety of metrics that indicate progress
toward earning a high school degree. Most importantly for our analysis, student progress includes
the number of passed Regents exams in core subjects. Student progress also depends on a Regents
pass rate weighted by each student’s predicted likelihood of passing the exam. A school’s score
for each element (e.g., student progress) is determined both by that school’s performance relative
to all schools in the city of the same type and relative to a group of peer schools with observably
similar students. Performance relative to peer schools is given triple the weight of citywide relative
performance. A school’s overall score was calculated using the weighted sum of the scores within
each element plus any additional credit received. Schools can also receive “additional credit” for
making significant achievement gains among students with performance in the lowest third of all
students citywide who were Hispanic, black, or other ethnicities, and students in English Language
Learner (ELL) or Special Education programs. See Rockoff and Turner (2010) for additional details
on the NYCDOE accountability system.
C. Grading Appeals
Beginning with students entering high school in the fall of 2005, eligible students may appeal to
graduate with a local or Regents diploma using a score between 62 and 64. Students are eligible to
appeal if they have taken the Regents Examination under appeal at least two times, have at least
one score between 62 and 64 on this exam, have an attendance rate of at least 95 percent for the
most recent school year, have a passing course average in the Regents subject, and is recommended
for an exemption by the student’s school. In addition, students who are English language learners
and who first entered school in the United States in grade 9 or above may appeal to graduate with
a local diploma if they have taken the required Regents Examination in English language arts at
least twice and earned a score on this exam between 55 and 61.
75

Appendix C: Data Appendix
[NOT FOR PUBLICATION]
This appendix contains all of the relevant information on the cleaning and coding of the variables
used in our analysis.
A. Data Sources
Regents Scores: The NYCDOE Regents test score data are organized at the student-by-test ad-
ministration level. Each record includes a unique student identifier, the date of the test, and test
outcome. These data are available for all NYC Regents test takers from the 1998-1999 to 2012-2013
school years.
Enrollment Files: The NYCDOE enrollment data are organized at the student-by-year level.
Each record includes a unique student identifier and information on student race, gender, free
and reduced-price lunch eligibility, school, and grade. These data are available for all NYC K-12
public school students from the 2003-2004 to 2012-2013 school years.
State Test Scores: The NYCDOE state test score data are organized at the student-by-year or
student-by-test administration level. The data include scale scores and proficiency scores for all
tested students in grades three through eight. When using state test scores as a control, we
standardize scores to have a mean of zero and a standard deviation of one in the test-year.
Graduation Files: The NYCDOE graduation files are organized at the student level. For cohorts
entering high school between 2001-2002 and 2009-2010, the graduation data include information
on the receipt a regular high school diploma (i.e. a local, Regents, or advanced Regents diploma)
and the receipt of a GED. The data include information on four-, five-, and six-year graduation
outcomes. Information on diploma type is only available for cohorts entering high school between
2007-2008 and 2009-2010.
National Student Clearinghouse Files: National Student Clearinghouse (NSC) files at the student
level are available for cohorts in the graduation files entering high school between 2001-2002 and
2004-2005. The NSC is a non-profit organization that maintains enrollment information for 92 per-
cent of colleges nationwide. The NSC data contain information on enrollment spells for all covered
colleges that a student attended, though not grades or course work. The NYCDOE graduation files
were matched to the NSC database by NSC employees using each student’s full name, date of birth,
and high school graduation date. Students who are not matched to the NSC database are assumed
to have never attended college, including the approximately four percent of requested records that
were blocked by the student or student’s school. See Dobbie and Fryer (2014) for additional details.
76

NCLB Adequate Yearly Progress: Data on Adequate Yearly Progress come from the New York
State Education Department’s Information and Reporting Services. These data are available from
2004-2011.
NYC School Grades: Data on school grades come from the NYCDOE’s School Report Cards. These
data are available from 2008-2012.
Regents Raw-to-Scale Score Conversion Charts: Raw-to-scale-score conversion charts for all Re-
gents exams were downloaded from www.jmap.org and www.nysedregents.org. We use the raw-to-
scale-score conversion charts to mark impossible scale scores, and to define which scale scores are
manipulable. Specifically, we define a score as manipulable if it is within 2 raw points (or 1 essay
point) above the proficiency threshold. To the left of each proficiency cutoff, we define a scale score
as manipulable if it is between 50-54 or 60-64.
B. Sample Restrictions
We make the following restrictions to the final dataset used to produce our main results documenting
manipulation:
1. We only include “core” Regents exams taken after 2003-2004. Exams taken before 2003-2004
cannot be reliably linked to student demographics. The core Regents exams during this time
period include: Integrated Algebra (from 2008 onwards), Mathematics A (from 2003-2008),
Living Environment, Comprehensive English, U.S. History and Global History. These exams
make up approximately 75 percent of all exams taken during our sample period. Occasionally
we extend our analysis to include the following “elective” Regents exams: Math B, Chemistry,
and Physics. We do not consider foreign language exams due, in part, to the lack of score
conversion charts for these years. We also do not consider Sequential Math exams, which
were taken before 2003. We also focus on exams taken in the regular test period. This
restriction drops all core exams taken in August and the Living Environment, U.S. History,
and Global History exams taken in January. We also drop all elective exams taken in January
and August. However, the patterns we describe in the paper also appear in the these test
administrations. Following this first set of sample restrictions, we have 2,470,187 exams in
our primary window of 2003-2004 to 2009-2010.
2. Second, we drop observations with scale scores that are not possible scores for that given
exam. This sample restriction leaves us with 2,453,437 remaining exams.
3. Third, we only consider a student’s first exam in each subject to avoid any mechanical bunch-
ing around the performance thresholds due to re-taking behavior. This sample restriction
leaves us with 1,977,221 remaining exams.
4. Fourth, we drop students who are enrolled in non-high schools, special education schools,
and schools with extremely low enrollments. This sample restriction leaves us with 1,820,899
77
remaining exams.
5. Fifth, we drop all exams originating from schools where more than five percent of core exam
scores contain reporting errors. This is to eliminate schools with systematic mis-grading.
This sample restriction leaves us with 1,728,043 remaining exams.
6. Finally, we drop special education students who are held to different accountability standards
during our sample period (see Appendix Table A1). This sample restriction leaves us with
1,629,910 core exams from 514,632 students in our primary sample.
C. Adjustments to Raw Frequency Counts
We create the frequency counts of each exam using the following four step process:
1. First, we collapse the test-year-month-student-level data to the test-year-month-scaled score
level, gathering how many students in a given test-year-month achieve each scaled score.
2. Second, we divide this frequency of students-per-score by the number of raw scores that map
to a given scaled score in order to counter the mechanical overrepresentation of these scaled
scores. We make one further adjustment for Integrated Algebra and Math A exams that show
regular spikes in the frequency of raw scores between 20-48 due to the way multiple choice
items are scored. We adjust for these mechanical spikes in the distribution by taking the
average of adjacent even and odd scores between 20-48 for these subjects.
3. Third, we collapse the adjusted test-year-month-scaled score level data to either the test-
scaled score or just scaled score level using frequency weights.
4. Finally, we express these adjusted frequency counts as the adjusted fraction of all test takers
in the sample to facilitate the interpretation of the estimates.
D. Misc. Data Cleaning
Test Administration Dates: We make two changes to the date of test administration variable. First,
we assume that any Math A exams taken in 2009 must have been taken in January even if the data
file indicates a June administration, as the Math A exam was last administered in January of 2009.
Second, we assume that any test scores reported between January and May could not have been
taken in June. We therefore assume a January administration in the same year for these exams.
Finally, we drop any exams with corrupted or missing date information that can not be inferred.
Duplicates Scores: A handful of observations indicate two Regents scores for the same student on
the same date. For these observations, we use the max score. Results are identical using the min
or mean score instead.
78