the caribbean tourism industry in century: an assessment
TRANSCRIPT

The Caribbean Tourism Industry in
the 21st Century: An Assessment Desmond Thomas, PhD
KGLACC Working Paper No. 3/2015
Miami, FL
Kimberly Green Latin American and Caribbean Center
Florida International University

2 | P a g e
KIMBERLY GREEN LATIN AMERICAN AND CARIBBEAN CENTER Steven J. Green School of International and Public Affairs • College of Arts and Sciences
Modesto A. Maidique Campus, DM 353 • Miami, FL 33199 • Tel: 305-348-2894 • Fax: 305-348-3593 • [email protected] • http://lacc.fiu.edu
Florida International University is an Equal Opportunity/Access Employer and Institution • TDD via FRS 800-955-8771

Page | 1
Acknowledgements:
I would like to acknowledge the contributions of people who provided reading materials,
data and comments: Sarah Berg, Jose Miguel Cruz, Neville DeHaan, Rory Fraser, Winfield
Griffith, Percy Hintzen, Frank Mora, Liesl Picard, Hugh Riley, Sean Smith, and Sue
Springer. The views expressed are solely my responsibility.

Page | 2
I The Role of the Tourism Industry in Caribbean Countries
Introduction
The Caribbean is the most tourism‐dependent region of the world. Indeed,
although other industries including bauxite, petroleum, sugar and international
banking make significant economic contributions in Caribbean countries, the
region is highly identified internationally in terms of its very image with the
tourism industry. The high dependence on the tourism industry may be
illustrated by reference to some key indicators showing its relatively high
economic contributions. Five out of the top ten countries and 12 out of the top 25
countries in terms of the value added contribution of this industry to total GDP
are Caribbean countries (WTTC data). Similarly, 12 out of the top 25 countries in
the world in terms of the average percentage of visitor export receipts in total
exports of goods and services for 2006‐11 were from the Caribbean(see figures 1‐
3 below). With an average value‐added contribution of the tourism industry to
GDP of five percent over that period, the Caribbean Region was second only to
North Africa which had a contribution of 5.2 percent. If we use a broader
measure of economic activity, such as the total value‐added contribution which
takes into account indirect and induced contributions, the figure of 19 percent for
the Caribbean Region is almost three times the world average and considerably
higher than those of other regions.
It is arguable that tourism has made a major contribution to the process of
modernization of Caribbean countries over the last five decades. The need to
compete in a global industry catering to a typically sophisticated clientele from
more advanced countries imposes demands for high standards of service,
functioning utilities and good infrastructure. It is also a good complement to
human resource development, responding to the high standards of Caribbean
countries and at the same time encouraging further development.
The empirical literature is revealing in terms of the contributions of tourism
activity to GDP growth globally as well as in particular regions and countries.
With tourism being practised in such a large number of countries, this industry is
highly competitive. Consequently, one possible benefit of the tourism industry is
that it tends to foster efficiency because of the force of unavoidable international
competition. Significantly, the tourism industry is characterized by large firms
(hotel chains, travel agencies, restaurants, etc.) that operate in many countries
and therefore are in a position to influence policy across national boundaries
(Chou, 2013).
This paper attempts to make a broad assessment of the state of the Caribbean
tourism industry as part of general efforts to pursue engines of growth to boost
growth and stability in the sluggish economies of the region. While tourism is
important to the region as a whole, there is much variation in its importance in
individual countries. On the high end are the traditional tourist destinations like
The Bahamas, Barbados, Jamaica and most of the OECS countries, while at the
other end are countries like Guyana, Trinidad and Tobago and Suriname where

Page | 3
other industries dominate. In most of the countries, however, whether they are
traditional tourism‐led countries or not, there is a recognition of the importance
and potential of this industry. There is therefore a common interest in
understanding the performance conditions and factors impacting this industry.1
With tourism being such a major industry in some Caribbean countries, it is
natural to expect that its performance will provide a foundation for economic
growth and stability in Caribbean economies. However, recent empirical
literature has called into question the automatic assumption of a positive
relationship between tourism and growth by way of the ‘tourism‐led growth’
(TLG) hypothesis which examines the magnitude and direction of the link
between these two variables. As part of our assessment of the state of Caribbean
tourism, this paper will present a review of applications of that literature to the
Caribbean region.
By virtue of the fact that tourism provides tradable services, this industry
represents a strong link to the global economy. Consequently, it acts as a major
channel of influence by which the general economic fortunes of many countries
of the region are directly influenced by international volatility. For example, as
with recent downswings and crises in the international economy, adverse
economic shocks have effects in Caribbean countries via the performance of the
tourist industry.
Figure 1. Contribution of Tourism and Value Added to GDP: Top 25 Countries
Source: World Travel and Tourism Council
1 Evidence of the strong policy‐level support for the tourism industry is found in the Bahamas Prime
Minister’s speech delivered to the opening of the 36th Annual CARICOM Heads of Government
Conference in Barbados, on 2 July 2015 in which he said: “tourism … deserves much more attention
at our regional meetings”, and cited the industry as “the fastest path to reducing unemployment in
our region and … reducing debt burdens” (see https://www.onecaribbean.org/bahamas‐prime‐
minister‐perry‐christie‐on‐caribbean‐tourism/ (Caribbean Tourism Organization, 2015)).
0.05.0
10.015.020.025.030.035.040.045.0
Macau
Seychelles
UK Virgin Islands
Maldives
Aruba
Baham
as
Anguilla
Antigua and…
Vanuatu
Cape Verde
Mauritius
Barbados
St Lucia
Belize
Fiji
Other Oceania
Croatia
US Virgin Islands
Cam
bodia
Form
er…
Lebanon
Montenegro
Morocco
Dominica
Jamaica

Page | 4
Figure 2. Total Direct, Indirect and Induced Tourism Contribution to GDP:
Top 25 Countries
Source: World Travel and Tourism Council
Figure 3. Tourism Receipts as Percentage of Export Earnings: Top 25 Countries
Source: World Travel and Tourism Council
0.010.020.030.040.050.060.070.080.090.0
100.0
Macau
Antigua and Barbuda
UK Virgin Islands
Aruba
Seychelles
Anguilla
Maldives
Vanuatu
Baham
asCape Verde
Barbados
St Lucia
Belize
Fiji
Other Oceania
Form
er Netherlands…
Mauritius
Dominica
Jamaica
St Kitts
Croatia
US Virgin Islands
Lebanon
Cam
bodia
St Vincent and the…
0.0
20.0
40.0
60.0
80.0
100.0
120.0
Cape Verde
Macau
Anguilla
Antigua and Barbuda
Maldives
Vanuatu
Baham
asBarbados
Gam
bia
St Lucia
Grenada
Dominica
UK Virgin Islands
Other Oceania
Guadeloupe
St Vincent and the…
St Kitts
Albania
Jamaica
Tonga
Sao Tome & Principe
Montenegro Fiji
Seychelles
Croatia

Page | 5
Plan of the paper
The paper will proceed with a description of the Caribbean tourism industry in
Section II to set the stage for the assessment by outlining the diversity of country
types in the region and their basic characteristics. Section III will sketch the
outlines of the Tourism‐led Growth hypothesis. Section IV will examine some
key indicators to obtain an assessment of the performance of the Caribbean
tourism industry regionally and in individual countries. In Section V we look at a
group of Caribbean countries to derive a sense of the relevance of pricing trends
in tourism industry performance. Finally, Section VI will provide some
concluding remarks. This paper also provides two annexes containing the
Caribbean arrivals and tourist spending data that have been used in this paper.
II Description of the Caribbean Tourism Industry
Caribbean countries are diverse in terms of the conditions and institutional
structures which are relevant to the examination of tourism performance in the
region. Table 1 has been compiled to show some basic features of country size
and the importance of tourism to begin with. For the purpose of this study,
‘Caribbean countries’ will refer to the member countries of the Caribbean
Tourism Organization (CTO), with Venezuela being excluded because of its size
and industrial characteristics that distinguish it from the other countries, and
Montserrat being excluded because of the way its attention has been diverted to
recovery from the volcanic eruption in recent years. The main data sources for
the study are the CTO, the UN World Tourism Organization (UNWTO) and the
World Travel and Tourism Council (WTTC).
The Caribbean countries included in this study fall into four linguistic groups:
Dutch, English, French and Spanish (see Table 2). The linguistic groupings are
significant partly because they influence the source markets for tourists, with the
Dutch and French countries especially attracting high proportions of visitors
from Europe, the English countries depending mainly on visitors from North
America and the UK, and the Spanish countries depending mainly on North
American visitors. The Spanish countries are also larger in absolute size leading
to higher scales of operations.2
Table 1 shows the high importance of tourism with ten countries having shares
of total GDP for the industry of over 10 percent. Although the tourism value
added shares may not appear to be very high, for most of the Caribbean
countries tourism plays a central role in economic activity. Typically in the
traditional tourism‐led countries, the sectors that contribute more to GDP than
tourism are mainly non‐tradable services including wholesale and retail trade,
real estate business, finance and insurance, and public administration.3
2 Haiti is also a large country in the region but without a well‐established tourism industry.
3 Source:
http://www.caricomstats.org/Files/Publications/National%20Accounts%20Digest/NationalAccounts2
014.pdf (Caribbean Community Secretariat, 2015). Tourism is not separated as a major sector in the

Page | 6
Consequently, tourism plays a critical role not only as a source of income but
also as the basis for external stability in these highly open economies. Table 1
also shows the heavy dependence of this group of countries on tourism as a
source of foreign exchange earnings. For ten of the countries tourism delivers
more foreign exchange earnings than all other exports of goods and services
combined while the average share of tourism in total export earnings for the
group is 39 percent.
system of national accounts. We use the category ‘hotels and restaurants,’ limited as it is, to represent
tourism.

Page | 7
Table 1. Selected Country Data
4 2010 population figure. 5 Bonaire, Curacao, Saba, St. Eustatius and St. Maarten.
Tourism Value‐added
/GDP (2006‐11) (%)
Tourism earnings
/Total Exports (%)
Population
(2013)
Country % % Persons
Anguilla 19.6 78.9 14300
Antigua & Barbuda 18.0 77.8 89985
Aruba 21.6 29.8 102911
Bahamas 20.8 61.8 377374
Barbados 13.7 60.6 284644
Belize 13.3 34.4 331900
Bermuda4 6.7 19 64237
Cayman Is. 6.1 18.3 58435
Cuba 2.8 19.3 11265629
Dominica 8.9 53.7 72003
Dominican Republic 5.3 37 10403761
Former Netherland Antilles5 10.5 36.7 223123
Grenada 6.5 54.9 105897
Guadeloupe 2.2 50.8 403750
Guyana 4.1 5.9 799613
Haiti 2.2 24.3 10317461
Jamaica 8.8 45.2 2783888
Martinique 2.3 32.5 386486
Puerto Rico 2.2 4.7 3688318
St. Kitts‐Nevis 7.9 49.2 54191
St. Lucia 13.4 58.8 182273
St. Vincent & Grenadines 6.6 50.8 109373
Suriname 1.8 4.4 539276
Trinidad & Tobago 1341151
UK Virgin Is. 25.5 51 28341
US Virgin Is. 10.9 8.8 106405 Sources: WTTC and UNSTA online tables

Page | 8
If we define large countries as those with a population over one million, the
group includes six large countries: Cuba, the Dominican Republic, Haiti, Jamaica,
Puerto Rico and Trinidad and Tobago. It can be expected that these countries
have a more diverse resource base and therefore may have less of a critical
dependence on tourism. Not surprisingly therefore, the value added contribution
of tourism in these countries is found to vary in the 2 – 9% range, which is below
the average for the group of countries. Although the larger countries show lower
figures for the contribution of tourism value added to GDP, the absolute sizes of
their tourism sectors make them major players in the regional industry. For
example, Anguilla with tourism earnings amounting to 78 percent of total export
earnings had 547 rooms in 2010 compared to 66,790 rooms in the Dominican
Republic, 28,304 rooms in Jamaica, 15,153 in the Bahamas and 6,775 in Barbados.
Table 2. Selected Caribbean Countries by Linguistic Grouping
Dutch English French Spanish
Aruba Anguilla Guadeloupe Cuba
Bonaire Antigua and
Barbuda
Haiti Dominican
Republic
Curacao The
Bahamas
Martinique Puerto Rico
Saba Barbados
St.
Eustatius
Belize
St. Maarten Bermuda
Suriname British
Virgin Is.
Cayman
Dominica
Grenada
Guyana
Jamaica
Montserrat
St. Kitts &
Nevis
St. Lucia
St. Vincent
&
Grenadines
Trinidad
and Tobago
Turks &
Caicos
USVI

Page | 9
Guyana and Suriname stand out as small countries with relatively large land
masses where tourism has not traditionally been a leading industry and is
therefore relatively small. Guadeloupe and Martinique also have low GDP
contributions which may be related to their institutional arrangements as French
Departments. Cuba is a special case not only because of its size but more
especially because the US‐led embargo that it operates under impacts the level
and pattern of economic activity in this sector.
Tourism arrivals in the Caribbean are dominated by three main source markets,
namely the US, Canada, and Europe, with the US being the leading one. As
figure 4 illustrates, 44 percent of Caribbean tourists originated in the US, 18
percent came from Europe, 15 percent from Canada and the remaining 22
percent were from ‘other’ countries in 2014, which is typical. Although this
ranking of source markets holds for most countries, exceptions include Antigua
and Barbuda, Barbados, Curacao, Dominica Grenada, Guyana and Suriname.
The leading market for Barbados and Antigua and Barbuda, Curacao and
Suriname is Europe, overwhelmingly the UK for the first two, and The
Netherlands for the last two. The category of ‘other’ countries typically reflects
the often overlooked importance of tourists from other countries within the
Caribbean. This is especially important for Curacao, Dominica, Grenada, Guyana
and Suriname. Particularly in the cases of Curacao, Guyana and Suriname, the
high numbers in this category is also attributable to a rising interaction with
Brazil and other South American neighbors.
The pattern of major source markets for tourists has major implications for the
performance of the industry in the Caribbean and for policies to strengthen the
industry. It indicates the close economic links which these countries have with
the global economy and the underlying vulnerability to economic shocks that
originate in the source markets. In addition, the concentrated pattern with
essentially three countries (US, UK, and Canada) accounting for around 70
percent of total arrivals to the region raises the question of what can be done to
diversify markets and thereby increase the resilience of the regional industry. As
the composition of global tourist spending shifts toward China and other
emerging markets, the continued reliance on the traditional markets comes
under question. It becomes a question of what cost‐effective strategies can be
used to diversify the market as part of a growth strategy.

Page | 10
Figure 4. Caribbean Arrivals by Major Market Share, 2014
Source: Caribbean Tourism Organization
The Caribbean tourism product is by its nature essentially a leisure product. The
2015 WTTC report indicates that tourist spending on leisure activities in the
Caribbean amounted to 90.6 percent of total spending with business spending
accounting for the remaining 9.4 percent. Caribbean tourism also caters
overwhelmingly to foreign tourists with 70 to 80 percent of total spending for the
region as a whole being done by tourists from outside the region.6
So far we have focused on stopover tourism to the exclusion of cruise tourism
which is very important in the Caribbean. For example, in 2014, the total number
of cruise arrivals in Caribbean countries amounted to 20.6 million compared to
22.2 million stopover arrivals. For research purposes, cruise tourism tends to get
less attention than stopover tourism chiefly because its value added contribution
to the host economy is lower than that for stopover tourism, and it is less subject
to domestic policy‐making because of its international nature. It is clear that this
area deserves more detailed research in order to inform policy‐making in this
area and strengthen the hands of governments in their negotiations with
international operators. However, for the purposes of this paper the focus will be
exclusively on stopover tourism, mindful that some of the conclusions will be
relevant with regard to cruise tourism also.
6See (World Travel and Tourism Council, 2015); http://www.wttc.org/‐
/media/files/reports/economic%20impact%20research/regional%202015/caribbean2015.pdf
44.4
15.3
18.0
22.2
US Canada Europe Other

Page | 11
Table 3. Tourist Arrivals by Major Markets, 2014
US % Canada % Europe % Other %
Anguilla 45,446 64.1 3,709 5.2 7,968 11.2 13,804 19.5 70927
Antigua 95,332 38.2 27,701 11.1 91,277 36.6 35,006 14.0 249316
Aruba 576,783 53.8 43,767 4.1 80,155 7.5 371,377 34.6 1072082
Bahamas 1,102,493 77.5 144,101 10.1 82,712 5.8 92,554 6.5 1421860
Barbados 118,508 22.8 65,813 12.7 231,559 44.6 103,718 20.0 519598
Belize 199,321 62.1 26,397 8.2 38,904 12.1 56,595 17.6 321217
Bermuda 159,326 71.0 29,120 13.0 22,813 10.2 12,987 5.8 224246
Cayman 287,969 75.2 24,908 6.5 36,405 9.5 33,534 8.8 382816
Cuba1 ‐ 1,174,972 39.1 730,304 24.3 1,096,682 36.5 3001958
Curacao 52,942 11.7 12,406 2.8 185,446 41.1 200,159 44.4 450953
Dominica(a) 17,900 25.0 2,684 3.7 13,291 18.6 37,744 52.7 71619
Dominican R. 1,784,486 34.7 706,394 13.7 1,183,784 23.0 1,466,713 28.5 5141377
Grenada 35,313 26.4 13,270 9.9 31,292 23.4 53,645 40.2 133520
Guyana 84,103 40.9 26,681 13.0 11,107 5.4 83,933 40.8 205824
Haiti(a) 317,371 75.9 32,606 7.8 36,703 8.8 31,498 7.5 418178
Jamaica 1,296,457 62.3 419,898 20.2 261,081 12.6 102,745 4.9 2080181
Montserrat 2,041 23.2 678 7.7 2,433 27.6 3,652 41.5 8804
Puerto Rico 1,538,508 91.1 21,670 1.3 36,001 2.1 92,293 5.5 1688472
Saint Lucia 142,746 42.2 41,502 12.3 93,610 27.7 60,300 17.8 338158
St. Kitts‐Nevis 64,223 61.3 8,153 7.8 10,835 10.3 21,519 20.5 104730
St. Maarten 266,611 53.3 51,146 10.2 106,848 21.4 75,315 15.1 499920
St. Vincent & Gr.. 19,838 28.1 7,203 10.2 20,784 29.4 22,888 32.4 70713
Suriname 7,797 3.1 1,826 0.7 113,261 45.0 128,727 51.2 251611
Trinidad &
Tobago 158,501 38.4 54,877 13.3 79,839 19.4 119,320 28.9 412537
Turks & Caicos(a) 297,309 80.8 38,767 10.5 8,475 2.3 23,613 6.4 368164
TOTAL 8,671,324 44.4 2,980,249 15.3 3,516,887 18.0 4,340,321 22.2 19,508,781 Source: CTO Statistics; a: Jan.‐Nov.

Page | 12
III Empirical Evidence of Tourism-Led Growth
It is reasonable to expect that tourism activity would tend to have a positive
impact on economic growth given the fact that its proceeds contribute to all the
components of aggregate national expenditure: consumption, investment,
government spending and net exports. In addition, it has potentially large
spillover effects in terms of its impact on the balance of payments, employment,
tax revenue and generation of activity in other industries. Nonetheless, it is also
conceivable for tourism to have a negative impact on economic growth where,
for example, tourism expansion may increase the relative price of non‐traded
goods with positive effects on revenue, with that price increase leading to a
lowering of demand for capital used in the traded goods sector and subsequent
de‐industrializaion in that sector. In addition, tourism activity may put upward
pressure on general price levels resulting in lower overall employment and
welfare (Chou, 2013) (Chao, et al., 2006). It is therefore essentially an empirical
matter whether the overall impact of tourism on GDP in a particular country is
positive or not.
A considerable literature has sprung up over the last two decades to explore the
hypothesis, commonly referred to as the tourism‐led growth hypothesis (TLG),
that tourism has a significant positive impact on GDP growth (Pablo‐Romero &
Molina, 2013)7. This literature consists of various tests of the hypothesis in
different countries and groups of countries to determine the existence of a
relationship between tourism growth and economic growth, and whether the
relationship, if any, is positive or not. However, another significant possibility
pursued by the literature is for the causal relationship to be reversed, with
aggregate economic development impacting the growth of the tourism industry.
The typical explanation is that economic growth may be accompanied by a policy
environment and improvements in infrastructure and human capital standards
that provide favorable conditions for tourism growth. To test for this alternative
hypothesis, referred to as the economic‐driven tourism growth hypothesis,
studies typically employ Granger‐type causality tests to determine whether
causation flows from tourism to growth or the other way around.
Investigation of the TLG hypothesis has been pursued using the gamut of
methodologies including time‐series, panel‐data, and cross‐section studies,
computable general equilibrium models and Cobb‐Douglas production
functions. The research has mostly examined the existence of a relationship
between GDP growth and tourism growth (often using cointegration methods)
with some attention to the direction of causation between the two.
In a comprehensive review of the literature on empirical studies of the TLG
hypothesis, Pablo‐Romero and Molina (2013) analyzed a large number of studies
which were grouped in terms of time‐series, panel‐data and cross‐section
methodologies. The evidence overwhelmingly favoured the TLG hypothesis. Out
of 63 time‐series studies they found that 41 supported the validity of the
hypothesis, 12 found the existence of a two‐way relationship between GDP
7 Pablo‐Romero and Molina 2013 carry a useful survey of this literature.

Page | 13
growth and tourism growth (i.e., tourism boosting GDP growth and the latter
creating feedback growth of tourism value added), 8 found an inverse
relationship (causation from GDP growth to tourism growth) and two found no
support for any relationship. Out of 20 panel‐data studies, 14 supported the
hypothesis, 4 found a two‐way relationship, one found an inverse relationship
and one found no support for any relationship. Finally, there were only four
cross‐section studies considered with three finding in favor of the TLG and one
finding no relationship. Although there was a smaller number of panel‐data and
cross‐section studies, these had the advantage of including a larger number of
countries and more variables. It should be noted that although the evidence
favors the validity of the TLG hypothesis, there was doubt whether tourism
contributed to long‐term development through the strengthening of
technological innovation and investment.
In terms of the factors underlying the relationship, a number of noteworthy
aspects emerge. The leading factor in favor of a strong impact of tourism on
growth is specialization, ie., the higher the share of tourism value added in total
GDP, the stronger the TLG impact. Although country size, per se, does not count
as a significant factor, it is observed that the more specialized countries tend to
be smaller and they indeed tend to show higher overall growth. It was also
observed that higher specialization in tourism was associated with higher levels
of education of working‐class employees. There was some indication that
countries starting from a smaller economic base showed faster tourism‐led
growth, with low and medium‐income countries showing more positive results
while the evidence was weaker in the case of high income countries. The studies
explored the effects of other factors including economy size, the absolute size of
tourism value added and the wealth of the population. None of these factors was
found to be significant, leading to the conclusion that tourism can stimulate real
per capita economic growth in countries big or small, rich or poor, large or small
economies, or those with high or low tourism GDP.
The finding among a substantial number of studies of a feedback effect of GDP
growth on tourism is noteworthy, which may be interpreted to imply the
importance of public policy aimed at providing good infrastructure and general
conditions for the industry. In general, the magnitude of the impact of tourism as
an engine of growth depends significantly on domestic economic structure, ie.,
whether the economy is dominated by small or large firms, the level of openness
to international competition, and the strength of inter‐industry linkages within
the economy. There are also indications that the performance of tourism industry
is highly influenced by general macroeconomic conditions in the world at large.
The tourist industry is found to be highly vulnerable to exogenous factors such
as international economic shocks, natural disasters and political instability.
Evidence of this is found in the negative impact of the industry in 2001‐3
following the 9/11 event in 2001 and SARS outbreak in 2003, and the downturn in
2008‐9 which is attributable to the effects of the international financial crisis and
the swine flu and bird flu scares at that time. The evidence shows that tourism
GDP is more highly affected by these kinds of events than overall GDP but the
industry also shows resilience, bouncing back quickly in 2004‐7 and after 2010
(Ivanov & Webster, 2013).
Page | 14
Some of the studies used international arrivals as the variable to measure
tourism activity on the implicit assumption of a close relationship between
arrivals and the economic contribution of the industry. This assumption has been
brought into question as there is evidence that increased arrivals may be
associated with lower earnings per tourist arrival, which may be explained by
discounting of accommodation rates and other prices, or even whole‐scale
currency devaluation aimed at boosting the industry. There is the implication
that though price‐cutting in different forms may result in higher numbers of
arrivals, the outcome may be reductions in the total earnings of the industry.
This issue is explored further in Section V of this paper.
Aepergis and Payne (2012) carry out a test of the TLG hypothesis in Caribbean
countries with significant results. Apergis and Payne investigate the TLG
hypothesis and test the causal relationship between tourism growth and
economic growth for nine Caribbean countries over the period 1995‐2007, using
panel cointegration tests. The model tested has GDP per capita as a function of
the real exchange rate and the number of international travel arrivals per capita.
The nine countries, chosen on the basis of data availability, are Antigua and
Barbuda, Bahamas, Dominica, Dominican Republic, Grenada, St Kitts and Nevis,
St Lucia, St. Vincent and the Grenadines and Trinidad and Tobago. Of these
countries, all except the Dominican Republic, St. Vincent and the Grenadines and
Trinidad and Tobago show numbers of annual arrivals that are higher than their
populations, which is taken as an indication of their specialization in tourism.
The main finding of Apergis and Payne 2012 is that tourism growth has a long‐
run positive equilibrium impact on GDP performance, i.e., the TLG holds for
these countries. In addition, they find that per capita GDP also has a positive
impact on international tourist arrivals per capita, indicating bidirectional
causality between tourism activity and economic growth in these countries. This
is a very significant result which indicates not only the importance of the
industry in Caribbean countries, but also underlines the importance of a
supportive policy environment and conducive conditions such as good
infrastructure and other service standards for the growth of the industry.

Page | 15
IV Performance of the Caribbean Tourism Industry
With tourism being so important to economies in Caribbean countries, the
performance of this industry plays a major role in overall economic performance
in this region. One way to judge the performance of the regional tourism
industry is to see how well it is keeping up with the growth of the industry
worldwide. For this purpose, this paper will look at the trends of tourist arrivals
and earnings in the Caribbean relative to global performance trends. While it will
not be possible to draw firm conclusions based on the statistical analysis to be
presented, it is expected that a narrative about tourism performance in the
Caribbean will emerge that will be useful for policy purposes and as a guide to
further research. We shall proceed by taking the Caribbean region as a whole
and making comparisons with other regions, conscious that Caribbean averages
cover ranges of variable performances. We shall then examine the performances
at the country level to see what further insights can be learned.
Regional Comparisons
On the basis of available data from the World Travel and Tourism Council, it is
possible to consider the average annual growth rates of tourism receipts of the
major regions of the world over the period 1990‐2012. As Table 4 shows, the
Caribbean Region recorded the lowest growth rate of receipts over that period
with average annual growth at 4.9 percent. The Caribbean growth rate is also
below the global average suggesting that Caribbean countries as a group would
have been losing ground in terms of the share of global tourism receipts. This is
illustrated by Figure 5 which shows a steady decline in the share of world
tourism receipts being obtained by the Caribbean Region from 3.2 percent to 2.1
percent over the period 1988‐2012. The figure shows the late 1990s as a period of
significant improvement in the market share of the Caribbean Region but
consistent decline since the beginning of the 21st century. This may be an
indication that the Caribbean industry has been impacted especially severely by
recent shocks, particularly the September 2001 terrorist attack in New York and
the 2008‐09 international financial crisis.
It is significant to observe that in terms of arrivals numbers, the Caribbean
Region has not shown the same level of decline indicated by the earnings trend.
As Figure 6 indicates, the share of Caribbean arrivals in total world tourist
arrivals was at about the same level in 2010 as it was in 1970. The share of
Caribbean tourist arrivals showed decline from 1988 to 2010 but at a smaller rate
than that of earnings. The arrivals data show a sharp decline in 2001, followed by
a quick recovery and subsequent decline from 2003. It is evident that arrivals
growth has done better than that of earnings in the last decade and half
suggesting the impact of discounting of prices to attract tourists in constrained
market conditions.

Page | 16
Table 4. Average Annual Growth Rates of Tourism Receipts by
Region, 1990‐2012
Source: Based on WTTC database data
Figure 5. Tourism Receipts of the Caribbean Region As a Percentage of World
Receipts
Source: World Travel and Tourism Council
0.0
0.5
1.0
1.5
2.0
2.5
3.0
3.5
1988
1990
1992
1994
1996
1998
2000
2002
2004
2006
2008
2010
2012
Caribbean/Worldvisitor expenditure
Avg. Annual
Growth Rate,
1990‐2012
Caribbean 4.9
Europe 5.4
Latin America 7.6
Middle East 11.2
North Africa 7.2
North America 5.4
Northeast Asia 10.6
Oceania 6.9
Southeast Asia 8.7
Sub‐Saharan Africa 9.3
Africa 8.2
Asia (not including South
Asia) 9.8
World 6.6

Page | 17
Figure 6. Caribbean Arrivals as % of Global Arrivals (%)
Sources: World Travel and Tourism Council, Caribbean Tourism Organization
While the shares of Caribbean arrivals and earnings have trended downward,
average nightly spending per tourist to the Caribbean has shown gradual
increase in absolute terms from $102 in 1990 to $137 in 2011. As figure 8 shows,
this spending dropped sharply after the September 2001 New York attack and
the 2008‐09 recession, but recovered after either event. Taken altogether, the
regional indicators show the Caribbean Region struggling to maintain its share of
the world tourist market, significantly impacted by recent international shocks
and generally losing ground in terms of its share of the growing world tourism
market.
0.0
0.5
1.0
1.5
2.0
2.5
3.0
3.5
1970
1972
1974
1976
1978
1980 n
1982
1984
1986
1988
1990
1992
1994
1996
1998
2000
2002
2004
2006
2008
2010

Page | 18
Figure 7. Average Spending per Tourist Night of Stay
Sources: Caribbean Tourism Organization
Country Performance Perspective
Within the regional perspective presented in the section above, there is wide
variation in terms of how the tourism industry has performed in individual
Caribbean countries. The view in terms of individual countries is valuable,
reinforcing and supplementing the insights about the state of the regional
tourism industry.
For the most part, the analysis in this section is based on annual data for earnings
and arrivals over the period 1980‐2014. The data is divided into two periods:
1980‐2000 and 2000‐2014. The specification of the two periods is useful as we
shall see that the Caribbean industry shows distinctly better performance in the
early period compared to the more recent one. Among other things, this may be
partly attributable to changing composition of the regional industry as more
countries give emphasis to tourism to join the more traditional, well established
destinations. In this analysis, we use worldwide averages as a key benchmark.
With reference to figures 9 and 10, it is evident that arrivals growth was
generally better in the 1980‐2000 period than the 2000‐14 period. In the earlier
period, 14 out of the 28 countries cited show average annual growth of arrivals
higher than the global average compared to 10 countries in the later period. It is
significant to note that in both periods, but more so in the later period, the
traditional tourist countries with long established industries generally show
below average growth rates (Antigua and Barbuda, The Bahamas, Barbados,
Bermuda, Puerto Rico, St. Kitts‐Nevis, St. Maarten, US Virgin Islands). The
exceptions include Anguilla, The Dominican Republic, Jamaica and Turks and
Caicos which could be described as traditional tourist destinations and have
achieved above world average arrivals growth in both periods. Another group of
0.00
0.02
0.04
0.06
0.08
0.10
0.12
0.14
0.16
1990
1991
1992
1993
1994
1995
1996
1997
1998
1999
2000
2001
2002
2003
2004
2005
2006
2007
2008
2009
2010
2011
US$000

Page | 19
countries with above average growth may be described as the newcomers,
including Aruba, Belize, Cuba Curacao, Guyana, Haiti and Suriname, where
tourism received major boosts of policy emphasis in the 1980s.
The pattern in terms of which countries are the better performers and the general
trend of higher growth in the earlier than the later period is generally replicated
when we look at the growth of tourism earnings instead of arrivals (see figures
11 and 12). However, especially in the earlier period, the growth of tourist
earnings is higher than the world average benchmark for more of the countries.
In the later period only six countries from the group included in this study are
above the world average growth benchmark. These comparisons seem to suggest
that the more ‘mature’ tourist destinations may be reaching a saturation point in
terms of their attractions and may therefore be relying on rising prices to
maintain earnings. They suggest a need for these countries to seriously review
their tourism industries to ensure that their attractions are being suitably
adapted to the changing tastes and circumstances of the global tourist market.
Figure 8. Average Growth Rate of Arrivals by Country, 1980‐2000 (%)
Sources: Caribbean Tourism Organization
‐4.0
‐2.0
0.0
2.0
4.0
6.0
8.0
10.0
12.0
14.0
16.0
18.0
Anguilla
Antigua
Aruba
The Baham
as
Barbados
Belize
Bermuda
BVI
Cayman
Cuba
Curacao
Dominica
Dom Rep
Grenada
Guadeloupe
Guyana
Haiti
Jamaica
Martinique
Puerto Rico
St. Kitts‐Nev
St. Lucia
St. M
aarten
SVG
Surinam
e
Trin & Tob
Turks & Caicos
USV
I
World Average"

Page | 20
Figure 9. Average Growth Rate of Arrivals by Country, 2000‐14 (%)
Sources: Caribbean Tourism Organization
Figure 10. Average Growth Rate of Tourist Spending by Country, 1980‐2000
(%)
Sources: Caribbean Tourism Organization
‐4.0
‐2.0
0.0
2.0
4.0
6.0
8.0
10.0
12.0
Anguilla
Antigua
Aruba
The Baham
as
Barbados
Belize
Bermuda
BVI
Cayman
Cuba
Curacao
Dominica
Dom Rep
Grenada
Guyana
Haiti
Jamaica
Martinique
Puerto Rico
St. Kitts‐Nev
St. Lucia
St. M
aarten
SVG
Surinam
e
Trin & Tob
Turks & Caicos
USV
I
World Average
0.0
5.0
10.0
15.0
20.0
25.0
Anguilla
Antigua
Aruba
The Baham
as
Barbados
Belize
Bermuda
BVI
Cayman
Cuba
Curacao
Dominica
Dom Rep
Grenada
Guadeloupe
Guyana
Haiti
Jamaica
Martinique
Puerto Rico
St. Kitts‐Nev
St. Lucia
St. M
aarten
SVG
Surinam
e
Trin & Tob
Turks & Caic
USV
I
World average

Page | 21
Figure 11. Average Growth Rate of Tourist Spending by Country, 2000‐14 (%)
Sources: Caribbean Tourism Organization
V Relative Price Factors
It can be expected that a major factor influencing the growth performance of the
tourism industry would be its price competitiveness, i.e., the relative cost of a
vacation in a particular destination. We would like to get a sense of the impact of
this factor, conscious however that by its very nature, the growth performance of
this industry is subject to many other factors some of which are subjective and
qualitative. For this purpose, we construct an indicator we call the tourism price
calculated as:
Tourism price =
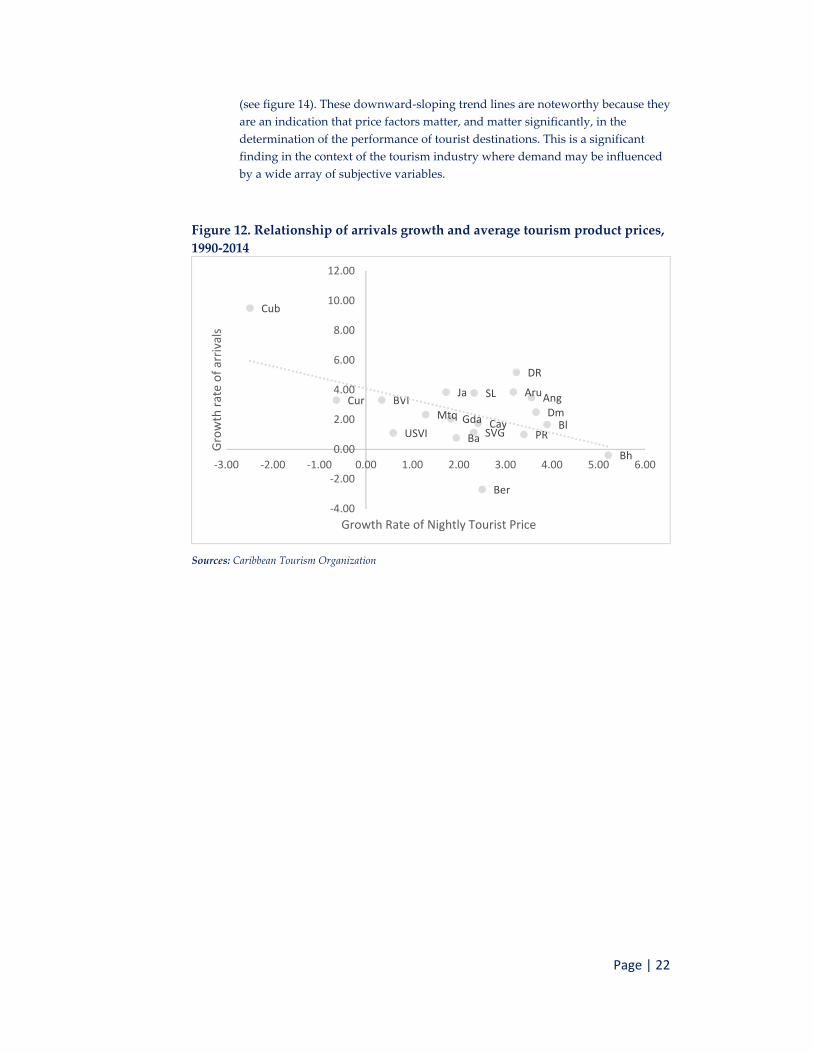
In figure 13, we plot a scatter diagram of the average annual growth rates of
arrivals over the period 1990‐2014 on the average annual rate of increase of the
tourism price for a group of 19 countries for which the required data are
available. Fitting a linear trend line to the scatter points we get a downward‐
sloping line which is consistent with the idea of declining tourist demand as the
tourism product price rises. We also plot the arrivals growth against tourism
prices averaged over 2007‐11 to see how arrivals growth is related to absolute
prices instead of price increases, obtaining a similar downward‐sloping trend
‐6.0
‐4.0
‐2.0
0.0
2.0
4.0
6.0
8.0
10.0
12.0
14.0
16.0
Anguilla
Antigua
Aruba
The Baham
as
Barbados
Belize
Bermuda
BVI
Cayman
Cuba
Curacao
Dominica
Dom Rep
Grenada
Guadeloupe
Guyana
Haiti
Jamaica
Martinique
Puerto Rico
St. Kitts‐Nev
St. Lucia
St. M
aarten
SVG
Surinam
e
Trin & Tob
Turks & Caic
USV
I
World Average
Page | 22
(see figure 14). These downward‐sloping trend lines are noteworthy because they
are an indication that price factors matter, and matter significantly, in the
determination of the performance of tourist destinations. This is a significant
finding in the context of the tourism industry where demand may be influenced
by a wide array of subjective variables.
Figure 12. Relationship of arrivals growth and average tourism product prices,
1990‐2014
Sources: Caribbean Tourism Organization
AngAru
Bh
BaBl
Ber
BVI
Cay
Cub
CurDm
DR
Gda
Ja
Mtq
PR
SL
SVGUSVI
‐4.00
‐2.00
0.00
2.00
4.00
6.00
8.00
10.00
12.00
‐3.00 ‐2.00 ‐1.00 0.00 1.00 2.00 3.00 4.00 5.00 6.00
Growth rate of arrivals
Growth Rate of Nightly Tourist Price

Page | 23
Figure 13. Relationship of arrivals growth and average tourism product prices,
2007‐11
Sources: Caribbean Tourism Organization
Finally, in figure 15, we plot the growth rate of tourism earnings against the
average rate of increase of the tourism price, obtaining findings that complement
the ones above in interesting ways. First of all, the linear trend line obtained is
downward‐sloping but with a lower gradient than the ones related to arrivals
growth, upholding the inverse relationship between tourism price and earnings
but a less strong relationship. Furthermore, when a second order polynomial
trend line is fitted to the scatter points, a curve is obtained that slopes up to the
right. This seems consistent with the conclusion indicated in the section above
that while rising prices reduce arrivals, they may be effective in maintaining the
buoyancy of total earnings, i.e., there is evidence of price inelasticity in the short
run. It may also be partly explained by the relatively high dynamism of the
newcomers to the industry such as Belize, Dominica, The Dominican Republic
and Aruba which show high rates of increase in the tourism price but are still at
lower prices compared to the more mature destinations. It may also be that
higher price increases are associated with more improvements in tourism
attractions. In general, an important implication of this analysis is that the
incentive to maintain the growth of arrivals through higher price
competitiveness may be compromised when looked at from the point of view of
the producers.
AngAru
Bh
BaBl
Ber
BVI
Cay
Cub
CurDm
DR
Gda
Ja
Mtq
PR
SL
SVG USVI
‐4.00
‐2.00
0.00
2.00
4.00
6.00
8.00
10.00
12.00
0 100 200 300 400 500
Growth Rate of Arrivals
Avg. Tourism Price, 2007‐11

Page | 24
Figure 14. Earnings Growth and Nightly Tourist Spending Trends, 1990‐2011
Sources: Caribbean Tourism Organization
VI Concluding Remarks
Tourism remains an important factor in the Caribbean as countries seek after
engines of growth to boost development and stability in insecure international
conditions. The regional industry has lost ground in terms of its share of the
expanding global market with the countries with the more ‘mature’, established
tourism industries showing particular sluggishness. Moreover, in the aftermath
of recent international shocks affecting the Caribbean industry, there has been an
evident tendency for recovery of tourism earnings to lag behind arrivals. This
suggests the need for increased investment to upgrade the tourism product and
attractions in order to match changes in tastes and the composition of the global
tourist market. Empirical evidence supports the view that tourism makes a
significant positive contribution to economic development in Caribbean
countries. It also finds a feedback relationship with economic growth being
favorable to the performance of the tourism industry, suggesting an important
role for the policy environment and good infrastructure and other service
standards to the growth of the tourism industry. Particular attention needs to be
paid to price competitiveness since our analysis points to the conclusion that
price matters among the large range of factors that have significant impact in this
market.
AngAru
BhBa
Bl
Ber
BVI
Cay
Cub
Cur
DmDR
GdaJa
Mtq
PR
SL
SVGUSVI
‐4.0
‐2.0
0.0
2.0
4.0
6.0
8.0
10.0
12.0
‐3.00 ‐2.00 ‐1.00 0.00 1.00 2.00 3.00 4.00 5.00 6.00
Earnings Growth Rate
Nightly Tourist Spending Growth Rate

Page | 25
Bibliography
Apergis, N., & Payne, J. E. (2012). Research note: Tourism and Growth in the Caribbean ‐
Evidence from a Panel Error Correction Model. Tourism Economics, 18(2), 449–
456.
Caribbean Community Secretariat. (2015, August). National Accounts Digest, 2008‐14.
Retrieved from Caricomstats.org:
http://www.caricomstats.org/Files/Publications/National%20Accounts%20Digest
/NationalAccounts2014.pdf
Caribbean Tourism Organization. (2015, July 2). Retrieved from OneCaribbean.org:
https://www.onecaribbean.org/bahamas‐prime‐minister‐perry‐christie‐on‐
caribbean‐tourism/
Chao, C., Hazari, B., Laffargue, J.‐P., Sgro, P., & Yu, E. (2006). Tourism, Dutch disease and
welfare in an open dynamic economy. The Japanese Economic Review, 57(4), 501‐
515.
Chou, M. C. (2013). Does tourism development promote economic growth in transition
countries? A panel data analysis. Economic Modelling, 33, 226‐232.
Dupreyas, A., & MacCallum, N. (2013). Indicators for Measuring Competitiveenss in
Tourism: A guidance document. OECD Tourism Papers(2), pp. 1‐63.
Ivanov, S., & Webster, C. (2013). Tourismʹs contribution to economic growth: a global
analysis for the first decade of the millennium. Tourism Economics, 19(3), 477‐508.
Pablo‐Romero, M. d., & Molina, J. (2013). Tourism and economic growth: A review of
empirical literature. Tourism Managment Perspectives, 8, 28‐41.
UN World Tourism Organization. (2013, April ). Overview of key trends. World Tourism
Barometer, 11, pp. 1‐27.
World Travel and Tourism Council. (2013, June). World Travel and Tourism Council.
Retrieved from WTTC/Research: http://www.wttc.org/research/
World Travel and Tourism Council. (2015). Retrieved from WTTC.org:
http://www.wttc.org/‐
/media/files/reports/economic%20impact%20research/regional%202015/caribbea
n2015.pdf

Annex 1: Total Arrivals by Country, 1980‐2014
Page | 26
Arrivals (000) 1980 1981 1982 1983 1984 1985 1986 1987
Anguilla 5.7 6.2 6.7 7.8 10.8 15.4 16.7 21 Antigua and Barbuda 100 99.9 101.8 116.5 145.4 156 166.2 177 Aruba 188.915 221.3 220.2 195.2 210.2 206.7 181.2 231.6 The Bahamas 1181.26 130.64 1101.13 1239.75 1278.5 1368.3 1375.22 1479.855 Barbados 369.915 352.555 303.795 328.338 367.652 359.135 369.77 421.859 Belize 62 64.2 67.3 64.2 88.4 93.4 93.8 99.3 Bermuda 491.64 429.801 416.627 446.461 417.461 405.8 459 476.8 British Virgin Is. 97 109.6 113.7 118.9 121.5 129.9 145.7 172.7 Cayman 120.241 124.6 121.2 130.8 148.5 145.1 166.1 209 Cuba 94 121 139.3 162.3 206.6 240.5 281.9 293.4 Curacao 184.7 176.3 174.4 110.6 130 126 128.2 134.8 Dominica 14.4 15.9 19 19.6 22.2 21.5 24.4 26.7 Dominican Republic 301.07 451.2 480 502.4 562.3 660.2 785 911.3 Grenada 29.4 25.1 23.2 32.5* 39.5 52 57.3 57.4 Guadeloupe 156.5 132.8 189.4** 194 163.5 216.4 246.3 292.6 Guyana 40.0* 40.0* 41.4 45 47.3 47.0* 46.8 59.8 Haiti 136 139.2 135.0* 145.0* 141.4 149.7 111.7 121.8 Jamaica 395.34 406.4 467.8 566.2 603.4 571.7 663.6 738.8 Martinique 158.5 157 176.2 176 183.8 193.5 183.3 233.9** Puerto Rico 1679.34 1573.4 1563.7 1529.8 1496.4 1544.9 1572.6 1871.7 St. Kitts & Nevis 32.8 35.5 34.5 34.3 39.8 46.1 55.1 64.6 St. Lucia 88 68.6 70.2 77.8 86.2 94.5 111.7 122.6 St. Vincent & Grenadines
50.4 44.7 37.1 37.7 38.5 42.1 42.1 46
Suriname 48.4 54.3 51.6 39.3 35.8 31.6 28.7 27 Trinidad and Tobago 199.2 186.8 190 190 191.5 187.1 191.3 201.7 USVI 380 343.7 340 345 369.5 411.5 469.8 580 Total Arrivals 6801.76 5676.7 6489.25 6955.55 7479.61 7842.04 8385.29 9307.81

Annex 1: Total Arrivals by Country, 1980‐2014
Page | 27
Arrivals (000) 1988 1989 1990 1991 1992 1993 1994 1995
Anguilla 25.7 28.448 31.181 29.692 30.426 37.658 43.705 38.531 Antigua and
Barbuda 195 198.651 205.7 204.7 217.9 249.4 262.9 219.986
Aruba 278 344.36 432.762 501.324 541.7 562 582.1 618.916 The Bahamas 1474.98 1575.07 1561.665 1427.035 1398.895 1488.68 1516.035 1598.135
Barbados 451.485 461.259 432.092 394.2 385.5 396 425.6 442.107 Belize 164.3 172.8 216.4 215.4 247.3 284.5 328.1 130.809
Bermuda 425.9 416.049 432.706 385.252 373.5 412.5 416 387.535 British Virgin
Is. 176 175.795 176.613 145.649 116.944 198.176 236.038 219.51
Cayman 218.7 209.722 253.158 237.351 245.9 278.6 314.4 361.444 Cuba 309.2 326.304 340.329 424.041 460.6 544.1 617.3 762.666
Curacao 155.2 193.032 207.673 205.648 206.9 214.1 226.1 223.788 Dominica 31.8 35.184 45.087 46.312 47 51.9 56.5 60.471
Dominican Republic
1216.4 1400 1530 1416.8 1523.8 1636.4 1766.9 1775.87
Grenada 61.8 68.596 82 85.002 87.6 93.919 108.957 108.007 Guadeloupe 328.7 284.012 288.407 370.5 340.5 452.7 555.6 640
Guyana 71.1 67.394 64.219 72.802 74.9 107.1 112.8 105.536 Haiti 122 122 120 119 89.5 76.7 70.3 145.369
Jamaica 648.9 714.777 840.777 844.607 1057.2 1105.4 1098.3 1147.001 Martinique 280 311.7 281.517 315.131 320.7 366.4 419 457.226
Puerto Rico 2280.5 2443.8 2559.7 2710.176 2723.967 2916.489 3013.596 3140.262 St. Kitts &
Nevis 69.6 72.1 75.7 83.9 88.264 88.6 94.185 78.868
St. Lucia 125.3 132.832 138.427 159.034 177.488 194.136 218.567 232.305 St. Vincent &
Grenadines 47 50.1 53.913 51.629 53.1 56.691 54.892 60.206
Suriname 21.1 20.7 28.478 25 29.808 38.543 42.26 43.441 Trinidad and
Tobago 187.7 194.228 194.021 219.654 234.759 248.815 253.153 259.784
USVI 555.5 451.764 462.5 470.3 478 549.5 540.5 454 Total Arrivals 10419.5 10991.4 11638.5 11727.4 12138.2 13190.2 13980.8 14209.1
Annex 1: Total Arrivals by Country, 1980‐2014
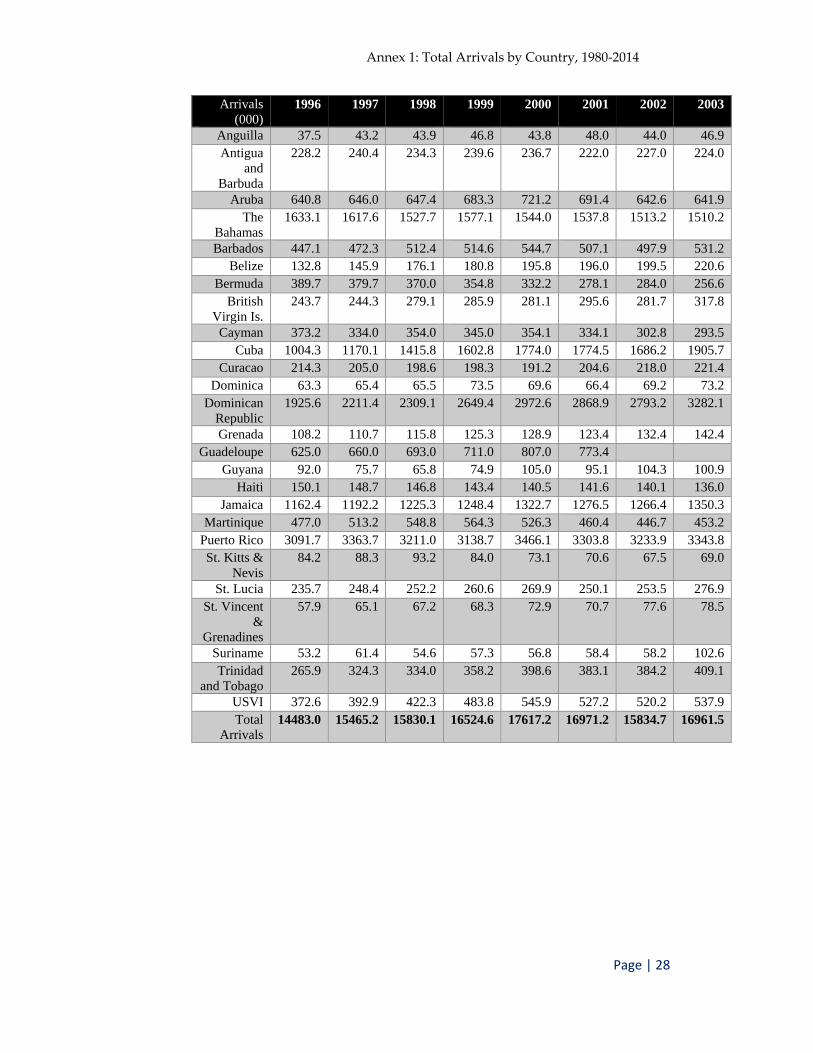
Page | 28
Arrivals (000)
1996 1997 1998 1999 2000 2001 2002 2003
Anguilla 37.5 43.2 43.9 46.8 43.8 48.0 44.0 46.9 Antigua
and Barbuda
228.2 240.4 234.3 239.6 236.7 222.0 227.0 224.0
Aruba 640.8 646.0 647.4 683.3 721.2 691.4 642.6 641.9 The
Bahamas 1633.1 1617.6 1527.7 1577.1 1544.0 1537.8 1513.2 1510.2
Barbados 447.1 472.3 512.4 514.6 544.7 507.1 497.9 531.2 Belize 132.8 145.9 176.1 180.8 195.8 196.0 199.5 220.6
Bermuda 389.7 379.7 370.0 354.8 332.2 278.1 284.0 256.6 British
Virgin Is. 243.7 244.3 279.1 285.9 281.1 295.6 281.7 317.8
Cayman 373.2 334.0 354.0 345.0 354.1 334.1 302.8 293.5 Cuba 1004.3 1170.1 1415.8 1602.8 1774.0 1774.5 1686.2 1905.7
Curacao 214.3 205.0 198.6 198.3 191.2 204.6 218.0 221.4 Dominica 63.3 65.4 65.5 73.5 69.6 66.4 69.2 73.2
Dominican Republic
1925.6 2211.4 2309.1 2649.4 2972.6 2868.9 2793.2 3282.1
Grenada 108.2 110.7 115.8 125.3 128.9 123.4 132.4 142.4 Guadeloupe 625.0 660.0 693.0 711.0 807.0 773.4
Guyana 92.0 75.7 65.8 74.9 105.0 95.1 104.3 100.9 Haiti 150.1 148.7 146.8 143.4 140.5 141.6 140.1 136.0
Jamaica 1162.4 1192.2 1225.3 1248.4 1322.7 1276.5 1266.4 1350.3 Martinique 477.0 513.2 548.8 564.3 526.3 460.4 446.7 453.2
Puerto Rico 3091.7 3363.7 3211.0 3138.7 3466.1 3303.8 3233.9 3343.8 St. Kitts &
Nevis 84.2 88.3 93.2 84.0 73.1 70.6 67.5 69.0
St. Lucia 235.7 248.4 252.2 260.6 269.9 250.1 253.5 276.9 St. Vincent
& Grenadines
57.9 65.1 67.2 68.3 72.9 70.7 77.6 78.5
Suriname 53.2 61.4 54.6 57.3 56.8 58.4 58.2 102.6 Trinidad
and Tobago 265.9 324.3 334.0 358.2 398.6 383.1 384.2 409.1
USVI 372.6 392.9 422.3 483.8 545.9 527.2 520.2 537.9 Total
Arrivals 14483.0 15465.2 15830.1 16524.6 17617.2 16971.2 15834.7 16961.5

Annex 1: Total Arrivals by Country, 1980‐2014
Page | 29
Arrivals (000)
2004 2005 2006 2007 2008 2009 2010 2011
Anguilla 54.0 62.1 73.0 77.7 68.3 57.9 62.0 65.8 Antigua
and Barbuda
245.8 245.4 253.7 261.8 265.8 234.4 229.9 241.3
Aruba 728.2 732.5 694.4 772.3 826.7 812.6 824.3 869.0 The
Bahamas 1561.3 1608.2 1600.9 1527.7 1463.0 1327.0 1370.2 1346.4
Barbados 551.5 547.5 562.6 572.9 567.7 518.6 532.2 567.7 Belize 230.8 236.6 247.3 251.4 245.0 232.2 241.9 250.3
Bermuda 271.6 269.6 299.0 305.5 263.6 235.9 232.3 236.0 British
Virgin Is. 304.5 337.1 356.3 358.1 346.0 308.8 330.3 337.8
Cayman 259.9 167.8 267.3 291.5 302.9 272.0 288.3 309.1 Cuba 2048.6 2319.3 2220.6 2152.2 2348.3 2429.8 2531.7 2716.3
Curacao 223.4 222.1 234.4 299.8 408.9 366.7 341.7 390.1 Dominica 80.1 79.3 84.0 77.8 81.1 74.9 76.5 75.5
Dominican Republic
3450.2 3690.7 3965.1 3979.6 3979.7 3992.3 4124.5 4306.4
Grenada 133.9 98.5 118.7 129.1 130.4 113.4 110.5 118.3 Guadeloupe
Guyana 122.0 116.6 113.5 134.1 129.6 141.3 151.9 156.9 Haiti 96.4 112.3 107.8 386.1 258.1 387.2 254.7 348.8
Jamaica 1414.8 1478.7 1678.9 1700.8 1767.3 1831.1 1921.7 1951.8 Martinique 470.9 484.1 503.5 501.5 481.2 441.6 478.1 496.5
Puerto Rico 3631.3 3701.7 3703.9 3679.4 3503.9 3162.3 3103.3 3042.2 St. Kitts &
Nevis 117.6 126.9 133.0 123.1 128.8 96.1 98.3 94.8
St. Lucia 298.4 317.9 302.5 287.4 295.8 278.5 305.9 312.4 St. Vincent
& Grenadines
86.7 95.5 97.4 89.6 84.1 75.4 72.5 73.9
Suriname 137.8 159.8 152.9 162.5 150.7 150.6 204.5 220.5 Trinidad
and Tobago 443.0 463.2 457.4 449.5 432.6 430.6 388.3 430.9
USVI 566.8 593.8 570.6 587.1 574.2 562.6 589.8 531.9 Total
Arrivals 18014.8 18744.6 19274.1 19635.6 19586.4 18980.4 19314.6 19920.4

Annex 1: Total Arrivals by Country, 1980‐2014
Page | 30
Arrivals (000)
2012 2013 2014
Anguilla 64.7 69.1 70.9 Antigua
and Barbuda
246.9 243.9 249.3
Aruba 903.9 979.3 1072.1 The
Bahamas 1421.8 1364.2 1421.8
Barbados 536.3 508.5 519.6 Belize 277.1 294.2 321.2
Bermuda 230.1 236.3 224.4 British
Virgin Is. 351.4 366.1 386.0
Cayman 321.7 345.4 382.8 Cuba 2838.6 2852.6 3003.3
Curacao 420.9 440.8 453.6 Dominica 79.0 78.3 81.5
Dominican Republic
4562.6 4689.8 5141.4
Grenada 116.2 116.5 133.5 Guadeloupe
Guyana 176.6 200.1 205.8 Haiti 349.2 419.7 465.2
Jamaica 1986.1 2008.4 2080.2 Martinique 487.8 489.7 489.6
Puerto Rico 3184.1 3204.8 3246.0 St. Kitts &
Nevis 97.9 101.0 104.7
St. Lucia 306.8 318.6 338.2 St. Vincent
& Grenadines
74.4 71.7 70.7
Suriname 240.0 249.1 251.6 Trinidad
and Tobago 454.7 434.0 412.5
USVI 580.3 570.0 601.9 Total
Arrivals 20773.0 21126.2 22236.7

Annex 2: Total Tourist Expenditure by Country, 1980‐2014
Page | 31
Total Expenditure (US$M.)
1980 1981 1982 1983 1984 1985 1986 1987
Anguilla Antigua and Barbuda 42.0 49.0 58.9 77.1 109.7 132.5 156.2 186.7 Aruba 137.5 156.4 163.1 114.5 118.4 120.8 158.1 203.6 The Bahamas 595.5 639.1 654.5 770.5 801.5 995.0 1104.9 1150.0 Barbados 251.0 261.9 251.1 251.6 284.2 309.0 326.9 378.7 Belize 7.0 7.5 7.5 8.0 10.0 11.1 41.0 47.3 Bermuda 280.0 287.9 301.6 335.5 340.0 356.7 407.2 447.7 British Virgin Is. 67.8 88.8 110.8 Cayman 44.6 52.7 56.2 61.6 70.9 85.5 93.5 120.0 Cuba 116.4 150.0 185.0 Curacao 70.6 89.2 94.0 Dominica 8.7 11.2 12.8 Dominican Republic 167.9 223.2 272.7 282.3 315.0 368.2 420.0 545.0 Grenada 32.4 39.6 42.1 Guadeloupe 95.0 163.0 188.0 Guyana 18.0 19.0 24.0 Haiti 69.2 63.0 69.0 Jamaica 241.7 284.3 337.8 399.2 406.6 406.8 516.0 595.0 Martinique 92.8 107.8 210.0 Puerto Rico 615.4 649.7 699.2 690.7 681.2 757.7 792.6 955.4 St. Kitts & Nevis 31.0 38.0 47.4 St. Lucia 32.9 29.4 32.4 39.7 42.4 90.0 118.0 126.2 St. Vincent & Grenadines
Suriname Trinidad and Tobago 151.1 151.9 178.6 205.7 197.8 197.3 83.2 91.6 USVI 304.3 317.5 312.5 356.3 434.0 507.4 509.8 639.4 Total Expenditure

Annex 2: Total Tourist Expenditure by Country, 1980‐2014
Page | 32
Total Expenditure (US$M.)
1988 1989 1990 1991 1992 1993 1994 1995
Anguilla 28.1 34.6 30.8 35.2 43.3 51.0 48.5 Antigua and Barbuda
242.3 267.1 298.2 314.0 242.9 276.8 293.4 246.7
Aruba 273.3 309.8 353.4 396.3 442.4 464.1 450.7 520.6 The Bahamas 1149.5 1309.5 1332.9 1222.4 1243.6 1304.2 1334.1 1346.2 Barbados 460.0 527.8 493.5 459.7 462.5 528.0 597.6 611.8 Belize 22.1 29.4 44.5 44.8 59.7 69.3 71.4 77.1 Bermuda 440.5 450.8 490.1 456.0 443.0 504.5 525.3 486.9 British Virgin Is. 120.8 124.7 132.6 106.7 101.9 181.7 211.9 195.4 Cayman 176.2 177.4 235.7 222.3 284.7 336.0 414.3 488.6 Cuba 223.0 230.0 243.4 387.4 567.0 729.0 850.0 1100.0 Curacao 81.1 98.0 238.4 232.2 161.3 193.8 186.5 175.4 Dominica 14.0 18.5 25.0 28.1 26.4 28.9 31.4 34.1 Dominican Republic
768.3 818.4 899.5 877.5 1007.1 1223.7 1428.2 1570.8
Grenada 46.0 30.8 37.5 41.7 42.3 48.1 58.6 57.6 Guadeloupe 220.0 203.3 197.1 233.6 270.7 369.8 330.2 380.4 Guyana 30.0 28.1 26.8 30.3 31.2 44.5 85.0 32.6 Haiti 75.0 46.0 46.0 46.0 35.0 30.0 27.0 90.2 Jamaica 525.0 593.0 740.0 764.0 858.0 942.0 973.0 1068.5 Martinique 230.0 272.0 240.0 254.9 282.0 331.9 379.0 384.0 Puerto Rico 1112.4 1234.5 1376.9 1435.7 1519.7 1628.1 1728.3 1827.6 St. Kitts & Nevis 53.8 52.5 57.7 67.5 67.4 69.8 76.9 65.1 St. Lucia 134.2 144.6 153.8 173.4 207.9 221.0 224.1 265.8 St. Vincent & Grenadines
50.5 56.0 53.0 41.1 44.0 44.0 41.1
Suriname 7.8 10.7 10.7 19.0 17.0 13.0 21.2 Trinidad and Tobago
83.1 84.5 94.7 100.9 109.2 82.0 87.3 72.5
USVI 657.3 621.4 697.0 777.9 816.1 901.6 919.6 822.3 Total Expenditure 8556.0 8767.8 9377.2 10613.1 11391.7 12031.0 12858.7

Annex 2: Total Tourist Expenditure by Country, 1980‐2014
Page | 33
Total Expenditure (US$M.)
1996 1997 1998 1999 2000 2001 2002 2003
Anguilla 48.0 57.2 58.1 56.2 55.2 61.0 55.3 61.7 Antigua and Barbuda
257.9 277.5 281.6 290.0 290.5 272.1 273.8 299.8
Aruba 613.5 668.3 729.9 720.7 807.3 815.8 827.2 850.2 The Bahamas 1397.5 1416.1 1354.1 1582.9 1734.5 1647.7 1759.8 1757.4 Barbados 632.9 657.2 703.0 716.0 776.9 711.2 679.0 823.2 Belize 88.6 88.0 108.3 111.5 120.2 120.5 132.8 156.2 Bermuda 475.2 477.7 480.5 477.2 421.3 349.7 378.8 347.9 British Virgin Is. 258.3 364.8 361.1 321.3 366.8 390.6 335.8 316.4 Cayman 456.3 501.2 533.6 524.6 559.2 585.1 607.0 518.3 Cuba 1333.0 1515.0 1759.0 1901.0 1948.2 1840.4 1769.1 1999.2 Curacao 185.5 200.5 261.1 220.2 219.6 202.3 217.2 223.6 Dominica 36.6 48.3 46.5 48.8 47.3 49.6 45.3 52.0 Dominican Republic
1780.5 2099.4 2153.1 2483.3 2860.2 2798.3 2730.4 3127.9
Grenada 59.4 147.6 154.1 169.7 178.4 163.0 173.7 174.2 Guadeloupe 353.9 371.5 390.1 400.2 454.2 435.3 370.3 374.4 Guyana 109.0 112.0 108.0 106.2 75.1 60.5 49.3 25.8 Haiti 95.6 107.1 131.0 135.0 128.0 105.0 108.0 95.6 Jamaica 1092.2 1131.4 1197.1 1279.5 1332.6 1233.0 1209.5 1351.1 Martinique 382.1 399.9 414.9 404.0 302.0 203.1 201.1 247.6 Puerto Rico 1898.3 2046.3 2232.9 2138.5 2387.9 2728.1 2486.4 2676.6 St. Kitts & Nevis 66.8 67.3 76.0 67.7 58.4 61.9 57.1 75.4 St. Lucia 269.5 284.8 284.4 275.1 279.6 233.8 210.8 283.3 St. Vincent & Grenadines
63.7 70.6 73.2 76.5 82.3 89.0 91.0 91.2
Suriname 13.8 8.5 1.9 9.3 15.8 14.4 3.4 3.9 Trinidad and Tobago
109.7 192.6 201.2 209.6 212.8 200.9 242.0 248.9
USVI 781.0 894.1 940.6 955.0 1205.9 1234.1 1195.4 1256.5 Total Expenditure 14205.0 15035.2 15679.9 16920.2 16606.4 16209.6 17438.2 18734.7

Annex 2: Total Tourist Expenditure by Country, 1980‐2014
Page | 34
Total Expenditure (US$M.)
2004 2005 2006 2007 2008 2009 2010 2011
Anguilla 59.2 85.9 107.1 115.0 109.0 93.8 99.4 112.0 Antigua and Barbuda 337.4 309.5 326.7 337.8 334.0 305.1 297.7 311.9 Aruba 1052.8 1094.7 1059.4 1208.0 1346.5 1215.9 1241.7 1348.3 The Bahamas 1884.5 2068.9 2057.4 2191.7 2501.0 2014.2 2146.8 2141.6 Barbados 825.1 887.5 1049.0 1178.7 1173.5 1052.6 1021.9 952.7 Belize 172.7 174.7 252.9 292.9 281.5 211.4 250.7 256.8 Bermuda 393.4 394.2 454.2 513.2 401.8 331.3 385.5 434.8 British Virgin Is. 325.3 412.7 438.8 451.0 446.8 373.8 389.4 388.2 Cayman 519.0 371.3 533.8 498.8 546.3 561.3 403.8 465.0 Cuba 2113.6 2399.0 2235.0 2236.0 2346.9 2082.4 2218.4 2503.1 Curacao 223.6 244.0 277.2 327.2 378.3 361.4 385.0 453.3 Dominica 60.3 55.9 68.2 64.7 87.2 83.6 94.1 95.0 Dominican Republic 3151.6 3518.3 3916.8 4064.2 4165.9 4048.8 4209.1 4436.1 Grenada 132.9 94.4 114.7 126.6 106.3 96.2 96.9 105.2 Guadeloupe 372.1 306.0 299.0 344.0 384.0 293.0 510.0 582.0 Guyana 27.1 35.1 37.1 50.5 59.0 35.0 80.5 95.0 Haiti 92.7 79.5 125.9 189.9 275.6 314.8 167.0 162.0 Jamaica 1436.6 1545.1 1870.6 1910.1 1975.5 1925.4 2001.2 2008.3 Martinique 291.5 282.1 305.2 299.0 364.0 339.4 389.3 429.2 Puerto Rico 3024.0 3238.6 3369.3 3413.9 3535.0 3175.8 3210.7 3142.8 St. Kitts & Nevis 102.6 121.2 131.6 124.8 110.1 83.5 89.5 94.1 St. Lucia 326.8 341.7 285.7 532.5 461.4 419.8 562.0 582.2 St. Vincent & Grenadines
95.6 103.9 113.3 110.0 96.0 87.5 86.2 91.7
Suriname 17.0 44.6 94.8 66.6 77.4 63.6 90.9 60.9 Trinidad and Tobago 341.5 453.0 382.2 463.1 396.9 366.6 449.5 472.0 USVI 1356.0 1431.6 1467.6 1512.2 1157.1 1021.3 1012.5 1087.8 Total Expenditure 20093.2 21373.4 22622.5 23116.7 20957.4 21889.7 22812.0 22287.6
Annex 2: Total Tourist Expenditure by Country, 1980‐2014
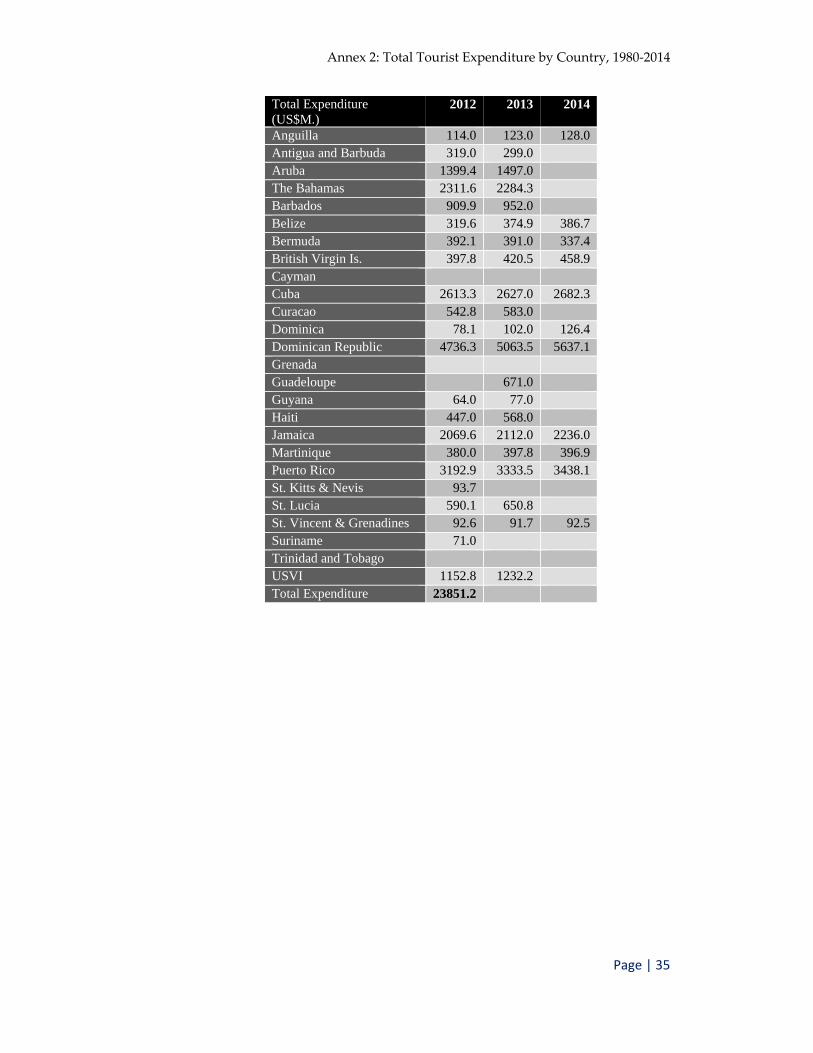
Page | 35
Total Expenditure (US$M.)
2012 2013 2014
Anguilla 114.0 123.0 128.0 Antigua and Barbuda 319.0 299.0 Aruba 1399.4 1497.0 The Bahamas 2311.6 2284.3 Barbados 909.9 952.0 Belize 319.6 374.9 386.7 Bermuda 392.1 391.0 337.4 British Virgin Is. 397.8 420.5 458.9 Cayman Cuba 2613.3 2627.0 2682.3 Curacao 542.8 583.0 Dominica 78.1 102.0 126.4 Dominican Republic 4736.3 5063.5 5637.1 Grenada Guadeloupe 671.0 Guyana 64.0 77.0 Haiti 447.0 568.0 Jamaica 2069.6 2112.0 2236.0 Martinique 380.0 397.8 396.9 Puerto Rico 3192.9 3333.5 3438.1 St. Kitts & Nevis 93.7 St. Lucia 590.1 650.8 St. Vincent & Grenadines 92.6 91.7 92.5 Suriname 71.0 Trinidad and Tobago USVI 1152.8 1232.2 Total Expenditure 23851.2