the carbon trust is a uk-wide company, advanced metering ...€¦ · advanced metering for smes...
TRANSCRIPT

Advanced metering for SMEsCarbon and cost savings
Full Report
www.carbontrust.co.uk0800 085 2005
Whilst reasonable steps have been taken to ensure that the information contained within this publication is correct, the authors, the Carbon Trust, its agents, contractors and sub-contractors give no warranty and make no representation as to its accuracy and accept no liability for any errors or omissions.
Any trademarks, service marks or logos used in this publication, and copyright in it, are the property of the Carbon Trust. Nothing in this publication shall be construed as granting any licence or right to use or reproduce any of the trademarks, service marks, logos, copyright or any proprietary information in any way without the Carbon Trust’s prior written permission. The Carbon Trust enforces infringements of its intellectual property rights to the full extent permitted by law.
The Carbon Trust is a company limited by guarantee and registered in England and Wales under Company number 4190230 with its Registered Office at: 8th Floor, 3 Clement’s Inn, London WC2A 2AZ.
Printed on paper containing a minimum of 75% de-inked post-consumer waste.
Published in the UK: May 2007.
© The Carbon Trust 2007. All rights reserved. CTC713
The Carbon Trust is a UK-wide company, with headquarters in London, and bases in Northern Ireland, Scotland, Wales, and the English regions.The Carbon Trust is a private company set up by government in response to the threat of climate change, to accelerate the move to a low carbon economy.
The Carbon Trust works with UK business and the public sector to create practical business-focused solutions through its external work in five complementary areas: Insights, Solutions, Innovations, Enterprises and Investments. Together these help to explain, deliver, develop, create and finance low carbon enterprise.
The Carbon Trust is funded by the Department for Environment, Food and Rural Affairs (Defra), the Department of Trade and Industry (DTI), the Scottish Executive, the Welsh Assembly Government and Invest Northern Ireland.

The Carbon Trust would like to thank everyone who has contributed to this report, either through direct involvement in the trial, general discussions or review of findings and implications.

Advanced metering for SMEsThe Impact of advanced metering for SMEs
0�
Executive summary 02
� Introduction to advanced metering 06
�.� Thepotentialbenefits 06
�.2 Use of advanced metering in businesses 06
�.3 Principles of advanced metering 07
�.4 Analysing advanced metering data 07
�.5 Sources of energy savings 08
�.6 Advanced metering technology 08
�.7 Advanced metering services 09
2 Metering and billing in the UK �0
2.� Industry structure �0
2.2 Consumption levels and billing �0
2.3 Electricity metering �0
2.4 Gas metering �3
2.5 Water metering �4
2.6 Barriers to advanced metering for SMEs �5
3 Theadvancedmeteringfieldtrial �6
3.� Scope and objectives �6
3.2 Methodology and approach �6
3.3 Site activities �7
3.4 Characteristics of participating sites �8
4 Resultsandfindings 22
4.� Headline results 22
4.2 Breakdown of savings 23
5 Scale-up of results to UK level 26
5.� Introduction 26
5.2 Basis for scale-up analysis 26
5.3 UK–wide implications 26
6 Advanced metering costs 28
6.� Overview 28
6.2 Cost components 28
6.3 Current costs 28
6.4 Future costs 29
6.5 Summary of costs 30
6.6 Utility prices 30
7 Site–basedcost/benefitanalysis 3�
7.� Introduction 3�
7.2 Methodology 3�
7.3 Results 32
8 Suppliercost/benefitanalysis 34
8.� Introduction 34
8.2 Methodology 34
8.3 Results 35
9 UKnetbenefitcost/benefitanalysis 37
9.� Introduction 37
9.2 Methodology 37
9.3 Results 38
�0 Barriers to adoption 40
�0.� Introduction 40
�0.2 Reasons for lack of implementation 40
�0.3 Technical and practical 4� barriersidentified �0.4 Established market problems 42
�� Policy implications 43
��.� Introduction 43
��.2 Actions to assist updates 43
��.3 Supporting and enabling measures 47
�2 Next steps 48
�2.� UK SMEs 48
�2.2 Suppliers and metering 48 service providers
�2.3 Government 49
Example case studies 50
Half-hourly metering for multi-site businesses 50
World Museum Liverpool 52
Bandvulc tyres 54
Contents

The Carbon Trust0�
Advanced metering can enable businesses to identify energy, cost and carbon savings by providing detailed information about the way in which they use their energy. Although this technology is fairly well established in companies with significant energy demands, it is not widely used by small to medium-sized enterprises (SMEs).
There are over �.7 million manually-read energy meters in UK SMEs, all of which could be replaced by advanced meters. The energy consumption through these meters is estimated to cost £6.5 billion per year and lead to emissions of over 50 MtCO� per year.
From 2004 to 2006 the Carbon Trust carried out the first UK field trial of advanced metering for SME users. The trial aimed to demonstrate the potential benefits of the technology and to understand the case for encouraging widespread adoption of advanced metering by SMEs. A total of 58� advanced meters were installed in SMEs across the UK and metering services were provided to these sites by seven different consortia.
Executive summary
Widespread use of advanced metering by SMEs can provide cost-effective carbon savings for the UK and significant energy savings for customers. The Carbon Trust’s field trial has demonstrated the potential benefits, identified key barriers and clarified the action required by the SME community, Government and energy suppliers to accelerate the market.
Figure 1 Average % carbon savings in SMEs using advanced metering
0
2
4
6
8
10
12
14
ImplementedIdentified
Carb
on s
avin
gs %
12.3%
5.1%
SMEs using advanced metering can identify an average of 1�% carbon savings and implement an average of 5% carbon savings.
The study has demonstrated that SMEs using advanced metering can identify an average of 1�% carbon savings and implement an average of 5% carbon savings through reduced utility consumption, as shown in Figure 1. The SMEs involved in the trial achieved average annual savings of over £1,000 and 8.5 tCO� per site.

Advanced metering for SMEs 03
Figure 2 shows the paybacks modelled for single and multi-site companies. Based on current meter and service costs, there is already a very strong business case for using advanced metering at multi-site SMEs, such as retail and wholesale chains, and for energy-intensive SME sectors, such as manufacturing. For single-site SMEs with lower energy consumption, the business case is less attractive withpaybacksoverfiveyearsinmostcases.However,modelling has also been carried out using predicted costs and this has indicated that in future a clear business case will also exist for single-site SMEs with lower consumption levels, as the costs of metering services will be driven down by increased innovation, automation and economies of scale.
Figure 3 Supplier costs and benefits for widespread roll-out of advanced gas and electricity metering to the SME community, using current costs
0
20
40
60
80
100
Costs Benefits Costs Benefits Electricity
£ pe
r m
eter
per
yr
Gas
0 51 2 3 4Payback (years)
N/A
N/A — sample size too small
N/A
Wat
erEl
ectr
icit
yG
asFu
ture
Multi siteSingle site
Wat
erEl
ectr
icit
yG
asCu
rren
t
Figure 2 Advanced meter payback periods for SME sites based on current and future costs
There is already a very strong business case for using advanced metering at multi-site SMEs and for energy-intensive SME sectors.
Thetrialfindingshighlightasignificantbarriertothewideruptake of advanced metering duetotheinsufficientfinancialincentives for energy suppliers.
A variety of different metering services were included in the trial, ranging from basic data provision to detailed advice via phone calls and site visits. The highest energy savings were achievedbyprovidingconsumptionprofilesandenergysavingrecommendationsviaemail.Thisisasignificantfindingwhichsuggests that low-cost metering services could be provided using automated systems in future.
Although some SMEs were initially sceptical about the potentialbenefitsofadvancedmetering,therewasawidespread recognition of these once the services had been used. Of the many customers that were offered the chance to continue their metering service on a full commercial basis, over 80% opted to continue at the end of the trial.
From the perspective of energy suppliers, there is likely to be a good business case for providing metering services to certain sections of the SME community which have large consumption or concentrated sites. However, as Figure 3 illustrates, the current costs of providing advanced metering servicestoallSMEuserssignificantlyoutweighthepotentialbenefits.Furthermore,evenascostsoftechnologycontinueto come down in future the business case for energy suppliers appears to remain marginal overall.

The Carbon Trust04
� Lowestconsuminggroupsreferstoelectricitycustomersinprofileclasses3and4andgascustomerswithannualdemandoflessthan732MWh.
Furthermore,averysignificantproportionofthesecarbonsavingscanbeachievedwithanetfinancialbenefittotheUK. Figure 5 shows that at current costs, there would be a netUKfinancialbenefitfromrollingoutadvancedmeteringto all but the lowest use groups of SME users�. Under expectedfuturecoststherewouldbeanetUKbenefitforrolling out advanced metering to all business users.
Figure 5 Net UK costs and benefits for advanced metering roll-out to all but the lowest consuming SMEs1
Electricity
Net
ben
efit
£/m
eter
Benefits Costs0
100
200
300
400
500
600
700
GasBenefits Costs
0
2,000
4,000
6,000
8,000
10,000
Energysupplierscanbenefitbyalteringtheirbusinessmodelsto realise new opportunities, such as sales of higher-margin meteringservices.Theymayalsobenefitfromenhancedcustomeracquisitionandretention.However,thetrialfindingsclearlyhighlightasignificantbarriertothewideruptakeofadvancedmeteringduetotheinsufficientfinancialincentives for energy suppliers to provide these services on a widespread basis. Given this context, if the SME advanced metering market is left to grow organically it is likely to develop in a fragmented way, with slow growth and limited economies of scale being achieved.
From the overall UK perspective, widespread adoption of advanced metering in the SME community represents a significantopportunityforachievingcost-effectivecarbonsavings.Figure4,whichshowstheresultsofthefield trial scaled up to the UK level, illustrates that a total of 5.� MtCO2savingscouldbeidentifiedand2.5MtCO2 savings could be implemented per year. This level of identifiedsavingsisequivalenttoover2%ofallcarbonemissions from UK businesses. Scaling up the results in financialtermsindicatesthattotalcostsavingsof£650millioncouldbeidentifiedand£300millionimplementedper year across the SME community.
0
1
2
3
4
5
6
ImplementedIdentified
Pote
ntia
l UK
annu
al c
arbo
n sa
ving
s (M
tCO
2)
5.1
2.5
Figure 4 Field trial carbon savings scaled up to UK level
In the future annual savings of 5.� MtCO2couldbeidentifiedand 2.5 MtCO2 implemented at no net cost to the UK.

Advanced metering for SMEs 05
InlightofthesignificantcostsavingsavailabletoSMEsandcarbonsavingsachievableatnetfinancialbenefittotheUK,it is essential that the market for advanced metering in SMEs grows as rapidly as possible. Given the lack of incentive for energy suppliers to provide advanced metering services across the entire commercial sector, there is a very strong case for a mandated roll-out of advanced meters for SMEs.
There are various policy options which could be used to achieve a mandated roll-out. The most basic policy measure would be to ensure that advanced meters are installed for all new and replacement meters.
Beyond this the Government could mandate an accelerated roll-out to increase the rate at which existing meter stock is replaced. An accelerated roll-out is likely to be most effective if targeted initially at all high-consumption SME users, where the business case is currently most attractive, and then extended to the wider SME community. Using a 20% accelerated roll-out rate, targeted initially at the highest consumption users, could lead to savings of �.5 MtCO2 per year by 20�2 and 2.5 MtCO2 per year by 20�6.
Without a mandated roll-out, widespread uptake of advanced meteringbySMEsishighlyunlikelyandasignificantcost-effective carbon saving opportunity will be missed.
Furthersupportingmeasureswillalsoberequiredtoensure that the market grows in a coordinated manner. For example, it is vital that industry-wide standards regarding meter functionality and interoperability are adopted. This work is underway, led by OFGEM, but must be prioritised to ensure that agreement is reached at the earliest possible opportunity.Furthermeasuresarealsorequiredtoensurethat the data from advanced meters is made freely available to the relevant parties and that standards are agreed relatingtothefrequencyandformatofdatatransfer.
For energy suppliers, roll-out will stimulate the market for innovative new metering services and generate increased customerawarenessofthebenefitsofusingsuchservices.Widespread uptake of advanced metering would also help catalyse an associated energy services market, particularly for smaller service providers. It would also put in place an infrastructure of meters capable of supporting further policies to reduce carbon emissions in future.
The following is a summary of the key recommendations coming from the trial:
Trade bodies, the Carbon Trust and others should continue topromotethebenefitsofproactiveuseofadvancedmeters to the SME community
Based on the new evidence from this study the Government should take action to ensure a widespread roll-out of advanced metering technology to SME users
Government should work to ensure that appropriate standards are put in place regarding advanced meter functionality, data availability and data transfer procedures
Energy suppliers and metering service providers should investigate new business models to provide innovative metering services to their SME clients.
Thebenefitsofadvancedmeteringareclearinterms of cost savings for SMEs and carbon savings for the UK. Actionisnowrequiredtostimulatethemarketandensure a widespread roll-out of this important technology.
Without a mandated roll-out, widespread uptake of advanced metering is highly unlikely and asignificantcost-effectivecarbonsaving opportunity will be missed.

The Carbon Trust
� Introduction to advanced metering
2 Source: ‘Climate Change: The UK Programme 2006’, Defra report. End user emissions from business were 60.5MtC (222 MtCO2) in 2004.3 ‘Code 5’ users are sites which already have electricity consumption monitored half-hourly.
06
1.1 The potential benefitsThe Government has set a target to cut carbon emissions by60%by2050and,inordertoachievethis,significantreductionswillberequiredfromallareasoftheUKeconomy. Energy use by business is the largest source of carbon emissions in the UK and reducing energy consumption in companies of all sizes is therefore vital in order to meet our targets for reducing emissions.
In order to make reductions in energy consumption, consumers mustfirstunderstandtheirenergyusage.Formanybusinesscustomers the only information they receive on their energy consumptionisviautilitybills.However,thefrequencyofbillingdoesnotprovidesufficientdetailforenergymanagement. The situation is exacerbated by the use of estimated bills which prevent customers from gaining an accurate picture of when and how their energy is consumed.
Advanced metering provides accurate and regular consumption data to consumers, allowing closer management of utility use. The half-hourly data derived from advanced metering can also be aggregated for billing purposes,avoidingtherequirementforestimatedbills.
The overall carbon dioxide emissions from the UK business sector are around 220 MtCO2 per annum2 and around 50 MtCO2 of these emissions come from SMEs which do not generally have any form of advanced metering of theirutilityuse.Thereisthereforesignificantpotentialfor carbon savings if advanced metering can help reduce energy demand in the SME sector.
1.2 Use of advanced metering in businessesFor large UK businesses advanced metering is often used across all three utilities (electricity, water and gas), but is most established for electricity. Consumption data is routinely captured by suppliers for high-volume consumers in the category referred to as ‘Code 5’3. This half-hourly data is used to provide accurate bills and also to allow the electricity to be traded via the Balancing and Settlement Code (BSC) system. Larger consumers of gas and water also benefitfromusingadvancedmeteringandhavefoundthatwhen used to manage consumption, the savings achieved canjustifythecapitalinvestmentrequired.Atthishighconsumptionendofthemarket,wheretherearesignificantpotential savings on utility bills and energy managers are on hand to interpret the consumption data, advanced metering is used to good effect.
For small and medium-sized UK enterprises (SMEs), advanced metering is rarely used since half-hourly dataisnotrequiredorcollectedbyutilitysuppliers,and ‘optional’ systems are not commonly used. If the potentialbenefitsofadvancedmeteringcouldberealisedin the SME sector, this could provide attractive cost savingsforSMEusersaswellasasignificantcontributionin terms of UK carbon savings. Some SMEs, for example chains of high-street retail stores, may also see Corporate SocialResponsibility(CSR)andbrandbenefitsfromthereduced environmental impact associated with these carbon savings.
Recent developments in areas such as communications technology have helped bring costs down, making advanced metering a more realistic proposition for smaller sites such as those found in the SME community. With these costbarrierseased,theCarbonTrustsetupamajorfieldtrial in 2004 to investigate if the SME market can realise thecostandcarbonbenefitsseeninmanyofthelarger UK companies already using advanced metering.

Advanced metering for SMEs 07
1.3 Principles of advanced meteringIn general terms an advanced meter is any form of metering system which provides a greater degree of energy consumption data beyond that used for basic billing. The increased granularity of data provided by an advanced meter can be used for energy management purposes and also has the potential to be aggregated for, or by the supplier forbillingpurposesifrequired.Usingmeteringforeffectiveenergymanagementrequiresconsumptiontobedetailedat regular periods throughout the day. Half-hourly periods have become the most commonly used time interval for advanced metering systems.
ThemeteringsolutionsinvolvedintheCarbonTrustfieldtrial can be most accurately described as ‘advanced metering, monitoring and targeting’ (AMM&T), as illustrated in Figure 6.
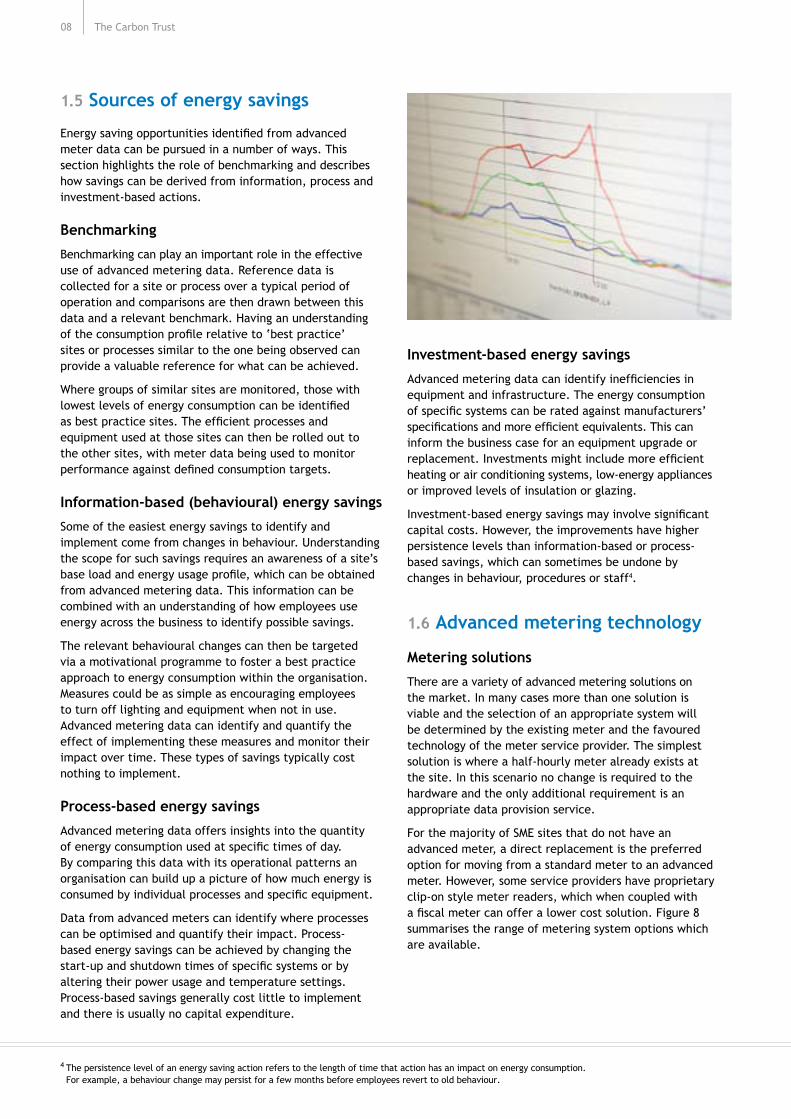
1.4 Analysing advanced metering dataAdvanced metering can help identify energy savings in several ways. Figure 7 represents a typical half-hourly energyprofileshownfortwodifferentdays.
Figure 7 illustrates three key types of potential energy saving measures that can be derived from advanced meter data:
1. Base load reductions — the overall base load of the site can be studied and reduced, for example, by identifying unnecessary constant energy use.
2. Process optimisation —theprofilecanbeusedtoidentifywhatequipmentisrunningandwhen.Alteringthestart-upandshutdowntimesofkeyprocessesandequipmentcanreduce consumption by limiting the duration of high-energy use at the start and end of working schedules.
3. Peak usage reduction —analysingtimingsandfrequenciesto establish the causes of peaks in energy usage, and understandingthecausesintermsofspecificactivities orequipment.
Install advanced meter
Collect advanced data
Inform energy
bills
Implement savings
Identify savings
Analyse
Time
00:0
0
04:0
0
08:0
0
12:0
0
16:0
0
20:0
0
24:0
0
3
22
11
After
BeforeCons
umpt
ion
Figure 7 Example half-hourly profile data, showing the three key areas for energy reduction
Figure 6 Use of advanced metering: Data is collected and analysed to identify and quantify possible savings, saving measures are implemented, and data is reviewed again
The Carbon Trust
1.5 Sources of energy savings
Energysavingopportunitiesidentifiedfromadvancedmeter data can be pursued in a number of ways. This section highlights the role of benchmarking and describes how savings can be derived from information, process and investment-based actions.
Benchmarking
Benchmarking can play an important role in the effective use of advanced metering data. Reference data is collected for a site or process over a typical period of operation and comparisons are then drawn between this data and a relevant benchmark. Having an understanding oftheconsumptionprofilerelativeto‘bestpractice’sites or processes similar to the one being observed can provide a valuable reference for what can be achieved.
Where groups of similar sites are monitored, those with lowestlevelsofenergyconsumptioncanbeidentifiedasbestpracticesites.Theefficientprocessesandequipmentusedatthosesitescanthenberolledouttothe other sites, with meter data being used to monitor performanceagainstdefinedconsumptiontargets.
Information-based (behavioural) energy savings
Some of the easiest energy savings to identify and implement come from changes in behaviour. Understanding thescopeforsuchsavingsrequiresanawarenessofasite’sbaseloadandenergyusageprofile,whichcanbeobtainedfrom advanced metering data. This information can be combined with an understanding of how employees use energy across the business to identify possible savings.
The relevant behavioural changes can then be targeted via a motivational programme to foster a best practice approach to energy consumption within the organisation. Measures could be as simple as encouraging employees toturnofflightingandequipmentwhennotinuse.Advancedmeteringdatacanidentifyandquantifytheeffect of implementing these measures and monitor their impact over time. These types of savings typically cost nothing to implement.
Process-based energy savings
Advancedmeteringdataoffersinsightsintothequantityofenergyconsumptionusedatspecifictimesofday.By comparing this data with its operational patterns an organisation can build up a picture of how much energy is consumedbyindividualprocessesandspecificequipment.
Data from advanced meters can identify where processes canbeoptimisedandquantifytheirimpact.Process-based energy savings can be achieved by changing the start-upandshutdowntimesofspecificsystemsorbyaltering their power usage and temperature settings. Process-based savings generally cost little to implement and there is usually no capital expenditure.
Investment-based energy savings
Advancedmeteringdatacanidentifyinefficienciesinequipmentandinfrastructure.Theenergyconsumption ofspecificsystemscanberatedagainstmanufacturers’specificationsandmoreefficientequivalents.Thiscaninformthebusinesscaseforanequipmentupgradeorreplacement.Investmentsmightincludemoreefficientheating or air conditioning systems, low-energy appliances or improved levels of insulation or glazing.
Investment-basedenergysavingsmayinvolvesignificantcapital costs. However, the improvements have higher persistence levels than information-based or process-based savings, which can sometimes be undone by changes in behaviour, procedures or staff4.
1.6 Advanced metering technology
Metering solutions
There are a variety of advanced metering solutions on the market. In many cases more than one solution is viable and the selection of an appropriate system will be determined by the existing meter and the favoured technology of the meter service provider. The simplest solution is where a half-hourly meter already exists at thesite.Inthisscenarionochangeisrequiredtothehardwareandtheonlyadditionalrequirementisanappropriate data provision service.
For the majority of SME sites that do not have an advanced meter, a direct replacement is the preferred option for moving from a standard meter to an advanced meter. However, some service providers have proprietary clip-on style meter readers, which when coupled with afiscalmetercanofferalowercostsolution.Figure8summarises the range of metering system options which are available.
4 The persistence level of an energy saving action refers to the length of time that action has an impact on energy consumption. For example, a behaviour change may persist for a few months before employees revert to old behaviour.
08

Advanced metering for SMEs
Communications
Today’s lower cost communications is one of the main reasons advanced metering has become a realistic proposition for smaller consumers. Mobile networks make it simple to upload data from many disparate locations at relativelylowcost.Previously,thiswouldhaverequired a large number of more expensive land lines.
Advanced meters are often able to record and store data locally for a period of days or weeks. Wireless communications can then be used to transfer energy data to a central database.
Emerging communication systems, such as short-range local wireless networks, are expected to be used more widely in future, allowing metering communications costs to fall further.
Thespecificcommunicationssolutionschosenaretypicallydictated by the practicalities of the site. Wireless systems can be less effective in basements and in locations with limited network coverage. However, high-gain aerials can often overcome such problems. As a last resort standard landlines can still be used.
Figure 8 Advanced metering technology options for SMEs
09
KEY:
Fiscal meter — main meter used for billingClip-on — retrofit meter reading deviceSecondary meter — a second meter connected near the first to independently collect half-hourly dataComms — communicationsHH — half-hourly
Start
Is there an existing meter?
Yes
No
No
NoNo
No
Is it Comms compatible?
Comms equipmentin place
Ready for advanced metering
Yes
Yes
Yes
Yes
Can the fiscal meter be replaced
Install new HHsecondary meter
Install Commsequipment
Consider installing clip-on HH data logger
Is it capable of capturing HH data?
Install new HHfiscal meter
1.7 Advanced metering services
Existing commercial services
A small number of advanced metering service providers currently offer a range of different commercial services for business users. These vary from remote collection of data from existing half-hourly meters to installing new advanced meters or providing ‘clip-on’ meter reading devices for existing meters where compatible.
However, there is currently a lack of full end-to-end metering services for the SME market. The smaller service providers tend to specialise in either data collection or meter installation and sometimes form strategic alliances with companies providing complementary services. A few larger players operate across all areas, but these tend to target the larger half-hourly ‘Code 5’ electricity market.
Types of service offering
There are three generic levels of service which can be provided to accompany advanced metering technology for business customers to enable energy savings:
Data only — provision of the meter and access to the meter data, typically via a website with simple diagnostic tools.
Data and advice — provision of the meter and meter data plus some level of energy saving analysis and advice. This is typically sent via email.
Personal contact — provision of the meter and meter data plus some form of personal contact to provide customised energy saving advice, typically via telephone calls or site visits.
There are also some lower cost solutions aimed at the domestic market, including user-friendly displays showing consumption information but without remote access to meter data. However, the solutions used in the Carbon Trust fieldtrialarefocusedonSMEusersandallinvolveremotecollection of data and provision of access to this data.

The Carbon Trust�0
2.1 Industry structureThe UK electricity and gas markets were opened up to competition in the �990s. Since then, new players have entered the market, leading to greater choice and a more competitive market.
Utility regulators are responsible for protecting consumers andpromotingeffectivecompetition.TheOfficeofGasandElectricity Markets (OFGEM) regulates electricity and gas markets. OFWAT, the Water Services Regulation Authority is responsible for the water industry. Both regulators wish to see improvements in metering and billing services as customerswillbenefitbybeingabletomonitorandcontrolenergy and water use more effectively.
The UK energy industry comprises two main groups: suppliers and distributors. Customers have contracts with the suppliers who ensure that the customer receives energy and that it is appropriately metered and billed for. Distributors are responsible for the energy transportation infrastructure and suppliers contract them to physically deliver energy to their customers.
Suppliers use meter reading and data collection services to keep track of their customers’ energy use. In theory, customers can choose which company provides them with their metering service. In practice, most SMEs leave this decision in the hands of their energy supplier.
2.2 Consumption and billingUtility bills in the UK are based either on actual consumption dataoronestimatedreadings.Suppliersgenerallyrequiremore accurate consumption information from their largest consumers. Customers with lower consumption levels can be handled through estimates, since from the suppliers’ perspective, the balance of any inaccuracies is fairly small relative to overall consumption levels.
2.3 Electricity metering
Market segmentation
In the electricity market, customer sites with peak consumption exceeding �00 kWh for three consecutive monthsareclassifiedas‘Code5’andsupplierscollectactual consumption data into the Balancing and Settlement Code (BSC) system (see Figure 9 for more details). This process provides accurate bills for the customer as well as accurate predictions for electricity demand. Additionally, all companies are entitled to opt into the Code 5 system if they are prepared to pay additional charges and upgrade their meter. This typically appeals to larger organisations with multiple sites which separately do not exceed �00 kWh peakconsumption,butcollectivelyaresignificant.Thereare currently �07,000 Code 5 meters in the UK, of which as many as half are believed to have ‘opted in’ to the BSC system.
Sites on Code 5 meters have access to their half-hourly consumption data. However, their ability to access this in a timely fashion is dependent on the energy supplier. In a 2005 survey, the Carbon Trust found that the time it took for energy suppliers to make data available varied from 24 hours to as long as a month. Clearly, long delays between consumption and availability of data compromise the usefulness of that data for energy management purposes.
Around 2.3 million electricity5 and 420,000 gas meters6 are in use at SME premises in the UK. Water meters in the SME sector are estimated at around �.6 million7. The gas, electricity and water markets are all segmented according to levels of consumption.
2 Metering and billing in the UK
5 ELEXON 2007. 6 Nera/Datamonitor 2005. 7 Derived from OFWAT 2005 and SBS 2006.

��Advanced metering for SMEs
Sites below the Code 5 threshold are sub-divided into anumberof‘profileclasses’,basedontypeofcustomerand typical energy consumption levels. These range from domesticusers(profileclasses1&2)tosignificantenergyusers(profileclasses7&8).Thevastmajorityofbusiness
customersinprofileclasses3-8havestandard,manually-read meters and estimated utility bills. Table � provides a breakdown of the different groupings of business customers in the electricity metering market.
Group Description General billing type Number of meters
Average annual consumption
Profileclass3 Unrestricted Estimated �,662,800 �4,900 kWh
Profileclass4 Economy 7 Estimated 506,700 24,800 kWh
Profileclass5 0-20% Load factor Estimated 38,000 8�,600 kWh
Profileclass6 20-30% Load factor Estimated 53,700 �09,800 kWh
Profileclass7 30-40% Load factor Estimated 27,600 �28,900 kWh
Profileclass8 >40% Load factor Estimated 48,�00 �42,300 kWh
Sub-total 2,336,900
Code 5 High consumption Accurate �07,000
Total 2,443,900
Table 1 Customer groups and consumption levels for electricity metering
Source: ELEXON, January 2007
Figure 9 The Balancing and Settlement Code
The Balancing and Settlement Code (BSC)
Like other commodities, electricity is produced, sold into a wholesale market and then resold to consumers. The Balancing and Settlement Code (BSC) contains the governance arrangements for electricity balancing and settlement in Great Britain and covers all electricity users and the companies that generate and supply the electricity.
Under the terms of the BSC, generators who produce electricity contract with suppliers who sell it on to commercial and domestic consumers. These contracts arenotifiedintoacentralsettlementsystem,whichismanaged by ELEXON Ltd. Any difference between the amount of electricity contracted for and the amount delivered by generators or sold on by suppliers, is bought or sold through ELEXON’s systems. ELEXON debits and credits members’ accounts at the end of each day.
The Carbon Trust�2
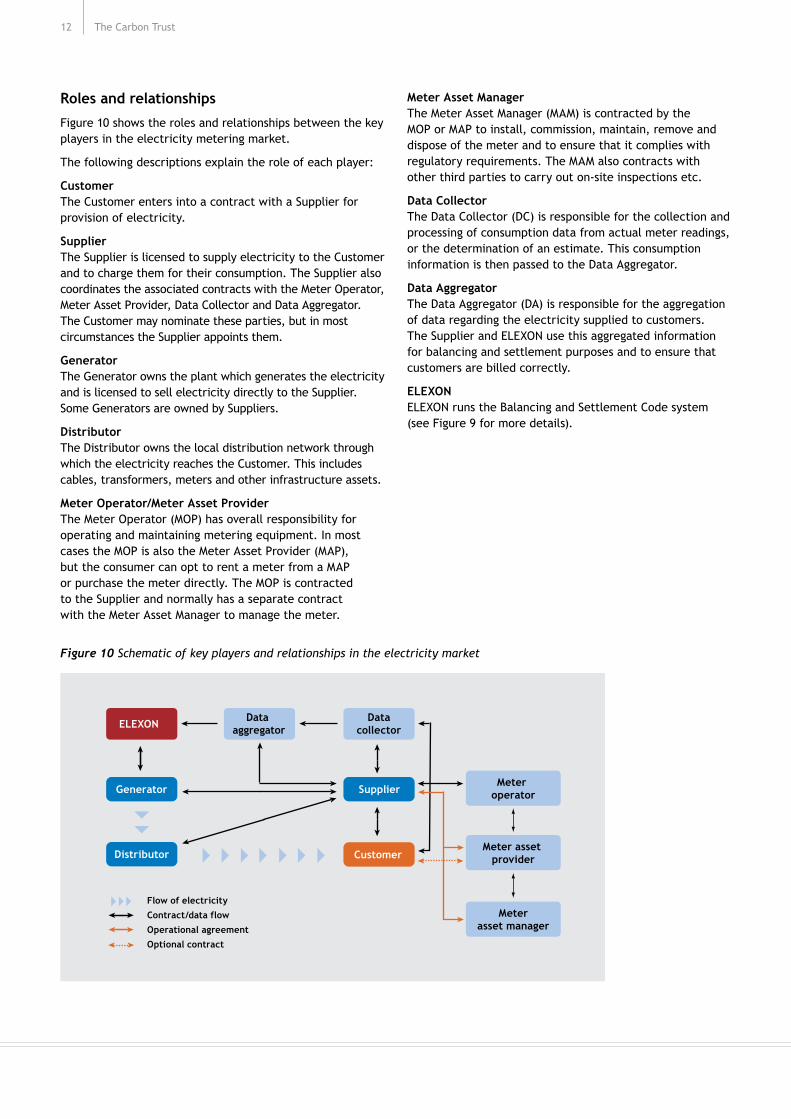
Roles and relationships
Figure �0 shows the roles and relationships between the key players in the electricity metering market.
The following descriptions explain the role of each player:
CustomerThe Customer enters into a contract with a Supplier for provision of electricity.
SupplierThe Supplier is licensed to supply electricity to the Customer and to charge them for their consumption. The Supplier also coordinates the associated contracts with the Meter Operator, Meter Asset Provider, Data Collector and Data Aggregator. The Customer may nominate these parties, but in most circumstances the Supplier appoints them.
GeneratorThe Generator owns the plant which generates the electricity and is licensed to sell electricity directly to the Supplier. Some Generators are owned by Suppliers.
DistributorThe Distributor owns the local distribution network through which the electricity reaches the Customer. This includes cables, transformers, meters and other infrastructure assets.
Meter Operator/Meter Asset ProviderThe Meter Operator (MOP) has overall responsibility for operatingandmaintainingmeteringequipment.Inmostcases the MOP is also the Meter Asset Provider (MAP), but the consumer can opt to rent a meter from a MAP or purchase the meter directly. The MOP is contracted to the Supplier and normally has a separate contract with the Meter Asset Manager to manage the meter.
Meter Asset ManagerThe Meter Asset Manager (MAM) is contracted by the MOP or MAP to install, commission, maintain, remove and dispose of the meter and to ensure that it complies with regulatoryrequirements.TheMAMalsocontractswithother third parties to carry out on-site inspections etc.
Data CollectorThe Data Collector (DC) is responsible for the collection and processing of consumption data from actual meter readings, or the determination of an estimate. This consumption information is then passed to the Data Aggregator.
Data AggregatorThe Data Aggregator (DA) is responsible for the aggregation of data regarding the electricity supplied to customers. The Supplier and ELEXON use this aggregated information for balancing and settlement purposes and to ensure that customers are billed correctly.
ELEXONELEXON runs the Balancing and Settlement Code system (see Figure 9 for more details).
Data aggregator
Datacollector
SupplierMeter
operator
Distributor CustomerMeter asset
provider
Meterasset manager
Flow of electricity
Contract/data flow
Operational agreement
Optional contract
Generator
ELEXON
Figure 10 Schematic of key players and relationships in the electricity market

�3Advanced metering for SMEs
Thefollowingdescriptionsexplainbrieflytheroleof each player:
CustomerThe Customer enters into contract with a Supplier for provision of gas.
SupplierThe Supplier is licensed to supply gas to the Customer and to charge them for their consumption. The Supplier also coordinates the associated contracts with the Meter Operator.
ShipperThe Shipper buys gas directly from the producers and sells this to the Supplier. In order to keep the level of gas in the UK network at a constant level, the Shippers need to balance the amount of gas going into the system with that which is being consumed. This process is carried out according to a legal and contractual framework set out in the Network Code.
TransporterThe Transporter (or Network Operator) owns the gas pipeline system. The Supplier needs consumption information for billing and the Transporter needs the same information to ensure balance in the network. As a result, most meters on the customer’s side of the network are owned and maintained by the major gas network owner — National Grid.
2.4 Gas metering
Market segmentation
In the gas market, customers are divided into high and low volume users. High-volume users, with annual consumption levelsof58,600MWhormoreareclassifiedas‘dailyread’.They are billed based on their exact consumption generally using advanced metering systems which provide daily (rather than half-hourly) readings. There are currently around 2,000 daily-read gas meters in the UK8.
Lower volume gas users in general do not have advanced meteringsystemsandfrequentlyreceiveestimatedbills.There are over 400,000 such users, divided into four consumption bands (see Table 2 below).
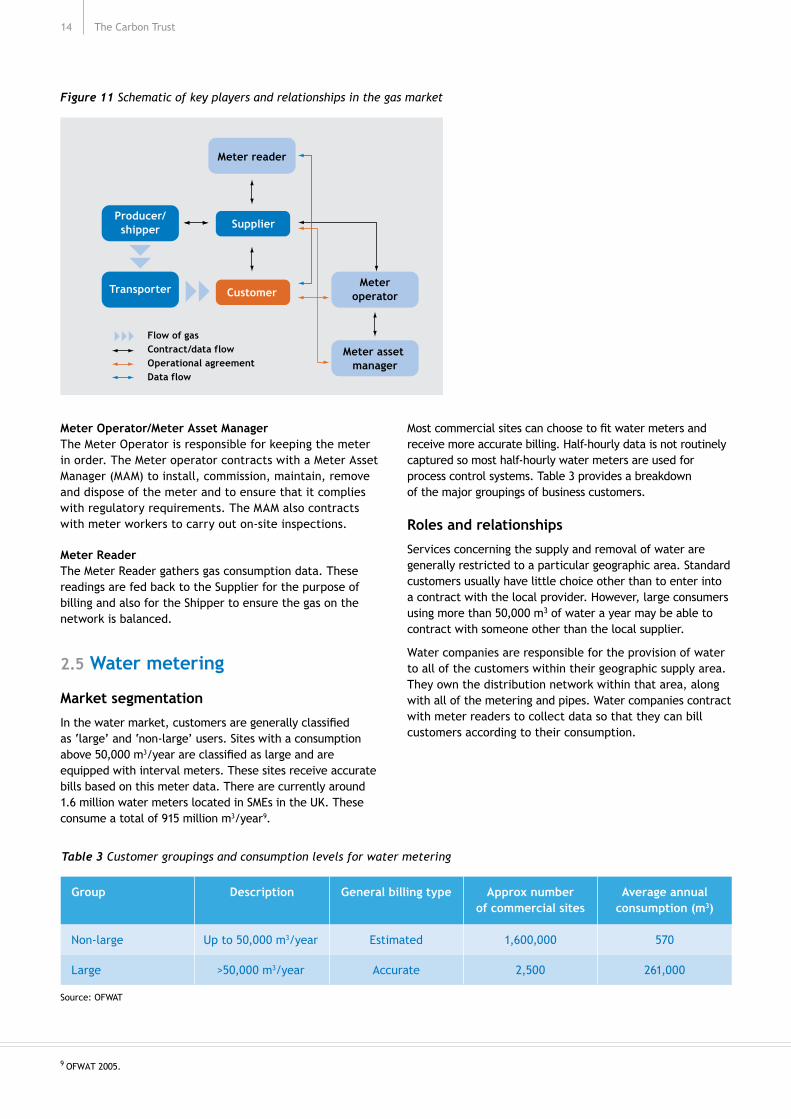
Roles and Relationships
Figure �� (overleaf) shows the roles and relationships between the key players in the gas metering market.
Group Consumption General billing type Number of meters
Average annual consumption
Non-daily � 73–732 MWh Estimated 38�,000 �70 MWh
Non-daily 2 732–2�96 MWh Estimated 26,600 �,�60 MWh
Non-daily 3 2�96–5860 MWh Estimated 7,700 3,320 MWh
Non-daily 4 >5860 MWh Estimated or Monthly 3,�00 �4,240 MWh
Sub-total 418,400
Daily-read >58,600 MWh Accurate 2,000 x
Total 420,400
Table 2 Customer groupings and consumption levels for gas metering
Source: NERA, British Gas/Transco/Carbon Trust
8 Source:Nera/EnvirosreportforDefraonEnergyEfficiencyandTrading,April2006.
The Carbon Trust�4
Meter Operator/Meter Asset ManagerThe Meter Operator is responsible for keeping the meter in order. The Meter operator contracts with a Meter Asset Manager (MAM) to install, commission, maintain, remove and dispose of the meter and to ensure that it complies withregulatoryrequirements.TheMAMalsocontractswith meter workers to carry out on-site inspections.
Meter ReaderThe Meter Reader gathers gas consumption data. These readings are fed back to the Supplier for the purpose of billing and also for the Shipper to ensure the gas on the network is balanced.
2.5 Water metering
Market segmentation
Inthewatermarket,customersaregenerallyclassified as ‘large’ and ‘non-large’ users. Sites with a consumption above 50,000 m3/yearareclassifiedaslargeandareequippedwithintervalmeters.Thesesitesreceiveaccuratebills based on this meter data. There are currently around �.6 million water meters located in SMEs in the UK. These consume a total of 9�5 million m3/year9.
Mostcommercialsitescanchoosetofitwatermetersandreceive more accurate billing. Half-hourly data is not routinely captured so most half-hourly water meters are used for process control systems. Table 3 provides a breakdown of the major groupings of business customers.
Roles and relationships
Services concerning the supply and removal of water are generally restricted to a particular geographic area. Standard customers usually have little choice other than to enter into a contract with the local provider. However, large consumers using more than 50,000 m3 of water a year may be able to contract with someone other than the local supplier.
Water companies are responsible for the provision of water to all of the customers within their geographic supply area. They own the distribution network within that area, along with all of the metering and pipes. Water companies contract with meter readers to collect data so that they can bill customers according to their consumption.
Meter reader
Meteroperator
Meter asset manager
Producer/shipper
Transporter
Flow of gasContract/data flowOperational agreementData flow
Supplier
Customer
Figure 11 Schematic of key players and relationships in the gas market
9 OFWAT 2005.
Group Description General billing type Approx number of commercial sites
Average annual consumption (m3)
Non-large Up to 50,000 m3/year Estimated �,600,000 570
Large >50,000 m3/year Accurate 2,500 26�,000
Table 3 Customer groupings and consumption levels for water metering
Source: OFWAT

�5Advanced metering for SMEs
2.6 Barriers to advanced metering for SMEsGiventhepotentialbenefitsofadvancedmeteringit is important to understand why this technology is not currently widely used by the SME community.
Customer-side barriers
Awareness of advanced metering — there is a low level of awareness among SMEs of advanced metering and its potentialbenefits.
Linking energy use to costs — in general, SMEs believe their choice of supplier and underlying energy price rises are the main drivers of energy costs. They do not always recognise that changes in their own behaviour, processes orequipmentcanreducecostssignificantly.
Limited time and resources — SMEs are resource and time constrained, and most do not have dedicated energy managers. Installing or using advanced metering may not be seen as a priority, even where there is awareness of thepotentialbenefits.
Transparency of costs — there is a lack of transparency as a result of the complex market structure. For instance, since some metering service providers are not accredited data collectors the SME may have to bear the cost of managing two meters if they opt for advanced metering.
Understanding of service options — there is little understanding surrounding the levels of service, or resource investmentrequiredtobestobtainsavingsusingadvancedmetering technology. Many SMEs are not familiar with the concept of paying for metering services which can ultimately lead to energy and cost savings.
Availability of metering services — currently there is no widespread, competitive market providing advanced metering services for SMEs.
Supply-side barriers
Capacity of metering service providers — most suppliers of meter reading and data analysis services are small-scale players who are unlikely to have the capacity to drive large-scale market uptake.
Insufficient incentives for suppliers — the major energy suppliers are ideally positioned to drive a rapid take-up of advanced metering technology. However, most suppliers do not currently offer services targeted at SMEs. Although therearepotentialnewrevenueandcustomeracquisitionopportunitiesthesearenotyetseenassufficientlyattractiveto offset the costs associated with metering service provision or potential loss of revenue from reduced consumption. Therearecurrentlynoregulatoryrequirementsplacedonsuppliers to drive advanced metering forward.
Stranded asset concerns — the energy supply companies, associated meter operators and meter asset providers are concerned that investment in advanced meters will leave them with stranded assets if customers decide to switch suppliers. This is due to a lack of common standards for advanced meters to ensure that meters can be taken on and used by new suppliers as currently happens for conventional meters when customers change suppliers. There is also a concern about having to write off sunk costs associated with the current stock of meters which are still serviceable.
These customer-side and supply-side barriers must be addressed in order to accelerate the market for advanced metering.TheaimoftheCarbonTrust’sfieldtrialhas been to gain a better understanding of these barriers and toquantifythepotentialbenefitsofadvancedmeteringinterms of cost savings for SMEs and carbon savings for the UK.

The Carbon Trust�6
3.1 Scope and objectivesInlightofthepotentialcarbonsavingbenefitsofusingadvanced metering but also the existing barriers to adoption,theCarbonTrustdecidedtorunthefirstUK fieldtrialofadvancedmeteringfortheSMEcommunity.
Theadvancedmeteringfieldtrialwasdevisedwiththefollowing high-level objectives:
Understandthepotentialbenefitsofadvancedmeteringfor SMEs
Stimulate market demand by demonstrating that advanced metering can reduce energy consumption and costs
Help understand the barriers to broader uptake and how they might be overcome
Identify the nature of advanced metering services which yield the best savings
Develop case studies, highlighting the advantages of advanced metering
Quantify the potential UK-wide carbon savings attributable to advanced metering in the SME community
Identify potential policy measures to stimulate uptake.
This project was managed as one of the Carbon Trust’s portfolio of Technology Acceleration projects�0. This project began in 2004, most sites were recruited by the start of 2005 and metering data was captured and analysed until late spring 2006.
3.2 Methodology and approachTodeliverthefieldtrial,theCarbonTrustcontracted with seven consortia all of which were already operating commercially in the metering market. The lead organisations are shown in Figure �2.
The delivery consortia each recruited portfolios of SMEs or SME-like sites and installed advanced metering for electricity, gas and water at these sites as appropriate (not all utilities were metered at every site). A total of 582 sites were involved in the trial.
Figure �3 illustrates the structure of the project. In addition to installing meters, the consortia provided varying degrees of support to the SME sites in relation to data provision, analysis and recommendations to reduce energy use.
The consortia completed log books for each site, tracking the estimated energy savings for each recommendation and the extent to which each recommendation was successfully implemented.
For each site a case study was also produced to describe the overall actions taken and associated savings made. These captured the situation at the site prior to advanced metering, including details about the organisation and annual energy and water consumption levels. Case studies included graphical data showing consumption and areas wherepotentialsavingshadbeenidentified.Theyalsoincludedthefinancialcaseforimplementingenergysavingactions and the levels of potential savings in terms of consumption, carbon emissions and costs.
As part of this process the consortia reviewed the half-hourly meter data to identify and validate actual savings made for each of the utilities measured. Where it was not possible to implement energy saving recommendations, the reasons for this were discussed with the site and captured for reference.
3Theadvancedmeteringfieldtrial
�0 For more on Technology Acceleration visit: www.carbontrust.co.uk/technology/technologyaccelerator
Carbon Trustproject management
Independent auditors
Sites (582)
Log books
Case studies
Lessons learnt
Meter data
Consortia (7)
• Site recruitment
• Meter installation
• Data provision
• Data analysis
• Energy saving recommendations
To capture site information and energy saving recommendations.
Detailed case write ups for sites where energy savings were made.
Reporting on the reasons why savings were not possible.
Uploaded meter data used to verify case studies.
BEAMA www.beamaenergy.org.uk
Bglobal www.bglobalmetering.com
EMT www.eccl.co.uk
Pilot Systems www.pilotsystems.com
TAC Satchwell www.tac.com
TEAM www.teamenergy.com
UPL www.up-ltd.co.uk
Figure 13 Key players and relationships for the field trial
Figure 12 List of lead organisations involved in the trial

�7Advanced metering for SMEs
The Carbon Trust appointed a team of independent auditors toreviewtheenergysavingsreported.Theauditorsverifiedthe nature of the recommendations and savings claimed at each site through a programme of site visits and analytical research using recorded meter data. The Carbon Trust collaborated with four external consultancies in the delivery of this project as detailed in Figure �4.
3.3 Site activitiesFigure �5 illustrates the key steps for the sites in the trial.
Site recruitment
Each of the delivery consortia managed their own recruitment of sites. The process adopted was intended toreplicatetypicalrecruitmenttechniqueswhichmight be used commercially for the roll-out of advanced metering services. This included direct marketing to new and existing customersandmassmailingofflyerstoexistingcontacts.
Participatingsitesbenefitedfrommeterinstallation and service provision free of charge for the lifetime of the project. The amount of time, resource and capital investmentdedicatedtoenergysavingidentification and implementation was left up to individual sites.
Meter installation
The delivery consortia installed the necessary metering and communicationsequipmentforselectedsites.Atotalof64trial participants were already on Code 5 electricity meters. For these sites no meter installation was necessary. All that wasrequiredwasaccesstotheexistinghalf-hourlydata.
The Code 5 sites were treated as a control group to investigate differences in use of advanced metering services between sites with and without existing interval metering. Thefindingsfromthesesiteswereexcludedfromthebulkof the analysis in this report in order to understand the potential for advanced metering in the SME sector where sites do not currently have interval metering in place.
Of the remaining sites, 73 made use of ‘pulsed-output’ meters with the capability to capture half-hourly data through the use of clip-on readers. These readers allow half-hourly data to be obtained without the need for upgrading the primary meter. The remainder replaced existing manually read meters with new advanced meters. The majority of gas meters in the trial were replaced with half-hourly meters, but a number had the capability to store half-hourly data which could be collected by the consortia.
Billing approach
The 64 sites already on Code 5 electricity meters were billed on their half-hourly consumption data under the Balancing and Settlement Code system. However, all other electricity meter sites (and all sites with gas and water meters) continued to be billed on the basis of estimated reads.
Some sites were able to use the advanced meter data to provide accurate customer readings to their suppliers and therefore receive more accurate bills. In some cases the delivery consortia provided such customer readings on behalf of the sites using the meter data. Therefore, while all sites gained more accurate energy consumption data, onlyalimitednumbersawthesebenefitsdirectlyviamoreaccurate bills during the trial.
Figure 14 Project collaborators for the field trial
Site recruitment New customers Existing contacts Nominated sites
Meter installation Existing HH Clip-on New HH
Billing approach Based on HH data Informed by HH Estimated
Type of service Data only Data and advice Personal contact
Energy saving actions Recommendations ImplementationVerification
Figure 15 Key steps for the sites in the trial
HH = Half-hourly
AEA Energy and Environment coordinated the collation and analysis of log books and case studies and carried out the audit process
TEAM managed a central database of all half-hourly meter data
Paul Arwas Associates carried out the UK scale-up andcost/benefitanalysisandsupportedpolicydevelopment
Hama provided project management services

The Carbon Trust�8
�� Sixty-four of the 582 trial sites already had Code 5 electricity meters installed and have been excluded from the electricity analysis. However, 20 of these 64sitesalsohadgasandwatermeterssoonly44ofthe582sitesareexcluded.Consequentlyatotalof538sitesareincludedinthemainanalysis.
Type of service
Sites received different levels of interaction in the services providedbytheconsortia.Thesewereclassifiedasfollows:
Data only (134 sites, incl. 39 Code 5 sites) — the most basic offering was the provision of meter data only, normally via a website. Basic online tools were provided to allow sitestoconductbasicanalysisoftheirenergyprofiles.
Data and advice (112 sites, incl. 1 Code 5 site) — this intermediate level of service typically consisted of data provision together with a review of the site energy consumption and some basic energy saving recommendations relatingtotheprofile.Thisinformationwasnormallycommunicated via email.
Personal contact (336 sites, incl. 4 Code 5 sites) — this level of service involved two-way communications with the site including detailed discussion around the consumption profiles,eitherviatelephoneorsitevisits.Thedeliveryconsortiaproducedsite-specificrecommendations and advice.
Energy saving actions
For each site the project team tracked the energy saving recommendations made by either the site or the consortia. Of the 538 sites which didn’t already have advanced metering installed��,atotalof504sites(94%)identified(orwere provided with) energy saving recommendations. From these, 304 (56%) implemented at least one recommendation. It is notable that only just over half of the sites in the trial
had the inclination, resources or relevant experience to make use of advanced metering data. This is perhaps to be expected given the pressure on time and resources within SME companies. The project team recorded the estimated energy savings of each recommendation and the extent to which it was implemented. If the site was intending toimplementarecommendationinasubsequentyearthis was also recorded. This was an important consideration for some sites as capital investment cycles may preclude energy saving recommendations from being implemented immediately. The data on expected future implementation isnotincludedinthecoresetoffieldtrialresultsinthisreport.However,itisusedinthecost/benefitanalysis (see Section 7) for modelling expected payback periods in future years.
3.4 Characteristics of participating sites The trial aimed to be representative of a broad range of SMEs covering different market sectors and geographical areas. It included a representative distribution of employees, utility bills and consumption levels. Sites also had different levels of prior experience in energy management.
Consumption levels
Table 4 summarises the overall and average consumption and emissions statistics�2 for the sites in the trial, broken down by utility.
Although the sites in the trial came from a diverse range of industry sectors, their involvement was to some extent self-selecting.Consequentlythesetoftrialsiteswasskewedtowards the larger end of the overall UK SME population.
Figure �6 shows that the average gas and electricity consumption for the sites in the trial (excluding the Code 5 control sites) was greater than the average across the UK SME community as a whole. The sites in the trial typically had a gas consumption twice the average of UK SMEs and electricity consumption of over ten times the UK average (300,000 kWh/year as opposed to 22,500 kWh/year).
When the trial savings were studied in relation to company size, there was found to be no discernible difference in average percentage savings. This suggests that the difference in consumption levels between the trial sites and the UK averageisnotsignificantintermsofkeytrialfindings.
Recruitment and meter installation at 538 sites (�00%)
Energy saving recommendations identifiedat504 sites (94%)
Energy saving recommendationsimplemented at 304 sites (56%)

�9Advanced metering for SMEs
Figure 16 Comparison between UK average SME consumption and the trial average
0
200,000
400,000
600,000
800,000
1,000,000
ElectrictyGas
Ann
ual c
onsu
mpt
ion
(kW
h)
Trial
UK average
Electricity (Code 5 sites)
Electricity (core SME sites)
Gas Water
Sites 44 5�8 �08 �0�
Total consumption 70 GWh �60 GWh 97 GWh 355,000 m3
Average consumption �,600 MWh 3�0 MWh 900 MWh 3,500 m3
Total emissions 30,�00 tCO2 68,800 tCO2 �8,430 tCO2 �38 tCO2
Average emissions 684 tCO2 �33 tCO2 �7� tCO2 �.4 tCO2
Table 4 Annual consumption and emissions levels for trial sites
Sector Number sites
Average utility bill
(£/yr)
Average carbon
emissions (tCO2/yr)
Community, social and personal
77 4�,400 290
Education �07 20,000 �40
Financial and business services
53 32,200 2�0
Government 96 23,800 �60
Health and social work
24 �8,700 �30
Manufacturing �6 50,�00 440
Wholesale and retail trade
2� 25,600 �70
Other sectors �44 �0,300 70
All sectors 538 23,400 160
Table 5 Breakdown of sites by sector
Industry sectors and utility bills
Table 5 breaks down sites by sector and presents sectoral averages for utility bills and carbon emission levels.
The average combined utility bill for the electricity, gas and water consumption (where measured) for the 538 core sites came to £23,400 per year and the average carbon emissions per site were �60 tCO2 per year.
Sector coverage is fairly representative of the SME community.The ‘Other’ category includes Utility providers, Transport, Agriculture and Horticulture. These have been grouped together due to low sample sizes.
�2 All carbon emission calculations in this report are based on the following carbon emission factors: Electricity: 0.43 kgCO2/kWh; Gas: 0.�9 kgCO2/kWh (Source: www.defra.gov.uk/environment/business/envrp/gas/envrpgas-annexes.pdf) Water: 0.389 kgCO2/m3 (Carbon Trust derived from www.bre.co.uk/pdf/WaterNews4.pdf)
The Carbon Trust20
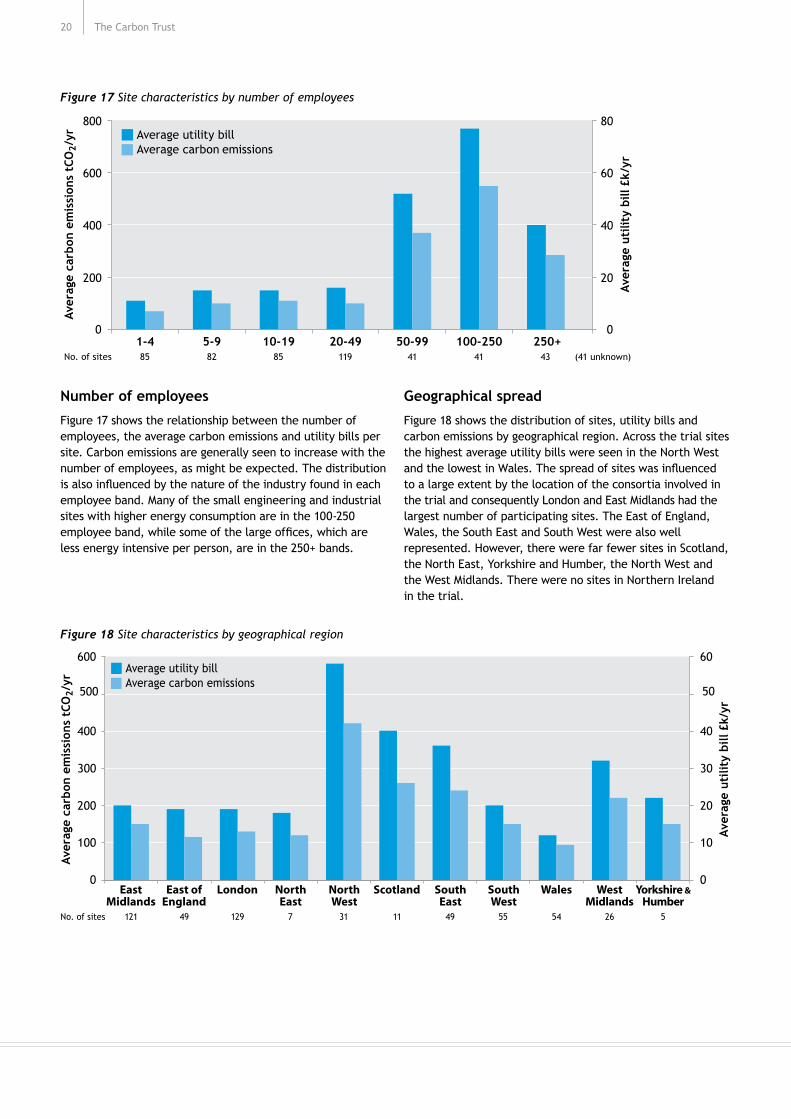
Number of employees
Figure �7 shows the relationship between the number of employees, the average carbon emissions and utility bills per site. Carbon emissions are generally seen to increase with the number of employees, as might be expected. The distribution isalsoinfluencedbythenatureoftheindustryfoundineachemployee band. Many of the small engineering and industrial sites with higher energy consumption are in the �00-250 employeeband,whilesomeofthelargeoffices,whichareless energy intensive per person, are in the 250+ bands.
Geographical spread
Figure �8 shows the distribution of sites, utility bills and carbon emissions by geographical region. Across the trial sites the highest average utility bills were seen in the North West andthelowestinWales.Thespreadofsiteswasinfluenced to a large extent by the location of the consortia involved in thetrialandconsequentlyLondonandEastMidlandshadthelargest number of participating sites. The East of England, Wales, the South East and South West were also well represented. However, there were far fewer sites in Scotland, the North East, Yorkshire and Humber, the North West and the West Midlands. There were no sites in Northern Ireland in the trial.
Figure 18 Site characteristics by geographical region
0
600
500
400
300
200
100
0
60
50
40
30
20
10
East Midlands
East of England
London North East
North West
Scotland South East
South West
West Midlands
Wales Yorkshire &Humber
Average utility bill Average carbon emissions
No. of sites 121 129 7 31 11 49 55 54 26 549
Aver
age
carb
on e
mis
sion
s tC
O2/
yr
Aver
age
utili
ty b
ill £
k/yr
0
20
40
60
80
0
200
400
600
800
250+100-25050-9920-4910-195-91-4No. of sites
Aver
age
carb
on e
mis
sion
s tC
O2/
yr
Aver
age
utili
ty b
ill £
k/yr
85 82 85 119 41 41 43 (41 unknown)
Average utility bill Average carbon emissions
Figure 17 Site characteristics by number of employees

2�Advanced metering for SMEs
Types of energy saving recommendations
Figure21showsthetypesofenergysavingsidentifiedforeach site, broken down by the type of service provided. As might be expected, the overall number of recommendations tended to increase with the level of service provided. Around �5% came from the Data Only service, 25% from Data and Advice and around 60% from Personal Contact interactions with consortia.
Across all service types process-based energy saving recommendations were by far the most prevalent, accounting for around 70% of all recommendations. Around 20% of the recommendations were information-based (behavioural) and the remaining �0% were investment-based. Most investment-based recommendations came from the Personal Contact service, where the metering consortia were able to identify specificequipmentupgradeandplantinvestmentoptionsbased on a closer and more detailed understanding of the site.
Energy saving experience
Trial participants had varying degrees of prior experience. 37% of sites had never undertaken any energy saving activity; 54% had some history of energy saving activities, but had no active programmes; And only 9% reported that they were actively undertaking energy saving measures at the time of the trial. Figure �9 shows that sites which were already undertaking energy saving activities tended to have higher than average utility bills and carbon emissions.
Single sites vs. multi sites
Thefieldtrialinvolvedamixtureofsingle-siteSMEsandsiteswhich were part of larger multi-site groups (6 or more sites) but behaved independently, such as sites from retail chains. Generally SMEs which are part of a multi-site organisation benefitfromeconomiesofscalerelativetosingle-site SMEs. They can aggregate consumption to negotiate more favourable contracts, coordinate metering roll-out across multiple sites and replicate energy saving initiatives. Of the trialsites,132wereclassifiedassingle-siteSMEsand450were multi-site SMEs.
Type of metering service
Sites received different types of metering service, depending ontherequirementsofthesiteandthecapabilitiesoftheconsortium. As shown in Figure 20 over half of the sites received Personal Contact services. The average utility bill and carbon emissions are broadly similar regardless of service type, allowing a valid comparison to be made between these different types of interaction.
Figure 19 Site characteristics by prior experience of energy saving activities
0
50
100
150
200
250
300
350
400
Currentlyproactivein saving energy
Some experience of energy saving
programmes
Neverundertaken an energy saving
programme
0
5
10
15
20
25
30
35
40
450
500
45
50
No. of sites 224 285 29
Average utility billAverage carbon emissions
Aver
age
carb
on e
mis
sion
s tC
O2/
yr
Aver
age
utili
ty b
ill £
k/yr
Figure 21 Breakdown of recommendation type for each level of service provided
0
100
200
300
400
500
600
Personalcontact
Data andadvice
Dataonly
Reco
mm
enda
tion
s m
ade Investment
ProcessInformation
0
50
100
150
200
250
300
350
Personal contact
Data and advice
Dataonly
0
5
10
15
20
25
30
35
No. of sites 95 111 332
Average utility bill Average carbon emissions
Aver
age
carb
on e
mis
sion
s, t
CO2/
yr
Aver
age
utili
ty b
ill £
k/yr
Figure 20 Site characteristics by metering service type

The Carbon Trust22
Thissectionsummarisesthekeyresultsfromthefieldtrialfor consumption, cost and carbon savings. It analyses these savings by utility, sector, previous experience and level of service provided.
Throughoutthissection,whereaveragesarequoted,thefigureshavebeencalculatedusingthearithmeticmean.This approach is used to prevent the results at sites with higher energy consumption and saving levels from skewing the overall results.
4.1 Headline results
Overall carbon savings
Figure 22 shows that across all sites in the advanced metering trial an average of over �2% carbon savings wereidentifiedandover5%carbonsavingssuccessfullyimplemented within the time frame of the trial. These overallfiguresincludethecarbonsavingsacrosselectricity,gas and water utilities. They also take into account all of the sites in the trial, including those where no energy savingactionswereidentifiedorimplemented.
Thesefindingsareimportantinthattheyhighlightthesignificantcarbonsavingswhichcanpotentiallybeunlockedin the SME community. By way of comparison, OFGEM has assumed that the potential level of energy savings from advanced metering in the domestic market is �%�3, while Sustainability First assumes savings in the range of �-3%�4.
Carbon savings by utility
Figure 23 shows the breakdown of savings by utility. The proportion of carbon savings achieved for gas and electricity are similar at just under 5%. Carbon savings from wateraremoresignificantinpercentageterms,withanaverage of over �2% savings achieved.
Theproportionofidentifiedsavingswhichwereimplementedsuccessfully is higher for gas than electricity. Although a significantlyhigherlevelofcarbonsavingswereidentifiedforelectricity,sitesfounditmoredifficulttoimplementthese.This is likely to be due to the variety of recommendations. For example, electricity savings tend to be achieved via behavioural or process changes across a wide range of differentequipmentandsystems,andthroughanumberofcontrol points. By contrast gas saving measures tend to be implemented via simpler centralised behaviour or process changes, such as to temperature and timing settings.
Figure 24 shows the average absolute carbon savings by site. The absolute carbon savings associated with water are very low relative to those for gas and electricity. This is due to the relatively low levels of energy used for pumping and treatment of water.
4Resultsandfindings
�3 ‘Domestic Metering Innovation’, OFGEM consultation document, � February 2006.�4 ‘Smart Meters: Commercial, Policy and Regulatory Drivers’, Sustainability First, March 2006.
0
2
4
6
8
10
12
14
ImplementedIdentified
Carb
on s
avin
gs %
12.3%
5.1%
Figure 23 Average annual % carbon savings by utility for all sites in the trial
0
5
10
15
20
25
30
ElectricityGasWater
Carb
on s
avin
gs %
IdentifiedImplemented
25.1%
12.2% 12.1%
4.7%7.2%
4.3%
Figure 22 Average annual % carbon savings identified and implemented across all sites
Figure 24 Average annual absolute carbon (tCO2) savings by utility
0
5
10
15
20
ElectricityGasWater
IdentifiedImplemented
Carb
on s
avin
gs t
CO2
0.3 0.1
9.0
5.7
13.8
5.8

23Advanced metering for SMEs
Consumption and cost savings
Figure 25 shows that on average sites in the trial saved around 375 m3 of water, �3,500 kWh of electricity and 30,000 kWhofgasperyearfromadvancedmetering.Thisequates to average annual savings of £�,070 and 8.5 tCO2 per site.
Despite the fact that Figure 23 indicated that carbon savings from electricity (calculated at 0.43kgCO2/kWh) were slightly higher in percentage terms than savings from gas (calculated at 0.�9kgCO2/kWh), it can be seen that the absolute levels of savings from gas are higher than for electricity due to the large volume consumed.
Figure26showstheaveragecostsavingsidentifiedandimplemented per year for each utility. On average, sites in the trial saved around £800 on their water bills, £870 on their electricity bills and £405 on their gas bills per year�5. Thefinancialsavingsachievedweredirectlyrelatedtolevelsof energy consumption, with high consuming sectors seeing thegreatestfinancialsavings.
These charts also highlight that although average kWh consumption savings are higher for gas than electricity, the average cost savings are higher for electricity due to relative utility prices.
4.2 Breakdown of savings
Savings by sector
Figure 27 shows the variation in percentage carbon savings identifiedandimplementedforeachsector.Thevariationin energy savings between different sectors is very significantinsomecases.
The Manufacturing sector implemented the largest average carbon savings (8.5%), followed by Education (7.2%) and Financialandbusinessservices(6.8%).Mostsectorsidentifiedat least �0% in potential carbon savings, suggesting that thereisscopeforSMEstomakesignificantprogressonenergy management given the right incentives. The healthcare sector only managed to implement savings of 2%, less than afifthofthesavingsidentified.Thisresultmeritsfurtherresearch but there may be higher resistance to change in this sector, or longer approval cycles for process-based or investment-based actions.
02468
10121416
Educ
atio
n
Who
lesa
le a
ndre
tail
trad
e
Oth
er s
ecto
rs
Man
ufac
turi
ng
Fina
ncia
l and
busi
ness
ser
vice
s
Hea
lth
and
soci
al w
ork
Gov
ernm
ent
Com
mun
ity,
soc
ial &
pe
rson
al a
ctiv
itie
s
Carb
on s
avin
gs %
IdentifiedImplemented
Figure 27 Average annual carbon savings by sector
�5 The underlying utility prices for this analysis were based on baseline 2005 prices of 6.5p/kWh (electricity), �.8p/kWh (gas) and £2.7/m3 (water). However, where sites have special tariffs these were used.
Figure 25 Average consumption savings by utility
0
100
200
300
400
500
600
700
800
0
10,000
20,000
30,000
40,000
50,000
60,000
70,000
80,000
ElectricityGasWater
Ener
gy s
avin
gs k
Wh
Wat
er s
avin
gs m
3
IdentifiedImplemented
Figure 26 Average annual cost savings by utility
0
500
1,000
1,500
2,000
2,500
GasWater
Cost
sav
ings
£/y
r
IdentifiedImplemented
Electricity

The Carbon Trust24
Savings by type of site
Thefieldtrialconsistedofamixtureofsingle-siteSMEs and SME-like sites which were part of larger multi-site groups, but behaved independently. Figure 28 shows thedifferencesinlevelsofcarbonsavingsidentifiedandimplemented for single sites and multi sites. On average thesavingsidentifiedwerearound4%higherandthesavings implemented about �% higher for multi sites than for single sites.
Discussions with the sites, the delivery consortia and energy suppliers have also concluded that a collection of similar sites can undertake an energy saving programme more effectively. The collective effort expended on identifying and implementing energy savings yields greater success than at individual sites since they are able to share best practice and transfer energy saving recommendations between sites.
0
2
4
6
8
10
12
14
16
Single siteMulti site
Carb
on s
avin
gs %
IdentifiedImplemented
Figure 28 Comparing average % carbon savings for single-site and multi-site SMEs
0
3
6
9
12
15
Prior experienceNo experience
Carb
on s
avin
gs %
IdentifiedImplemented
Figure 29 Average % carbon savings by level of experience
Savings by level of experience
Figure 29 highlights that sites with no prior energy saving experience made greater savings than sites with some prior experience of energy saving programmes. This probably reflectsthefactthatmanyofthe‘quickwin’savingshadalready been realised for sites with previous experience and thatthemeasuresnowidentifiedgenerallyrequiredmoreefforttoimplement.ThisisconfirmedbyFigure30whichshowsthatmoreinformation-basedsavingswereidentifiedatsites with no prior experience of energy saving programmes. More process-based and investment-based measures were identifiedatthemoreexperiencedsites.
0
10
20
30
40
50
60
70
80
InvestmentProcessInformation
No experiencePrior experience
% T
otal
rec
omm
enda
tion
s
Figure 30 Breakdown of energy saving recommendation types by level of experience
Savings by service type
Figure 3� considers savings by service type. The way in which energy saving advice was delivered to SMEs resulted in marked differences in the savings achieved. The Data Only service, where customers are simply provided with remote online access to their energy usage data, led to the lowest levels of savings. However, even here �0% energy savings wereidentifiedand3%implementedonaverage.Thesearesignificantsavings,especiallyasthisserviceisconsiderablyless resource-intensive for the service provider to deliver.
Most notably, the Data and Advice service, where energy saving advice is provided remotely via email, lead to the highest levels of energy savings, with an average of �5% savingsidentifiedand7.5%successfullyimplemented. These savings are higher than those achieved for the Personal Contact service, with advice provided directly via site visits and telephone calls, where an average of �2.5% savingswereidentifiedand5%implementedsuccessfully.

25Advanced metering for SMEs
0
5
10
15
20
Personal contactData and adviceData only
Carb
on s
avin
gs %
IdentifiedImplemented
Figure 31 Average % carbon savings by service type
Thisisasignificantfindingandthereappearstobetwo key potential reasons behind this. Firstly, when service companies provide advice via site visits and telephone calls, it is generally highly customised and there is a tendency to focus on high added value recommendations. These are likely to lead to more complex process-based changes or more expensive investment-based actions. There is also less focus on providing generic energy saving recommendations, such as simple information-based or process-based changes. However, it seems that many SMEs, and especially those withlimitedpriorexperienceofenergysaving,canbenefitfromthesequickwinactions.
Secondly, energy saving advice which arrives via email is readily available and more likely to be looked at and acted upon directly than more conventional energy audit reports. This is especially true when the email contains simple, intuitive graphical information, such as daily consumption profiles.Also,theemailformatallowstheinformationtobeeasily forwarded on to staff within the organisation to take the relevant actions, for example operations or facilities management personnel.
Anotherkeyimplicationofthisfindingisthepossibility ofprovidingadvancedmeteringservicesatsignificantlylower costs in the future. The email service model is highly scalable and it would appear feasible that automated systemscouldbeusedtoanalyseSMEenergyusageprofiles,identify appropriate recommendations and automatically email these to the customer, with supporting graphical evidence. Such an automated service, backed up with call-centresupport,wouldallowforasignificantlylower-costservice model than one involving on-site or telephone-based analysis and discussion as standard.
In summary, simply providing half-hourly data to an SME allowsthesitetoidentifyandimplementsignificantenergysavings. However, to maximise the energy savings some form ofadditionaladviceserviceisrequired.Thisimpliesthatthesiteeitherdoesnothavesufficientexpertisetousethedataonitsownorlackssufficienttimetoanalyseandactonitappropriately. The trial results suggest that using email as
0
2
4
6
8
10
All sitesSites where at least one
recommendationwas actioned
Carb
on s
avin
gs %
Figure 32 Impact of site ‘buy-in’ on average carbon savings
a mechanism for providing this additional service leads to the best results and this opens up the potential for highly cost-effective metering services to be provided on a widespread basis in the future.
Level of site buy-in
Where sites had energy saving recommendations made but failed to implement these, the reasons for ‘failure’ were captured as lessons learnt case studies. These are discussed further in Section �0. One of the most common reasons was a lack of buy-in from the site. Typically such sites reported resource constraints or considered reviewing energy consumption to be a low priority activity.
The average savings discussed previously in this report focused on averages across all non-Code 5 sites in the trial, including those which made no use of their advanced meter data. This information is useful in that it gives the most accurate representation of what might happen if there was to be a widespread roll-out of advanced metering across the SME community.
However, it is also of interest to understand the potential energy savings where a site is willing to commit at least a minimum amount of effort to using advanced metering information. The chart below shows the level of average savings achieved by sites which actively made use of the advanced metering data.
Figure 32 shows that for sites where at least one energy saving recommendation was implemented the previously quotedaveragecarbonsavingof5.1%risesto8.6%.
Thesefindingsindicatethatasignificantincreaseinsavingscan be achieved where sites have a level of buy-in to using the advanced meter.

The Carbon Trust26
5.3 UK–wide implicationsOverall carbon savings
Based on the assumptions set out above the total carbon emissions from UK SMEs which don’t currently have any form of advanced metering are estimated to be 53.6 MtCO2 a year.
The trial results indicate that a roll-out of advanced electricity and gas meters across the entire UK SME population could identify annual savings of 5.� MtCO2 and make annual savings of 2.5 MtCO2.
5.1 IntroductionThissectionanalysesthefindingsfromthefieldtrialinthecontext of the UK SME community. The trial results are scaled up to estimate the potential national impact of advanced metering across the UK and to identify the potential UK carbon savings available.
As highlighted in the previous section, the carbon savings associatedwithwaterarelow.Consequentlythissectionfocuses on electricity and gas consumption when considering the carbon saving potential at the UK level.
5.2 Basis for scale-up analysisThe scale-up analysis aims to identify potential carbon savings for the group of UK SMEs which don’t currently use advanced metering. Site savings have been scaled up to estimate UK savings for gas and electricity. The appropriate total size of current UK utility use and carbon emissions has beenidentifiedbasedonrecentconsumptiondataforsitesusing non-half-hourly meters in the UK.
The carbon savings have been scaled up on a per sector basis to estimate the UK carbon savings by sector. This assumes that the results in trial sample were broadly representative of sector-based trends at the UK level.
The split of carbon savings between single sites and multi sitesinthefieldtrialhasbeenfoundtobewellalignedwiththeequivalentbreakdowninemissionsfromUKSMEsas a whole. Nationally, an estimated 59% of non-domestic non-Code 5 metered carbon emissions are from multi-site organisations.Inthetrial,65%ofidentifiedcarbonsavingswerefromtheequivalentpopulation.
Breakdown of UK SME meters by utility
Forgasmetersthefieldtrialfindingshavebeenscaledtothose that would be seen across the user base of SMEs that don’tcurrentlyhaveintervalmetering.Thisequatestoaround 4�8,000 meter points. According to National Grid, the total gas consumption across these users is around �53 TWh peryear,whichequatestocarbonemissionsof29.1MtCO2.
Similarly,forelectricitymetersthetrialfindingshave been scaled to those that would be seen across the user base of SMEs that are currently below the Code 5 mandatorythresholdforhalf-hourlymetering,equatingtoaround 2.3 million meter points. According to ELEXON, the total electricity consumption across these users is around 57 TWh per year or annual carbon emissions of 24.5 MtCO2.
The total energy consumption through SME gas and electricity meters is estimated to be worth £6.5 billion per year.
5 Scale-up of results to UK level
�6 In England and Wales non-large users are about 59% of non-domestic water consumption. While segregated data for commercial and domestic is not readily available for Scotland, the same proportions have been used to estimate the consumption of water in Scotland by non-large user from the total non-domestic consumption.
Water savings
Since the carbon savings associated with water usage are low, the bulk of this report focuses on the potential benefitsofadvancedmeteringintermsofreducingemissions from electricity and gas consumption. However,itisworthnotingthattheidentifiedannualwatersavingsareverysignificantandconsequentlythese have been scaled up as follows. For water meters thetrialfindingsareassumedtobescalabletothosethat would be seen for the user base of SMEs currently classifiedas‘non-large’users(iethosecustomersconsuming less than 50,000 m3). The data for water consumption in 2004/05 suggests that non-large users consume 9�5 m3 per year�6.
Infact,thevolumeofpotentialUKsavingsidentifiedis60% greater than the size of the proposed new Thames Water reservoir (whose cost, at 2006, is estimated at £1billion)andnearlyfivetimestheoutputoftheproposedThamesWaterdesalinationplant.Thefinancialsavingsassociated with water are also considerable, and help build the business case for the customer.
UK SME consumption and cost data Total consumption 9�5 m3 Assumed unit cost £2.7/m3
Total UK SME market £2.5 billionSource: OFWAT, Carbon Trust
Field trial findings and potential UK savings Savingsidentified 25.1% Savings implemented �2.2%
Costsavingsidentified £620million Cost savings implemented £300 million

27Advanced metering for SMEs
�7 DTI http://www.dtistats.net/energystats/dukes5_2.xls �8 ONS http://www.statistics.gov.uk/downloads/theme_commerce/PA�003_2006/UK_Business_2006_Optimized.pdf �9 http://www.sbs.gov.uk/sbsgov/action/layer?topicId=70000��759 20 NERA, restricted circulation.
Table 6 Summary of UK SME data and field trial findings by utility
Utility UK SME consumption and cost data Field trial findings
Total consumption
Carbon emissions (MtCO2)
Assumed unit cost
Total UK SME costs (£bn)
Savings identified (%)
Savings implemented (%)
Electricity 57 TWh 24.5 6.5p/kWh 3.7 �2.�% 4.7%
Gas �53 TWh 29.� �.8p/kWh 2.8 7.2% 4.3%
Utility Potential UK SME carbon savings (MtCO2) Potential UK SME cost savings (£bn)
Identified Implemented Identified Implemented
Electricity 3.00 �.20 0.45 0.�7
Gas 2.�0 �.30 0.20 0.�2
Totals: 5.10 2.50 0.65 0.29
Table 7 Summary of the potential UK-wide SME carbon and cost savings based on scaling up the results of the field trial
Carbon savings by sector
In order to calculate the breakdown of potential carbon savings by sector an approach has been used which draws together data from DTI�7 (for total fuel usage by sector), theOfficeofNationalStatistics(ONS)�8, the Small Business Service (SBS)�9 (using headcount data to estimate the usage amongst large users and SMEs), NERA20 (estimates of half-hourly electricity usage by sector) and the Carbon Trust (which sectors are likely to have interval vs. non-interval meters).
Giventhedifficultyindrawingtogetherseveraldifferent data sets these results are included to provide an illustrative breakdown of where the savings can be achieved, rather than to estimate total potential carbon savings. It therefore serves to highlight the relative magnitude of carbon savings available in individual SME sectors.
Figure 33 combines the sector-based breakdown in national emissions and the carbon savings from the trial to give an indicationoftheidentifiedcarbonsavingsbysector.Thisshows that the largest carbon savings are mainly concentrated in two sectors, Wholesale and retail trade, and Manufacturing, whichtogetheraccountfor60%ofidentifiedsavings.
Other sectors* 21%
Health and social work 1%
Government 2% Community, social and personal 3%
Education 5%
Financial and business services 8%
Manufacturing 25%Wholesale and retail trade 35%
Figure 33 Breakdown of potential UK carbon savings by SME sector
* Other sectors consists of various sectors which had small sample sizes, including transport and agriculture.
These are very material carbon and consumption savings with asignificantassociatedfinancialbenefit.Infinancialterms,thisisequivalenttosavingsof£650millionperyearidentifiedand£300 million per year implemented.
Table 6 summarises the consumption and cost data for UK SMEs andthefieldtrialfindingsintermsofsavingsidentifiedandimplemented. Table 7 summarises the potential UK-wide SME carbon and cost savings based on scaling up the results of the fieldtrial.IntermsofvaluetotheUK,thecarbonsavingsthatcanpotentiallybeidentifiedareequivalenttoover2%ofallemissions from UK businesses.
Source: DTI, ONS and Carbon Trust
Source: DTI, ONS and Carbon Trust
The Carbon Trust28
6.1 OverviewThis section provides details regarding both the current and future costs of advanced metering technology and service provision, plus an associated set of underlying assumptions. Thiscostinformationisusedinsubsequentsections asthebasisforperformingseparatecost/benefitanalysesfrom the perspectives of the site owners, energy suppliers and the UK as a whole.
An assessment has been made of the average costs incurred by the participating sites, including the installation and use of the meters, and the technical and advisory support offered by the metering service providers. These estimates have been combined with the average savings in the trial in order to estimate the likely payback periods for the advanced metering services provided.
6.2 Cost componentsThe cost of providing advanced metering solutions to a site depends not only on the nature of the services supplied but also on the current metering installations present at the site.
For sites without interval metering systems in place, the initial set-up costs will include the cost of the meter or logger and the costs for associated ancillary items including loggers, communication systems and appropriate software. There will also be a charge associated with the actual installation of the meter(s), although this may be included within the cost of the ‘service offering’ provided by the metering company.
Costsformetersandtelemetryequipmentaregenerallyspread over a number of years. Software licence costs will typically be paid on an annual subscription basis.
Following installation of one or more meters, the costs to the customer vary depending on the level of service provided to the site by the metering service company. These costs are largely made up of data provision and thetimeforofferingutilityefficiencyadvice.
There are also operational costs, including staff time spent implementingthesavingsidentifiedfromthemeterdata.However,asignificantproportionofsavingscanprobably be carried out by staff as part of their normal activities without incurring additional costs. Investment-based savings measureswillrequirefurthercapitalexpenditureaswell as management time.
Itshouldbenotedthatthecost/benefitanalysispresentedin this report does not take into account any potential increases in Balancing and Settlement Code charges due to handling actual data (as opposed to estimated data) for billing purposes. This is consistent with the fact that thesavingsinthefieldtrialwereachievedwithoutthehalf-hourly data being used to generate accurate bills.
6 Advanced metering costs
6.3 Current costsTo build an accurate picture of the current costs for equipmentandservices,thedeliveryconsortiainvolvedinthefieldtrialwereaskedtoprovide‘currentmarketvalue’quotesfortheservicestheyprovided.Thesequoteswerethen market tested with other key players in the industry and adjusted where applicable, to create a set of ‘average’ costs to use as the basis for analysis.
Thecost/benefitanalysispresentedinthisreporthasnottaken into account the costs of any capital investments made inresponsetospecificrecommendationsfromthehalf-hourlydata. This was due to a lack of availability of reliable data for the costs associated with the capital-intensive measures implemented. For consistency, the analysis also therefore excludesthebenefitsassociatedwithinvestment-basedsavings. The costs also exclude any indirect costs potentially incurred by sites such as staff and management time.
Meter and installation costs
Thecurrentcostsformetersandassociatedequipment varyconsiderably.Thekeyfactorsthatinfluencethis arethelevelofpre-existingequipmentonthesiteand the local environment where the meter is to be installed. The unit price also depends on whether a single meter is installed, or whether multiple meters are installed at one site or multiple sites within the same parent company.
Basedonavarietyofquotesfromthemeterandserviceproviders in the trial, the current average total installed cost of an advanced meter is estimated to be £56�. This includes provision for an initial site survey to establish technicalrequirements,estimatedat£218,plusthecostofthemeteritselfandassociatedcommunicationsequipment,estimated at £343. The costs of data logging and telemetry links are affected by factors such as the proximity of pre-existing telephone lines or the availability of a mobile telephone network signal.
Thefiguresquotedaboveincludetypicalcommunicationcosts experienced by the sites in the trial. Metering and telemetry costs can both be annualised and are spread over a period of three years which is a typical contract term for these services.

29Advanced metering for SMEs
Service and support costs
The cost of metering consultancy services provided to SMEs depends on how much external support a site or group of sites is willing to fund. This, in turn, will depend on what the company perceives as its needs and on how much internal resource effort can be dedicated to this work. Fromtheevidenceofthefieldtrialitisgenerallyadvisablefor SMEs with no prior experience of advanced metering to have external expert support in the selection and installation of meters and initial interpretation of half-hourly data.
As described previously, the sites in the trial were exposed to three different levels of service, which are referred to as ‘Data Only’, ‘Data and Advice’ and ‘Personal Contact’. Basedonavarietyofquotesfromtheserviceprovidersinvolved in the trial three separate average current costs have been calculated for these different levels of service. These costs currently range from £242 per year for ‘Data Only’ through to £936 per year for ‘Personal Contact’.
It has also been necessary to differentiate service cost levels between single sites and multi-site organisations, basedonseparatequotesreceivedfromserviceproviders. Multi-site organisations are those with six or more discrete sites.Organisationswithmorethansixsitestypicallybenefitfrom economies of scale both from purchasing volume and, in the case of the ‘Data and Advice’ and ‘Personal Contact’ servicetypes,benefitfromtheuseofbenchmarksandrecommendations mirrored across a number of similar sites.
6.4 Future costsThecurrentcostsreflectthecurrentembryonicstateof the market with low penetration in the SME community and a limited number of market propositions tailored for this segment.
However, experience from growth of other early stage technology and service markets suggests that there is significantpotentialforreductionsinbothcapitalandservice costs as the market develops. This will be because of economies of scale as well as service innovations due to increasing levels of competition and larger players entering the market. A future cost scenario has therefore been based on a more developed market for advanced metering for SMEs in the UK.
It is predicted that by 20�2 this situation could be realistically achieved. Giving the market a clear signal and time frame will greatly help development and market innovation in thisfield.
Meter and installation costs
Meterandinstallationcostsareexpectedtodropsignificantlywith volume. Using estimates from Sustainability First2� as guidance, and including some provision for site surveys at scale, it is projected that advanced meter costs could fall to £�64 installed (at 2006 prices).
Service and support costs
In a similar manner, service costs have the potential to fall rapidly as the market matures and levels of competition and innovation increase. In particular, costs for the information–driven services such as the ‘Data Only’ and ‘Data and Advice’ are expected to drop dramatically at greater scale through increased use of IT systems automation and advances in analytical software packages for metering.
In future it is expected that service providers will be able to use automated systems to analyse SME energy usage profiles,identifyappropriategenericandsemi-customisedrecommendations and automatically email these to the customer, with supporting graphical evidence. Discussions with IT consultancies have indicated that costs of such services could fall as low as £70/year for a fully automated advice service and £20/year for supplying data only. This is in line with the current cost of similar services deployed at scale in other industries, such as personal credit rating services.
2� ‘Smart Meters: Commercial, Policy and Regulatory Drivers’, Sustainability First, March 2006.

The Carbon Trust30
6.6 Utility pricesThe other key set of assumptions underlying the cost benefitanalysisinthisreportrelatestoutilityprices. Inordertoassessthelikelybenefitsofadvancedmetering,utilitypriceshavebeenselectedthatreflectreasonableexpectations of future prices.
The DTI publishes long-term energy price scenarios. Historicalenduserpriceshavebeenusedwhichreflectlikely conservative longer-term prices expectations. The period from 2003 to 2006 has seen steadily rising energy prices from relatively low to relatively high prices. 2005 is representative of typical conditions in the DTI central high scenario, and therefore these prices have been selected as a base case for the analysis and are thought to provide a realistic long-term energy price expectation.
For electricity prices it is also necessary to distinguish between single sites, whose prices were close to domestic electricity tariffs, and multi sites, whose prices were closest to higher consuming industrial tariffs.
Water prices are subject to variation by region as well as to overall price control, although suppliers control individual price tariffs. The 2003 prices recorded in the trial data were generally around £2.7/m3, which is consistent with the business water rates for 2006 published by Wessex Water. Table 9 summarises the utility prices.
Utility Users Price (2005)
Gas All users �.8p/kWh
Electricity Multi sites 5.6p/kWh
Electricity Single sites 6.5p/kWh
Water All users £2.70 m3
Table 9 Summary of utility prices used for analysis
Component Costing scenario
Meter costs Current (£) Future scenario (£)
Site survey 2�8 44
Meter (inc. installation)
343 �20
Total 56� �64
Service costs Current single/
multi sites (£/year)
Future scenario (£/year)
Data Only 242/�20 20
Data and Advice 522/�76 70
Personal Contact 936/507 N/A
Source: Meter service providers, Sustainability First, Edengene, Carbon Trust, PAA
Table 8 Summary of current and future meter and service costs used as the basis for cost/benefit analysis
6.5 Summary of costsThe overall costs to a site for metering services used in this analysis are summarised in Table 8 below.
In summary, the current costs represent typical costs to a site in the current market, based upon the service offerings provided during the trial. The future costs represent estimates of costs once the market for SME orientated advanced metering services has matured as part of a widespread roll-out.
The future cost of the ‘Personal Contact’ service is not estimated as it is expected that such a service model will never be cost-effective for widespread use in a future advanced metering market for SMEs, due to the high commitmentofman-hoursrequired.Itisthereforeassumedthat service providers will in future use ‘Data Only’ or automated ‘Data and Advice’ service propositions to provide cost-effective services.
Source: DTI, Wessex Water

3�Advanced metering for SMEs
7.1 IntroductionThissectionperformsacost/benefitanalysisfromtheperspective of the SME customer, balancing the costs ofmeteringequipmentandserviceprovisionagainstthebenefitsintermsofconsumptionandcostsavings.The aim of this is to determine to what extent an attractive business case exists for SMEs to adopt advanced metering under both current and future cost scenarios.
7.2 MethodologyAdvancedmeteringisanenergyefficiencyinvestment.Experience from the Carbon Trust and elsewhere indicates thatthemainfinancialinvestmentcriterionforenergyefficiencyinvestmentsforSMEsisthepaybacktime,althoughmanyfactorsotherthanfinancialreturnplayapartininvestmentdecisions.Consequently,thesite-levelcost/benefitanalysisinvolvesstudyingthepaybackperiodsfor the three different utilities and the range of sectors involved in the trial.
In addition to capturing the total carbon savings which were identified(average12.3%)andimplemented(average5.1%) at each site, the project also recorded the anticipated savings (average 6.6%) based on predictions of which recommendations will be implemented in the following year, and those in the longer term (6.9%).
The method used to calculate paybacks for the site-based cost/benefitanalysisisillustratedinFigure34andusedthefollowing assumptions:
At year 0, a site invests in an advanced meter incurring both the capital cost and the installation cost
In years �, 2 and 3 the site pays for the service that was provided during the trial (either Data Only, Data and Advice or Personal Contact)
In year � the site gains the actual utility savings implemented in the trial
In year 2 the site gains the predicted savings for the year as reported in the trial
In year 3 the site gains the predicted long-term savings as reported in the trial
In year 4 onwards, the site pays for the Data Only service and maintains the savings at the level of year 3.
7Site–basedcost/benefitanalysis
In practice ongoing savings will be a trade-off between thelevelofnewsavingsidentifiedandimplemented each year and the level of persistence of previously implemented savings, which in general will decline over time. The approach outlined above assumes that these factors balance out and that paying for an ongoing service simply serves to maintain the previously implemented savings. This assumption is intuitive rather than supported byanyfirmdata.Infactakeyareaforpotentialfurtherstudy is a longitudinal analysis of the effect of advanced metering on savings persistence factors.
However, to a certain extent this assumption is not material to the business case as, based on Carbon Trust experience, it is unlikely that a payback time of greater than four years willactasasufficientincentiveforinvestment.
The calculated payback time is the point at which the cumulativebenefitsaregreaterthanthecumulativecosts.
This method is also somewhat conservative in that the capital cost of the meter is applied in total in year 0. In reality, the meter cost is likely to be spread over the life of the meter plus a service contract of, say, three years, thus bringing forward the payback time. As illustrated above the lifetime of the meter asset is assumed to be �5 years in line with assumptions generally used by meter providers.
Incalculatingthebenefitsfromtheperspectiveofthe site, no value was placed on reduced carbon emissions as, at present, there is no mechanism by which SME sites can realise carbon value. In line with the core analysis in this report, the sites with existing half-hourly electricity meters (Code5sites)havebeenexcludedfromthecost/benefitanalysis. For the future cost scenarios it has also been assumedthatsupplierbenefits(suchassavingsthroughremote meter readings, and distributed network operator fee savings) will be passed through to sites through lower energy prices. This is a relatively minor effect from the point of view of the sites, averaging about £�0 per meter per year.
Benefits
Realisedsavings
Projectedsavings
Projected long-term savings
Metercosts
Service costs
Data only
Years 1-3 Years 4-15
Figure 34 Approach used to model payback periods

The Carbon Trust32
Future cost scenario
Figure 36 shows the payback periods for each of the utilities using the same energy prices but now based on the future cost assumptions.
This shows that the investment case for advanced metering is likely to be attractive for both multi and single sites in the future. In order to model this scenario, it has been assumed that the ‘Data and Advice’ service has been adopted by all sites since this service has the potential to be automated and delivered as a low-cost proposition in a mature SME metering market.Consequentlyonlysiteswhichreceivedthislevel ofserviceinthefieldtrialareincludedintheanalysis.
For multi sites paybacks are extremely attractive, at around six months for gas and less than two months for electricity and water. Unlike for the current cost scenario the paybacks for single sites also appear attractive at around three months for electricity. However, the sample sizes for the water and gas sites are low and potentially unreliable, so the results are not shown22.
7.3 ResultsThesite-levelcost/benefitanalysispresentstheimplicationsfor single-site and multi-site SMEs separately.
Current cost scenario
Figure 35 shows the payback periods for each of the utilities based on the current cost assumptions and using 2005 energy prices.
It shows that under these assumptions the investment case appears attractive for multi sites, with paybacks of about two years for gas, about one year for electricity and under six months for water. These paybacks are expected to meet most SMEs investment criteria, especially given the ongoing cost savings likely once the payback period has been reached.
The picture for single-site SMEs under the current cost scenarioislessattractive,withsignificantlylongerpaybackperiodsofaboutfouryearsforgasandgreaterthanfiveyears for electricity and water.
0 54321
Wat
er
Payback (years)
Elec
tric
ity
Gas
Multi siteSingle site
129
23
415
138
93
19
Source: Carbon Trust, PAA
Figure 35 Payback periods for SME sites based on current costs
0 54321
Wat
er
Payback (years)
Elec
tric
ity
Gas
Multi siteSingle siteN/A — sample size too small
N/A
N/A
Source: Carbon Trust, PAA
Figure 36 Payback periods for SME sites based on future costs
22 The ‘future costs’ scenario assumes use of the ‘Data and Advice’ service by all sites. The analysis is therefore limited to sites in the trial which used this service.

33Advanced metering for SMEs
Paybacks by sector
Thecost/benefitanalysishasbeenextendedtoestimatepaybacks by sector for the future cost scenario. Here the focusisonelectricitymeters,becausethereisinsufficientdata from gas and water meters in the trial once spread over all sectors. Again it is assumed that all sites adopt the ‘Data and Advice’ service, and results from single and multi sites have been combined to achieve reasonable sample sizes.
Figure 37 shows that all the sectors have payback times below �3 months. The best returns are generated in the high-consuming sectors such as manufacturing.
Figure 37 Payback by sector for future costs (electricity only)
Other sectors
Community, social and personal
Government
Wholesale and retail trade
Education
Financial and business services
Manufacturing
Payback (months)20 4 6 8 10 12 14
Summary
Based on current meter and service costs, there is already a strong business case for using advanced metering at multi-site SMEs, such as retail and wholesale chains, and for energy-intensive SME sectors, such as manufacturing. However, for single-site SMEs and SMEs with lower energy consumption the case is less attractive; although they will save money over the lifetime of the meter, the costs are currently prohibitive when considered in terms of acceptable payback periods. Modelling expected future meter and service costs indicates that in the future, a clear business case will also exist for single-site SMEs and users withlowerconsumptionlevels.Thisscenariorequiresthecosts of metering services to be driven down by increased innovation and automation.
NOTE: Health and social work omitted due to low sample size.
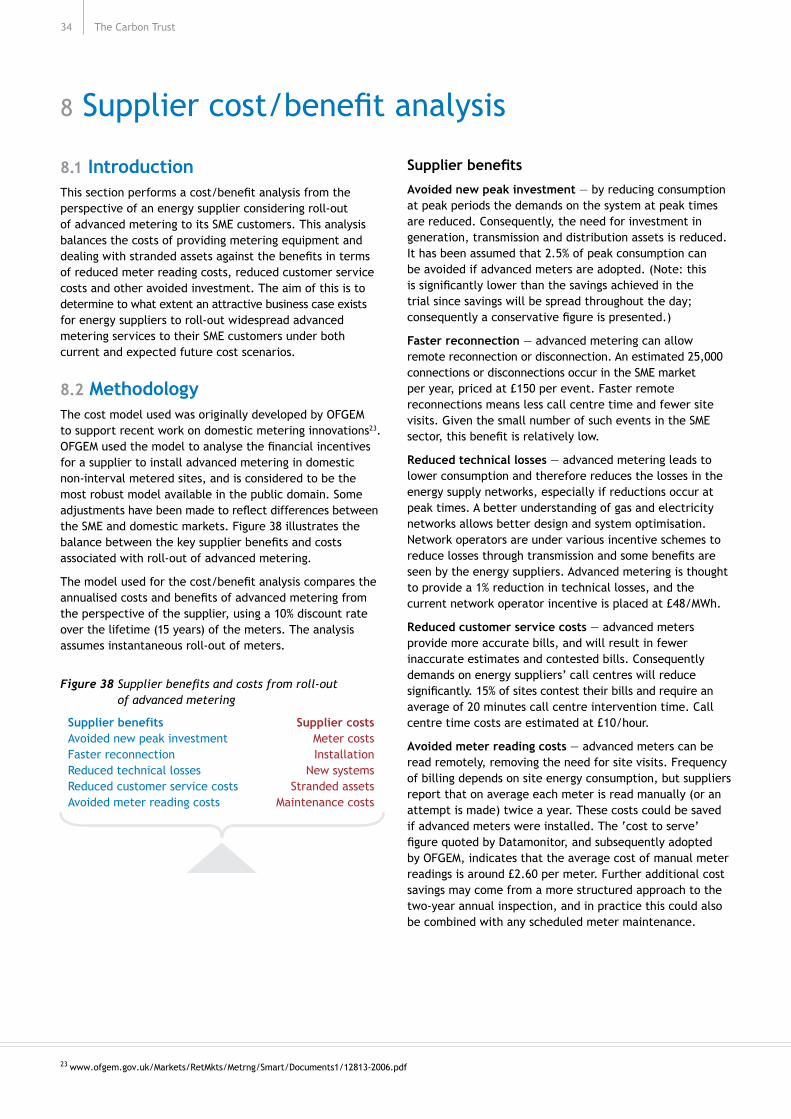
The Carbon Trust34
8.1 IntroductionThissectionperformsacost/benefitanalysisfromtheperspective of an energy supplier considering roll-out of advanced metering to its SME customers. This analysis balancesthecostsofprovidingmeteringequipmentanddealingwithstrandedassetsagainstthebenefitsinterms of reduced meter reading costs, reduced customer service costs and other avoided investment. The aim of this is to determine to what extent an attractive business case exists for energy suppliers to roll-out widespread advanced metering services to their SME customers under both current and expected future cost scenarios.
8.2 MethodologyThe cost model used was originally developed by OFGEM to support recent work on domestic metering innovations23. OFGEMusedthemodeltoanalysethefinancialincentivesfor a supplier to install advanced metering in domestic non-interval metered sites, and is considered to be the most robust model available in the public domain. Some adjustmentshavebeenmadetoreflectdifferencesbetweenthe SME and domestic markets. Figure 38 illustrates the balancebetweenthekeysupplierbenefitsandcostsassociated with roll-out of advanced metering.
Themodelusedforthecost/benefitanalysiscomparestheannualisedcostsandbenefitsofadvancedmeteringfromthe perspective of the supplier, using a �0% discount rate over the lifetime (�5 years) of the meters. The analysis assumes instantaneous roll-out of meters.
8Suppliercost/benefitanalysis
Supplier benefits
Avoided new peak investment — by reducing consumption at peak periods the demands on the system at peak times arereduced.Consequently,theneedforinvestmentingeneration, transmission and distribution assets is reduced. It has been assumed that 2.5% of peak consumption can be avoided if advanced meters are adopted. (Note: this issignificantlylowerthanthesavingsachievedinthe trial since savings will be spread throughout the day; consequentlyaconservativefigureispresented.)
Faster reconnection — advanced metering can allow remote reconnection or disconnection. An estimated 25,000 connections or disconnections occur in the SME market per year, priced at £�50 per event. Faster remote reconnections means less call centre time and fewer site visits. Given the small number of such events in the SME sector,thisbenefitisrelativelylow.
Reduced technical losses — advanced metering leads to lower consumption and therefore reduces the losses in the energy supply networks, especially if reductions occur at peak times. A better understanding of gas and electricity networks allows better design and system optimisation. Network operators are under various incentive schemes to reducelossesthroughtransmissionandsomebenefitsareseen by the energy suppliers. Advanced metering is thought to provide a �% reduction in technical losses, and the current network operator incentive is placed at £48/MWh.
Reduced customer service costs — advanced meters provide more accurate bills, and will result in fewer inaccurateestimatesandcontestedbills.Consequentlydemands on energy suppliers’ call centres will reduce significantly.15%ofsitescontesttheirbillsandrequireanaverage of 20 minutes call centre intervention time. Call centre time costs are estimated at £�0/hour.
Avoided meter reading costs — advanced meters can be readremotely,removingtheneedforsitevisits.Frequency of billing depends on site energy consumption, but suppliers report that on average each meter is read manually (or an attempt is made) twice a year. These costs could be saved if advanced meters were installed. The ‘cost to serve’ figurequotedbyDatamonitor,andsubsequentlyadopted by OFGEM, indicates that the average cost of manual meter readings is around £2.60 per meter. Further additional cost savings may come from a more structured approach to the two-year annual inspection, and in practice this could also be combined with any scheduled meter maintenance.
Supplier benefitsAvoided new peak investmentFaster reconnectionReduced technical lossesReduced customer service costsAvoided meter reading costs
Supplier costsMeter costsInstallation
New systemsStranded assets
Maintenance costs
Figure 38 Supplier benefits and costs from roll-out of advanced metering
23 www.ofgem.gov.uk/Markets/RetMkts/Metrng/Smart/Documents�/�28�3-2006.pdf

35Advanced metering for SMEs
24 OFGEM Domestic Metering Innovation 2006.
Supplier costs
Meter costs — capital costs of new advanced meters based on market rates. It is assumed that costs are spread over a three year contract, not the life of the meter.
Installation — cost of having meters installed on-site (as detailed in Section 6.5).
New systems — new infrastructure and data processing systemsarerequiredtohandledatafromadvancedmeters.These have been calculated at £20 per meter for the suppliers’systemsover15years.Thesefiguresarebased on work previously carried out by OFGEM24.
Stranded assets — the cost of replacing meters ahead of the end of their useful life has been taken into account. Prices for stranding have been derived from the price control review from the 200� network operators. This places electricity meters at £�5 and gas at £�7.
Maintenance costs — advanced meters will potentially requiremoremaintenancethanstandardmeters.Forthepurposes of this analysis maintenance costs have been taken as 3.5% of meter costs. This includes one battery replacement for gas meters over their �5-year lifetime.
8.3 ResultsAsforthesite-levelanalysisthesuppliercost/benefitanalysislooksseparatelyatthecostsandbenefitsunderbothcurrentcost and future cost scenarios.
Current cost scenario
Figure 39 shows the magnitude of the various costs and benefitsforsuppliersbasedonthecurrentcostassumptionsand assumes that suppliers provide advanced metering to the entire SME market.
For both electricity and gas the costs substantially outweigh thebenefitsindicatingthatthereisnofinancialincentivefor suppliers to initiate a widespread roll-out of advanced metering to the SME community. The crucial cost elements are the meter and installation costs, which clearly outweigh thebenefits,thelargestofwhicharetheavoidedmeterreadings and, for gas, the avoided peak investment.
0
20
40
60
80
100
Costs Benefits Costs Benefits
Avoided new peak investment
Faster reconnection
Reduced technical losses
Reduced customer service costs
Avoided meter reading costs
Maintenance costs
Stranded assets
New systems
Installation
Meter costs
Electricity Gas
1 1
2 23 355
12345 10
9
87
6
6
7
8 910
6
7
8 910
Figure 39 Supplier benefits and costs for widespread roll- out of advanced gas and electricity metering to the SME community, using current costs
Annualised additional benefits/costs£
per
met
er p
er y
r

The Carbon Trust36
Future cost scenario
Figure 40 shows the magnitude of the various costs and benefitsforsuppliersbasedonthefuturecostassumptions.Again, it assumes that suppliers provide advanced metering to the entire SME market.
Using the future costs scenario improves the business casefromthepointofviewofsuppliers,butthefinancialincentives for a widespread roll-out of advanced metering to SMEs are still limited. For electricity, the costs still outweighthebenefitsandforgasthecaseismarginal.
Supplier business model innovation
Inadditiontothebenefitsincludedinthemodel,itisrecognised that energy suppliers may also have strategic reasons for moving to the provision of advanced metering services for SMEs. These might include:
Enhanced customer retention
The ability to attract new customers from other suppliers
The ability to sell higher margin energy consultancy services.
Thesebenefitshavenotbeenconsideredintheanalysissincetheyarevariableanddifficulttoquantifyacrossallsuppliers.
The analysis in this section suggests that a widespread roll-out of advanced metering to SMEs is unlikely to be initiated by suppliers for all customers, given the potential costs and risks in terms of stranded assets and uncertainty regarding the regulatory environment. The medium-term outlook indicates that suppliers are only likely to target metering services at those SME customers at the high consumption end of the market, since smaller consumers represent a poor return on investment.
Thesitelevelcost/benefitanalysispresentedearlierprovidesa good indication of those SME sectors and types of sites which would be the best potential customers for advanced metering services from the suppliers’ point of view.
Summary
From the perspective of energy suppliers, the current costs of providing advanced metering services to all SME users significantlyoutweighthepotentialbenefits.Furthermore,even as costs come down, in future the business case appears to remain marginal. There is likely to be a good business case for providing metering services to certain limited sections of the SME community, such as SME-like multi-site companies (eg retail chains). However, the overall case is hampered by the large number of single-site SMEs, mainly due to the high cost to serve associated with these sites due to their disparate nature.
0
5
10
15
20
25
30
Costs Benefits Costs Benefits Electricity Gas
6
7
8
9
10
6
7
8
9
10
1
23 35
1
2
5
Avoided new peak investment
Faster reconnection
Reduced technical losses
Reduced customer service costs
Avoided meter reading costs
Maintenance costs
Stranded assets
New systems
Installation
Meter costs12
345 10
9
876
Annualised additional benefits/costs£
per
met
er p
er y
r
Figure 40 Supplier benefits and costs for widespread roll- out of advanced gas and electricity metering to the SME community, using future meter costs
Thereissomepotentialforsupplierstobenefitfurtherthrough altering their business models to realise new opportunities.However,thetrialfindingshighlight asignificantbarriertothewideruptakeofadvancedmeteringduetotheinsufficientfinancialincentivesforenergy suppliers to provide these services on a widespread basis. Furthermore, it is unlikely that simply targeting the sectors which are currently cost-effective will yield a largeenoughmarkettomakethebusinesscasesufficientlyattractive from the suppliers’ perspective. If the SME advanced metering market is left to grow organically it is likely to develop in a fragmented way, with slow growth and limited economies of scale being achieved.
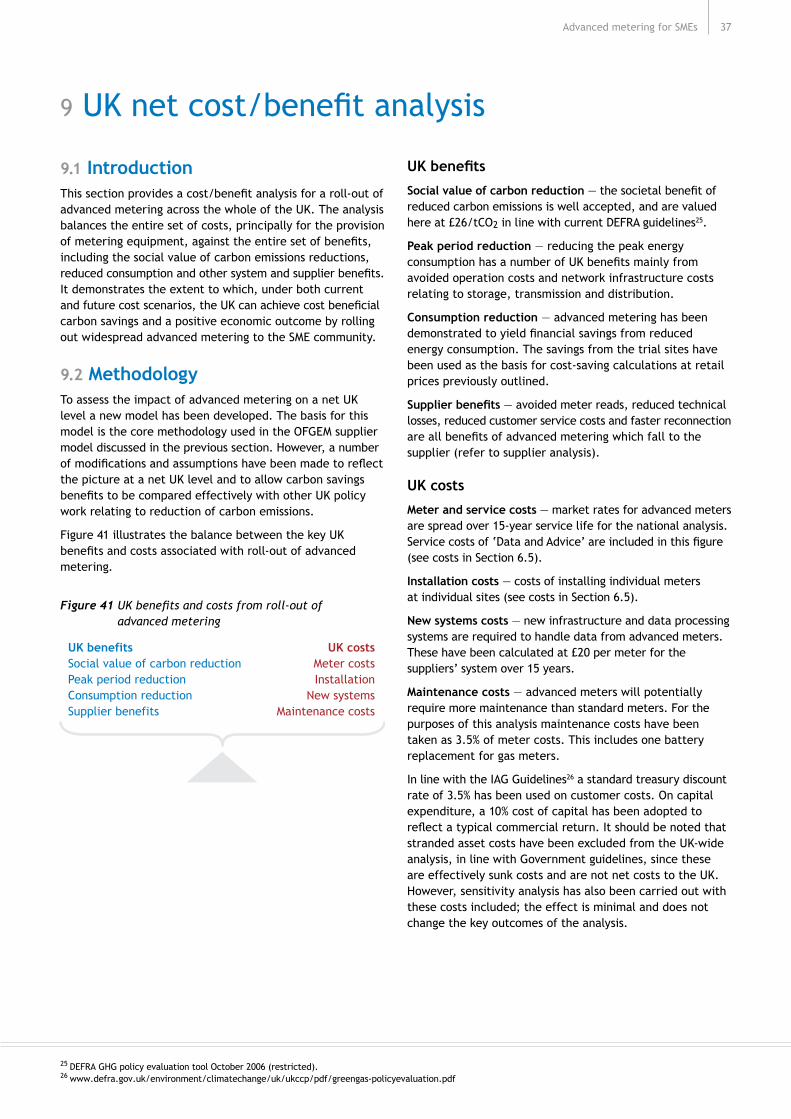
37Advanced metering for SMEs
9.1 IntroductionThissectionprovidesacost/benefitanalysisforaroll-outofadvanced metering across the whole of the UK. The analysis balances the entire set of costs, principally for the provision ofmeteringequipment,againsttheentiresetofbenefits,including the social value of carbon emissions reductions, reducedconsumptionandothersystemandsupplierbenefits.It demonstrates the extent to which, under both current andfuturecostscenarios,theUKcanachievecostbeneficialcarbon savings and a positive economic outcome by rolling out widespread advanced metering to the SME community.
9.2 MethodologyTo assess the impact of advanced metering on a net UK level a new model has been developed. The basis for this model is the core methodology used in the OFGEM supplier model discussed in the previous section. However, a number ofmodificationsandassumptionshavebeenmadetoreflectthe picture at a net UK level and to allow carbon savings benefitstobecomparedeffectivelywithotherUKpolicywork relating to reduction of carbon emissions.
Figure 4� illustrates the balance between the key UK benefitsandcostsassociatedwithroll-outofadvancedmetering.
9UKnetcost/benefitanalysis
UK benefits
Social value of carbon reduction—thesocietalbenefitofreduced carbon emissions is well accepted, and are valued here at £26/tCO2 in line with current DEFRA guidelines25.
Peak period reduction — reducing the peak energy consumptionhasanumberofUKbenefitsmainlyfromavoided operation costs and network infrastructure costs relating to storage, transmission and distribution.
Consumption reduction — advanced metering has been demonstratedtoyieldfinancialsavingsfromreducedenergy consumption. The savings from the trial sites have been used as the basis for cost-saving calculations at retail prices previously outlined.
Supplier benefits — avoided meter reads, reduced technical losses, reduced customer service costs and faster reconnection areallbenefitsofadvancedmeteringwhichfalltothesupplier (refer to supplier analysis).
UK costs
Meter and service costs — market rates for advanced meters are spread over �5-year service life for the national analysis. Servicecostsof‘DataandAdvice’areincludedinthisfigure(see costs in Section 6.5).
Installation costs — costs of installing individual meters at individual sites (see costs in Section 6.5).
New systems costs — new infrastructure and data processing systemsarerequiredtohandledatafromadvancedmeters.These have been calculated at £20 per meter for the suppliers’ system over �5 years.
Maintenance costs — advanced meters will potentially requiremoremaintenancethanstandardmeters.Forthepurposes of this analysis maintenance costs have been taken as 3.5% of meter costs. This includes one battery replacement for gas meters.
In line with the IAG Guidelines26 a standard treasury discount rate of 3.5% has been used on customer costs. On capital expenditure, a �0% cost of capital has been adopted to reflectatypicalcommercialreturn.Itshouldbenotedthatstranded asset costs have been excluded from the UK-wide analysis, in line with Government guidelines, since these are effectively sunk costs and are not net costs to the UK. However, sensitivity analysis has also been carried out with these costs included; the effect is minimal and does not change the key outcomes of the analysis.
UK benefitsSocial value of carbon reductionPeak period reductionConsumption reductionSupplier benefits
UK costsMeter costsInstallation
New systemsMaintenance costs
Figure 41 UK benefits and costs from roll-out of advanced metering
25 DEFRA GHG policy evaluation tool October 2006 (restricted). 26 www.defra.gov.uk/environment/climatechange/uk/ukccp/pdf/greengas-policyevaluation.pdf

The Carbon Trust38
9.3 ResultsTheUKcost/benefitlooksseparatelyatthecostsandbenefitsunderbothcurrentcostandfuturecostscenarios.As previously, it is assumed that ‘Data and Advice’ is used as the service model for all customers. The major cost is the provision of services to make best use of the meter data whilethemajorbenefitsarereducedconsumptionandthesocial value of emission reductions.
Current cost scenario
Figure42showsthenetUKbenefitsorcostsofrollingoutadvanced electricity metering to the SME community, brokendownby‘profileclass’groupsandbasedoncurrentcosts. At current meter and service costs there is a net UK benefitofaround£600permeterfromprovidingadvancedmeteringtocustomersinprofileclasses7and8,thehighestvolumeconsumers,andabenefitofaround£240permeterforSMEsinprofileclasses5and6.Usagethroughthesemeters is about 20 TWh/year, almost one third of all the electricity usage in the group of SMEs that don’t currently have interval-based meters for electricity. This represents an annual reduction of carbon emissions of about 0.40 MtCO2 based on savings levels implemented in the trial. However, fortheotherSMEcustomersinprofileclasses3and4implementing advanced metering would represent a net cost to the UK of £��0 per meter.
-200
0
200
400
600
800
9.0TWh0.18 MtCO2
10.4TWh0.21 MtCO2
37.3TWh0.76 MtCO2
Consumption: 57 TWh/yr Potential savings: 1.2 MtCO2/yr
Net
ben
efit
(£/
met
er/y
ear)
PC 3&
4
PC 5&
6
PC 7&
8
Summary
Profileclass: 3 & 4 5 & 6 7 & 8
Total annual consumption (TWh)
37.3 9.0 �0.4
Total annual emissions (MtCO2)
0.76 0.�8 0.2�
NetUKbenefitor cost (£/meter/year)
-£��0 £240 £620
Cost of carbon (£/tCO2) £3�8 No cost No cost
Figure 42 UK cost/benefit by electricity profile class using current costs
Figure43belowshowsthenetUKbenefitsorcostofrollingout advanced gas metering to the SME community, broken down by consumption level and based on current costs.
Atcurrentmeterandservicecoststhereisasignificant netUKbenefitfromprovidingadvancedmeteringtogascustomers in all but the lowest consumption band (up to 732 MWh per year). Usage through these meters is 94 TWh/year, or about 60% of all the gas usage in the group of SMEs that don’t currently have interval-based meters for gas. This represents a reduction of carbon emissions of about 0.8 MtCO2 based on savings levels implemented in the trial. For the lower consumption SME customers implementing advanced metering would represent a net cost to the UK of around £7 per meter.
-5000
0
5000
10,000
15,000
20,000Consumption: 153 TWh/yr Potential savings: 1.3 MtCO2/yr
73–7
32 M
Wh
60TWh0.49 MtCO2
29 TWh0.24 MtCO2
24 TWh0.2 MtCO2
41 TWh0.33 MtCO2
>586
0 MW
h
2196
–586
0 MW
h
732–
2196
MW
hN
et b
enef
it (
£/m
eter
/yea
r)
Summary
Profileclass: 73-732 MWh
732– 2�96 MWh
2�96– 5860 MWh
>5860 MWh
Total annual consumption (TWh)
60 29 24 4�
Total annual emissions (MtCO2)
0.49 0.24 0.20 0.33
NetUKbenefitor cost (£/meter/year)
-£7 £�,225 £3,944 £�7,870
Cost of carbon (£/tCO2) £5 No cost No cost No cost
Figure 43 UK cost/benefit by gas consumption band using current costs

39Advanced metering for SMEs
Future cost scenario
Figure44showsfuturecostbenefitanalysisforelectricityand indicates that advanced metering will be cost-effective forallprofileclasses.Thepotentialcarbonsavingsfromelectricity are �.2 MtCO2.
Figure 45 shows the effect of applying the future cost scenario to gas advanced metering. It can be seen that advanced metering is cost-effective for customers in all consumption bands. Potential carbon savings come to �.3 MtCO2.
0
200
400
600
800
1000
10.4 TWh0.21 MtCO2
37.3 TWh0.76 MtCO2
Consumption: 57 TWh/yr Potential savings: 1.2 MtCO2
9.0 TWh0.18 MtCO2N
et b
enef
it (
£/m
eter
/yea
r)
PC 3&
4
PC 5&
6
PC 7&
8
10.4 TWh0.21 MtCO2
37.3 TWh0.76 MtCO2
Consumption: 57 TWh/yr Potential savings: 1.2 MtCO2
9.0 TWh0.18 MtCO2N
et b
enef
it (
£/m
eter
/yea
r)
PC 3&
4
PC 5&
6
PC 7&
8
Figure 44 UK cost/benefit by electricity profile class using future costs
Summary
From the overall UK perspective, widespread adoption of advanced metering in the SME community represents asignificantopportunityforachievingcost-effectivecarbonsavingsaswellaseconomicbenefitfortheUK.Wehavealreadyseenthatscalinguptheresultsofthefieldtrialtothe UK level for gas and electricity indicates that a total of 5.� MtCO2savingscouldbeidentifiedand2.5MtCO2 savings could be implemented per annum. The analysis in this section indicatesthatasignificantproportionofthesecarbonsavings can be achieved at no net overall cost to the UK.
Based on current costs annual carbon savings of nearly �.2 MtCO2canbeimplementedatanetbenefittotheUK, bytargetingelectricityusersinprofileclasses5–8and gas users with annual consumption above 732 MWh. Using future cost assumptions the full potential annual carbon savings of 2.5 MtCO2canbeimplementedatanetbenefitto the UK, by targeting all SME electricity and gas users.
Inlightofthesignificantpotentialcost-effectivecarbonsavingsandtheeconomicbenefittotheUK,butalsothelimited incentive for suppliers to provide advanced metering services to the market as a whole, there is a clear case to take action to ensure the widespread roll-out of advanced meters for SMEs. A widespread roll-out of advanced metering would also catalyse an energy consultancy market and put in place an infrastructure of meters capable of supporting further policies to reduce carbon emissions in future.
Section �� looks in more detail at the potential policy implicationsfromthesefindings.
Figure 45 UK cost/benefit by gas consumption band using future costs
0
5000
10,000
15,000
20,000Consumption: 153 TWh/yr Potential savings: 1.3 MtCO2/yr
73–7
32 M
Wh
60TWh0.49 MtCO2
29 TWh0.24 MtCO2
24 TWh0.2 MtCO2
41 TWh0.33 MtCO2
>586
0 MW
h
2196
–586
0 MW
h
732–
2196
MW
h
Net
ben
efit
(£/
met
er/y
ear)
0
5000
10,000
15,000
20,000Consumption: 153 TWh/yr Potential savings: 1.3 MtCO2/yr
73–7
32 M
Wh
60TWh0.49 MtCO2
29 TWh0.24 MtCO2
24 TWh0.2 MtCO2
41 TWh0.33 MtCO2
>586
0 MW
h
2196
–586
0 MW
h
732–
2196
MW
h
Net
ben
efit
(£/
met
er/y
ear)

The Carbon Trust40
10.1 IntroductionThe Carbon Trust has worked with advanced metering suppliers to install a large number of advanced metering systems at SME sites throughout the UK. This has enabled the Carbon Trust to gain valuable insights into the key issues which currently impede uptake of this technology. This section reviews the reasons why sites were unable to implement one or more of energy saving recommendations identified.Italsolooksatvariousotherpracticalbarriershighlighted by the trial, and discusses some of the well recognised market barriers which exist.
10.2 Reasons for lack of implementationEnergysavingsactionswereidentifiedat504ofthe 538 SME core sites in the trial. Sites typically had 2-3 recommendations and a total of 384 recommendations were made and not implemented.
Figure 46 shows a breakdown of the reasons why savings weren’t actioned. These were captured through lessons learnt case studies, where sites provided feedback on why identifiedenergysavingscouldnotbeimplemented.Thereasons for not implementing energy saving actions are broken down into the following categories:
Unconvincing case — the recommendation was rejected or needed more research to demonstrate the feasibility orpotentialbenefits.
Lack of time/low priority — the recommendation couldn’t be implemented within the timescales of the trial, generally due to other business activities taking priority. Typically sites did not ‘run out’ of recommendations.
Lack of resource — the recommendation was accepted as worthdoing,buttherewasinsufficientpersonnelorfundingat the site.
Other—typicallythemeterorcommunicationsequipmentfailed or it was found that no saving was possible after further investigation.
�0 Barriers to adoption
This analysis shows that the main reason for failure was due to a lack of time or low priority to implement the changesrequired:thisaccountsfor43%ofrecommendationswhich were not implemented. However, many sites claimed that such recommendations would have been implemented in future but were not possible within the timescales of the trial. Nevertheless, the inevitable competing pressures on SMEs suggest that a certain degree of buy-in is important in order to realise the full potential of advanced metering.
The delivery consortia reported that in some cases sites also failed to identify or implement energy saving recommendations due to a lack of willingness to engage with using the meter effectively. In such cases site owners or managers were often preoccupied or unconvinced of thebenefitsofusingadvancedmetering.
Changes of personnel also resulted in loss of site engagement. This was only evident in sectors where a high turnover of staff is common such as wholesale and retail. Increased awarenessofthepotentialbenefitswerefoundtohelpmotivate personnel at sites to make better use of advanced metering services.
20% of recommendations were considered to be unconvincing, meaning that either the recommendation was unsuitable (because it was provided remotely without direct knowledge of the business), or because it was thought that it would not yield the anticipated level of savings. For a further 32% of recommendations the sites would have been willing to implementbuttheyhadinsufficientresourcestocarrythisout,eitherintermsofmanpowerorfinancialresources.
Unconvincing case (78)
Lack of resource (121)
Lack of time/low priority (165)
Other (20)
43%
32%
20%
5%
Figure 46 Reasons for not implementing identified energy savings

4�Advanced metering for SMEs
10.3 Technical and practical barriers identifiedInadditiontothereasonsidentifiedforpotentialenergysavingsnotbeingimplemented,thetrialalsoidentified a number of technical and practical barriers to the use of advanced metering.
Installation issues
Therewerevariousdifficultiesreportedincoordinatingmeter replacement activities. At sites where the most appropriate course of action was to replace the existing meter,significantdelayswereoftenexperiencedingettingthe energy supplier and meter asset owner to cooperate with the installation of the replacement meter. Furthermore, the often necessary interruption to the power supply was often inconvenient for the site.
Clip-on style meter reading devices did not face these issues. However, some energy suppliers and data collectors were reportedlyapprehensiveaboutthesedevicesbeingfittedtoexistingfiscalmetersandasmallnumberofsitesreportedoperational problems. In practice, suppliers are often not notifiedthatclip-onmetershavebeeninstalledsincetheyhave no impact on normal operation. There is a need to clarify standard procedures and codes of practice in relation to clip-on devices.
Commercial interoperability
For the purposes of the trial all sites continued with their existing data collection services and received energy and bills from their energy supplier in the same way as before the trial. In theory, it would have been possible for those sites with metering services being provided by accredited data collectors to send data to the suppliers for accurate billing. However, in practice this was found to be hard to achieve owing to the fact that energy suppliers often have preferred data collectors and can be reluctant to accept data from other collectors.
Use of preferred data collectors is common practice since suppliersrequiredatatobeprovidedinastandardisedformatwhich can be readily aggregated for billing purposes. In the absence of industry-wide standards on the format and timing of such data in the non-half-hourly market, suppliers prefer toworkwithspecificcollectorsratherthanhavetodealwith a variety of different data formats. Furthermore, where suppliers do accept data from independent metering service providers, via an accredited data collector, they are still often reluctant to reimburse the customer for the fact that data is no longer being provided by their standard data collector.
The lack of transparent charging for metering services is another key barrier. Customers incur charges for various metering services, including meter asset provision, meter operation, data collection, aggregation, safety inspections and settlement charges. However, most customers have consolidated supply contracts and relative costs can be hard toidentify.Equally,itisunclearexactlywhichchargeswillchange or disappear if the customer chooses to upgrade to an advanced meter. This lack of transparency prevents customersfrommakinginformedcost-benefitdecisionsandcan lead to actual or perceived double charging for some meter services. This situation would be greatly improved if definitionsofchargetypesanddetailsofchargelevelswerepublished within utility bills.
Furthermore, experience from the Code 5 sites in the trial (where advanced meters were already in place) has highlighted that even when half-hourly data exists, there is a sometimes reluctance by suppliers to make this freely available in a timely fashion to customers.
Communications
Most technology-related issues in the trial concerned communicationequipmentasopposedtothemetersthemselves. The most common problem was when communicationsequipmentwentoutofservice,resulting in missing periods of data. Sometimes communications technology was chosen without knowledge of the site and was then found to be unsuitable. The industry now recognises that no single communications protocol is appropriate for all sites. GPRS, SMS and landline communication systems are all used to good effect. While communications issues were experienced in the initial stages of the trial, this is not now a major issue as practices and technology have further developed.
Inlightoftheaboveitisnotnecessarytodefinespecificcommunications protocols in terms of the different technologiesbeingused.Ratherthereisarequirement fordataprotocolswhichdefinethenatureandfrequency of data to be transferred, to allow integration between metering systems, data collectors and data aggregators.
The Carbon Trust42
10.4 Established market problems
Stranded assets
Theriskofstrandedassetsisasignificantbarriertosuppliersrolling out advanced metering in the UK. It applies to both the existing meter stock and any new meters which are installed. By replacing an existing meter with an advanced meter before the end of its useful life the value inherent in the old meter is lost since it is unlikely to be re-used at a different site. Asset owners are also hesitant to offer advanced meters into the non-half-hourly market due to the risk of installing high value, high functionality meters which will be redundant, or not be exploited fully, should a customer change supplier. If the new supplier will not use the full functionality of the meter, it is unlikely that a full market value for the meter can be derived by the asset owner from the supplier.
This risk means that the cost of using more advanced meters is currently high to those suppliers who are interested in rolling out advanced metering services. In the electricity market this problem can be alleviated to some extent through longer supply contracts. However, in the gas market suitable contract lengths are less feasible since terms of supply are currently very variable and typically short term.
In order to reduce the risk to the meter owners, and thus the cost to the suppliers, it is essential that all advanced meters adhere to basic minimum functionality standards. This would ensure that any advanced meter could support the associated advanced metering services of another energy supplier, therefore allowing the asset owner to transfer the use of an existing advanced meter to a new energy supplier.
A small risk still remains from a site potentially downgrading back to a standard meter, but this risk will diminish as themarketrealisesthebenefitsofadvancedmeteringandmore utility suppliers offer these services.
OFGEM acknowledges that a lack of standards exacerbates the stranded asset issue. In 2006 OFGEM set up a working group to address the issues of meter interoperability for both domestic and commercial gas and electricity metering. This activity is widely supported by the metering industry and,oncecomplete,willimprovemarketconfidenceforthekey industry players. However, it is vital that standards are agreed as soon as practicable in order to facilitate the growth of advanced metering.
Balancing and settlement issues
Balancing and settlement code (BSC) rules in the non-half-hourly electricity market can present a further problem. Settlement between generator and supplier under BSC rules within the non-half-hourly market is based on estimated profiledata.Thereforethereispotentialfordiscrepancybetween the supplier’s liability to generators and income due from the customer. It is likely that the BSC rules and systems will need updating to handle half-hourly data in the large volume advanced metering that the SME community would generate,sothesupplierandcustomercanbothbenefit.However, if the half-hourly settlement process is extended, balancing and settlement charges will need to be reduced, or an alternative process be created, to take account for the lower energy bills which exist in the SME sector.

43Advanced metering for SMEs
11.1 IntroductionThisreporthashighlightedthesignificantenergyand cost-savingbenefitsofadvancedmeteringforSMEsand the associated cost-effective UK carbon savings which could be achieved from roll-out to the SME sector. The trial has also highlighted a number of barriers to the uptake of advanced metering, some of which are already recognised within the industry.
Mostnotably,therearesignificantbarrierstosuppliersproviding advanced metering services. This is in part due to stranded asset concerns and lack of agreed meter standards. However,thetrialfindingssuggestthatevenifthesebarriers were to be addressed, it is still likely there would beinsufficientfinancialincentivesforsupplierstoroll-outthe technology on a widespread basis.
In light of the above, some level of compulsion must be considered to assist the move towards a mass market adoption of this technology and addresses the barriers which exist onaUKlevel.Thissectionthereforeidentifiesarangeofmeasures which the Government should consider adopting to further promote the uptake of advanced metering.
11.2 Actions to assist uptake
Mandation of new and replacement meters
The simplest regulatory change regarding adoption of advanced metering would be for the Government to mandate the installation of advanced metering for all new meters, and whenever an existing meter comes to the end of its useful life.
Sucharequirement,appliedtoallgasandelectricityconsumption bands, would result in an estimated 584,000 electricity meters and �05,000 gas meters being rolled out by 20�2, assuming a 5% churn rate. This could lead to annual carbon savings of around 0.60 MtCO2 being achieved per year by 20�2.
Itisquestionablewhetherthisvolumeofmeterswouldbesufficienttomakesignificantimpactonone-offmetercosts,butitwouldcertainlycontributesignificantlytowards
�� Policy implications
lowering service costs provided by energy consultancies, which currently form the major element of the previous cost/benefitanalysis.
In relation to this measure Government should safeguard against suppliers passing on the full cost of new and replacement advanced meters to smaller consumers. Therearereducedcoststoservebenefitstosuppliers,particularly with the higher consuming sites and the strong market signal this measure would bring will allow new higher value services to be developed from the supply side. Assetownersbenefitfromreducedstrandedassetliabilitiesthough greater clarity around the future of their meter investments. Both these factors will offset costs associated with new and replacement meter roll-out. Any outstanding costs which may originate from smaller consuming sites could be apportioned in the same way as many other infrastructure upgrade programmes in the utility industry. This would mean spreading the costs over the lifetime of the asset and the entire targeted population. The Carbon Trust believe that these measures should avoid any unfair cost burden for smaller SME customers.
Accelerated roll-out of meters
The compulsory installation of advanced metering for new andreplacementmetersisanobviousfirststep,butusingthis approach alone would clearly take many years to replace all of the meter stock. This approach could therefore be extended to set accelerated replacement targets for suppliers to provide advanced meters for those groups of higher consumption customers where there is a clear net benefittotheUKundercurrentcosts.
Such an accelerated roll-out would apply to all gas sites with an annual consumption greater than 732 MWh, and all electricitysitesinprofileclasses5,6,7and8.Combinedwith the previous measure and assuming an accelerated roll-out rate of 20% per year this would replace an estimated 843,000 meters by 20�2, giving carbon savings of around �.5 MtCO2 per year.
Potential policy measure Impact Benefit
1. Mandate that all new and ‘end of life’ replacement meters are advanced meters
Electricity: All SME customer groups
Gas: All SME customer groups
Meters by 20�2:
584,000 electricity
�05,000 gas (Assumes 5% churn)
Addresses all groups with potential to be cost-effective for UK
0.60 MtCO2 savings per year by 20�2

The Carbon Trust44
Potential policy measure Impact Benefit
2. Mandate accelerated roll-out in addition to standard replacement
Electricity:Profileclasses5,6,7&8
Gas: Users above 732 MWh/year
Meters by 20�2:
7�0,000 electricity
�33,000 gas (20% annual roll-out)
Targets groups where meters are currently cost-effective at UK level
�.5 MtCO2 savings per year by 20�2 (for measures � and 2)
Potential policy measure Impact Benefit
3. At 2012 Mandate accelerated roll-out to all remaining users in lowest consumption groups
Electricity:Profileclasses3&4
Gas: 73-732 MWh consumption
Meters by 20�6:
2.3m electricity
4�8,000 gas (20% annual roll-out)
Meter roll-out completed to all cost effective groups
2.5 MtCO2 savings per year by 20�6 (for measures �, 2 and 3)
Collectively, the estimated 843,000 gas and electricity meters are covered by these recommendations, and the proposedrateofdeploymentarethoughttobesufficienttodrive a market for competitive data services for advanced metering which has been seen as a major cost component.
Furthermore, these roll-out suggestions would necessitate action from the major energy suppliers. If a clear timeline for the adoption of advanced metering in the UK can bedefinedinthisway,supplierswouldbeabletoshapeproduct and service offerings appropriately from the outset, targeting these initially at the early adopters with higher consumption levels. In such cases the business case will look attractive both for the site in terms of payback and also for the supplier in terms of the ability to sell associated metering services to the site. As the volume of advanced meters increases through this accelerated roll-out, it will be possible to design optimum products and services. The accelerated roll-out rates will drive economies of scale throughout the advanced metering supply chain, leading to costs reducing towards those presented in the ‘future cost’ scenario.
Full market roll-out
If the above suggestions were to be adopted it is expected that by 20�2 the necessary market conditions would be present to allow advanced metering to be rolled out cost-effectively to the remainder of lower consuming electricity and gas customers, as demonstrated in the future cost scenario. This could be achieved by setting a finaldatebywhichsuppliersmustensurethatallremainingcustomers in these groups have been migrated to advanced metering technology.
A date for full roll-out gives the industry a clear signal and time-frame to optimise meter technology and drive costs down.
Assuming an annual replacement rate of 20% for these lowest consumption bands suggests that full roll-out can be achieved by 20�6. However, a more aggressive date would be preferable in terms of unlocking potential carbon savings as early as possible. In combination with the previously identifiedmeasuresthiscouldleadtothefullsavingspotential of 2.5 MtCO2 per year being realised by 20�6.

45Advanced metering for SMEs
Figure 47 Summary of advanced meter roll-out and carbon saving potential
0
500,000
1,000,000
1,500,000
2,000,000
2,500,000
3,000,000
3,500,000
Tota
l met
ers
rolle
d ou
t
Year
Carb
on s
avin
gs p
er y
ear
MtC
O2
0.0
0.5
1.0
1.5
2.0
2.5
3.0
2008 2009 2010 2011 2012 2013 2014 2015 2016 2017
Meters rolled outAnnual carbon savings
Phase 1 Measure 1: 5% for <732 MWh gas and PC 3-4 elecMeasure 2: 20% for >732 MWh gas and PC 5-8 elec
Phase 2 Measure 3: 20% for all remaining gas and elec meters
Potential policy measure Impact Benefit
4. Domestic metering trials
Include lower electricity usage SME customers(profileclasses3&4)inscopeof DTI/OFGEM metering trials
Identify potential savings using ‘meter only’ type solutions
Potential to take total savings to 2.5 MtCO2 per year before 20�6
For the gas consumers using less than 732 MWh per year, it has been seen that a fairly modest reduction in meter and service costs would make a mass roll-out of advanced meteringcost-effectiveattheUKlevel.Consequently,itislikely that the potential annual carbon savings of 0.49 MtCO2 from this group may be possible earlier than 20�6 due to organic market growth following the proposed accelerated roll-out for higher consumers.
However,forelectricitycustomersinprofileclasses3and4 astep-changecostreductionwouldberequiredtoaccessthe annual savings of 0.75 MtCO2 from these sites earlier than 20�6 at no net cost to the UK.
Moreworkisrequiredtounderstandthenatureofserviceswhich can engage cost-effectively with this group of electricity users in the short term. At this stage it seems unlikely that a detailed service offering would be cost-effective for this group and that to address this segment a ‘meter only’ approach may be the most viable option in the near future.
Since many of these smaller SMEs hold similar attitudes to energy consumption to domestic customers it is recommended that DTI and OFGEM include SME sites with profileclass3and4electricitymetersintheforthcomingtrial of domestic meters to test the effectiveness of low-cost advanced metering solutions.
Figure 47 illustrates the net effect of these three potential policy actions. It shows the impact of the predicted total number of advanced meters rolled out across the UK SME sector and associated annual carbon savings in two phases.

The Carbon Trust46
Summary of potential measures
Table �0 shows a breakdown of the various consumption groups for gas and electricity SME customers and highlights which are cost-effective from the overall UK perspective under both current and future cost scenarios. For each group it then summarises the potential initial policy measuresidentifiedintheprevioussections.
These potential policy measures are indicative only and the detailed regulatory mechanisms for mandating the roll-out of advanced metering have not been examined as part of this analysis. However, it is hoped that Government will use these findingstoshapeappropriatepolicyresponsestocapturethebenefitsfromtheroll-outofadvancedmeteringtoSMEs.
UK cost/benefit Y = Net UK benefit N = Net UK cost
Current costs
Future costs
Potential initial policy measures
Gas 73-732 MWh/year 38�,000 meters N Y Mandate all new/‘end of life’ replacement
meters to be advanced meters
732-2196 MWh/year 26,000 meters Y Y
Mandate all new/‘end of life’ replacement meters to be advanced meters
Mandated accelerated roll-out
2196-5860 MWh/year 7,700 meters Y Y
>5860 MWh/year 3,�00 meters Y Y
Electricity Profile class 3 & 4 2,�69,500 meters
N Y
Mandate all new/‘end of life’ replacement meters to be advanced meters
Investigate further in domestic metering trials
Profile class 5 & 6 9�,700 meters Y Y Mandate all new/‘end of life’ replacement
meters to be advanced meters
Mandated accelerated roll-outProfile class 7 & 8 75,700 meters Y Y
Table 10 Summary of UK cost/benefit analysis and potential policy measures for each consumption group
Alternative delivery options
Themeasuresidentifiedintheprevioussectionsareindicativeand represent one possible set of actions to encourage the roll-out of advanced metering in the UK. In terms of dates, an alternative option would include a ‘big bang’ approach with roll-out of advanced meters to all SME sites by a given date. In terms of policy mechanisms, an alternative to setting targets for meter replacement would be to mandate an increased number of accurate meter readings per year.

47Advanced metering for SMEs
11.3 Supporting and enabling measures
Meter standards
In order to ensure the recommendations in section ��.2 can be implemented effectively there are a number of additionalmeasureswhichmustbeprogressed.Thefirstofthese relates to the need for advanced metering standards to address stranded asset issues and allow meter asset owners to make reliable estimates of the future worth of advanced meters. This is being addressed by the current Interoperability Working Group coordinated by OFGEM. It is essentialthatappropriatestandardsareagreedasquicklyas possible.
Data availability
This study has also highlighted that the level of service provided around the advanced meter data plays a crucial role in the level of energy savings achieved. It is therefore important that competition and innovation exists in this area to continually improve the level of service and drive down costs.
To facilitate this it is vital that half-hourly data is freely available to appointed third parties independently of the energy supply companies. This will allow customers to select the data and consultancy service which is most suitable to their needs. There is therefore a need for industry-wide standardsrelatingtotheformatandpossiblythefrequencyof data transfer between data collectors and suppliers. This will mean that suppliers can accept data from any accredited data provider without needing to change internal systems and processes.
Potential policy measure Impact Benefit
5. Meter standards
Put in place standards for basic minimum functionality ensuring interoperability between half-hourly meters
Essential to support policies mandating roll-out
Avoids concerns over stranded assets
Potential policy measure Impact Benefit
6. Data availability
Mandate that where half-hourly meters are installed data is made available to customers and nominated 3rd parties
Put in place standards relating to theformatandfrequencyofdata transfer between data collectors and suppliers
Ensures usage data is provided in addition to meters
Ensures ease of switching between data providers
Enables market competition and innovation for energy consultancy services
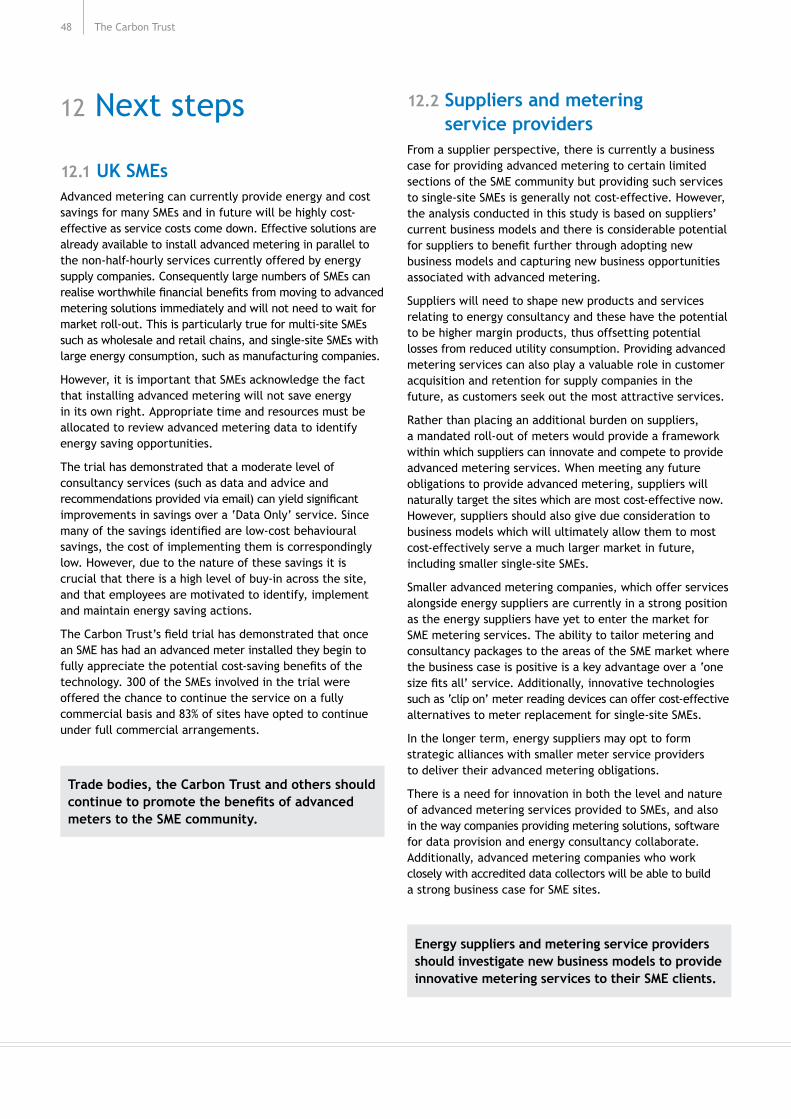
The Carbon Trust48
12.1 UK SMEsAdvanced metering can currently provide energy and cost savings for many SMEs and in future will be highly cost-effective as service costs come down. Effective solutions are already available to install advanced metering in parallel to the non-half-hourly services currently offered by energy supplycompanies.ConsequentlylargenumbersofSMEscanrealiseworthwhilefinancialbenefitsfrommovingtoadvancedmetering solutions immediately and will not need to wait for market roll-out. This is particularly true for multi-site SMEs such as wholesale and retail chains, and single-site SMEs with large energy consumption, such as manufacturing companies.
However, it is important that SMEs acknowledge the fact that installing advanced metering will not save energy in its own right. Appropriate time and resources must be allocated to review advanced metering data to identify energy saving opportunities.
The trial has demonstrated that a moderate level of consultancy services (such as data and advice and recommendationsprovidedviaemail)canyieldsignificantimprovements in savings over a ‘Data Only’ service. Since manyofthesavingsidentifiedarelow-costbehaviouralsavings, the cost of implementing them is correspondingly low. However, due to the nature of these savings it is crucial that there is a high level of buy-in across the site, and that employees are motivated to identify, implement and maintain energy saving actions.
TheCarbonTrust’sfieldtrialhasdemonstratedthatonce an SME has had an advanced meter installed they begin to fullyappreciatethepotentialcost-savingbenefitsofthetechnology. 300 of the SMEs involved in the trial were offered the chance to continue the service on a fully commercial basis and 83% of sites have opted to continue under full commercial arrangements.
�2 Next steps 12.2 Suppliers and metering service providers
From a supplier perspective, there is currently a business case for providing advanced metering to certain limited sections of the SME community but providing such services to single-site SMEs is generally not cost-effective. However, the analysis conducted in this study is based on suppliers’ current business models and there is considerable potential forsupplierstobenefitfurtherthroughadoptingnewbusiness models and capturing new business opportunities associated with advanced metering.
Suppliers will need to shape new products and services relating to energy consultancy and these have the potential to be higher margin products, thus offsetting potential losses from reduced utility consumption. Providing advanced metering services can also play a valuable role in customer acquisitionandretentionforsupplycompaniesinthefuture, as customers seek out the most attractive services.
Rather than placing an additional burden on suppliers, a mandated roll-out of meters would provide a framework within which suppliers can innovate and compete to provide advanced metering services. When meeting any future obligations to provide advanced metering, suppliers will naturally target the sites which are most cost-effective now. However, suppliers should also give due consideration to business models which will ultimately allow them to most cost-effectively serve a much larger market in future, including smaller single-site SMEs.
Smaller advanced metering companies, which offer services alongside energy suppliers are currently in a strong position as the energy suppliers have yet to enter the market for SME metering services. The ability to tailor metering and consultancy packages to the areas of the SME market where the business case is positive is a key advantage over a ‘one sizefitsall’service.Additionally,innovativetechnologiessuch as ‘clip on’ meter reading devices can offer cost-effective alternatives to meter replacement for single-site SMEs.
In the longer term, energy suppliers may opt to form strategic alliances with smaller meter service providers to deliver their advanced metering obligations.
There is a need for innovation in both the level and nature of advanced metering services provided to SMEs, and also in the way companies providing metering solutions, software for data provision and energy consultancy collaborate. Additionally, advanced metering companies who work closely with accredited data collectors will be able to build a strong business case for SME sites.
Trade bodies, the Carbon Trust and others should continue to promote the benefits of advanced meters to the SME community.
Energy suppliers and metering service providers should investigate new business models to provide innovative metering services to their SME clients.

49Advanced metering for SMEs
12.3 GovernmentThisreporthasdemonstratedthattherearesignificantcarbonsavingsandeconomicbenefitsavailablefortheUKthrough widespread roll-out of advanced electricity and gas metering to the SME community, starting with the highest consuming users.
However,modellingthesupplierbenefitcasehasillustratedthatthereisnobenefittosuppliersfromwidespreadroll-outof advanced metering to SMEs at current meter and services cost levels, and the case will remain marginal even for predicted future costs in an established market.
The Carbon Trust recognises that there are some sectors where providing advanced metering services will be seen as attractive to suppliers and predicts that, with time, larger multi-site SMEs will be offered competitive advanced metering services. However, relying on organic market growth in these areas will not bring advanced metering into play in a timely enough fashion to either have a material effect on UK carbon emissions, or realise the necessary economies of scale to provide more cost-effective metering solutions to all sites. Furthermore, leaving the market to groworganicallyalsocarriesasignificantriskofcreatingafragmented and unmanageable advanced metering stock in theUK,makinganyfutureinitiativesdifficulttoimplement.
In light of the above evidence there is a clear case for Government action to stimulate the appropriate market adoption of this technology via some form of mandation. A potential roll-out plan has been proposed which could deliver savings of �.5 MtCO2 per year by 20�2 and 2.5 MtCO2 by2016.Thespecificregulatoryactionsrequiredtoimplementsuchaplanremaintobedefinedindetail,butthe evidence collected by the Carbon Trust suggests that such a compulsory roll-out could be both feasible and cost-effective.
Furthermore,inlightofthesignificantbarrierstoinvestmenton the supply side, such a mandated roll-out is essential to achieving the carbon savings potentially available. In addition a number of necessary supporting actions have been identified,includingtheneedforagreementofstandardsforadvancedmetersandalsoforthefrequencyandformatof data transfer between collectors and suppliers.
Creating an advanced metering infrastructure for all UK SMEs will create a framework capable of supporting further policies to reduce carbon emissions in future. For example, the proposed Energy Performance Commitment, which is likely to be aimed at businesses which already have Code 5 electricity meters, could in future be extended to cover SMEs.
This report has focused largely on the carbon saving potential of advanced metering, but SMEs can also derive significantcostsavingsfromusingadvancedwatermeters.ThereisanassociatedpotentialUKbenefitfromwidespreadroll-out of such water meters in terms of the potential reduction in infrastructure upgrade costs.
Thebenefitsofadvancedmeteringareclearintermsofcostsavings for SMEs and carbon savings for the UK. Action is now requiredtostimulatethemarketandensureawidespreadroll-out of this important technology.
Government should take action to ensure a widespread roll-out of advanced metering technology to SME users.
Government should work to ensure that appropriate standards are put in place regarding advanced meter functionality, data availability and data transfer procedures.

The Carbon Trust50
CA
SE S
TUDY
For businesses with a number of sites, installing half-hourly meters across their portfolio is a significant undertaking. But as organisations such as those below have shown, half-hourly metering at key sites can be used to assess best practice and develop a business case for wider roll-out. Multi-site companies can also benefit from some economies of scale since certain service or consultancy costs can often be spread over a number of similar sites.
Peacock Group
The Peacock Group plc is a leading UK value-for-money fashion retailer. The Group has 450 Peacock stores and 360 Bonmarché stores with over 9,000 employees nationwide. The average electricity bill at each site is around £7,000/year. Electricity bills based on supplier’s actual or estimated readings lack the accuracy needed to identify potential seasonal and out of hours energy wastage. To learn more about the energy consumption in its stores, the Peacock Group selected ten of its sites to install remotely-read half-hourly electricity metering. Analysing the accurate data from the advanced metering system against opening times, revealed out of hours energy use which could becostedandtargetedasenergysavings.Equipmentwas categorised as essential and non essential. Business cases were put forward for the investment in changing the main electricity distribution boards, to enable non essentialequipmenttobeautomaticallyswitchedoffwhen the stores are unoccupied. The initial pilot of advancedmeteringsystemshasrevealedthebenefits
Figure 48 Peacocks half-hourly profile
of installing advanced metering and establishing consumptionprofilesforcomparisonbetweenstores(an example consumption data is shown in Figure 48). The Peacock Group is now developing a benchmarking system as part of an ongoing energy reduction plan for identifying and fostering best practice. On average, each of the �0 stores in the trial saved £500 in controlling out-of-hours energy waste, around 8% of their energy bills. As well as saving money, the individual sites have also reduced their average carbon footprints by 5.5 tCO2 per year.
Cardiff City Council
The council manages approximately 500 buildings, more than 90% of which are not large enough to warrant half-hourly electricity metering as standard. By installing
advancedmeteringatfivetrialsites,thecouncilwereable to identify simple, zero-cost ways to reduce their energy consumption.
For instance, energy audits based on meter data initially focused on lighting across all sites. It was found that there were a number of areas that were unnecessarily lit during operational hours and overnight. Analysis of the data also showed that the two participating schools left their heating in demountable classrooms running overnight. Figure 49 shows the resulting energy savings once this and other measures had been implemented.
Cardiff County Council has seen merit in the use of half-hourly data for energy management and is intending to continue monitoring the trial sites, as well as extending the use of half-hourly meters. On average the council has reduced their energy consumption by 5% resulting in average savings of £500 at each site.
0:30
2:00
3:30
5:00
6:30
8:00
9:30
11:0
0
12:3
0
14:0
0
15:3
0
17:0
0
18:3
0
20:0
0
21:3
0
23:0
0
03/02/200521/04/2005
0
2468
10
1214
1618
kWh
Time
Half-hourly metering for multi-site businesses
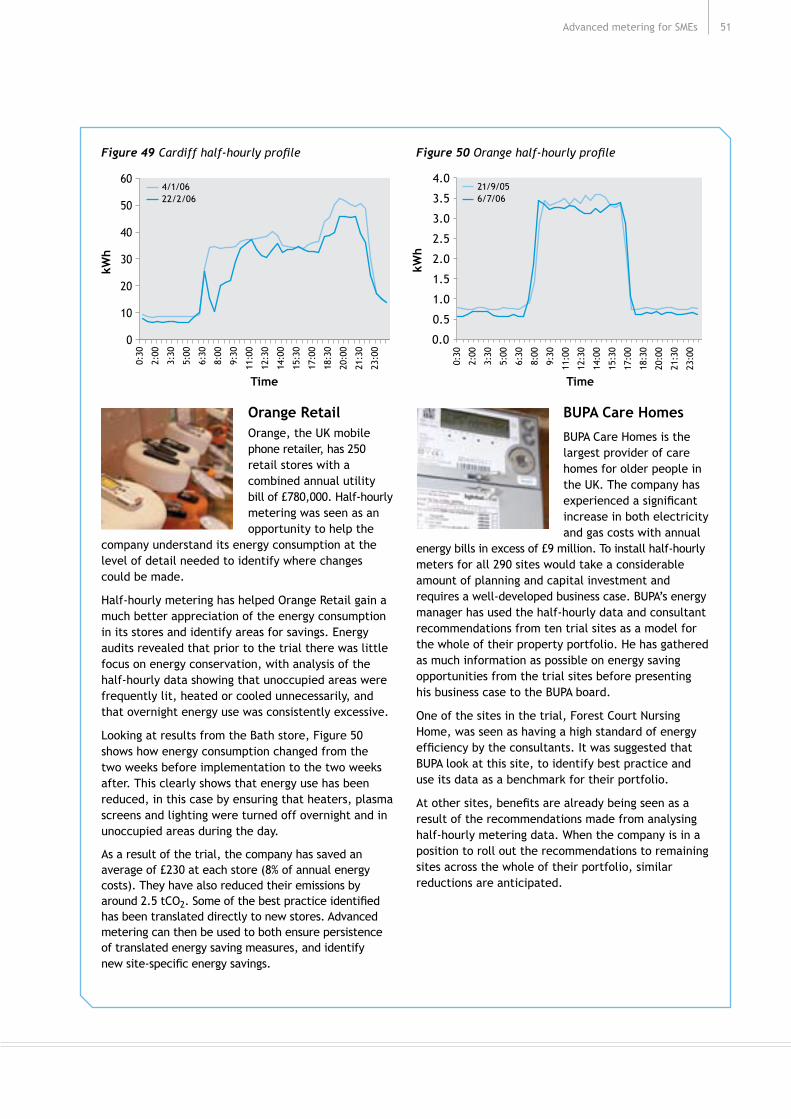
5�Advanced metering for SMEs
Figure 49 Cardiff half-hourly profile
Orange Retail Orange, the UK mobile phone retailer, has 250 retail stores with a combined annual utility bill of £780,000. Half-hourly metering was seen as an opportunity to help the
company understand its energy consumption at the level of detail needed to identify where changes could be made.
Half-hourly metering has helped Orange Retail gain a much better appreciation of the energy consumption in its stores and identify areas for savings. Energy audits revealed that prior to the trial there was little focus on energy conservation, with analysis of the half-hourly data showing that unoccupied areas were frequentlylit,heatedorcooledunnecessarily,andthat overnight energy use was consistently excessive.
Looking at results from the Bath store, Figure 50 shows how energy consumption changed from the two weeks before implementation to the two weeks after. This clearly shows that energy use has been reduced, in this case by ensuring that heaters, plasma screens and lighting were turned off overnight and in unoccupied areas during the day.
As a result of the trial, the company has saved an average of £230 at each store (8% of annual energy costs). They have also reduced their emissions by around 2.5 tCO2.Someofthebestpracticeidentifiedhas been translated directly to new stores. Advanced metering can then be used to both ensure persistence of translated energy saving measures, and identify newsite-specificenergysavings.
Figure 50 Orange half-hourly profile
BUPA Care Homes
BUPA Care Homes is the largest provider of care homes for older people in the UK. The company has experiencedasignificantincrease in both electricity and gas costs with annual
energy bills in excess of £9 million. To install half-hourly meters for all 290 sites would take a considerable amount of planning and capital investment and requiresawell-developedbusinesscase.BUPA’senergymanager has used the half-hourly data and consultant recommendations from ten trial sites as a model for the whole of their property portfolio. He has gathered as much information as possible on energy saving opportunities from the trial sites before presenting his business case to the BUPA board.
One of the sites in the trial, Forest Court Nursing Home, was seen as having a high standard of energy efficiencybytheconsultants.ItwassuggestedthatBUPA look at this site, to identify best practice and use its data as a benchmark for their portfolio.
Atothersites,benefitsarealreadybeingseenasaresult of the recommendations made from analysing half-hourly metering data. When the company is in a position to roll out the recommendations to remaining sites across the whole of their portfolio, similar reductions are anticipated.
0:30
2:00
3:30
5:00
6:30
8:00
9:30
11:0
0
12:3
0
14:0
0
15:3
0
17:0
0
18:3
0
20:0
0
21:3
0
23:0
0
4/1/0622/2/06
0
10
20
30
40
50
60
kWh
Time
kWh
Time
0:30
2:00
3:30
5:00
6:30
8:00
9:30
11:0
0
12:3
0
14:0
0
15:3
0
17:0
0
18:3
0
20:0
0
21:3
0
23:0
0
6/7/0621/9/05
0.0
0.5
1.0
1.5
2.0
2.5
3.0
3.5
4.0

The Carbon Trust52
CA
SE S
TUDY World Museum Liverpool
“ National Museums Liverpool are firmly committed to their social responsibility policy, part of which recognises the importance of reducing their impact on the environment.” Carole Youds — Energy and Facilities Manager, National Museums Liverpool.
Cost of metering system (multiple meters) £7,000
Consultancy and implementation £�5,000
Annual energy saving 935,000 kWh
Annual carbon saving 2�4 tCO2
Annual cost saving £35,�00
Payback period 7.5 months
Half-hourly metering at World Museum Liverpool revealed high levels of overnight electricity and gas consumption. The metering system and the cost of the resulting energy efficiency solutions have paid for themselves in less than eight months.
Background
World Museum Liverpool is a large multi-disciplinary museum which combines a global collection of historic treasures with the latest interactive technology. Originally opened in �853, it recently completed a major development that doubled its size to �6,000m2. Its electricity and gas consumption both exceed 5 GWh a year. The rapid rise of wholesale gas and electricity prices and an important environmental policy has highlighted the need to save energy.
Site profile and metering
Before the trial the site contained one main electricity meter, two main gas meters and one main water meter. In August 2005, a tailored meter replacement and data logging system were installed to provide half-hourly metering for electricity, gas and water.
The system reports through a software package that can be dialled up remotely, both by National Museums Liverpool’s Energy Manager and by external consultants. The analysis of information gathered every30minutesfromadvancedmeteringequipmentswiftly became a critical tool for people working to reduce electricity and gas consumption.
Findings and energy saving measures
Consultants’ analysis of the half-hourly meter data showed that, although energy consumption was lower overnight than during the day, it remained relatively high given that the building was unoccupied (500 kW at night against 840 kW during the day). Further investigation attributed this to the fact that artefacts were stored at 50% humidity levels with high tolerances. Boilers and chillers were running 24/7 to maintain the prescribed temperature and humidity conditions. Some climate control is needed for the preservation of artefacts, but it was found that
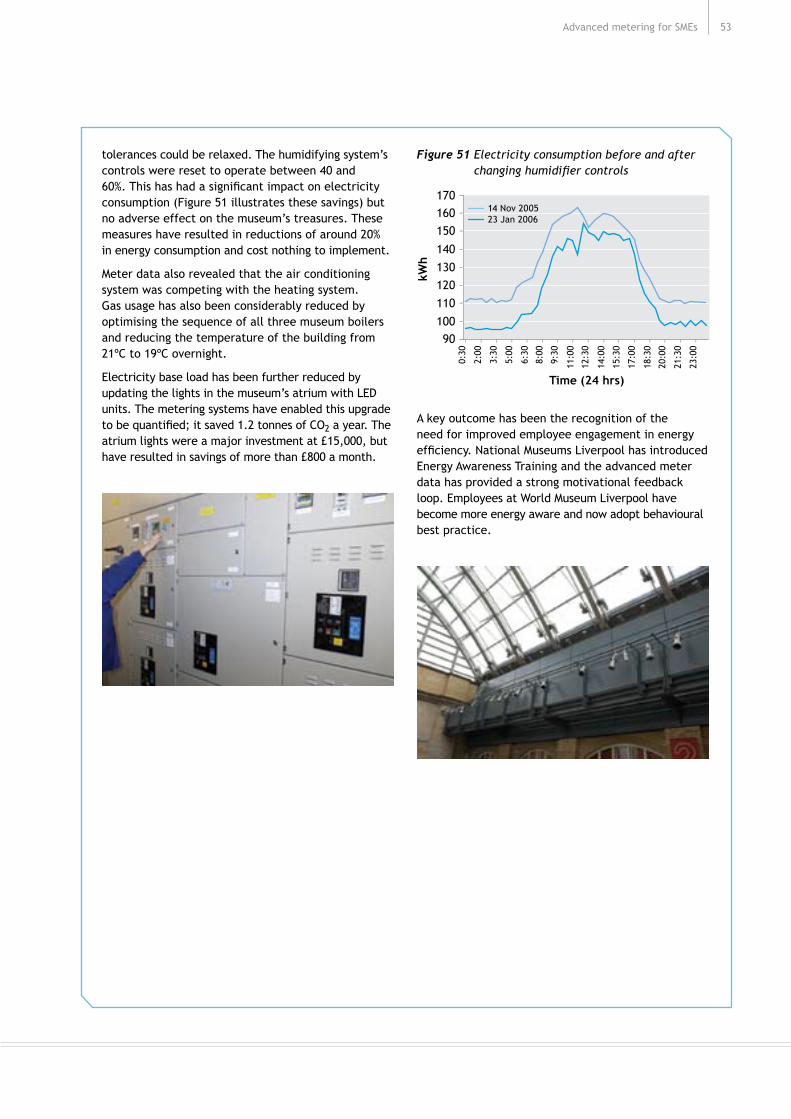
53Advanced metering for SMEs
tolerances could be relaxed. The humidifying system’s controls were reset to operate between 40 and 60%.Thishashadasignificantimpactonelectricityconsumption (Figure 5� illustrates these savings) but no adverse effect on the museum’s treasures. These measures have resulted in reductions of around 20% in energy consumption and cost nothing to implement.
Meter data also revealed that the air conditioning system was competing with the heating system. Gas usage has also been considerably reduced by optimisingthesequenceofallthreemuseumboilersand reducing the temperature of the building from 2�ºC to �9ºC overnight.
Electricity base load has been further reduced by updating the lights in the museum’s atrium with LED units. The metering systems have enabled this upgrade tobequantified;itsaved1.2tonnesofCO2 a year. The atrium lights were a major investment at £�5,000, but have resulted in savings of more than £800 a month.
Figure 51 Electricity consumption before and after changing humidifier controls
A key outcome has been the recognition of the need for improved employee engagement in energy efficiency.NationalMuseumsLiverpoolhasintroducedEnergy Awareness Training and the advanced meter data has provided a strong motivational feedback loop. Employees at World Museum Liverpool have become more energy aware and now adopt behavioural best practice.
Time (24 hrs)
90100
110
120130
140
150160170
kWh
14 Nov 200523 Jan 2006
0:30
2:00
3:30
5:00
6:30
8:00
9:30
11:0
0
12:3
0
14:0
0
15:3
0
17:0
0
18:3
0
20:0
0
21:3
0
23:0
0

The Carbon Trust54
CA
SE S
TUDY Bandvulc Tyres
“ This metering system is all part of our approach to our environmental principles and part of our belief that we should practise what we preach.” Patrick O’Connell, Managing Director, Bandvulc Tyres.
Cost of metering system £5,600 (multiple meters)
Cost of implementing saving £20,000 lagging + £35,000 lighting
Annual energy saving 800,000 kWh gas + 574,000 kWh elec
Annual carbon saving �52 tCO2 gas + 247 tCO2 elec
Annual cost saving £�0,800 gas + £20,000 elec
Payback period 24 months
Analysing data provided by half-hourly meters allowed Bandvulc Tyres to identify quick and simple ways to reduce energy consumption. It has implemented a series of measures, which have generated cuts in energy bills and carbon emissions.
Background
Bandvulc Tyres produces remoulded tyres for heavy goods vehicles at a factory on the outskirts of Plymouth. It is one of the leading companies in European truck tyre retreading, with operations throughout Europe. The company has an annual turnover of £22 million and employs some 240 people.
Energyisasignificantbusinessoverhead.In2005, the company consumed approximately �0.3 GWh, resulting in energy bills of more than £300,000. Managingenergyuseefficientlyisthereforeakeyobjective for the company.
Site profile and metering
Before its involvement in the Carbon Trust metering trial, Bandvulc had half-hourly data just for its main electricity meter and there was a one-month time lag before it had access to the information. It had no detailed data for gas or water and no way of monitoring related factors such as outside air temperature.
Bandvulc operates on a 24-hour production cycle Monday to Friday, but with planning, engineers were abletoinstallthemeteringequipmentduringworkinghours without disruption. The system was designed to be accessible either remotely or on-site. In addition to the main electricity meter, eight electrical sub-meters monitorspecificprocesseswithinthefactory.Thetotalcost of the meter system was £5,600.
Findings and energy saving measures
Initial analysis of advanced meter data allowed general energy usage trends to be studied. Energy consumption was found to be steady during the night shift and higher during the day, when the administrative team was on-site and more processes were running. As expected, energy usage was low at the weekends when the site is unoccupied.

55Advanced metering for SMEs
The tyre presses were an early focus for reducing gas consumption. Analysis of the meter data had indicated a large standing loss in the tyre presses and steam distribution system. Once the presses had been insulated with lagging the meter data was re-checked to measure the effectiveness of the process. Figure 52 shows the half-hourlygasprofileusedtoidentifythesemeasures.
Figure 52 Mains meters: Gas
Further gas consumption savings came from installing a new heat recovery unit, which raised the boiler feedwater temperature by 40ºC, and insulating its boiler feedwater tank and associated pipework.
To reduce base loads the high-pressure sodium lighting in the factory was replaced with more responsive T5 fluorescentfittingsconnectedtoacontrolsystem,which monitors both occupancy and daylight. In addition to these, dirty skylights were cleaned to maximise the use of daylight. Bandvulc was able to use advancedmeterdatatoquantifytheimpactofthischange.Figure53showstheelectricityprofile.
Figure 53 Mains meters: Electricity
Further base load reductions came from installing a control unit for its cooling systems and an inverter-driven compressor to manage air compression more efficiently.Thecompressorsthemselveswereductedto the outside of the building to improve operating efficiency.AdvancedmeteringallowedBandvulctoquantifytheeffectofthesemeasures.
Bandvulc were also keen to target behavioural change and set up an Energy Team with ‘local champions’ to promote good practice and champion culture change. Since then there has been a tangible shift in attitudes across the business. This has made the workforce considerably more receptive to adopting process and behavioural energy saving recommendations.
Results so far
The ability to use advanced metering to isolate and identify different trends in consumption in the factoryhasbeencriticaltotheenergyefficiencyprogram. Bandvulc covered its gas and electricity implementation costs within �4 months and significantsavingshavenowbeenmade.
Thelaggingmeasuresdeliveredquickresults—savingaround800,000kWhinthefirst12months,worth£�0,800, and �52 tonnes of CO2 for an initial cost of £20,000. The change of lighting system cost £35,000, but generated £�8,000 in annual electricity savings — payback in less than two years.
The company has registered weekend energy savings of £2,000 per year due to best practice shutdown measures alone, and generally it is also noticeable that machinery is now almost always switched off when not in use during the working week.
Furtherplannedprojectsincludefittingvariablespeeddrives to extraction motors and fans and installing a fully automated system to control the boiler.
0
500
1000
1500
2000
2500
Days 1–30
kWh
01/09/04-30/09/04
2 4 6 8 10 12 14 16 18 20 22 24 26 28 30
0
100
200
300
400
500
600
2 4 6 8 10 12 14 16 18 20 22 24 26 28 30
kWh
Days 1–30
01/09/04-30/09/04

The Carbon Trust56
Notes

The Carbon Trust would like to thank everyone who has contributed to this report, either through direct involvement in the trial, general discussions or review of findings and implications.

Advanced metering for SMEsCarbon and cost savings
Full Report
www.carbontrust.co.uk0800 085 2005
Whilst reasonable steps have been taken to ensure that the information contained within this publication is correct, the authors, the Carbon Trust, its agents, contractors and sub-contractors give no warranty and make no representation as to its accuracy and accept no liability for any errors or omissions.
Any trademarks, service marks or logos used in this publication, and copyright in it, are the property of the Carbon Trust. Nothing in this publication shall be construed as granting any licence or right to use or reproduce any of the trademarks, service marks, logos, copyright or any proprietary information in any way without the Carbon Trust’s prior written permission. The Carbon Trust enforces infringements of its intellectual property rights to the full extent permitted by law.
The Carbon Trust is a company limited by guarantee and registered in England and Wales under Company number 4190230 with its Registered Office at: 8th Floor, 3 Clement’s Inn, London WC2A 2AZ.
Printed on paper containing a minimum of 75% de-inked post-consumer waste.
Published in the UK: May 2007.
© The Carbon Trust 2007. All rights reserved. CTC713
The Carbon Trust is a UK-wide company, with headquarters in London, and bases in Northern Ireland, Scotland, Wales, and the English regions.The Carbon Trust is a private company set up by government in response to the threat of climate change, to accelerate the move to a low carbon economy.
The Carbon Trust works with UK business and the public sector to create practical business-focused solutions through its external work in five complementary areas: Insights, Solutions, Innovations, Enterprises and Investments. Together these help to explain, deliver, develop, create and finance low carbon enterprise.
The Carbon Trust is funded by the Department for Environment, Food and Rural Affairs (Defra), the Department of Trade and Industry (DTI), the Scottish Executive, the Welsh Assembly Government and Invest Northern Ireland.