the carbon tax in sweden - euki.de · the carbon tax in sweden ©2018 ecofys und adelphi...
TRANSCRIPT

©2018 Ecofys und adelphi
The Carbon Tax in Sweden
Fact sheet
for:
Federal Ministry for the Environment, Nature Conservation and Nuclear Safety (BMU)
by: adelphi: Johannes Ackva, Janna Hoppe
03 September 2018
The project Bridging European and Local Climate Action is financed by the European Climate Initiative (EUKI). EUKI is a project
financing instrument by the Federal Ministry for the Environment, Nature Conservation and Nuclear Safety (BMU). It is the
overarching goal of the EUKI to foster climate cooperation within the European Union in order to mitigate greenhouse gas
emissions. It does so through strengthening cross-border dialogue and cooperation as well as exchange of knowledge and
experience.
The information and views set out in this study are those of the author(s) and do not necessarily reflect the official opinion of the
Federal Ministry for the Environment, Nature Conservation and Nuclear Safety.
This study is based on a policy paper with an overview of greenhouse gas emission reductions and policy instruments in non-
ETS sectors across Europe (hereafter referred to as ‘Policy Paper’). The Policy Paper can be downloaded from the EUKI website.

The Carbon Tax in Sweden
©2018 Ecofys und adelphi
ABBREVIATIONS
EEG Erneuerbare Energien Gesetz
ESD Effort Sharing Decision
ESR Effort Sharing Regulation
ETS Emissions Trading System
EU European Union
EUR Euro
GDP Gross domestic product
GHG Greenhouse gas
IEA International Energy Agency
kWh Kilowatt hour
MJ Megajoule
MtCO2e million tonnes carbon dioxide equivalent
MWh Megawatt hour
OECD Organisation for Economic Cooperation and Development
PJ Petajoule
SEK Swedish krona
TWh Terawatt hour
USD United States Dollar
VAT Value added tax

The Carbon Tax in Sweden
©2018 Ecofys und adelphi
TABLE OF CONTENTS
1 Summary 1
2 National context 2
2.1. National climate policy 2 2.2. Sector context 2
3 General description of the policy instrument 4
3.1. History 4 3.2. Legal basis 5 3.3. Functioning 5 3.4. Interlinkages with other policy instruments 6
4 Impacts of the policy instrument 6
4.1. Effectiveness 6 4.2. Cost efficiency 13 4.3. Co-benefits and side effects 15 4.4. Success factors and challenges 16
5 Transferability 17
5.1. General comparability of the context 17 5.2. Properties of the instrument 18 5.3. Potential impacts 19 5.4. Experiences from other European carbon taxes 21 5.5. Conclusion 22
6 References 24
7 Appendix 28
Appendix 1: Trends in buildings not likely driven by the carbon tax 28

The Carbon Tax in Sweden
©2018 Ecofys and adelphi 1
1 SUMMARY
Sweden’s carbon tax has been the dominant instrument of Swedish climate policy since 1991, taxing
energy emissions in transport, buildings (heating), industry, and agriculture. As one of the oldest and
strongest carbon price signals with the largest sector coverage in the world (currently at about EUR 120/
tonnes CO2 equivalent), the tax warrants detailed examination to understand how transferring the
instrument could help Germany achieve its climate targets.
To better understand the role the tax played in reducing emissions as well as the role a similar tax could
play in Germany, it is vital to understand the sector contexts in which the tax operates. Thus, after a
brief introduction of the national context as well as a description of its origin and functioning, we provide
a detailed assessment of the tax across the sectors it operates in.
We find that the tax has had strong effects for those sectors where consumers and producers have
been exposed to the full tax rate. In the residential and commercial buildings sector, where energy
emissions are related primarily to heating, Sweden has undergone a fundamental transformation over
the past 30 years. Apart from the rise of district heating — itself not a result of the carbon tax — fuel for
district heating as well as distributed heating has been essentially decarbonised over this period, with
the rise of biomass as the main contributor of this decarbonisation to no small part driven by the carbon
tax.1 We also find strong evidence that the Swedish carbon tax has reduced Swedish road transport
emissions by about 10%, a significant feat given the difficulty of decarbonising transport.
As emissions-intensive industries first enjoyed significant exemptions and lowered tax rates and now
are under the EU ETS and exempt from the tax, the Swedish carbon tax has never imposed very high
carbon prices on emission-intensive industrial sectors2. Despite that, we find evidence that the carbon
tax has contributed to decreasing energy emissions in industry and, in particular, has made a strong
impact in reducing emission intensity.
While technology and fuel choices would likely be different in the German context, there is no
fundamental reason to expect that a similarly high carbon tax would not also lead to very significant
emission reductions in the German context. Indeed, the Swedish carbon tax experience reaffirms the
lesson from other contexts that high carbon prices are highly effective and efficient instruments to drive
emission reductions (Abrell et al. forthcoming, Barazini et al. 2017, Martin et al. 2014, Murray & Rivers
2015).
Overall, the Swedish carbon tax has been a highly effective instrument in reducing emissions. As the
introduction of the carbon tax was accompanied by reductions of the energy tax, and further increases
were often compensated by other tax reductions, the Swedish carbon tax remained politically feasible
despite the high carbon price imposed on consumers and non-electric energy providers.
1 For simplicity, we speak of decarbonisation in the case of biomass. Of course, biofuels do emit carbon, but — in line with Swedish, European Union and
IPCC accounting — we take the lifecycle perspective as default in considering biofuels, i.e. considering them as carbon-neutral.
2 While the reduced rates were only introduced in 1993, i.e. two years after the initial introduction of the tax, the level of the carbon tax was not high initially.

The Carbon Tax in Sweden
©2018 Ecofys und adelphi 2
2 NATIONAL CONTEXT
2.1. National climate policy
Sweden has been a pioneer in international environmental policy and was one of the first signatories
and ratifiers of the Kyoto Protocol at the turn of the millennium. The current red-green government under
Prime Minister Stefan Löfven has committed Sweden to becoming greenhouse gas (GHG) neutral by
2045, five years earlier than under the previous target. Sweden already has the lowest emission
intensity (emissions per unit of gross domestic product (GDP)) and the second lowest GHG emissions
per capita in the European Union (EU). Sweden's 2020 target of 49% renewable energy was already
exceeded in 2013 (EUR-Lex 2015). In 2016, 57% of electricity came from renewable energy sources,
especially hydropower (40%), although wind power has achieved significant growth in the last ten years
(SCB, 2017a). Nuclear power plants contributed another 41% to electricity generation (IEA, 2017b).
Taken together, this means that electrifying energy use, e.g. with heat pumps for heating or electric
cars for transport, is a highly effective strategy in the Swedish context.
For the 2018 budget, SEK 5 billion (EUR 485 million) is earmarked for environmental and climate action
measures, more than twice as much as in 2014 (Government Offices of Sweden, 2017). Sweden's
climate policy covers measures in all sectors. The national CO2 tax was introduced as early as 1991
and is by far the strongest CO2 price signal in the world (World Bank, 2017). The Swedish carbon tax
currently covers all energy-related carbon emissions that are not under the EU Emissions Trading
System (ETS). In addition, Sweden introduced a CO2 tax on aviation on 1 April 2018, which increases
ticket prices by SEK 80–430 (EUR 8–42) depending on distance and is supported by more than half of
the population (The Local, 2018).
Sweden's Effort Sharing Decision (ESD) target for 2020 is to lower emission levels 17% below 2005
and is only exceeded by Denmark, Ireland and Luxembourg. This is all the more impressive given the
already low emission intensity in Sweden. With the Effort Sharing Regulation (ESR), Sweden and
Luxembourg have the most ambitious targets in the European Union for 2030. By then, GHG emissions
in the non-ETS sectors are to be reduced by 40% compared to 2005.
According to forecasts (Swedish Environmental Protection Agency, 2017), Sweden will exceed its 2020
ESD target and achieve a decline of 30% instead of 17% between 2005 and 2015, indicating an
emission reduction rate close to twice the ESD target.
In the following, we will examine the role the Swedish carbon tax has played in this impressive success.
2.2. Sector context
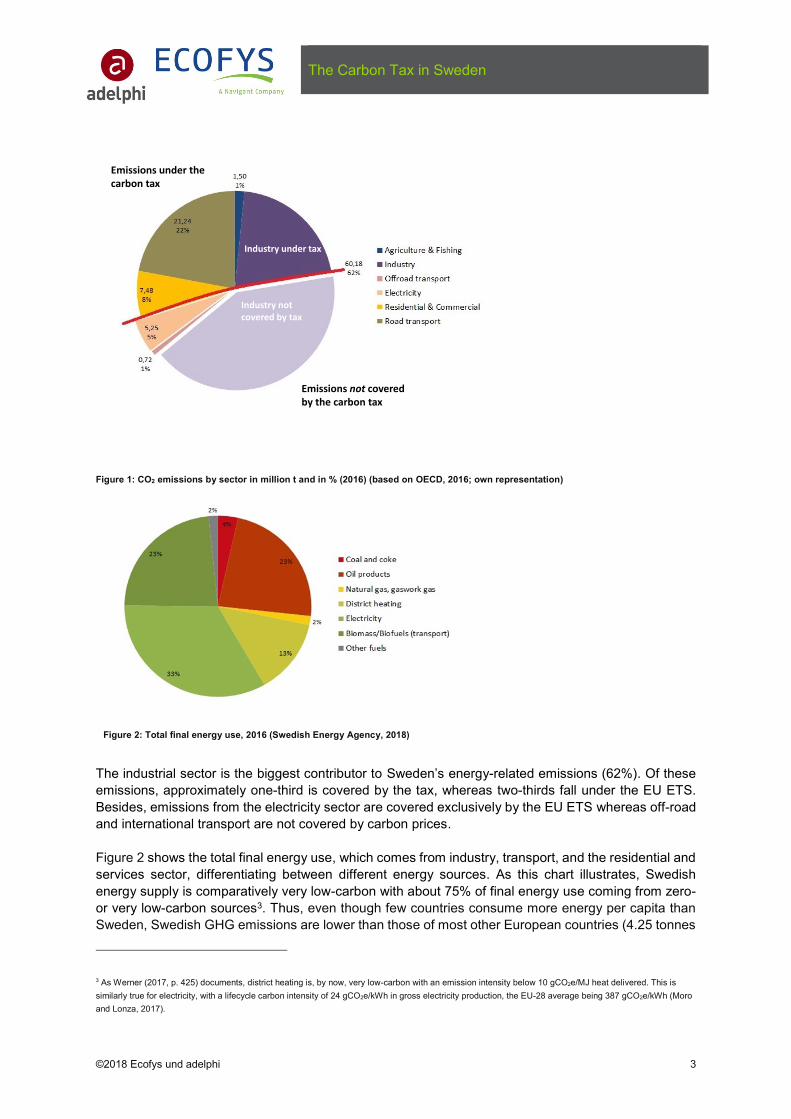
Figure 1 shows CO2 emissions associated with energy use for six economic sectors: agriculture and
fishing, electricity, industry, off-road transport, residential and commercial (buildings), and road
transport. It is important to note that these are energy-related emissions, i.e. they do not include process
emissions from industry nor most agricultural emissions from fertilisers or ruminant animals or
emissions from waste. The numbers and shares are thus not equivalent to total Swedish emissions, but
rather describe the situation for fuels for which the carbon tax — as a tax levied on energy — is or could
be applied.
The Carbon Tax in Sweden
©2018 Ecofys und adelphi 3
Figure 1: CO2 emissions by sector in million t and in % (2016) (based on OECD, 2016; own representation)
Figure 2: Total final energy use, 2016 (Swedish Energy Agency, 2018)
The industrial sector is the biggest contributor to Sweden’s energy-related emissions (62%). Of these
emissions, approximately one-third is covered by the tax, whereas two-thirds fall under the EU ETS.
Besides, emissions from the electricity sector are covered exclusively by the EU ETS whereas off-road
and international transport are not covered by carbon prices.
Figure 2 shows the total final energy use, which comes from industry, transport, and the residential and
services sector, differentiating between different energy sources. As this chart illustrates, Swedish
energy supply is comparatively very low-carbon with about 75% of final energy use coming from zero-
or very low-carbon sources3. Thus, even though few countries consume more energy per capita than
Sweden, Swedish GHG emissions are lower than those of most other European countries (4.25 tonnes
3 As Werner (2017, p. 425) documents, district heating is, by now, very low-carbon with an emission intensity below 10 gCO2e/MJ heat delivered. This is
similarly true for electricity, with a lifecycle carbon intensity of 24 gCO2e/kWh in gross electricity production, the EU-28 average being 387 gCO2e/kWh (Moro
and Lonza, 2017).
Industry not covered by tax
Industry under tax
Emissions under thecarbon tax
Emissions not coveredby the carbon tax

The Carbon Tax in Sweden
©2018 Ecofys und adelphi 4
of CO2e (tCO2e) per year per capita compared to the EU average of 6.91 tCO2e). This can to a large
proportion be traced back to the high share of low-carbon electricity (nuclear, hydropower, and wind;
together over 90%) as well as a high share of district heating (Sweden.se, 2018) and biofuels in heating
and transport.
3 GENERAL DESCRIPTION OF THE POLICY INSTRUMENT
3.1. History
Sweden has a long history of energy taxes on fuels, initially primarily for fiscal purposes. The oil crises
in the 1970s and rising fear of energy shortages contributed to raising the energy tax. Amid rising
environmental concerns, the central government introduced a carbon tax in 1991 (Raab, 2017, pp. 2),
one of the first CO2 taxes within Europe (Brännlund et al., 2014; p. 845; Bohlin, 1998; p. 285). The
introduction of the carbon tax was part of a major tax reform of 1990/1991 that affected all sectors and
also introduced a tax on sulphur (1991) and nitrogen oxide (1992) as well as a value added tax (VAT)
on energy (Raab, 2017; p. 4; Brännlund et al., 2014; p. 845; Ekins & Speck, 1999; p. 376). Labour taxes
were reduced and simplified, and the energy tax — the tax levied by energy rather than carbon content
— was halved.
The tax rate for CO2 was originally set at 250 SEK (EUR 27) per metric tonne and was applied equally
among sectors (Sumner et al., 2009; p. 11). Until 1992, industrial companies were not exempt from
taxation but were subject to the same tax rates for energy and carbon content. When in 1993 energy
and CO2 taxes increased, the manufacturing sector was exempted from the energy tax and was taxed
at 25% of the CO2 tax, which was raised to 50% of the CO2 tax in 1997 (Brännlund et al., 2014; p. 845;
Andersen & Ekins, 2009; p. 44). These exemptions were applied to energy-intensive industries (Lin &
Li, 2011; p. 5140). Additional refunds were available for industries with high tax bills until 2007
(Brännlund et al., 2014; p. 846; Andersen & Ekins, 2009; p. 45).
A ‘Green Tax Shift’ took place between 2001 and 2006, when environmental taxes were substantially
raised while cutting income taxes in order to relieve the tax burden on low-income households (Raab,
2017; p. 4). In the period following 2007, environmental taxes were again gradually increased.
Even though the general carbon tax levels (in EUR per tCO2) rose from just over EUR 25 to EUR 120
between 1991 and 2017, the effective CO2 tax level for industry stayed well below EUR 40 until 2014
(Raab, 2017; p. 7). A steep increase in tax levels for industry has been paving the way towards closing
the gap between differing tax rates in 2018.

The Carbon Tax in Sweden
©2018 Ecofys und adelphi 5
Figure 3: Carbon tax levels in EUR/t 1991–2018 (based on Raab, 2017; p. 7); adjusted and extended with own research
3.2. Legal basis
The legal basis is provided by the Energy Tax Act (SFS 1994, 1776). The CO2 tax applies to the same
fossil fuels taxed under the energy tax, at rates varying in proportion to the respective carbon content
(OECD, 2018a; p. 6). The tax rate, the tax base and reliefs are set by the central government. It is
collected by the National Tax Authority.
3.3. Functioning
The Swedish carbon tax is an energy tax, meaning it is applied to fossil fuels that are combusted to
generate energy. Importantly, the Swedish carbon tax does not cover fossil fuels combusted for
electricity generation; however, these are very limited in the Swedish context where most electricity
generation is decarbonised. It complements and is levied with the energy tax that is levied based on
energy rather than carbon content. Like the energy tax, the carbon tax does not tax most biofuels. It is
collected in the same way as the energy tax, which, apart from the ease of upstream collection, keeps
administrative costs low (0.1% of revenues generated by carbon and energy tax; Åkerfeldt, 2011; p. 12).
The revenue generated through the tax goes towards the government’s general budget, representing
between 0.5 and 1% of the Swedish GDP between 2000 and 2015.
All sectors that produce energy-related emissions outside the electricity sector are covered by the tax.
This hence includes agriculture and fishing, industry, residential and commercial, and road transport. A
large share of industrial facilities has first been exempt from paying the tax or the full tax rate and was
later excluded due to their participation in the EU ETS.

The Carbon Tax in Sweden
©2018 Ecofys und adelphi 6
Since the launch of the EU ETS in 2005, the carbon tax has been gradually phased out for entities
participating in the EU ETS (Brännlund et al., 2014; p. 846). Swedish ETS installations thus face a much
lower carbon price (EU ETS allowances currently trade around EUR 20) than the EUR 120/tCO2 tax
rate otherwise applicable in Sweden.
3.4. Interlinkages with other policy instruments
There are several other taxes levied on fuels: the energy tax, the VAT on energy, and potentially other
environmental taxes (e.g., sulphur and nitrogen oxide taxes). Thus, for many decisions related to energy
use, consumers and producers are exposed to the carbon price signal as one of several price signals,
a point that will become elaborated upon in the discussion of effects on road transport.
The carbon tax is particularly closely linked to the energy tax, which provides the basis for the carbon
tax’s collection and, consequently, also affects its scope (e.g. by excluding biofuels). Apart from this
administrative interlinkage, there is an important political interlinkage: It is very likely that the coupling
of reducing the energy tax with introducing the carbon and other environmental taxes made the overall
package more politically palatable. Indeed, increases in the carbon tax have often been accompanied
by reductions in the energy tax thereby reducing the increase in overall tax burden for energy but
increasing the carbon price signal component. It is thus fair to say that the energy tax, originally levied
for fiscal purposes and then to incentivise energy efficiency after the oil price shocks, has strongly
facilitated the establishment of a strong carbon price signal.
4 IMPACTS OF THE POLICY INSTRUMENT
4.1. Effectiveness
Analysing the effectiveness of the Swedish carbon tax, we need to differentiate between its impact on
different sectors, reflecting the fact that the effective carbon tax rates are differentiated by sector and
that abatement potentials and costs vary strongly.
In principle, the carbon tax can be effective through three levers: (i) It incentivises lower
production/consumption of carbon-intensive goods and services; (ii) it incentivises a reduction in energy
intensity whenever energy has a carbon footprint; and (iii) it incentivises a reduction in the carbon
intensity of energy. In other words, it affects all three terms that define the energy-related sectoral
emissions:
Formula 1: Decomposing emissions
(𝑎) 𝐸𝑛𝑒𝑟𝑔𝑦 𝑒𝑚𝑖𝑠𝑠𝑖𝑜𝑛𝑠 𝑖𝑛 𝑠𝑒𝑐𝑡𝑜𝑟 𝑋 = (𝑏)𝑂𝑢𝑡𝑝𝑢𝑡 𝑙𝑒𝑣𝑒𝑙 𝑖𝑛 𝑠𝑒𝑐𝑡𝑜𝑟 𝑋 ×
(𝑐)𝐸𝑛𝑒𝑟𝑔𝑦 𝑖𝑛𝑡𝑒𝑛𝑠𝑖𝑡𝑦 𝑖𝑛 𝑠𝑒𝑐𝑡𝑜𝑟 𝑋 × (𝑑)𝐶𝑎𝑟𝑏𝑜𝑛 𝑖𝑛𝑡𝑒𝑛𝑠𝑖𝑡𝑦 𝑜𝑓 𝑒𝑛𝑒𝑟𝑔𝑦 𝑖𝑛 𝑠𝑒𝑐𝑡𝑜𝑟 𝑋
As we have seen above, there are three sectors for which a major impact is likely to have been
observed: commercial and residential buildings (heating), road transport, and those parts of industry
not covered under the EU ETS4. We discuss these sectors in turn, focusing on whether the carbon tax
4 There could also be effects on the energy-related emissions in agriculture. For the sake of brevity and because it is less relevant in terms of energy
emissions that are covered by the tax, we do not discuss this sector here.

The Carbon Tax in Sweden
©2018 Ecofys und adelphi 7
was the likely driver of observed reductions in emission levels (a), outputs/consumption (b), energy
intensity (c) or carbon intensity of energy (d), see Formula 1.
4.1.1 Effectiveness in the building sector (heating)
Looking at the buildings sector in Sweden, there are six observable main trends that have shaped
developments since about 1990. Overall, emissions have decreased, driven by some reduction in
energy use (trend 1, see Table 1) and strong reductions in energy intensity (trends 2 and 3) as well as
a significant reduction in the carbon intensity of energy (trends 4, 5, 6). Importantly, while district heating
has now largely transitioned under the EU ETS (Ericsson & Werner 2016), its decarbonisation had been
largely achieved before.
In Table 1 below, we bold those trends that are plausibly affected or even primarily driven by the carbon
tax. The sequencing within columns reflects an ordering by significance for emission reductions, with a
more detailed discussion of attribution to the carbon tax and significance below. For those trends where
we believe the carbon tax has played no role, we provide a brief discussion for our reasoning in
Appendix 1.

The Carbon Tax in Sweden
©2018 Ecofys und adelphi 8
Table 1: Trends in emissions and energy/carbon intensity — buildings sector (data from: Lin & Li, 2011; Werner, 2017; extended by own
research)
Energy emissions in
buildings (Heat)
Production /
Consumption Level
(output)
Emission intensity (GHG per output)
Energy intensity
(Energy per output)
Carbon intensity of energy
(Carbon per energy)
Strong reduction
(over 80% reduction
since introduction of
carbon tax for
residential emissions,
also strong reduction in
emissions in district
heating)
1. Decrease in
household energy
use by 2.1 % (per
capita, 1990–2008)
2. Increase in district heating
(from about 30% to over
50%).
3. Changing composition of
electricity-based heating
(from resistance heaters to
heat pumps; low effect on
emissions given that electrical
energy efficiency is not very
relevant in Sweden due to
low-carbon electricity supply).
4. Phase-out of fuel oil (from
about 25% to less than 5%)
5. Decarbonisation of
district heating through
biofuels
6. Slight increase in
electricity-based heating
(from about 30% to about
35%)
Trend 1: Effects on energy use of households
While households only reduced energy use by 2%, this was likely strongly affected by the carbon price
signal especially given that other energy taxes were reduced. The fact that residential energy emissions
decreased by 80% while demand only decreased by 2 percentage points to strong reductions in
emission intensity through the effects on carbon intensity of energy.
Trend 4: Phase-out of fuel oil
Fuel oil has been essentially phased out since the introduction of the Swedish carbon tax, replaced —
in terms of net percentage shares — to about 75% by district heating and to about 25% by a rise of
electric heating, in particular heat pumps. This is likely due to a combination of the increasing availability
of district heating as well as, through the carbon tax’s price increase for fuel oil, more favourable
economics for electricity-based distributed heating.
Trend 5: Effect on fuel switching to biomass in district heating
There is strong evidence that the Swedish carbon tax has driven a significant transformation of the
district heating sector by increasing the share of biofuels. Between 1990 and 1995 alone, i.e. the first
years of the carbon tax, the energy from biofuels for district heating doubled from 36.7 PJ to 73. PJ
(Bohlin, 1998; p. 287). Bohlin finds a resulting estimated emission reduction effect of 0.5–1.5 million t
(Mt)CO2/year (Bohlin, 1998; p. 288).
The carbon tax has surely not driven these changes alone, so we need to assess its contribution. Bohlin
(1998; p. 290) concludes that the carbon tax made wood fuels more competitive than fossil fuels for
district heating and that, directly before the introduction of the tax, the lower oil prices of the 1980s had
exerted a dampening effect on the biofuel industry. However, he also argues that subsidies to reduce

The Carbon Tax in Sweden
©2018 Ecofys und adelphi 9
the fixed cost of the fuel switch, subsidising furnace switches, were equally necessary to allow for the
transformation.
Trend 6: Slight increase in the share of electricity-based heating
Electricity-based heating has increased by one-sixth, from about 30% to about 35%, between 1991 and
2014, with much of the strong gain in heat pumps (from 0% to over 20%) ‘eaten up’ by a corresponding
decline in conventional electric heating. Thus, while the carbon tax has likely contributed to this change
— electricity as the input of these heating technologies is exempt whereas fossil carbon alternatives
face the full carbon tax — the overall decarbonisation effect of this shift is thus far limited: The increase
in electricity-based heating corresponds to about 25% of the decline in fuel oil as the primarily displaced
carbon-intensive fuel in distributed heating.
4.1.2 Effectiveness in the road transport sector
In Swedish road transport, emissions in 2005 were back to 1990 levels and have decreased since.
Table 2 below summarises central trends in our framework. Both fuel intensity (energy intensity; trend 2)
and carbon intensity declined, the latter through an increased use of diesel and a decline of petrol as
well as biofuels and, lately, electric cars (trends 3–6). In Sweden, transport fuel is taxed by three
different taxes – the energy tax levied per energy content, the carbon tax levied by carbon content and
a VAT on energy introduced shortly before the carbon tax. By 2005, the carbon tax reached the same
level as the VAT at about 80% of the energy tax (Andersson, 2017; p. 7)5. Those taxes are passed on
to consumers (Andersson, 2017, pp. 8–9), thus giving strong incentives to drive less, buy more efficient
cars, and switch to lower-carbon fuels. Given that these taxes are strongly correlated, it is difficult to
clearly attribute observed effects to the carbon tax. For example, biofuels are exempt from the energy
tax and the carbon tax.
Table 2: Trends in emissions and energy/carbon intensity — transport sector (data from Kahn, n.d.; Myhr, 2018; Andersson, 2017)
Energy-related
emissions in the
transport sector
Production /
Consumption
Level (output)
Emission intensity (GHG per output)
Energy intensity
(Energy per output)
Carbon intensity of energy
(Carbon per energy)
Increase in 2007,
decline since 1. Increase in
road transport
kilometres
2. Increased fuel efficiency in
cars
3. Increased demand for
diesel
4. Decreased demand for
petrol
5. Increased use of biofuels in
transport
6. Increased electrification of
transport
5 Importantly, the declining differential between the energy and the carbon tax is driven both by an increase of the carbon tax and a decline of the energy tax,
increasing the carbon price signal within the overall fuel tax regime.

The Carbon Tax in Sweden
©2018 Ecofys und adelphi 10
For the period 1990 to 2005, Andersson (2017) finds that the carbon tax reduced transport emissions
by about 6.3% per year. Importantly, towards the end of this period, with the increasing carbon tax, the
carbon tax is estimated to cause an almost 10% reduction in transport emissions (9.4%).
Figure 4: Effects of VAT and carbon tax on emissions (adapted from figure 11 in Andersson, 2017; p. 29)
While we do not have conclusive evidence on this given the studied period ends in 2005, the further
increases in the carbon tax since 2005 have likely further strengthened the effect of the carbon tax on
transport emissions.
Even if the effect had remained constant, an almost 10% reduction compared to a scenario without
carbon tax is quite significant given the difficulty of decarbonising road transport and the increasing
trend of road transport emissions in Germany (Umweltbundesamt, 2017) and many other advanced
economies.
In terms of how these emission reductions were achieved, a reduced demand for gasoline and
increasing demand for diesel (Andersson, 2017; p. 29), more efficient cars as well as a transition to
biofuels and, lately, electric cars, have all played a role (Scharin and Wallström, 2018). Given that there
are already three different taxes that interact and affect fuel prices, apart from additional policies, we
are unable to clearly identify the specific effect of the carbon tax on all the different trends affecting the
carbon intensity of the fuel mix (trends 3–6, see Table 2). However, it is important to stress that for
moving towards greater fuel efficiency (trend 2) all three taxes — energy, carbon and VAT — act in the
same way likely making the carbon tax’s relative contribution lower. By the same token, the carbon tax’s
relative effect is likely stronger for the move towards lower-carbon fuels.
4.1.3 Effectiveness in the industrial sector
Between 1990 and 2004, the most useful comparison period as the launch of the EU ETS in 2005
reduced the share of industry covered by the Swedish carbon tax, energy-related industrial emissions

The Carbon Tax in Sweden
©2018 Ecofys und adelphi 11
decreased by 10%6 (Brännlund et al., 2014; p. 845) despite a production increase of 35% in the same
period. This decoupling was driven to a small degree by a structural change towards lighter industry,
but primarily by decreases in energy intensity as well as decrease in the carbon intensity of energy
(Martínez & Silveira, 2013) that together led to a strong decrease in emission intensity (Brännlund et
al., 2014). While attribution to policy instruments becomes more challenging with the introduction of the
EU ETS and a step-wise shift of some industrial activity from the tax to the ETS, we show at the end of
this section that the central trend of reducing industrial combustion emissions continues up to the
present.
Table 3: Trends in emissions and energy/carbon intensity — industrial sector (data from Martínez & Silveira, 2013; Brännlund et
al., 2014)
Energy-related
emissions in
industry
Production /
Consumption Level
(output)
Emission intensity (GHG per output)
Energy intensity
(Energy per output)
Carbon intensity of energy
(Carbon per energy)
Reduction of
energy-related
emissions in
industry (10%
between 1990 and
2004)
1.Production increased
strongly
2. Shift in relative
shares towards
lighter industry
(ancillary)
3. Decrease in energy
intensity of industry
4. Decrease in carbon
intensity of energy (increased
use of electricity in industry as
well as cleaner fossil fuels and
some biofuels)
For most of these trends leading to lower overall emissions, the carbon tax is a likely main or ancillary
driver as described in the following sub-sections.
Trend 2: Shift to less emission-intensive industries
While both traditionally emission-intensive as well as lighter (less emission-intensive) industries have
been growing in Sweden, lighter industry has been growing much faster. This structural change has
been found to have some impact on reducing overall emission intensity of the sector (Martínez &
Silveira, 2013). While the carbon tax, when covering all of industry, could have contributed to this by
making investments into less emission-intensive industry relatively more attractive, we do not have
conclusive evidence on this. In any case, emission-intensive industries now face a significantly lower
carbon price than lighter industry due to the former being included in the EU ETS and the latter facing
a carbon tax that is an order of magnitude higher. Hence, these incentives are now reversed.
Trend 3: Decrease in energy intensity
For the decline in energy intensity, the Swedish carbon tax is found to have had an effect, albeit the
energy tax has been relatively more important (Martínez & Silveira, 2013; p. 127). This is not surprising
given that the carbon tax only incentivises a move towards lower-carbon energy, but not less energy
6 As pointed out by Lin & Li (2011), the Swedish carbon tax did not lead to an absolute emission reduction in the Swedish industrial sector. Indeed, emissions
increased by 13.3% sector-wide and by 27% for iron and steel between 1990 and 2008 (Lin & Li, 2011, p. 5143). However, these are total industrial
emissions, which also reflect process emissions that are not under the carbon tax. In addition, the timeframe until 2008 is less meaningful to assess the
effects of the Swedish carbon tax given that some industrial activity was already moved (or was expected to move shortly after) to the EU ETS.

The Carbon Tax in Sweden
©2018 Ecofys und adelphi 12
consumption per se. With electricity rising as an input compared to fossil fuels, the relative carbon price
signal per unit of energy input decreased. In other words, the carbon tax’s success in reducing carbon
intensity of energy (see below) also reduces its impact on reducing energy intensity.
Trend 4: Decrease in carbon intensity of energy
Primarily through a greater reliance on low-carbon electricity as well as a switch to cleaner fossil fuels7,
the carbon intensity of energy has significantly decreased since the introduction of the carbon tax
(Martínez & Silveira, 2013; p. 124). While this has also been driven by changing fossil fuel prices and
other non-policy influences, the carbon tax is found to be the strongest policy influence (Martínez &
Silveira 2013; p. 127).
Trends in industrial combustion emissions since the introduction of the EU ETS
In Figure 5 below, we have graphed the emissions trajectory of combustion emissions from all industrial
subsectors between 1990 (one year before the carbon tax) and 2014 (the last year for which complete
data are available). Apart from subsectors we also report the total as well as the total of all sectors
except iron and steel (iron and steel is by far the dominant sector). Vertical red lines indicate various
important changes — the introduction of the carbon tax (1991), the introduction of lowered rates for
industry (1993), the beginning of the ‘Green Tax Shift’ (2001), the introduction of the EU ETS (2005)
and the completion of the transition of large industrial facilities under the EU ETS (2011).
Unfortunately, given that the move into the EU ETS was step-wise and given that falling under the EU
ETS rather than the tax is also dependent on size thresholds, we cannot cleanly identify the degree to
which sectors are under the carbon tax or ETS, respectively. It is for this reason that our analysis of
effects in industry focused primarily on the 1991/1993–2004 period for which inference is possible (this
issue is also discussed in Brännlund et al., 2014).
Over the entire period (1991-2014), total industrial emissions have decreased by 13%, with a 24%
reduction in industrial combustion emissions outside iron and steel, whereas emissions of iron and steel
have increased by about 10%. Interestingly, there is a clear absolute emissions reduction trend starting
about 2001 which is driven by the sectors outside iron and steel. In this period, total emissions dropped
almost 24%, driven by a 27% reduction outside iron and steel and a reduction of about 18% in iron and
steel production. While, as discussed above, it is difficult to link those trends towards specific policy
instruments (given ETS and tax scope cannot be clearly identified), this pattern is consistent with
stronger reductions in less emission-intensive industries exposed to higher carbon price levels. It is
furthermore noticeable that a clear absolute emissions reduction trajectory has been maintained ever
since total industrial combustion emissions peaked in 2001.
7 Importantly, at least for the period from 1993 (the start of the lowered industry rates) to 2005 (the start of the EU ETS), the share of biofuels even
decreased (Martínez & Silveira, 2013, p. 124). In other words, unlike for the case of buildings, the switch to biofuels is not the main story of energy
decarbonisation in industrial processes.

The Carbon Tax in Sweden
©2018 Ecofys und adelphi 13
Figure 5: Combustion emissions in industrial subsectors (own presentation, with data from Swedish Environmental Protection Agency,
2018)
4.2. Cost efficiency
In principle, wide-ranging uniform carbon taxes are thought to be among the most cost-efficient tools
for domestic mitigation: driving abatement up to the carbon tax level wherever possible8. In this section
we start from this assertion of cost efficiency and discuss whether and how particularities of the
instrument are likely to affect the cost efficiency.
As all carbon pricing instruments to date, the Swedish carbon tax does not fulfil this ideal case, but (a)
covers a limited set of sectors and (b) has, historically, imposed heterogeneous price signals. More
recently, (c) the full separation between EU ETS and Swedish carbon tax9 and the subsequent increase
of the carbon tax level has led to a strong discontinuity in carbon prices for the industrial sector based
on emission levels10. This will be elaborated in the following.
8 The underlying reasoning is that when all economic activity is exposed to the same carbon price signal then all abatement options that are cost effective at
the carbon price level will be implemented (and no less and no more) achieving the maximum mitigation possible under that price level. It gets more
complicated when considering the long run where investments and technological innovation respond to carbon prices in which case the optimal cost
efficiency of a uniform economy-wide carbon price is less likely to be the case (see e.g. Vogt-Schilb & Hallegate, 2014).
9 Firms are only covered under one of the two instruments, also see the above section on functioning.
10 This can lead to ‘perverse incentives’: for installations that are close to the emission level to be included in the EU ETS inclusion, increasing emissions can
be highly attractive.
Kt
of
CO
2e
em
issi
on
s
Year

The Carbon Tax in Sweden
©2018 Ecofys und adelphi 14
(a) The tax is limited in its coverage in several ways: (i) it only covers combustion emissions (excluding
process, agricultural, waste, and fugitive emissions) and excludes off-road transport; (ii) it excludes the
electricity sector; and (iii) it excludes facilities under the EU ETS.
Emissions under (i) are mostly for activities that are found particularly difficult to decarbonise11, making
it likely that their exclusion does not forego significant abatement opportunities in the near term but
rather that it primarily causes foregone revenue12. In the early stages of developing decarbonisation
technologies for these sectors, innovation support is likely more important than carbon pricing
(Acemoglu et al., 2016), although their inclusion under carbon pricing would likely enhance cost
efficiency over time (dynamic cost efficiency). (ii) The exclusion of the electricity sector is likely fairly
inconsequential given that Swedish electricity is essentially decarbonised.
If those assertions are correct, then — from a pure Swedish ESD sector perspective — the Swedish
carbon tax is likely fairly close to being fully cost-efficient in the short term. Cost efficiency is significantly
harder to assess for the long term where differential carbon prices can be optimal given that abatement
potential is limited across sectors and that some sectors have much longer investment horizons than
others (Vogt-Schilb & Hallegate, 2014)13. However, given that the carbon tax is not the only climate
policy instrument and that other instruments — such as investment subsidies — also impose implicit
carbon prices for specific sectors, a uniform carbon tax rate could still be optimal for dynamic cost
efficiency if factors such as differential abatement potentials and turnover rates are accounted for by
other policies14.
Whether the historically present differential tax rates across sectors led to inefficiency depends on
assumptions about carbon leakage; the displacement of production to a less stringent locale; combined
with increased imports that could neutralise emission reductions in Sweden or even increase global
emissions15. The carbon tax for the manufacturing sector was lowered due to such carbon leakage and
competitiveness concerns, and the carbon price faced was still higher than in almost all other
jurisdictions. Thus, it could be the case that the Swedish carbon tax was still very cost-efficient since
the lowered rates were indeed necessary to avoid carbon leakage. The assessment of these different
rates for cost efficiency hence depends on the (1) degree to which those exemptions were indeed
necessary to avoid carbon leakage, and (2) whether one ultimately cares about global emissions or the
achievement of Swedish or EU targets.
With emission-intensive industry now under the EU ETS rather than exposed to lower carbon tax rates,
this issue does not affect the ESD sector anymore. It is rather the delineation between ESD and ETS
sectors affecting national or European cost efficiency, but this is beyond the scope of this study.
11 The exemption here being waste, however when used energetically it also falls under the tax or the EU ETS; it is only not covered when waste is landfilled.
12 In other words, if the carbon tax was levied on those sectors, the assumption would be that paying the carbon tax would usually be cheaper than
abatement.
13 For example, it could be dynamically cost-efficient to have higher carbon prices for industrial facilities that are built in 60-year cycles than for road transport
where turnover rates are significantly shorter and, hence, decarbonisation without massive premature retirements of capital stock can happen faster.
14 One could also argue that it makes little sense to evaluate the carbon tax’s cost efficiency in the dynamic case as long as other policies exist. In this case
there is no need for the carbon tax to consider effects that go beyond short-term incentive structures.
15 Even if there was only a partial replacement of Swedish production by imports, this could still plausibly lead to a global emission increase given the low
emission intensity of Swedish industry. For a jurisdiction with a similar energy profile, Québec, we are aware of unpublished studies suggesting that for
commodities such as aluminium the carbon intensity varies by a factor of eight between Québec and China. The effects can thus be quite significant.

The Carbon Tax in Sweden
©2018 Ecofys und adelphi 15
4.3. Co-benefits and side effects
To assess the main co-benefits and side effects, it is important to recall the most significant effects of
the carbon tax. We do this below and identify major co-benefits (+) as well as negative side effects (-):
• Reduction in carbon intensity of energy in buildings and transport through
biomass/biofuels (see 4.1.1 and 4.1.2 above): Unfortunately, this decarbonisation strategy
does not carry the positive co-benefits that other transitions to low-carbon energy bring. In
particular, health impacts from air pollution are comparable to fossil fuels (-) and a high
carbon price can even incentivise transitions that are negative for public health, e.g. from
natural gas to solid biomass (-). Apart from that, there are significant sustainability and climate
concerns with regard to biomass (-). On the positive side, given abundant forest and a lack of
fossil resources, a greater reliance on biomass does increase Swedish energy independence
(+).
• Reduction in carbon intensity of energy in industry, transport and heating through
electrification (see 4.1.1 to 4.1.3 above): While there are concerns with hydroelectricity and
nuclear power as well (-), relying on a greater role for electricity in the energy mix not only
decarbonises the affected sectors, but also leads to very significant health benefits through
avoided air pollution (+). In addition, wind turbines have made primarily caused capacity
additions in Sweden over the last couple of years, suggesting that additional electricity
demand does not necessarily lead to more hydroelectricity or nuclear power (IVA, 2016).
Apart from these health benefits, increased reliance on electricity increases energy
independence (+).
• Reduction in energy intensity in transport and industry (see 4.1.2 and 4.1.3 above):
Reductions in energy intensity through greater energy efficiency share the benefits of carbon
intensity reduction strategies (+)16. In addition, they present additional benefits in the form of
long-term cost savings through reduced energy costs (+). Even in the case of electricity,
which is extremely low-carbon, greater electrical energy efficiency can support
decarbonisation by increasing electricity available for further electrification.
• Increased costs for non-electric energy: In those cases where the carbon tax makes a
cheap form of fossil energy uncompetitive, energy costs increase, at least in the short term
(-). For example, Andersen (2010; pp. 6–7) estimated the overall effect of the carbon and
energy tax reform to be positive for GDP (+). The only negative effect in the long term,
according to Andersen (2010; p. 8), lies in the cost increase for energy-intensive industries (-),
estimated at the time to reach up to 4% of gross operating surplus.
• Revenue generation and the ‘double dividend’ of reducing distortionary taxes: Apart
from the general revenue generating potential that lowered the burden on the government’s
budget (+), the revenues from CO2 taxes can be used to reduce distortionary taxes (+). Since
its implementation, the generated revenue has been put towards reducing income or labour
taxes. There is even the possibility that the carbon tax creates net economic benefit by
allowing the reduction of taxes that create distortions, such as labour taxes that disincentivise
work. This effect is known as the strong form of the ‘double dividend hypothesis’ (Goulder,
1995). While it is unclear whether this holds in the Swedish case, it appears that the carbon
tax has not imposed net negative impacts on the Swedish economy (Andersen, 2010; p. 7).
16 This holds as long as the marginal energy saved is high in carbon intensity. This is plausible in the Swedish context where the amount of low-carbon
energy is more ‘naturally’ constrained than high-carbon energy. For example, an extraordinarily cold winter will lead to additional imported fossil fuels being
burned rather than creating an increase in available sustainable biomass. Likewise, a peak in electricity demand will be satisfied with imported electricity that
is higher carbon than Swedish electricity generation.

The Carbon Tax in Sweden
©2018 Ecofys und adelphi 16
In summary, it is fair to say that the Swedish carbon tax’s positive environmental and public health
impacts are dampened by its effect on increasing bioenergy (negative from a public health and possibly
broader environmental perspective), with greater use of electricity and — even more so — reduced
energy intensity preferable in terms of co-benefits. Given the Swedish import dependence for fossil
fuels, the carbon tax strongly increases energy independence.
It is important to point out that most of the co-benefits and side effects depend on the Swedish context
and are not necessarily transferable to Germany, but depend on technological, economic and legal
conditions17. For example, an expansion of bioenergy to the degree in Sweden would likely be
unfeasible in Germany, limiting the negative impacts. Conversely, a stronger reliance on electricity
would not convey the same co-benefits as in Sweden given the large share of coal generation with
significant negative health consequences. We return to this issue in section 0.
4.4. Success factors and challenges
In terms of success factors and challenges, it makes sense to differentiate between factors and
challenges that have affected the implementation and persistence of the tax (political feasibility) as well
as the tax’s ability to reduce emissions (effectiveness).
4.4.1. Political feasibility
Several factors are frequently cited explaining the political success of the Swedish carbon tax. Its
introduction as part of a larger tax reform and in conjunction with reductions of the related energy tax
reduced its political salience. As Scharin and Wallström (2018; p. 8) argue, many people are likely not
aware of the significance of the carbon tax in the overall tax burden on fuels. In addition, political support
for climate and other environmental policy is very high (Raab, 2017; p. 8).
While, as to be expected, there was some resistance from emission-intensive industries, the reduction
of the energy tax burden as well as exemptions and lowered rates and, later, the movement of emission-
intensive industry under the EU ETS, limited the effective carbon price for these emitters.
Another facilitating factor likely consisted in the ready availability of abatement opportunities. Andersen
(2010; p. 7) makes this argument for emission-intensive industry: The early availability of large amounts
of low-carbon electricity made energy-intensive industries comparatively less exposed to high carbon
prices. As we discussed in 4.1.3, increasing the share of electricity in the energy mix was the major
driver of decreasing carbon intensity of energy in industry. Likewise, a similar argument could be made
for the transition towards district heating as well as the availability of bioenergy resources in heating
and transport.
4.4.2. Effectiveness in reducing emissions
Even a high carbon tax can be ineffective at reducing emissions when abatement opportunities are very
expensive. The success in reducing emissions was greatly facilitated by abundant and affordable low-
carbon electricity (Anderson, 2010; p. 7; Martínez & Silveira, 2013; p. 117), biomass, as well as the
move towards district heating (Bohlin, 1998) presenting a variety of pathways to reduce emissions cost-
17 Because the carbon tax is a technology-neutral instrument, its effects are fundamentally more contextual than that of an instrument which incentivises,
deploys, or mandates a specific technology.

The Carbon Tax in Sweden
©2018 Ecofys und adelphi 17
effectively and without the need of major systemic transformation. For heating, this was possible
through fuel switching (district) and electrification (distributed), while in road transport blending with
biofuels allowed emission reductions largely without new infrastructure. With significant and inelastic
demand for heating18 and transport19 as well as an export-oriented manufacturing sector, emission
reductions through reduced consumption/output have proved challenging.
5 TRANSFERABILITY
5.1. General comparability of the context
Both Sweden and Germany are highly-developed industrialised economies, with similarly ambitious
emission reduction objectives. Importantly, they are also similar in their economic structure and both
feature export-oriented industrial sectors. There are, however, significant differences in the energy
sector to which the carbon tax applies. They are bolded in the comparability column in Table 4.
Differences (a)-(c) are those in context that would affect the carbon tax’s operation and effectiveness
in Germany, an issue we examine in more detail in section 5.3. Differences summarised under (d) are
likely at least partially caused by the carbon tax, they can thus be understood as context factors but
also as results of the tax. We examine the implications of these differences below.
Table 4: Key climate policy and energy indicators to assess comparability of the Swedish and German context (sources in footnotes)
Germany Sweden Comparability
General information
GDP per capita (in USD,
2017)20 44,549.69 53,248.14 Comparable
Exports (in billion USD,
2016)21
1,322 (32.5% of
GDP)
151.4 (33.9%
of GDP) Comparable
Climate policy ambition
2020 GHG emission reduction
goal (compared to1990 in %)
As close as
possible to -40 -40 Comparable
2050 GHG emissions
reduction goal (compared to
1990)
GHG neutrality
(80-95%
reduction)
GHG neutrality
by 2045 Comparable
18 Even in the face of a very high carbon price, residential energy use only decreased by 2.1% between 1990 and 2014, see section 4.1.1.
19 Even in the face of a very high carbon price, road transport kilometres increased, see section 4.1.2.
20 Statista, 2018a and 2018b
21 Central Intelligence Agency, 2018a and 2018b

The Carbon Tax in Sweden
©2018 Ecofys und adelphi 18
Germany Sweden Comparability
Relevant features of the energy system
Population density (per sq.
Km, 2016)22; proxy for
biomass potential per capita.
236 24.36
(a) Not comparable, biomass
expansion infeasible in
Germany
Carbon intensity of electricity
supply (gCO2e/kWh), 201323 485 16
(b) Not comparable,
electrification is less
decarbonising in Germany.
Share of district heating (in
%)24 13.8 51
(c) Not comparable,
decarbonising heating in
Germany involves a higher
share of distributed heating.
Share of biofuels in road
transport (in %)25 4.8 20.8
(d) Not comparable, but can
also be result of the carbon
tax (endogeneity)
Share of electric vehicles in
road transport (in %, 2017)26 1.56 5.28
Primary fuel in district heating Coal, natural gas Biomass
Primary fuels in distributed
heating Natural gas
Electric,
biomass
5.2. Properties of the instrument
An energy tax reform towards a carbon tax would in principle be possible in Germany. Germany’s
current energy taxes are levied within the framework of the 2003 EU Energy Tax Directive, which is
also serving as a legal basis for Sweden’s CO2 tax.
The German energy tax is applied to oil, natural gas, coal and coke products at varying rates depending
on the sector (transport, heating, or process purpose). Electricity output is taxed at EUR 20.5 per MWh;
reduced rates apply in rail transport. Fuels are untaxed when they generate electricity installations larger
than 2 MW. Industrial installations generally receive a 25% tax refund of their total tax liability on diesel,
fuel oil, liquefied petroleum and natural gas (OECD, 2018b), and can further claim a refund depending
on the amount paid under the electricity tax scheme.
Reforming this according to the Swedish model would consist in reducing the general energy tax on
fuels to levy a new tax on fuels based on carbon rather than energy content.
22 Tradingeconomics, 2018a and 2018b
23 Moro & Lonza, 2017
24 Euroheat, 2017
25 European Biofuels Technology Platform, 2015; Svebio.de, 2018
26 European Alternative Fuels Observatory, n.d. a and n.d. b

The Carbon Tax in Sweden
©2018 Ecofys und adelphi 19
An important consideration that needs to be taken into account when transferring the instrument with
an identical design to Germany would be the currently high carbon intensity of German electricity
supply. Because fuels for electricity are exempted from the tax, the carbon tax treats electricity as a
zero-carbon alternative. When carbon tax levels are significantly higher than EU ETS prices that affect
the level of fossil fuels combusted for electricity generation, this would create a strongly misaligned
price signal.
Increasing carbon prices in the power sector can correct this misalignment. This could, for example, be
achieved by reducing the general electricity output tax and replacing it with a carbon tax on electricity
or a price floor for ETS allowances surrendered for power sector emissions as currently advanced by
the French government and other EU Member States27. Other instruments, such as mandates for
renewable electricity, could also achieve the goal of reducing the misalignment by accelerating power
sector decarbonisation28.
In Germany the discussion of carbon tax proposals takes place within the context of the renewable
energy surcharge (‘EEG-Umlage’), other energy levies and taxes, as well as the EU ETS. Thus, apart
from proposals focused on returning revenues equally to all citizens (‘Bürgerlobby Klimaschutz’) or
through income tax reform (Mercator Research Institute on Global Commons and Climate Change),
many proposals focus on using a carbon tax as part of a broader energy tax reform to shift the financing
of the ‘Energiewende’ (proposals sourced from the overview provided by CO2 Abgabe e.V. (2017, 20-
21))29. For example, the expert commission for the monitoring process on ‘Energie der Zukunft’ as well
as Agora Energiewende both propose using the carbon tax to (partially) replace the renewable energy
surcharge, the combined heat and power surcharge (‘KWK Umlage’) as well as other energy taxes.
By aligning levies on energy with their carbon content, it would be possible to have a significantly
stronger carbon price signal without increasing overall energy prices for consumers. For example, rather
than making electricity more expensive irrespective of its carbon content — as happens with the EEG
surcharge levied on electricity consumption — a carbon tax could be designed to make electricity
cheaper in absolute terms by shifting revenue collection to fossil fuels in ESD sectors. Irrespectively of
revenue use, a Swedish-style carbon tax would make electricity relatively cheaper through its non-
inclusion. This would create a situation where electrification would become more attractive, a useful co-
benefit in a situation where electricity decarbonisation is expected to be easier than decarbonising other
forms of energy.
5.3. Potential impacts
The emission-reducing effect of a carbon tax depends on the availability of abatement opportunities at
or below the carbon price level. To get a sense of the potential impact of a similar tax in Germany it is
thus important to understand similarities and differences between abatement options across sectors.
A carbon tax in Germany could trigger solutions that have not been of primary importance in Sweden.
Indeed, rather than stipulating specific solutions ex ante, discovering new mitigation potentials is one
27 A more detailed instrument discussion on this is beyond the scope of this study.
28 The current target of 65% renewable electricity by 2030 would decrease the share of fossil-fuel based electricity from about 51 % today to 35% in 2030.
This would decrease emissions intensity by roughly 30% and, by itself, would not change the picture that Germany’s power mix is comparatively fairly high-
carbon. A shift within the fossil share towards cleaner fossil fuels – primarily, natural gas – could lead to additional reductions in emissions intensity.
29 A third set of proposals is narrowly focused on the power sector or all EU ETS sectors, advocating for a price floor. These proposals are less relevant in
the context of this study focused on emission reduction strategies in ESD sectors.

The Carbon Tax in Sweden
©2018 Ecofys und adelphi 20
of the fundamental strengths of carbon pricing. With that caveat in mind, we discuss the major mitigation
pathways in the Swedish context and their applicability to Germany.
• Decrease in energy intensity: Higher mitigation effects than in Sweden could be expected
as available technologies to increase energy efficiency are comparable but the carbon
intensity is much higher in Germany (reduced energy demand leads to more emissions
reduction). Thus, at least in the beginning, most non-electric energy provided in Germany
would carry a significant carbon price component and incentivise demand reduction and
energy efficiency.
• Reducing carbon intensity of energy through greater use of electricity: Increase of
electricity as input would be equally incentivised but significantly less effective in reducing
German emissions given that the carbon intensity of electricity is about thirty times higher
than in Sweden. Depending on assumptions about the EU ETS, the effect could nonetheless
be as beneficial for European emissions as in Sweden. Thus, the impacts depend on what
one considers the relevant reference frame (German ESD sector emissions, German
emissions, EU ETS sector emissions) as well as assumptions about the EU ETS (also see
the discussion in 0)30.
• Reducing carbon intensity of energy through greater use of bioenergy: Increased use of
bioenergy would be equally incentivised in Germany and likely similarly effective in road
transport. In buildings, the lower share of district heating could reduce the mitigating impact
as fuel switching for distributed heating is costlier and, in addition, requires cost sensitivity of
consumers31. Of course, with a population density ten times that of Sweden, domestic
bioenergy resources are considerably more constrained in Germany than in Sweden. On the
demand side, biomass presents an attractive option to provide dispatchable low-carbon
electricity, which can be used to balance intermittent renewables – it thus makes use in the
power sector rather than in ESD sectors comparatively more attractive. For these two
reasons, the degree to which bioenergy resources are available to decarbonise energy in
ESD sectors is comparatively more limited than in Sweden.
In summary, starting about 30 years later and with a significantly different energy mix and energy policy
priorities, the exact impacts of a Sweden-style carbon tax would likely manifest through different
channels in the German context.
Decreases in energy intensity in transport, heating, and industry would be incentivised more than in
Sweden given higher carbon intensity, whereas electrification would be equally incentivised but have
lesser effects. Technologies that serve important functions for the Energiewende — for example, power-
to-gas, heat pumps or other technologies enabling seasonal energy storage and sector coupling —
could be larger profiteers from a carbon tax than in Sweden given that their energy system value will
push them towards deployment with the carbon pricing strengthening them vis-à-vis fossil alternatives32.
30 When the EU ETS cap is seen as fully fixed in both directions, then the higher carbon intensity of the German electricity supply does not matter because
those emissions are under the EU ETS. Our default assumption is that, through the Market Stability Reserve as well political appetite for additional
stringency contingent on surplus and price levels of allowances, the EU ETS cap is not fully fixed and reducing emissions under the cap can actually reduce
emissions.
31 The party exposed to the carbon price signal of the heating fuel is not necessarily the party that can decide on the technology used.
32 The argument here is that the carbon tax does not stand in isolation, but in the wider climate and energy policy context. In Germany, where nuclear power
is not desired as part of climate policy, and biomass and hydro potentials are relatively more limited than in Sweden, other technologies and sectors would
likely profit from a carbon tax.

The Carbon Tax in Sweden
©2018 Ecofys und adelphi 21
5.4. Experiences from other European carbon taxes
Lessons on transferability can also be learned from the implementation of carbon taxes in other
European countries. After the introduction of the Nordic carbon taxes in the early 1990s, several smaller
European countries introduced carbon taxes as well. Several larger European economies followed suit,
with the Climate Change Levy (CCL) in the UK in the early 2000s — a combined carbon and energy
tax — and, more recently, the French carbon tax33 introduced in 2014.
We focus here on the French experience with a short paragraph on the UK at the end. The French
carbon tax has a comparable sectoral coverage as the Swedish one, covering non-ETS industry,
buildings (heating), non-commercial road transport34 and excluding electricity, aviation and agriculture
alongside some smaller exceptions (Deutsch-Französisches Büro für die Energiewende, 2018; p. 6; for
smaller exceptions see footnote 22). It covers about 40% of emissions (Deutsch-Französisches Büro
für die Energiewende, 2018; p. 4) — slightly less than in Sweden — which makes it the widest-reaching
carbon pricing instrument in France (the EU ETS covers only about 20% of French emissions given
France’s decarbonised electricity sector). As in the Swedish case, the carbon tax is levied on fossil fuels
outside the scope of the EU ETS.
At an initial rate of EUR 7 and a current rate of EUR 44.6/tCO2e the tax rate is at about a third of the
current Swedish carbon tax but comparable to the Swedish tax in its early years (see Figure 3). With a
2030 target of EUR 100/tCO2e and a current policy momentum towards more ambition than the set-out
plan, there is a strong investment signal sent. This is important given that many abatement options
involve long-lived investments such as new heating systems or home insulation. Similar to Sweden,
electrification in France is a strongly decarbonising option while, comparable to Germany, bioenergy
per capita is more limited than in Sweden.
The tax is estimated to have reduced emissions by about 1 MtCO2e in road transport and 2 MtCO2e in
buildings in 2017, which corresponds to about 0.78% and 1.75% of emissions of annual sector
emissions, respectively (abatement data as cited in Deutsch-Französisches Büro für die Energiewende
2018; p. 8; sectoral emissions data from OECD, 2016). As in Sweden, then, emission reductions are
estimated to be strongest in the buildings sector (heating). Demand for mobility and heating is fairly
inelastic (also see discussions in sections 4.1.1 and 4.1.2). Therefore, it can be expected that most
emission reductions are likely to come from changed investment decisions, e.g. buying an electric car
or installing heat pumps rather than fossil fuel alternatives. The effect of the policy is thus likely to
increase with the duration as more consumers face investment decisions under a carbon tax. For the
Swedish case, Andersson (2017; also see Figure 4 of this paper) estimates the mitigation impact of the
carbon tax in road transport to have tripled between 2000 and 2005. In this timeframe the carbon tax
increased from about EUR 40/tCO2e to about EUR 100/tCO2e, suggesting that significant additional
mitigation potential could be unlocked with increasing tax rates35.
While it is still very early in the policy's development and we could not identify ex-post analyses of the
French case, we expect significant mitigation effects. With lower tax rates than in Sweden and lower
potentials for bioenergy substituting fossil fuels, the effect could be somewhat smaller. However,
quantifying this intuition would require analysis beyond the scope of this paper. Ultimately, apart from
33 Officially, the Contribution for Climate and Energy (contribution climat-énergie); for simplicity we will refer to it as French carbon tax in the remainder.
34 Heavy-duty vehicles and taxis can receive reimbursements while agricultural and construction vehicles profit from reduced rates. The carbon tax thus
mostly targets private road transport.
35 Of course, the abatement options in France in 2018 are likely different than in Sweden in the early 2000s, this should be more seen as a stylised argument
for an increasing tax rate rather than a precise estimate/prediction on additional effects.

The Carbon Tax in Sweden
©2018 Ecofys und adelphi 22
the abatement cost structure, the effect also depends on the policy mix as additional policies, such as
the bonus malus system for car purchases, can lead to positive synergies leading to additional
abatement36.
The UK’s Climate Change Levy (CCL) has been the subject of rigorous econometric analyses and has
been found to have strong causal effects. Martin et al. (2014) demonstrate strong emission reduction
effects for energy-intensive industrial firms, while Abrell et al. (forthcoming) show that the Carbon Price
Support (CPS), the implementation of the CCL in the electricity sector, has been highly effective at
contributing to the rapid decarbonisation of the UK power sector.
5.5. Conclusion
There is a strong agreement that a broadly applied, robust carbon price signal is one of the most efficient
tools to achieve emission reductions in the short term (Abrell et al., forthcoming; Barazini et al., 2017;
Martin et al., 2014; Murray & Rivers, 2015) and, crucially, also to facilitate — alongside other policy
instruments —deep decarbonisation in the long term (Tvinnereim & Mehling, 2018). While in Germany
such a carbon price signal is provided by the EU ETS for the electricity sector and large industrial
facilities, about 60% of German emissions are not under a carbon price. Not surprisingly, then,
introducing a carbon tax in Germany has gained some attention in the policy debate, often in the context
of a broader reform of energy taxes and levies and the Energiewende as well as in the context of the
expected gap to the German ESD target for 2020.
It is against this backdrop that examining the carbon tax of Sweden, one of the most successful climate
policy pioneers, is of the utmost relevance to discern which role the tax has played in achieving Swedish
emission reductions and whether and how this success might be transferred to the German context.
To assess this question, we traced the impact of the Swedish carbon tax across the three main levers
in which a carbon price levied on energy can incentivise mitigation, namely (1) output/consumption, (2)
energy intensity, and (3) carbon intensity of energy. We examined this across the three ESD sectors
with the most significant energy-related emissions, namely buildings (heating), road transport, and small
industry37. Apart from the detailed points discussed in the preceding sections, there are four broad
conclusions that can be drawn from this for a carbon tax proposal in Germany:
First, in all three sectors the main levers in which emissions are reduced are through reductions in
energy intensity and carbon intensity of energy ((2) and (3) above). This is good news because policies
that can succeed by incentivising cleaner, more efficient, technologies and fuels appear more politically
palatable than policies requiring demand/output reductions38.
Second, while the technological and economic decisions incentivised in Germany would doubtlessly be
different than in Sweden, there is no fundamental reason that a similar carbon tax could not also be
highly effective in Germany. Even when the energy sources profiting most from the Swedish carbon
36 For example, it could be the case that the combination of bonus malus and carbon tax leads to many consumers switching to lower-emission vehicles,
while neither of those policies would have much effect on its own.
37 Of course, the more emission-intensive facilities in industry are now under the EU ETS. However, the evidence for Sweden that we review in the industrial
sector also provided evidence for the time in which Swedish industry was completely under the tax.
38 This is not to say that demand reductions are not an effective and desirable path towards emission reductions but rather that it is a strength, in terms of
political robustness and effectiveness, that it is not necessary for the policy to succeed. In other words, a carbon tax in Germany could be successful even if
industry covered by it decides (as in Sweden) to increase production levels and, as in Sweden, demand for heating and mobility does not significantly
decrease or even increase.

The Carbon Tax in Sweden
©2018 Ecofys und adelphi 23
tax, i.e. biomass, hydroelectricity, and nuclear power, are unfeasible or undesirable in the German
context, there are multiple pathways towards emission reductions, and a carbon tax would facilitate all
of them. Indeed, because the carbon tax does not exist in a vacuum but, inter alia, alongside technology-
specific deployment policies and legal requirements, it would enable desired technologies in the context
of the Energiewende while, at the same time, strengthening cost efficiency.
Third, and related, not taxing fossil fuels combusted for electricity as is the case under the Swedish tax,
could be problematic in the German context when the carbon tax is high compared to other instruments
affecting choices between electric and non-electric energy as it would mask the carbon intensity of
electricity. However, there is also an argument for that exclusion with the electricity sector being under
the EU ETS. Thus, coverage of the electricity sector and the resulting interactions with the EU ETS
would need to be carefully considered.
Fourth, with regard to political feasibility and implementation, it is important to note that the favourable
option of introducing a carbon tax as part of a (energy) tax reform is also available in Germany. Indeed,
discussions around restructuring Energiewende financing through a carbon tax open a window for this
debate. As in Sweden, a carbon tax could first be introduced at a moderate level, with increases
becoming politically easier as decarbonisation progresses.

The Carbon Tax in Sweden
©2018 Ecofys and adelphi 24
6 REFERENCES
Abrell, J., Kosch, M. & S. Rausch. (forthcoming) Impacts of the UK Carbon Price Floor: A Machine
Learning Approach
Acemoglu, D., Akcigit, U., Hanley, D., & Kerr, W. (2016). Transition to clean technology. Journal of
Political Economy, 124(1), 52-104.
Åkerfeldt, Susanne (2011): Swedish energy and CO2 taxes. National design within an EU framework.
Conference on “Environmentally Related Taxes and Fiscal Reform”.
http://www.dt.mef.gov.it/export/sites/sitodt/modules/documenti_it/eventi/eventi/SESSION_I_-
_SUSANNE_AKERFELDT_x6x.pdf
Åkerfeldt, Susanne; and Hammar, Henrik (2015): CO2 Taxation in Sweden. Experiences of the Past
and Future Challenges. http://www.un.org/esa/ffd/wp-
content/uploads/2016/12/13STM_Article_CO2-tax_AkerfeldtHammar.pdf
Andersen, P., & Skou, M. (2010). Europe’s experience with carbon-energy taxation. SAPI EN. S.
Surveys and Perspectives Integrating Environment and Society, (3.2).
Andersen, Mikael Skou; and Ekins, Paul (2009): Carbon Energy Taxation. Lessons from Europe. In:
Oxford University Press, New York.
Andersson, Julius (2017): Cars, carbon taxes and CO2 emissions. Centre for Climate Change
Economics and Policy Working Group Paper No. 238. http://www.lse.ac.uk/GranthamInstitute/wp-
content/uploads/2017/03/Working-paper-212-Andersson_update_March2017.pdf
Baranzini, A., Van den Bergh, J. C., Carattini, S., Howarth, R. B., Padilla, E., & Roca, J. (2017).
Carbon pricing in climate policy: seven reasons, complementary instruments, and political
economy considerations. Wiley Interdisciplinary Reviews: Climate Change, 8(4), e462.
BBC (2016): Sweden profile – Overview. http://www.bbc.com/news/world-europe-17961249
BMWi (Bundesministerium für Wirtschaft und Energie, 2017): Energieeffizienz in Zahlen. Berlin.
https://www.bmwi.de/Redaktion/DE/Publikationen/Energie/energieeffizienz-in-
zahlen.pdf?__blob=publicationFile&v=10
Bohlin, Folke (1998): The Swedish Carbon Dioxide Tax: Effects on Biofuel Use and Carbon Dioxide
Emissions. In: Biomass and Bioenergy 15 (4/5), pp. 283-291.
Brännlund, Runar; Lundgren, Tommy; and Marklund, Per-Plov (2014): Carbon intensity in production
and the effects of climate policy – Evidence from Swedish industry. In: Energy Policy 67 (2014),
pp. 844-857. http://dx.doi.org/10.1016/j.enpol.2013.12.012
Central Intelligence Agency (2018a): The World Factbook. Germany.
https://www.cia.gov/library/Publications/the-world-factbook/geos/gm.html
Central Intelligence Agency (2018b): The World Factbook. Sweden.
https://www.cia.gov/library/Publications/the-world-factbook/geos/sw.html
Clean Energy Wire (2017): German carbon tax most efficient way to meet climate goals.
https://www.cleanenergywire.org/news/german-carbon-tax-most-efficient-way-meet-climate-goals-
study
Clean Energy Wire (2018): Germany’s greenhouse gas emissions and climate targets.
https://www.cleanenergywire.org/factsheets/germanys-greenhouse-gas-emissions-and-climate-
targets
Climate Transparency (2017): Brown to green: The G20 transition to a low-carbon economy.
https://germanwatch.org/en/download/18771.pdf

The Carbon Tax in Sweden
©2018 Ecofys und adelphi 25
CO2 Abgabe e.V. (2017): Welche Preise haben und brauchen Treibhausgase?
https://co2abgabe.de/wp-
content/uploads/2017/06/Diskussionspapier_CO2_Abgabe_Stand_2017_06_18.pdf
EC (2017): Electricity prices, first half of year, 2015-2017. http://ec.europa.eu/eurostat/statistics-
explained/index.php?title=File:Electricity_prices,_first_half_of_year,_2015-2017.png
Ecofys (2016): Prices and costs of EU energy. Final report.
https://www.isi.fraunhofer.de/content/dam/isi/dokumente/ccx/2016/report_ecofys2016.pdf
Ekins, Paul; and Speck, Stefan (1999): Competitiveness and Exemptions From Environmental Taxes
in Europe. In: Environmental and Resource Economics 13, pp. 369-396.
Ericsson, K., & Werner, S. (2016). The introduction and expansion of biomass use in Swedish district
heating systems. Biomass and bioenergy, 94, 57-65.
EUR-Lex (2015): Commission Staff Working Document. Country Factsheet Sweden. https://eur-
lex.europa.eu/legal-content/EN/TXT/?uri=CELEX%3A52015SC0240
Euroheat (2017): District heating in Europe. Country profiles. https://www.euroheat.org/knowledge-
centre/district energy-germany/
European Alternative Fuels Observatory (eafo, n.d. a): Germany. http://www.eafo.eu/content/germany
European Alternative Fuels Observatory (eafo, n.d. b): Sweden. http://www.eafo.eu/content/sweden
European Biofuels Technology Platform (2015): Biofuels in Germany. Biofuel Fact Sheet.
http://www.etipbioenergy.eu/images/EBTP_Factsheet_Germany.pdf
European Commission (2018a): Indirect Taxes – Other Indirect.
http://ec.europa.eu/taxation_customs/tedb/taxDetails.html?id=508/1483228800
European Commission (2018b): Effort sharing. https://ec.europa.eu/clima/policies/effort_en
Fraunhofer (2018): Stromerzeugung in Deutschland im Jahr 2017.
https://www.ise.fraunhofer.de/content/dam/ise/de/documents/publications/studies/daten-zu-
erneuerbaren-energien/Stromerzeugung_2017.pdf
Government Offices of Sweden (2015): Sweden’s Export Strategy.
http://www.regeringen.se/4b003b/contentassets/e2b2f540107143e99907cbe604a87ce2/swedens-
export-strategy.pdf
Government Offices of Sweden (2017): Den största klimatsatsningen någonsin.
https://www.regeringen.se/pressmeddelanden/2017/09/den-storsta-klimatsatsningen-nagonsin/
Goulder, L. H. (1995). Environmental taxation and the double dividend: a reader's guide. International
tax and public finance, 2(2), 157-183.
IEA (2017a): Energy, Carbon Dioxide and Sulphur Taxation.
https://www.iea.org/policiesandmeasures/pams/sweden/name-21011-en.php
IEA (2017b): Sweden – Energy System Overview. https://www.iea.org/media/countries/Sweden.pdf
IVA (Royal Swedish Academy of Engineering Sciences, 2016): Electricity Production in Sweden.
IVA’s Electricity Crossroad s project. https://www.iva.se/globalassets/201604-iva-vagvalel-
elproduktion-english-c.pdf
Lin, Boqiang; and Li, Xuehui (2011): The effect of carbon tax on per capita CO2 emissions. In: Energy
Policy 39 (2011), pp. 5137-5146.
Kahn (n.d.): Sweden – on the track to no net emissions.
https://www.norden.ee/images/rohemajandus/info/climate_oct2013/Jon_Kahn_climate_23oct13.pd
f
Martin, R., De Preux, L. B., & Wagner, U. J. (2014). The impact of a carbon tax on manufacturing:
Evidence from microdata. Journal of Public Economics, 117, 1-14.

The Carbon Tax in Sweden
©2018 Ecofys und adelphi 26
Martínez, Pardo Clara Inés and Silveira De Campos Semida (2013): Energy efficiency and CO2
emissions in Swedish manufacturing industries. In: Energy Efficiency 6(1). DOI: 10.1007/s12053-
012-9159-5
Moro, Alberto and Lonza, Laura (2017): Electricity carbon intensity in European member States:
Impacts on GHG emissions of electric vehicles. In: Transportation Research Part D (2017).
http://dx.doi.org/10.1016/j.trd.2017.07.012.
Murray, B., & Rivers, N. (2015). British Columbia’s revenue-neutral carbon tax: A review of the latest
“grand experiment” in environmental policy. Energy Policy, 86, 674-683.
Myhr (2018): Trafikarbete på svenska vägar. Vehicles kilometres on Swedish roads.
https://www.trafa.se/globalassets/statistik/trafikarbete/2018/trafikarbete-pa-svenska-vagar-1990-
2017.pdf
OECD (2016): Emissions data. oe.cd/emissionsdata
OECD (2018a): Taxing Energy Use. Sweden. https://www.oecd.org/tax/tax-policy/taxing-energy-use-
2018-sweden.pdf
OECD (2018b): Taxing Energy Use 2018. Germany. https://www.oecd.org/tax/tax-policy/taxing-
energy-use-2018-germany.pdf
OECD (n.d.): https://www.oecd.org/tax/tax-policy/environmental-tax-profile-sweden.pdf
OECD (n.d.): https://www.oecd.org/tax/tax-policy/environmental-tax-profile-germany.pdf
Raab, Ulrika (2017): Carbon tax – determining the tax rate. Swedish Experiences. Presentation at the
PMR Technical Workshop on Carbon Tax: Design and Implementation in Practice.
RAC foundation (2018): EU petrol prices. https://www.racfoundation.org/data/european-petrol-prices
Sathre, Roger; and Gustavsson, Leif (2007): Effects of energy and carbon taxes on building material
competitiveness. In: Energy and Buildings 39 (2007), pp. 488-494.
doi:10.1016/j.enbuild.2006.09.005
SCB (2017a): Electricity supply and use 2001-2016 (GWh). http://www.scb.se/en/finding-
statistics/statistics-by-subject-area/energy/energy-supply-and-use/annual-energy-statistics-
electricity-gas-and-district-heating/pong/tables-and-graphs/electricity-supply-and-use-20012015-
gwh/
SCB (2017b): Industry allocated environmental taxes 2015. https://www.scb.se/en/finding-
statistics/statistics-by-subject-area/environment/environmental-accounts-and-sustainable-
development/system-of-environmental-and-economic-accounts/pong/statistical-news/industry-
allocated-environmental-taxes-2015/
Scharin & Wallström (2018): The Swedish CO2 tax – an overview. http://www.enveco.se/wp-
content/uploads/2018/03/Anthesis-Enveco-rapport-2018-3.-The-Swedish-CO2-tax-an-overview.pdf
Statista (2018a): Germany gross domestic product (GDP) per capita in current prices from 2012 to
2022 (in U.S. dollars). https://www.statista.com/statistics/295465/germany-gross-domestic-
product-per-capita-in-current-prices/
Statista (2018b): Sweden gross domestic product (GDP) per capita in current prices from 2012 to
2022 (in U.S. dollars). https://www.statista.com/statistics/375643/gross-domestic-product-gdp-per-
capita-in-sweden/
Sumner, Jenny; Bird, Lori; and Smith, Hillary (2009): Carbon Taxes: A Review of Experiences and
Policy Design Considerations. Technical Report NREL/TP-6A2-47312.
Svebio.se (2018): 2017 another record year for biofuels in Sweden.
https://www.svebio.se/en/press/press-releases/2017-another-record-year-biofuels-sweden/
Sweden.de (2018): Energy Use in Sweden. https://sweden.se/society/energy-use-in-sweden/

The Carbon Tax in Sweden
©2018 Ecofys und adelphi 27
Swedish Energy Agency (2018): Facts and Figures 2018.
http://www.energimyndigheten.se/en/news/2018/energy-in-sweden---facts-and-figures-2018-
available-now/
Swedish Environmental Protection Agency (2017): Report for Sweden on assessment of projected
progress.https://www.naturvardsverket.se/upload/miljoarbete-i-samhallet/uppdelat-efter-
omrade/klimat/prognoser-for-Sveriges-utslapp/prognoser-for-Sveriges-utslappreport-sweden-
assessment-projected-progress-2017.pdf
Swedish Environmental Protection Agency (2018): Greenhouse gas emissions and removals.
http://www.scb.se/en/finding-statistics/statistics-by-subject-
area/environment/emissions/greenhouse-gas-emissions-and-removals/
The Local (2018): What you need to know about Sweden’s proposed new airline tax.
https://www.thelocal.se/20170608/what-you-need-to-know-about-swedens-proposed-new-airline-ta
Tradingeconomics (2018a) Germany – population density per sq. km.
https://tradingeconomics.com/germany/population-density-people-per-sq-km-wb-data.html
Tradingeconomics (2018b) Sweden – population density per sq. km.
https://tradingeconomics.com/sweden/population-density-people-per-sq-km-wb-data.html
Tvinnereim, E., & Mehling, M. (2018). Carbon pricing and deep decarbonisation. Energy Policy, 121,
185-189.
Umweltbundesamt (2017): Climate footprint 2016: Transport sector and cool weather cause spike in
emissions. https://www.umweltbundesamt.de/en/press/pressinformation/climate-footprint-2016-
transport-sector-cool
Umweltbundesamt (2017): Emissionen des Verkehrs.
https://www.umweltbundesamt.de/daten/verkehr/emissionen-des-verkehrs#textpart-1
UNFCCC 2017: Sweden Plans to Be Carbon Neutral by 2045. https://unfccc.int/news/sweden-plans-
to-be-carbon-neutral-by-2045https://unfccc.int/news/sweden-plans-to-be-carbon-neutral-by-2045
Vogt-Schilb, A., & Hallegatte, S. (2014). Marginal abatement cost curves and the optimal timing of
mitigation measures. Energy Policy, 66, 645-653.
Werner, Sven (2017): District heating and cooling in Sweden. In: Energy 126 (2017), pp. 419-429.
https://doi.org/10.1016/j.energy.2017.03.052
World Bank (2017): State and Trends of Carbon Pricing 2017. Washington DC.
https://openknowledge.worldbank.org/bitstream/handle/10986/28510/wb_report_171027.pdf?sequ
ence=7
World Bank (2018): Research and development expenditure (% of GDP).
https://data.worldbank.org/indicator/GB.XPD.RSDV.GD.ZS

The Carbon Tax in Sweden
©2018 Ecofys and adelphi 28
7 APPENDIX
Appendix 1: Trends in buildings not likely driven by the carbon tax
Transitioning to district heating
Bohlin (1998, p. 289) also hypothesises that the carbon tax might have contributed towards amplifying
a move towards district heating by affecting investment decisions. This argument stems from the fact
that it is more efficient and easier to save emissions when moving to district heating (i.e. the average
carbon cost should become lower). However, the evidence for this claim is weak at best. The move
towards district heating started well before the carbon tax and the carbon tax has not altered the
trajectory of district heating expansion.
While it is possible that expansion would have levelled off in the carbon tax’s absence, we find it more
plausible to assume that district heating, through its advantage in higher energy efficiency, would have
continued to spread also in the absence of the carbon tax. Importantly, the carbon tax has, through the
tax swap with reduction of the general energy tax, even reduced incentives for energy efficiency
whenever the reduced energy tax is not outweighed by the carbon tax signal (i.e. when the carbon
intensity of energy is low, the overall signal to consume less energy, e.g. go to higher efficiency through
district heating, is weakened). We thus believe that the carbon tax has not been the primary driver of
district heating expansion, even though it has played an important role in the decarbonisation of the
district heating supply (see above).
Changes in the composition of electricity-based heating technology
Since electricity is not under the carbon tax, the carbon tax cannot explain the shift from electric heating
(resistance heaters) to heat pumps (using electricity to pump the heat). The latter use less electricity
per heat output, i.e. are more efficient, but the carbon tax does not reward consuming less electricity.
In other words, to the carbon tax there is no difference between resistance heaters that declined in
share and heat pumps that increased in share.
The relative shift from resistance heaters to heat pumps is thus likely driven by a combination of
increasing electricity prices, the energy tax levied on electricity output (distinct from the carbon tax and
not in proportion to carbon content), investment subsidies for heat pumps, and changes in relative
technology cost.
In terms of emissions consequences, the shift from resistance heaters to heat pumps can nonetheless
be significant by reducing electricity demand in heating (higher efficiency) which allows an easier
expansion of electrification through lower cost and less pressure on electricity demand. Nonetheless,
this effect is not plausibly driven by the carbon tax.