the business benchmark on farm animal welfare 2016 … · this is the fifth business benchmark on...
TRANSCRIPT
The Business Benchmark on Farm Animal Welfare
2016 ReportNicky Amos and Dr Rory Sullivan
2 2016 REPORT
SETTING THE SCENEThis is the fifth Business Benchmark on Farm Animal Welfare (BBFAW) report, following previous Benchmarks in 2012, 2013, 2014 and 20151 . It describes how global food companies are managing and reporting on farm animal welfare, and assesses the progress that has been made since the first Benchmark report. We focus, in particular, on progress over the past year, analysing the factors that are driving improvements in corporate practice and performance on farm animal welfare and identifying what we see as the major obstacles to progress.
ABOUT THE BUSINESS BENCHMARK ON FARM ANIMAL WELFAREThe Business Benchmark on Farm Animal Welfare (BBFAW) is designed to drive higher farm animal welfare standards in the world’s leading food businesses. Its aims are: • To provide investors with the information they need to understand the business implications
of farm animal welfare for the companies in which they are invested.
• To provide investors, governments, academics, NGOs, consumers and other stakeholders with an independent, impartial and reliable assessment of individual company efforts to adopt higher farm animal welfare standards and practices.
• To provide guidance to companies interested in improving their management of and reporting on farm animal welfare issues.
BBFAW’s key tool for the delivery of these objectives is an annual Benchmark of food companies’ management and reporting on farm animal welfare. BBFAW also has an extensive programme of structured engagement with investors and with companies; this engagement encourages investors to pay more attention to farm animal welfare in their investment processes and in their company dialogue, and encourages companies to improve their practices, performance and reporting on farm animal welfare. BBFAW produces a range of guidance and other materials for companies and investors on issues such as the business case for farm animal welfare, best practices in management and reporting, and new and forthcoming farm animal welfare-related regulations and policies2.
Governance BBFAW was originally developed with the support, technical expertise and funding of leading farm animal welfare organisations Compassion in World Farming and World Animal Protection. In 2014, Coller Capital joined as an additional partner.
The BBFAW Steering Committee, comprising senior members from each of the funding partners, oversees the BBFAW programme’s strategic development and budget.
The programme is managed by an independent Secretariat. In this role, Nicky Amos CSR Services Ltd is responsible for providing an Executive Director and other resources necessary to coordinate the development of the Benchmark programme, to conduct the company research and evaluations, and to engage with investors, companies and other stakeholders.
The development of the Benchmark is overseen by a Technical Working Group (TWG) comprising technical experts, researchers and food business managers, and expert advisors on investor engagement and corporate responsibility.
1Previous Benchmark reports can be downloaded from http://www.bbfaw.com/publications
2 These can be found at http://www.bbfaw.com/publications
EXECUTIVE SUMMARY
EXECUTIVE SUMMARY
3 2016 REPORT
Benchmark StructureThe Benchmark assessed company approaches to farm animal welfare based on their published information in five core areas: • Management Commitment and Policy including overarching farm animal welfare policies as well
as specific policies on issues such as close confinement and long-distance transport.
• Governance and Management including management oversight, farm animal welfare-related objectives and targets, internal controls and supply chain management.
• Leadership and Innovation including research and development and customer and client engagement.
• Performance Reporting including progress reporting (against policies/objectives and targets); input-based measures (e.g. production systems, such as cage-free systems).
• Performance Impact including outcome-based measures (e.g. species-specific indicators of well-being).
To ensure consistency with previous iterations of the Benchmark, the questions and the associated scoring remain relatively unchanged. We have however made some minor changes to the Benchmark questions that are used to generate the company rankings:
• We have added a new question (Question 21) on whether companies report on the proportion of animals that are free from routine mutilations in the Performance Reporting section. This question – which offered a maximum score of five points – was included in the 2016 Benchmark scoring.
• We moved the question on the reporting of progress and trends in performance from the section on Governance and Management to the Performance Reporting section. We have not altered the wording or weighting of this question. However, this change means that the overall weighting of the Performance Reporting section has increased from 10% in 2015 to 17% in 2016, in line with our longer-term aim for the Benchmark to focus on performance rather than exclusively on management processes.
EXECUTIVE SUMMARY
4 2016 REPORT
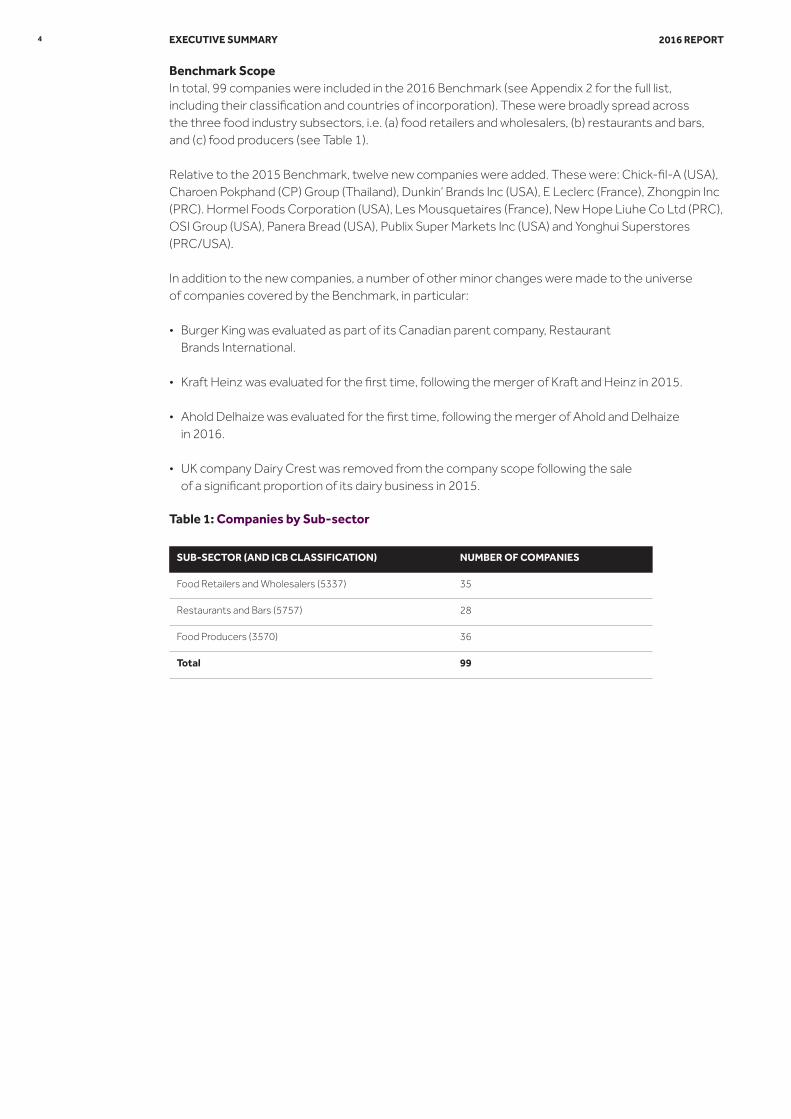
SUB-SECTOR (AND ICB CLASSIFICATION) NUMBER OF COMPANIES
Food Retailers and Wholesalers (5337) 35
Restaurants and Bars (5757) 28
Food Producers (3570) 36
Total 99
Benchmark ScopeIn total, 99 companies were included in the 2016 Benchmark (see Appendix 2 for the full list, including their classification and countries of incorporation). These were broadly spread across the three food industry subsectors, i.e. (a) food retailers and wholesalers, (b) restaurants and bars, and (c) food producers (see Table 1). Relative to the 2015 Benchmark, twelve new companies were added. These were: Chick-fil-A (USA), Charoen Pokphand (CP) Group (Thailand), Dunkin’ Brands Inc (USA), E Leclerc (France), Zhongpin Inc (PRC). Hormel Foods Corporation (USA), Les Mousquetaires (France), New Hope Liuhe Co Ltd (PRC), OSI Group (USA), Panera Bread (USA), Publix Super Markets Inc (USA) and Yonghui Superstores (PRC/USA).
In addition to the new companies, a number of other minor changes were made to the universe of companies covered by the Benchmark, in particular:
• Burger King was evaluated as part of its Canadian parent company, Restaurant Brands International.
• Kraft Heinz was evaluated for the first time, following the merger of Kraft and Heinz in 2015.
• Ahold Delhaize was evaluated for the first time, following the merger of Ahold and Delhaize in 2016.
• UK company Dairy Crest was removed from the company scope following the sale of a significant proportion of its dairy business in 2015.
Table 1: Companies by Sub-sector
EXECUTIVE SUMMARY
5 2016 REPORT
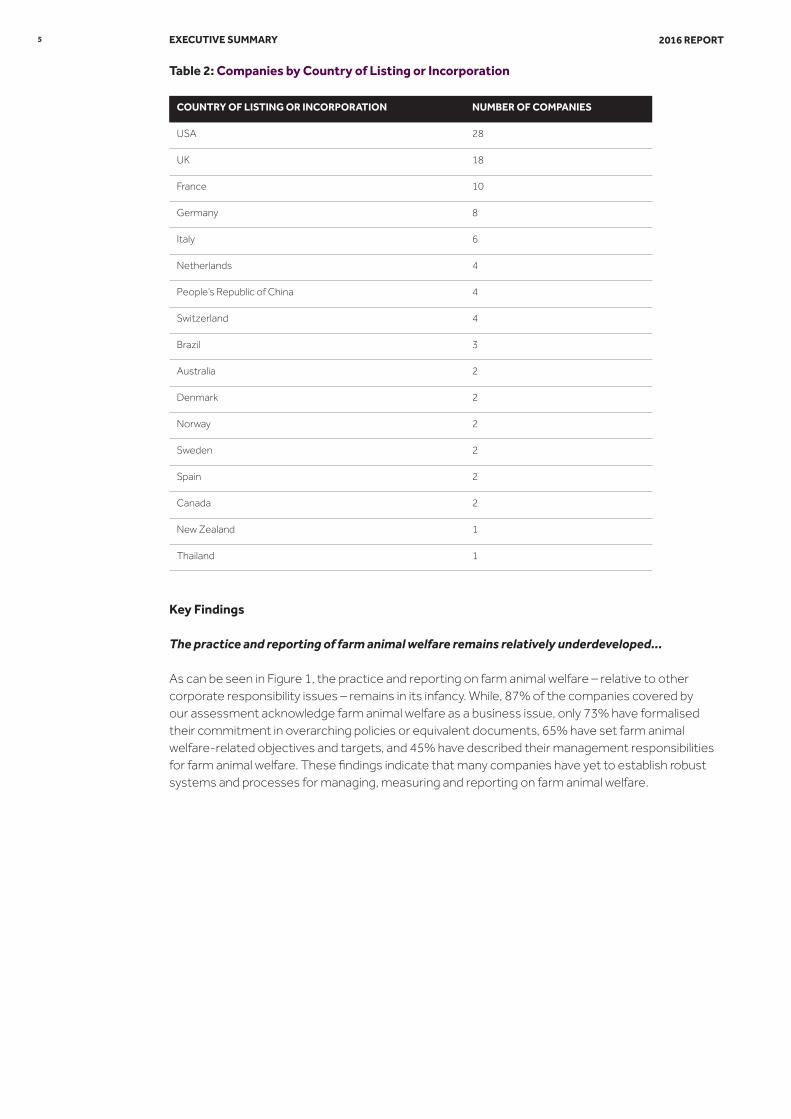
COUNTRY OF LISTING OR INCORPORATION NUMBER OF COMPANIES
USA 28
UK 18
France 10
Germany 8
Italy 6
Netherlands 4
People’s Republic of China 4
Switzerland 4
Brazil 3
Australia 2
Denmark 2
Norway 2
Sweden 2
Spain 2
Canada 2
New Zealand 1
Thailand 1
Key Findings
The practice and reporting of farm animal welfare remains relatively underdeveloped…
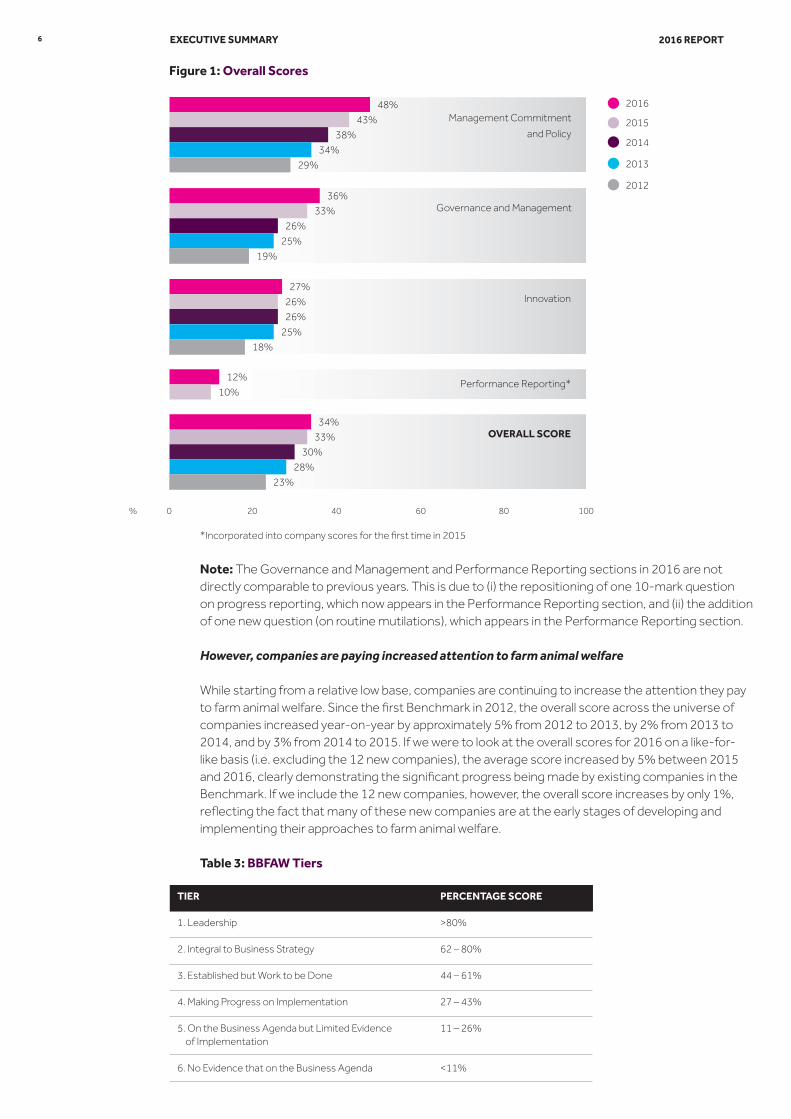
As can be seen in Figure 1, the practice and reporting on farm animal welfare – relative to other corporate responsibility issues – remains in its infancy. While, 87% of the companies covered by our assessment acknowledge farm animal welfare as a business issue, only 73% have formalised their commitment in overarching policies or equivalent documents, 65% have set farm animal welfare-related objectives and targets, and 45% have described their management responsibilities for farm animal welfare. These findings indicate that many companies have yet to establish robust systems and processes for managing, measuring and reporting on farm animal welfare.
Table 2: Companies by Country of Listing or Incorporation
EXECUTIVE SUMMARY
6 2016 REPORT
*Incorporated into company scores for the first time in 2015
Note: The Governance and Management and Performance Reporting sections in 2016 are not directly comparable to previous years. This is due to (i) the repositioning of one 10-mark question on progress reporting, which now appears in the Performance Reporting section, and (ii) the addition of one new question (on routine mutilations), which appears in the Performance Reporting section. However, companies are paying increased attention to farm animal welfare
While starting from a relative low base, companies are continuing to increase the attention they pay to farm animal welfare. Since the first Benchmark in 2012, the overall score across the universe of companies increased year-on-year by approximately 5% from 2012 to 2013, by 2% from 2013 to 2014, and by 3% from 2014 to 2015. If we were to look at the overall scores for 2016 on a like-for-like basis (i.e. excluding the 12 new companies), the average score increased by 5% between 2015 and 2016, clearly demonstrating the significant progress being made by existing companies in the Benchmark. If we include the 12 new companies, however, the overall score increases by only 1%, reflecting the fact that many of these new companies are at the early stages of developing and implementing their approaches to farm animal welfare.
Table 3: BBFAW Tiers
Figure 1: Overall Scores
EXECUTIVE SUMMARY
TIER PERCENTAGE SCORE
1. Leadership >80%
2. Integral to Business Strategy 62 – 80%
3. Established but Work to be Done 44 – 61%
4. Making Progress on Implementation 27 – 43%
5. On the Business Agenda but Limited Evidence of Implementation
11 – 26%
6. No Evidence that on the Business Agenda <11%
0 20 60 100
2016
2014
2013
2012
2015
40 80
Governance and Management
Innovation
Performance Reporting*
OVERALL SCORE
29%
34%
38%
43%
48%
19%
25%
26%
33%
36%
18%
25%
26%
26%
27%
10%
12%
23%
28%
30%
33%
34%
%
Management Commitment
and Policy

7 2016 REPORT
Figure 2: Company Rankings
23 23 21
1 - Leadership
2 - Integral to Business Strategy
3 - Established But Work to be Done
TIER20
12 (
68 c
ompa
nies
)20
13 (7
0 co
mpa
nies
)
2014
(80
com
pani
es)
0
3
6
2
5
10
3
7
14 16
4 - Making Progress on Implementation
5 - On the Business Agenda but Limited Evidence of Implementation
18
18
16
14
16
19
27
Non-mover
Up at least 1 tier
Down at least1 tier
New company
2015
(90
com
pani
es)
2016
(99
com
pani
es)
4
7
19
6
7
22
22
24
18
6 - No Evidence that on the Business Agenda
Co
op
Gro
up
(Sw
itzer
land
)
Cra
nsw
ick
Mar
ks &
Spe
ncer
Mig
ros
No
ble
Foo
ds
Wai
tro
se
BR
F
Car
gill
Co
-op
(UK
)
Gre
ggs
McD
ona
ld’s
Tes
co
Uni
leve
r
Arla
Fo
ods
Bar
lilla
Dan
ish
Cro
wn
Ferr
ero
Frie
slan
dCam
pina
Gro
upe
Dan
one
Ho
rmel
Fo
ods
J S
ains
bury
JBS
Kau
fland
Met
ro
Mitc
hells
& B
utle
rs
Nes
tlé
Prem
ier F
oo
ds
Sode
xo
Subw
ay
Sysc
o C
orp
Tyso
n Fo
ods
Vio
n F
oo
d G
roup
Wm
Mo
rris
on
Wal
mar
t
Wen
dy’s
Aho
ld D
elha
ize
2 S
iste
rs F
oo
d G
roup
Ald
i No
rd
Ald
i Süd
Ara
mar
k
Car
refo
ur
Chi
potle
M
exic
an G
rill
Co
mpa
ss G
roup
Co
stco
Who
lesa
le
Dea
n Fo
ods
Font
erra
Gen
eral
Mills
Kro
ger
Lidl
Lobl
aw
Mar
frig
Mo
ndel
ēz
Pane
ra B
read
Rew
e G
roup
WH
Gro
up
Whi
tbre
ad
Wo
olw
ort
hs
(Aus
trai
lia)
AB
F
Alb
erts
ons
Cam
st
Chi
ck-fi
l-A
Co
nAgr
a
Dar
den
Res
taur
ants
Dun
kin’
Bra
nds
Edek
a Z
entr
ale
Elio
r
Gru
ppo
Cre
mo
nini
Gru
ppo
Ver
one
si
ICA
Gru
ppen
Les
Mo
usqu
etai
res
Mar
s In
c
New
Ho
pe L
iuhe
OS
I Gro
up
Publ
ix
Res
taur
ant B
rand
s In
tern
atio
nal
SSP
Gro
up
Star
buck
s
Targ
et
Ter
rena
Gro
up
Wes
farm
ers
Yum
! Bra
nds
Aut
ogr
ill
Cas
ino
Cha
roen
Po
kpha
nd
Do
min
o’s
Piz
za
Gro
up P
lc
E Le
cler
c
El C
ort
es In
glés
Gat
egro
up
Gro
upe
Auc
han
Gro
upe
Lact
alis
Hen
an Z
hong
pin
JD W
ethe
rspo
on
Kra
ft H
einz
Mer
cado
na
Mül
ler G
roup
Ola
v T
hon
Gru
ppen
Qui
ck
Um
oe
Gru
ppen
Yong
hui
Supe
rsto
res
EXECUTIVE SUMMARY
17
8 2016 REPORT
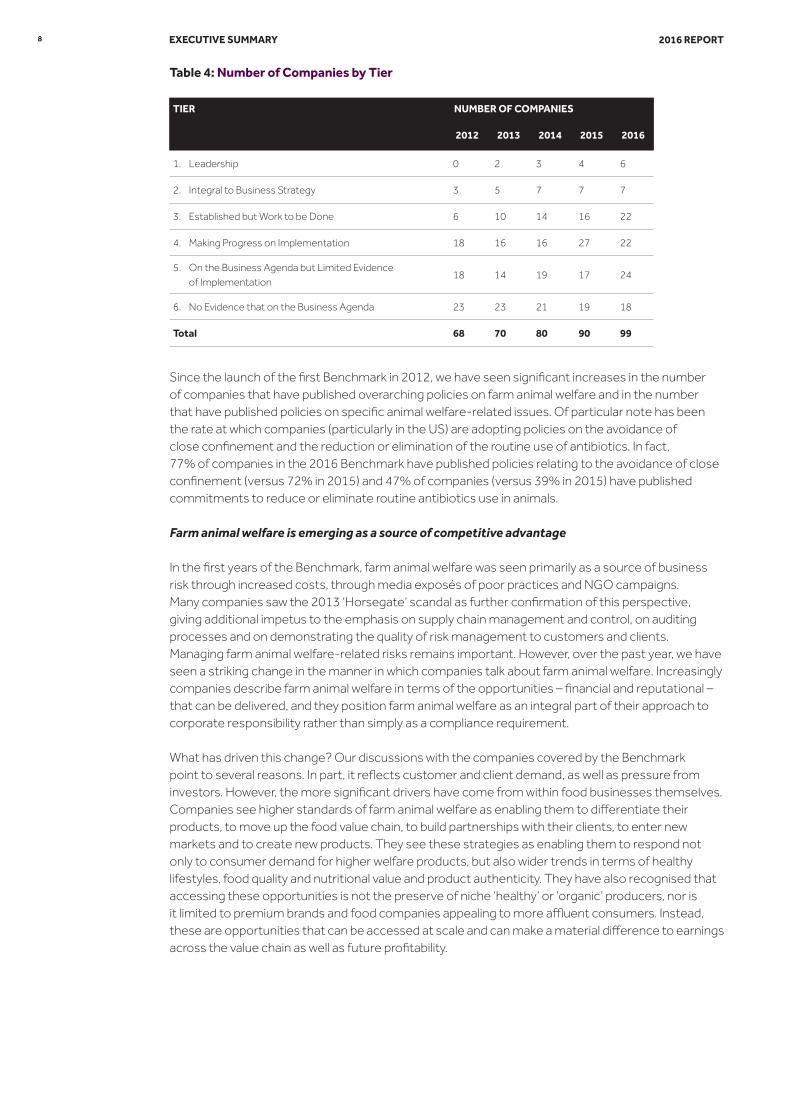
TIER NUMBER OF COMPANIES
2012 2013 2014 2015 2016
1. Leadership 0 2 3 4 6
2. Integral to Business Strategy 3 5 7 7 7
3. Established but Work to be Done 6 10 14 16 22
4. Making Progress on Implementation 18 16 16 27 22
5. On the Business Agenda but Limited Evidence of Implementation
18 14 19 17 24
6. No Evidence that on the Business Agenda 23 23 21 19 18
Total 68 70 80 90 99
Table 4: Number of Companies by Tier
Since the launch of the first Benchmark in 2012, we have seen significant increases in the number of companies that have published overarching policies on farm animal welfare and in the number that have published policies on specific animal welfare-related issues. Of particular note has been the rate at which companies (particularly in the US) are adopting policies on the avoidance of close confinement and the reduction or elimination of the routine use of antibiotics. In fact, 77% of companies in the 2016 Benchmark have published policies relating to the avoidance of close confinement (versus 72% in 2015) and 47% of companies (versus 39% in 2015) have published commitments to reduce or eliminate routine antibiotics use in animals.
Farm animal welfare is emerging as a source of competitive advantage
In the first years of the Benchmark, farm animal welfare was seen primarily as a source of business risk through increased costs, through media exposés of poor practices and NGO campaigns. Many companies saw the 2013 ‘Horsegate’ scandal as further confirmation of this perspective, giving additional impetus to the emphasis on supply chain management and control, on auditing processes and on demonstrating the quality of risk management to customers and clients. Managing farm animal welfare-related risks remains important. However, over the past year, we have seen a striking change in the manner in which companies talk about farm animal welfare. Increasingly companies describe farm animal welfare in terms of the opportunities – financial and reputational – that can be delivered, and they position farm animal welfare as an integral part of their approach to corporate responsibility rather than simply as a compliance requirement.
What has driven this change? Our discussions with the companies covered by the Benchmark point to several reasons. In part, it reflects customer and client demand, as well as pressure from investors. However, the more significant drivers have come from within food businesses themselves. Companies see higher standards of farm animal welfare as enabling them to differentiate their products, to move up the food value chain, to build partnerships with their clients, to enter new markets and to create new products. They see these strategies as enabling them to respond not only to consumer demand for higher welfare products, but also wider trends in terms of healthy lifestyles, food quality and nutritional value and product authenticity. They have also recognised that accessing these opportunities is not the preserve of niche ‘healthy’ or ‘organic’ producers, nor is it limited to premium brands and food companies appealing to more affluent consumers. Instead, these are opportunities that can be accessed at scale and can make a material difference to earnings across the value chain as well as future profitability.
EXECUTIVE SUMMARY
9 2016 REPORT
Interestingly, our investor surveys point to similar themes. Higher standards on farm animal welfare are not only seen as a measure of the ‘quality of management’ (or of risk management) but as an indication of companies’ ability to innovate, deliver new products, access new markets and create long-term benefits for investors.
This is an exciting trend and one that we will explore in future iterations of the Benchmark and in our engagement with investors and with companies. We are seeing a growing number of leadership companies across industry sub-sectors and geographies…
The 13 companies in Tiers 1 and 2 have made strong commitments to farm animal welfare, have well developed management systems and processes, and have a clear focus on farm animal welfare performance measures. These companies cover all three of the food industry sub-sectors (i.e. food retailers and wholesalers, restaurants and bars, and food producers) are well distributed across the countries (of listing or incorporation) covered by the Benchmark and encompass a range of ownership structures (public, private and co-operatives). This suggests that it is realistic for food companies, irrespective of their sub-sector, geography or ownership, to aspire to and achieve higher scoring in this Benchmark.
Institutional investors are starting to influence farm animal welfare practice The growing profile of the investment community is an important and noteworthy development. Our dialogue with and surveys of investors and companies in 2015 and 20163 suggest that farm animal welfare is increasingly identified as an important corporate responsibility issue (by companies and their investors).
There are growing signs that investors are prepared to act on farm animal welfare – for example, 22 institutional investors have signed the Business Benchmark on Farm Animal Welfare’s ‘Global Investor Statement on Farm Animal Welfare’4 and, in May 2016, 18 major investors wrote to leading and lagging companies about their performance, and encouraging them respectively to maintain or improve their positions5. Our analysis suggests companies are responding to this pressure from investors. For example, of the 36 companies in Tiers 5 and 6 of the 2015 Benchmark, 10 improved their scores sufficiently in 2016 to move up at least one tier.
3http://www.bbfaw.com/media/1077/how-investors-are-using-the-business-benchmark-on-farm-animal-welfare.pdf and www.bbfaw.com/publications
4http://www.bbfaw.com/media/1435/investor-statement-on-farm-animal-welfare.pdf
5http://www.bbfaw.com/news-and-events/press-release/two-new-investor-organisations-join-global-collaboration-on-farm-animal-welfare/
EXECUTIVE SUMMARY
10 2016 REPORT
Next stepsWe are hugely encouraged by the progress made to date in defining core expectations for companies, in building consensus around these expectations and in catalysing change within companies and in the investment community. Over the next year, we intend to focus on:
• Encouraging more investors to signal the importance they assign to farm animal welfare through increasing the number that sign the Global Investor Statement on Farm Animal Welfare.
• Strengthening the International Investor Collaboration on Farm Animal Welfare. We want to continue to encourage and support leading companies to maintain and improve their performance on farm animal welfare. We also want to challenge other companies to improve their practices, processes and performance, and to make farm animal welfare an integral part of their business strategy.
• Continuing to improve the Benchmark. Among the suggestions we have received are that we: provide greater information on the reasons for changes in company scores, strengthen our validation of company-published information, and broaden the coverage of the Benchmark (e.g. increasing the number of US companies, moving towards a comprehensive global index).
• Strengthening the evidence base on the business case for action. (e.g. impacts on share prices and other financial metrics, evidence of how higher standards of farm animal welfare improve company financial performance).
• Raising awareness of farm animal welfare and the investment-related risks and opportunities in the investment community. We will achieve this through:
• Ongoing direct engagement with investors.
• BBFAW press and communications activities.
• Participating in investment-related seminars and events.
• Increasing our engagement with investors in the United States and Canada6, particularly given the increase in the number of North American companies covered by the Benchmark.
We plan to repeat the Benchmark in August/September 2017, with the aim of releasing the sixth Benchmark Report in early 2018. Before we commence this process, we will – as we have done for each Benchmark – formally consult on the criteria to be used, the issues to be covered and the scope of the Benchmark. To inform the consultation we will repeat our company and investor surveys in early 2017, to understand how they are using the Benchmark, to understand how the Benchmark might be made more useful to them and to gather their suggestions on potential changes to the Benchmark.
6We have already started to engage with investors in both countries. For notes on the state of play and current challenges, see Amos, N. & Sullivan, R. (2016), The Business and Investment Case for Farm Animal Welfare: The US Perspective (BBFAW, London) (http://www.bbfaw.com/media/1434/notes-of-bbfaw-roundtable-9-may-2016_final2.pdf) and Vanstone, D., Sullivan, R. & Mealia, A. (2015), ‘So What Do Canadian Investors Really Think About Farm Animal Welfare?’, Ethiquette, 8 December 2015 (http://www.ethiquette.ca/en/so-what-do-canadian-investors-really-think-about-farm-animal-welfare/).
EXECUTIVE SUMMARY
2016 REPORTFor further information please contact the BBFAW Executive Director, Nicky Amos, at [email protected]
www.bbfaw.com
Printed on 100% recycled paper