the bucharest university of economic studies professor ... silvia, petre brezeanu (t).pdf ·...
TRANSCRIPT

Economic Computation and Economic Cybernetics Studies and Research, Issue 2/2019; Vol. 53
_________________________________________________________________________________
203
DOI: 10.24818/18423264/53.2.19.12
Silvia Paula TODOR, PhD Student
E-mail: [email protected]
The Bucharest University of Economic Studies
Professor Petre BREZEANU, PhD
E-mail: [email protected]
The Bucharest University of Economic Studies
Professor Florin DUMITER, PhD
E-mail: [email protected]
Vasile Goldis West University, Arad
Rodica GHIUR, PhD Student
E-mail: [email protected]
The Bucharest University of Economic Studies
THE TAXPAYER’S BEHAVIOR AT SOUTH – EASTERN
EUROPEAN LEVEL
Abstract: Through this article we have identified factors of influence that
determine a significant impact in the change of taxpayer behavior in the South -
East of Europe. In this regard, we considered seven countries for which we selected and centralized data on tax rates, corruption indices, corruption control,
government efficiency, economic growth and the underground economy. The tax
rate was the dependent variable in the multifactorial model, a model that was applied to each country, and the rest of the variables were dependent variables. As
a result, we have been able to see that the rate of taxation is influenced by
corruption and how it is perceived, as well as the efficiency of governance,
including the capacity to increase domestic product and the underground economy in countries such as Greece, Poland and Bulgaria.
Keywords: tax compliance, fiscal behavior, tax incidence, multifactorial
regression, statistical analysis.
JEL Classification: H20, H22, H26, C50, C52.
1. Introduction
Zhang et al. (2016) said about fiscal compliance in Southern Europe, or rather
about the reasons for non-compliance in this region, that among these would be the
low level of quality of services in state institutions, so we do not surprise that certain taxpayers do not want to pay their tax obligations. The authors show that
the literature has formulated more and more theories, theories they call
"institutionalist", and which, to a large extent, correlate the quality of the government with the willingness to comply with the taxpayer. Thus, taxpayers are
more conscientious when they are convinced that their money is spent honestly and
efficiently, and on the other hand, taxpayers become unclear when they perceive
corrupt and wasting state institutions.

Silvia Paula Todor, Petre Brezeanu, Florin Dumiter, Rodica Ghiur __________________________________________________________________
204
DOI: 10.24818/18423264/53.2.19.12
Starting from this region and from the impact of the quality of public services on
fiscal compliance, as a nucleus around which we have developed the whole article,
we have, through this paper, to analyze the factors of influence in tax compliance of the taxpayer in South - East. Thus, the first part of the article constitutes a
critical review of the literature, which since 1992 has presented a number of factors
influencing fiscal compliance through various studies, econometric models and statistical methods used. Subsequently, within the research methodology we
presented the factors of influence which in our opinion, are important, showing,
mutatis mutandis, graphically the category they are part of. We also defined and presented their calculation mode, presented the shape of the selected model, and
the characteristics of the data to be included in the model. The empirical results
present the model obtained in each country and the interpretation of the
coefficients thus obtained by reference to the new contemporary fiscal reality, and last but not least by reference to the empirical results from studies found in the
specialized literature.
2. Background and related work To begin with, we consider it important to present the factors that
determine tax compliance and / or non-compliance through a review of the
literature, considering it imperative to define compliance and non-compliance. Thus, according to Harun et al. (2014, pp), tax compliance can be defined as "the
legal use of the tax regime for its own advantage" to reduce the tax paid by legal
means, meaning that the authors refer, without expressly speaking verbis, to those
advantages fiscal nature provided by the tax code. As regards tax non-compliance, this represents the non-fulfillment of tax obligations, intentionally or
unintentionally. The relationship between the two concepts influenced by the
compliance rate result. According to Fonseca and Myles (2012), 0 ≤ compliance
rate ≤ 1, 0, which means that none of the income earned is
declared, and 1 that the total income is declared. Influencing factors are found to be analyzed long before Fisher's
cataloging (1992), but as this article suggests framing certain selected indicators in
advance, we will go from cataloging rather than identifying them. So, in 1992,
Fischer grouped the influence factors into four categories: demographic (age, gender, education), non-conformance opportunity (income level / source), attitude
and perception (influence) and system / control, sanctions, quota). Chau and Leung
(2009) suggest a refinement of the model presented by Fischer by incorporating another factor: the effect of the interaction between the opportunity for non-
compliance and the system / structure of the fiscal system on tax compliance. A
refinement of the Fischer model is also suggested by Lawan & Salisu (2017), according to which "emotional intenlingens" is another factor worth to be
corroborated by the model. Regarding this factor, the authors assert that they
represent the quality of man in managing their emotions, and they also constitute
the "catalyst" that motivates the motivation to take action in order to achieve the

The Taxpayer’s Behavior at South – Eastern European Level __________________________________________________________________
205
DOI: 10.24818/18423264/53.2.19.12
desired objective. Two months later, in another paper, Lawan (2017) suggests
adding to the Fischer model and two other factors: "the moderating effect of fiscal
reform" and "the moderating effect of the perceived tax service quality. Thức (2013) reviews the literature and groups the authors who studied and
analyzed the impact of influence factors on how they in turn shared factors of
influence, and the categories of factors that distinguish between the authors presented are (tax, knowledge, accountancy), psychology (social norms, public
expenditure, tax morals, correct perception), tax administration (the application of
the rules): the industry (competition, marginal profit, industry risk, growth rate, capital structure) law, probability of control, sanctions, etc.), economy (share,
interest, inflation). A group of literature will also be found in Marandu et al.
(2014), but this time after the existence or not of a model in the paper and a
statistical method, and depending on the variables used and associated with the tax compliance phenomenon. Influence factors are grouped into four other categories:
attitude, subjective norms, performance of behavioral control, and other factors.
Bătrâncea et al. (2012) outlines the practical effects for understanding tax compliance factors from 2 Australian Taxation Office Compliance Model (ATO)
and New Zealand Inland Revenue. The authors show that the two models resemble,
based on the BISEP instrument, a tool made up of the five important categories of compliance factors: business, industry, sociological, economic and psychological.
The ATO model is based on the intrinsic and applied motivation of the taxpayer,
which we will also find under the name of its fiscal moral.
Feld and Frey (2001) established a link between external factors and intrinsic motivation, showing the impact of tax authorities' attitudes on the
individual morals of individuals, and the empirical results highlighted that the
desire to conform and implicitly moral falsity is directly influenced by the way in which taxpayers are treated by the authorities. Kiow et al. (2017) presents tax
morality as the taxpayer's own perception that paying taxes is a natural thing,
moreover, by resorting to literature as well, demonstrating that a taxpayer has a
fiscal moral if he pays taxes, regardless of how in which the state will manage that money and regardless of the tax behavior of others.
3. Research methodology and empirical data
Ocheni (2015) shows that despite the fact that taxes are a major source of revenue mobilization for the state budget, not all states exploit this generating
source at maximum capacity and the causes are related to the vulnerability of the
systems, namely: taxation, legislation and administration, political issues, corrupt tax collection practices and the taxpayer's attitude towards paying taxes and others.
Beale and Wyatt (2017) argue that when looking at fiscal compliance,
factors such as corruption, malpractice, resource shortages, inefficiency of
legislation, and failure to adopt effective legislation need to be analyzed. The authors submit tax compliance in terms of land and property tax, while pointing out
that the literature is abundant in compliance studies.
When looking at fiscal compliance, we cannot neglect the impact of effective public governance, because effective governance, according to Everest-
Silvia Paula Todor, Petre Brezeanu, Florin Dumiter, Rodica Ghiur __________________________________________________________________
206
DOI: 10.24818/18423264/53.2.19.12
Phillips & Sandall (2009), has an overwhelming role in the tax system. The authors
point out that the connections between governance, the tax system and the
investment climate are presented as three key and complementary key elements: good governance builds a "healthy" fiscal system, an effective fiscal system
defines sustainable governance, a fair tax system contributes to the formation of an
investment climate capable of attracting investors. Al-Ttaffi & Abdul-Jabbar (2015) states that it is generally defined as
"effective" when the government uses and manages the resources of the country to
meet the needs of the population, only that the authors show that, having given that the requirements vary according to importance, the government should have
accurate priorities. Starting from this definition of good governance, we could say
that a public government should be able to contribute, during its existence, to the
growth of the economy marked by a steady growth rate of GDP and, why not, to a considerable reduction of the underground economy.
In view of the above factors of influence, we considered that corrupt
practices or corruption, public governance, economic growth and the underground economy could also underpin sustainable tax compliance in South - East Europe.
Selected countries within the region on the basis of data availability were: Greece,
Czech Republic, Hungary, Romania, Poland, Slovakia, Bulgaria. Therefore, at the level of each selected country, we have built a multifactorial regression model, in
which we selected the tax compliance as a dependent variable and the factors of
influence previously presented as independent variables.
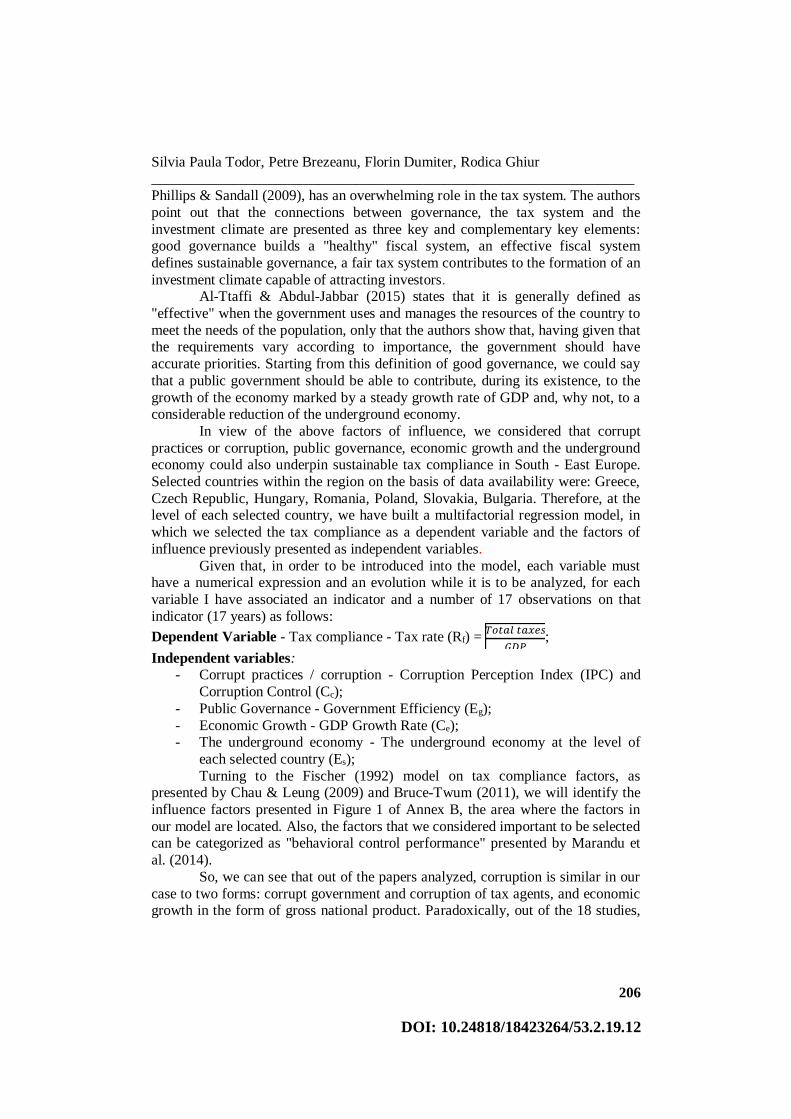
Given that, in order to be introduced into the model, each variable must have a numerical expression and an evolution while it is to be analyzed, for each
variable I have associated an indicator and a number of 17 observations on that
indicator (17 years) as follows:
Dependent Variable - Tax compliance - Tax rate (Rf) = ;
Independent variables: - Corrupt practices / corruption - Corruption Perception Index (IPC) and
Corruption Control (Cc);
- Public Governance - Government Efficiency (Eg);
- Economic Growth - GDP Growth Rate (Ce); - The underground economy - The underground economy at the level of
each selected country (Es);
Turning to the Fischer (1992) model on tax compliance factors, as presented by Chau & Leung (2009) and Bruce-Twum (2011), we will identify the
influence factors presented in Figure 1 of Annex B, the area where the factors in
our model are located. Also, the factors that we considered important to be selected can be categorized as "behavioral control performance" presented by Marandu et
al. (2014).
So, we can see that out of the papers analyzed, corruption is similar in our
case to two forms: corrupt government and corruption of tax agents, and economic growth in the form of gross national product. Paradoxically, out of the 18 studies,

The Taxpayer’s Behavior at South – Eastern European Level __________________________________________________________________
207
DOI: 10.24818/18423264/53.2.19.12
only one establishes a direct link between the corrupt government and tax
compliance, and another indirect link between corrupt tax officers and tax
compliance, due to the fact that the intrinsic motivation to pay taxes is different from one area to another. In terms of economic growth, a single study analyzes this
variable, according to which there is no causal link between it and tax compliance.
According to Baszczynska & Pekasiewicz (2011), the Corruption Perceptions Indicators, the CPI, as presented below and in the model, represent a way of
quantifying the phenomenon of corruption, defined as the abuse of public power
for the private use of dignitaries and politicians in their country. As for the calculation method, according to Thompson & Shah (2005), it would be:
= + ,
where:
„ – the number of different sources of corruption assessment in country j
"(Thompson & Shah, 2005, pp. 2);
„ – the value obtained from an assessment of corruption in a given country in
year t;
the average of the subgroup for a certain corruption assessment in year t;
– standard deviation of the CPI sub - group in year t - 1;
– the standard deviation of the CPI sub - group in year t;
the standard deviation of the CPI sub - group in year t
Corruption Control, Cc, is an indicator that quantifies the quality of government and expresses the perception of the extent to which public power is
exercised for the benefit of private gain, both in large and small forms of
corruption, and how the state is "captured" by elites and personal interests. Government efficiency, eg, is an indicator that quantifies the quality of
government and expresses the quality of public service, public policy making,
implementation, and independence from political pressures, the credibility of the
government and its commitments. With regard to the underground economy, Es, as a percentage of GDP, includes the
underground economy of labor, the material used, illegal activities related to goods
and services.
The estimation method used in predicting parameters is the least square
regression technique (OLS). According to Anyaduba et al. (2014) method presents
coherence, impartiality and efficiency properties. The software platform used is the
Eviews 9.0 program. The form of the econometric model of multifactorial regression is (Anghelache et al., 2012):
+ , where:
– the endogenous variable adapted to the model used - Rf;
– constant, which the software platform will provide as a result of the estimate;
parameter vector to be estimated for explanatory variables using Eviews 9.0;

Silvia Paula Todor, Petre Brezeanu, Florin Dumiter, Rodica Ghiur __________________________________________________________________
208
DOI: 10.24818/18423264/53.2.19.12
the vector consisting of explanatory variables, adapted to the current
situation, vector of the selected factors of influence for the model;
Residue vector (model-associated errors.
We have built such a model at the level of each selected country, and its
shape is: Rf =
Empirical data has been collected from the World Bank portal, whose
credibility cannot be doubted. The data presents an annual frequency, between
2000 and 2016, representing a total of 17 periods. The total number of observations is 714.
4. Empirical results
In presenting the obtained results, we will go from the estimation of the parameters in the model, in the manner performed with the software platform
Eviews 9.0. and presented in Tables 1 to 7 of Annex A. We will subsequently
replace the parameters obtained in each country, we will interpret the parameters, the intercept or the constant, the values obtained by the coefficient of
determination and the coefficient of determination corrected with degrees of
freedom, in which case we will observe the extent to which the model is well
chosen from one country to another. Because we will not resort to testing the assumptions for each model, given the number of countries chosen, we will
summarize the interpretation of the values obtained by the F-statistical test as a test
that confirms or invalidates the validity of the regression model. Thus, according to Table 1 of Annex A, the form of the regression model for Greece is:
Rf=
Table 1. Estimation of multifactor model parameters in Greece
The dependent variable: Greek tax rate as an expression of Greek fiscal
pressure
Explanatory
variable
Coefficient Standard
error
t-statistic Probability
IPC (Greece) -0.703256 1.300067 -0.540938 0.5993
Cc (Greece) 6.158088 4.503317 1.367456 0.1988
Eg (Greece) -13.81212 4.867556 -2.837588 0.0162
Ce (Greece) -0.011504 0.035494 -0.324125 0.7519
Es (Greece) -0.277498 0.513883 -0.540002 0.6000
Constant 38.57584 15.04595 2.563868 0.0263
R2 0.779106 Durbin-
Watson stat
1.187353
R2 adjusted 0.678700
F - statistic 7.759524 Prob(F-
statistic)
0.002388

The Taxpayer’s Behavior at South – Eastern European Level __________________________________________________________________
209
DOI: 10.24818/18423264/53.2.19.12
Before interpreting the parameters, it should be noted that for the time
series containing the values of the underground economy, series marked with Es,
for 2016 no information was available, which is why we approximated the value of 22.4, value obtained in 2015. Similarly, we did the same for the rest of the
countries due to the fact that the data for the whole 2016 underground economy
data were not available, so we considered it appropriate to estimate them from 2015, as follows: Es (Czech Republic)/2016 = 15,1, Es (Hungary)/2016 = 21,9, Es (Romania)/2016 = 28,
Es (Poland)/2016 = 23,3, Es (Slovakia)/2016 = 14,1, Es (Bulgaria)/2016 = 30,6.
Regarding the parameters obtained, we can see a negative correlation between the tax rate and corruption perceptions, government efficiency, economic
growth and the underground economy. Although we can see that the negative
relationship between the tax rate and the underground economy is predictable,
since as long as the amounts of money representing taxes converge under different forms in the underground economy and lead to a reduction in tax revenues and
implicitly rate of taxation, in the case of the other parameters it is necessary to
explain the results obtained individually Therefore, the negative correlation between the rate of taxation and
economic growth would seem to be a paradox in the first instance, especially when
we take the assumption that the main source of revenues to the state budget is represented by fiscal revenues. However, having a mathematical departure from
the calculation formula, economic growth over time means GDP growth, which is
the denominator of the formula for calculating the tax rate, with some steady tax
revenues and a base the tax rate is diminishing. According to this explanation and the related results, we could say that in the case of Greece economic growth is
sustained by a large proportion of other income, also repaired in its geography, a
suggestive example being the incomes from tourism. Regarding the negative relationship between the tax rate and the efficiency
of the government, the explanation might in principle be the same as the previous
one; if Greece has high government efficiency, that is to say, the quality of public
service, high government policies, budget money does not have the main source of income taxes, and GDP at a larger count reduces the rate in the whole They.
In the case of the negative relation between the corruption perception
index but positive between the corruption control and the rate of taxation, we consider that this relationship is justified by what we referred to as "tax morality",
more precisely, the intrinsic motivation to pay taxes. The taxpayer's motivation is
even lower as it perceives higher corruption and is more accentuated as it realizes that it is controlling (in the idea of a gradual decrease) by state authorities.
According to Anghelache et al. (2013) the determinant coefficient (R2)
shows the validity of the chosen model, in order to explain the variance of the
dependent variable, and the more the value obtained by this coefficient is closer to 1, the more we can say that the model is well-chosen. The corrected coefficient of
determination with degrees of freedom (adjusted R2) has the same meaning as the
determinant coefficient. In the light of this explanation, we will interpret the following models obtained for the following countries only if they each exceed the

Silvia Paula Todor, Petre Brezeanu, Florin Dumiter, Rodica Ghiur __________________________________________________________________
210
DOI: 10.24818/18423264/53.2.19.12
50% threshold so that after writing the model, we will analyze the value obtained
by the two coefficients.
In the case of Greece, the determination coefficient is approximately 77.91% and the corrected coefficient of determination with degrees of freedom is
67.87%, which is why we can state that selected independent variables express
over 70% the variation of the independent variable, and the model for Greece is well-chosen
Regarding test values Fstatistic = 7.759524 > Ftabelar = 6. 1121, given that the
calculated F is higher than the table (according to which the model is econometrically valid), we can state that this model is appropriate and valid
econometric.
According to Table 2 of Annex A, the shape of the regression model for
the Czech Republic is
Rf=
Table 2. Estimation of multifactor model parameters in Czech Republic
Dependent variable: Czech tax rate as an expression of tax pressure in the
Czech Republic
Explanatory
variable
Coefficient Standard
error
t-statistic Probability
IPC (Czech
Republic)
-0.281373 0.402949 -0.698285 0.4995
Cc (Czech Republic)
0.933501 1.846827 0.505462 0.6232
Eg (Czech
Republic)
-2.119677 2.409684 -0.879650 0.3979
Ce (Czech Republic)
0.016515 0.018322 0.901366 0.3867
Es (Czech
Republic)
-0.156363 0.246869 -0.633385 0.5394
Constant 19.87159 6.647142 2.989493 0.0123
R2 0.172545 Durbin-
Watson stat
1.205257
R2 adjusted -0.203571
F - statistic 0.458754 Prob(F-
statistic)
0.798939
Analyzing the values obtained by the determinant coefficient and the
correction coefficient of correction with degrees of freedom much lower than 50%
(17% and -20%) we will not interpret parameters as the selected independent
The Taxpayer’s Behavior at South – Eastern European Level __________________________________________________________________
211
DOI: 10.24818/18423264/53.2.19.12
variables do not explain to a significant extent the intrinsic motivation of taxpayer
to pay taxes in the Czech Republic.
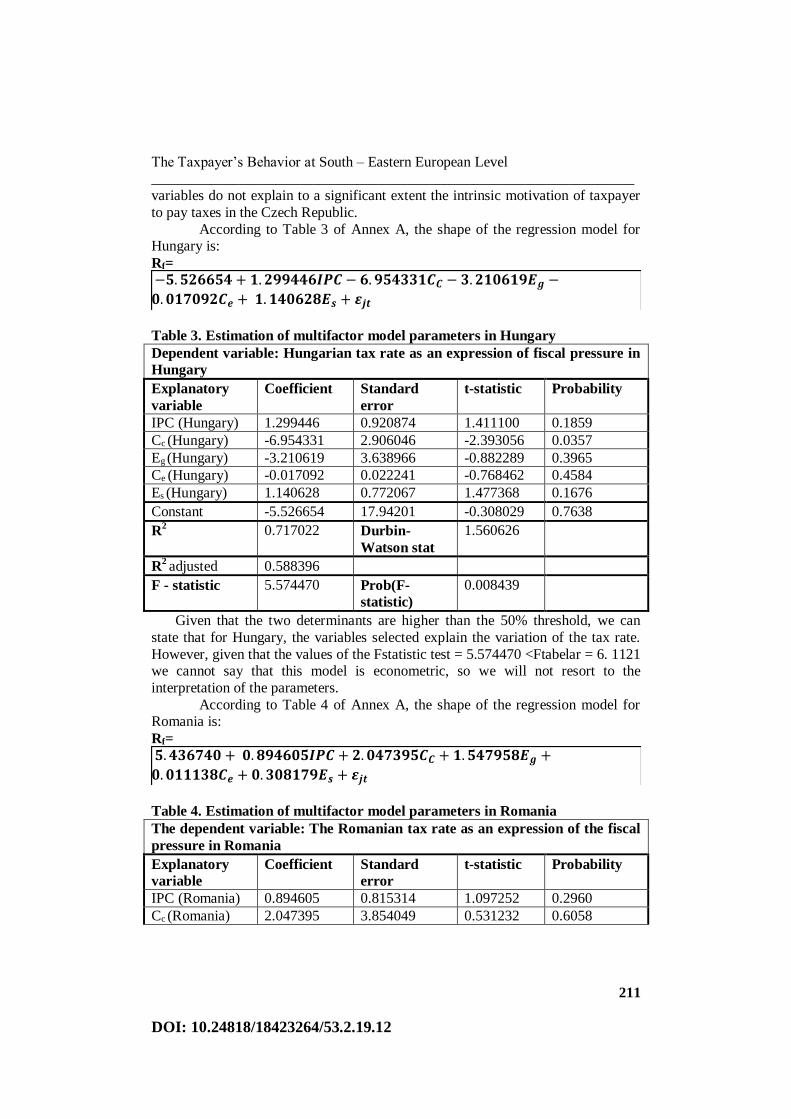
According to Table 3 of Annex A, the shape of the regression model for Hungary is:
Rf=
Table 3. Estimation of multifactor model parameters in Hungary
Dependent variable: Hungarian tax rate as an expression of fiscal pressure in
Hungary
Explanatory
variable
Coefficient Standard
error
t-statistic Probability
IPC (Hungary) 1.299446 0.920874 1.411100 0.1859
Cc (Hungary) -6.954331 2.906046 -2.393056 0.0357
Eg (Hungary) -3.210619 3.638966 -0.882289 0.3965
Ce (Hungary) -0.017092 0.022241 -0.768462 0.4584
Es (Hungary) 1.140628 0.772067 1.477368 0.1676
Constant -5.526654 17.94201 -0.308029 0.7638
R2 0.717022 Durbin-
Watson stat
1.560626
R2 adjusted 0.588396
F - statistic 5.574470 Prob(F-
statistic)
0.008439
Given that the two determinants are higher than the 50% threshold, we can
state that for Hungary, the variables selected explain the variation of the tax rate.
However, given that the values of the Fstatistic test = 5.574470 <Ftabelar = 6. 1121 we cannot say that this model is econometric, so we will not resort to the
interpretation of the parameters.
According to Table 4 of Annex A, the shape of the regression model for Romania is:
Rf=
Table 4. Estimation of multifactor model parameters in Romania
The dependent variable: The Romanian tax rate as an expression of the fiscal
pressure in Romania
Explanatory
variable
Coefficient Standard
error
t-statistic Probability
IPC (Romania) 0.894605 0.815314 1.097252 0.2960
Cc (Romania) 2.047395 3.854049 0.531232 0.6058

Silvia Paula Todor, Petre Brezeanu, Florin Dumiter, Rodica Ghiur __________________________________________________________________
212
DOI: 10.24818/18423264/53.2.19.12
Eg (Romania) 1.547958 2.061652 0.750834 0.4685
Ce (Romania) 0.011138 0.016708 0.666642 0.5187
Es (Romania) 0.308179 0.340559 0.904920 0.3849
Constant 5.436740 11.96597 0.454350 0.6584
R2 0.286937 Durbin-
Watson stat
1.819487
R2 adjusted -0.037183
F - statistic 0.885281 Prob(F-
statistic)
0.522496
Similarly, to the Czech Republic, given that the values obtained by the
determinant coefficient and the correction coefficient corrected with degrees of freedom are much lower than 50% (28% and -≈3.7%), we will not interpret
parameters as the independent variables selected does not explain in a significant
proportion the fiscal moral level in Romania. According to Table 5 of Annex A, the shape of the regression model for
Poland is:
Rf=
Table 5. Estimation of multifactor model parameters in Poland
Dependent variable: Tax rate in Poland as an expression of fiscal pressure in
Poland
Explanatory
variable
Coefficient Standard
error
t-statistic Probability
IPC (Poland) 0.480164 0.395842 1.213020 0.2505
Cc (Poland) 3.878221 0.933915 4.152649 0.0016
Eg (Poland) -7.381612 1.376939 -5.360884 0.0002
Ce (Poland) 0.041881 0.010973 3.816681 0.0029
Es (Poland) 0.233050 0.182449 1.277347 0.2278
Constant 10.39959 6.148216 1.691480 0.1188
R2 0.864243 Durbin-
Watson stat
1.845188
R2 adjusted 0.802535
F - statistic 14.00540 Prob(F-
statistic)
0.000186
Taking into account the values obtained by the determinants, coefficients
that are higher than 50% (≈86%, ≈80%), and that Fstatistic is higher than Ftabelar,
we can state that the model is well-chosen and valid econometric, which is why they will interpret the parameters obtained for the Polish model.
Firstly, we can see that, unlike in Greece, where we were able to see a negative
correlation with CPI and positive with Cc, in the case of Poland, the results

The Taxpayer’s Behavior at South – Eastern European Level __________________________________________________________________
213
DOI: 10.24818/18423264/53.2.19.12
indicate a positive correlation of Rf with both indicators reflecting corruption.
Since, in the case of corruption control, the same interpretation we have presented
for Greece, we will only interpret the positive correlation between Rf and IPC. Therefore, the increase in the corruption perception index doubled by an increase
in the rate of taxation can be understood if we assume that as long as corruption
increases, the impact on GDP will be negative, as the act itself of corruption implies an advantage for the benefit of private and not public status, which is why
we believe that this growth would only be supported by the increase in tax
revenues much more pronounced than GDP growth as a whole, in essence, of the factors that make up it. Thus, we believe that in Poland, according to the obtained
results, the increase of corruption and, implicitly, the index of its perception,
results in fiscal measures and / or policies meant to increase the level of tax
revenues to the state budget. Because in the case of the efficiency of the Government we observe the
same negative correlation with Rf as in the case of Greece, we maintain the
interpretation presented above for the case of Poland. Due to the fact that, in the case of Greece, a negative correlation of Rf to Ce could be observed, and in the
case of Poland a positive one, we will interpret the results obtained by different
ways. Thus, in the case of Greece, according to the results obtained, the economic growth is supported to a large extent by other incomes than the fiscal ones, in the
case of Poland we consider, in support of the results provided by Eviews 9.0, that
this economic growth is sustained in large in part, by the tax revenues in terms of a
GDP with a time evolution, thus increasing the tax revenues to the numerator, in the conditions of a progressively increasing denominator justifies a higher tax rate
(when tax revenues grow faster than GDP growth and a markedly higher economic
growth. We also see in Poland a positive correlation between Rf and the
underground economy, based on the same idea above, that money in the
underground economy reduces tax revenues and, implicitly, the rate of taxation, at
constant GDP; if this GDP grows faster than tax revenue is diminishing, which would also indicate that the impact of taxes on GDP is not overwhelming, then this
positive relationship would meet. In other words, according to the results obtained,
we can say that in Poland, tax revenues are not the only major source of income for Poland's state budget. According to Table 6 of Annex A, the shape of the
regression model for Slovakia is:
Rf=
Silvia Paula Todor, Petre Brezeanu, Florin Dumiter, Rodica Ghiur __________________________________________________________________
214
DOI: 10.24818/18423264/53.2.19.12
Table 6. Estimation of multifactor model parameters in Slovakia
The dependent variable: The tax rate in Slovakia as an expression of the fiscal
pressure in Slovakia
Explanatory
variable
Coefficient Standard
error
t-statistic Probability
IPC (Slovakia) -0.237850 0.810250 -0.293551 0.7746
Cc (Slovakia) 4.614753 2.877803 1.603568 0.1371
Eg (Slovakia) -5.055913 3.781217 -1.337113 0.2082
Ce (Slovakia) -0.007474 0.026261 -0.284596 0.7812
Es (Slovakia) -0.132477 0.386431 -0.342821 0.7382
Constant 22.87971 10.51074 2.176793 0.0522
R2 0.312899 Durbin-
Watson stat
1.008820
R2 adjusted 0.000581
F - statistic 1.001860 Prob(F-
statistic)
0.460457
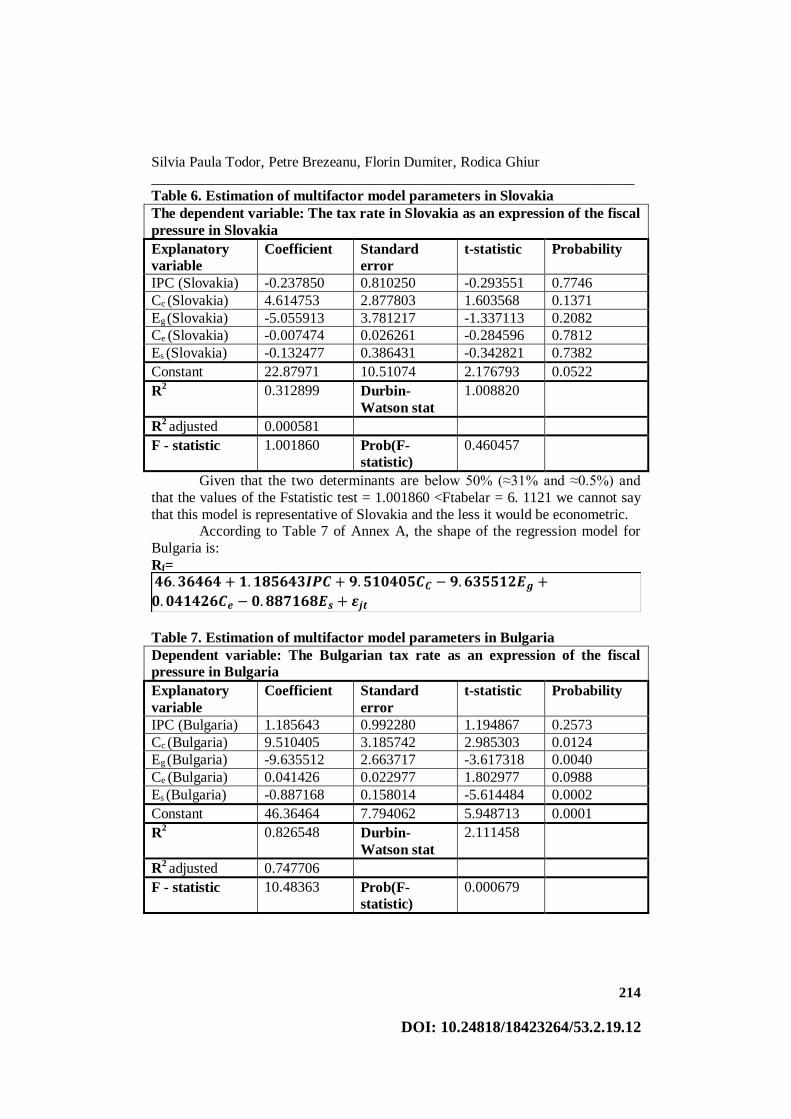
Given that the two determinants are below 50% (≈31% and ≈0.5%) and
that the values of the Fstatistic test = 1.001860 <Ftabelar = 6. 1121 we cannot say
that this model is representative of Slovakia and the less it would be econometric. According to Table 7 of Annex A, the shape of the regression model for
Bulgaria is:
Rf=
Table 7. Estimation of multifactor model parameters in Bulgaria
Dependent variable: The Bulgarian tax rate as an expression of the fiscal
pressure in Bulgaria
Explanatory
variable
Coefficient Standard
error
t-statistic Probability
IPC (Bulgaria) 1.185643 0.992280 1.194867 0.2573
Cc (Bulgaria) 9.510405 3.185742 2.985303 0.0124
Eg (Bulgaria) -9.635512 2.663717 -3.617318 0.0040
Ce (Bulgaria) 0.041426 0.022977 1.802977 0.0988
Es (Bulgaria) -0.887168 0.158014 -5.614484 0.0002
Constant 46.36464 7.794062 5.948713 0.0001
R2 0.826548 Durbin-
Watson stat
2.111458
R2 adjusted 0.747706
F - statistic 10.48363 Prob(F-
statistic)
0.000679

The Taxpayer’s Behavior at South – Eastern European Level __________________________________________________________________
215
DOI: 10.24818/18423264/53.2.19.12
By pointing out that the values obtained by the determined- nation
coefficients, which are above the 50% threshold (≈83%, ≈75%), and that Fstatistic is
bigger than Ftabelar, we can state that the model is well-chosen and valid econometric, which is why they will interpret the parameters obtained for the
resultant model in Bulgaria.
This latter model is all the more interesting as it fills the first 4 indicators as a correlation with the situation of Poland, and the last on the case of Greece,
which is why we are keeping the opinions formulated above and we present them
centrally for the three representative models econometrically valid in Table 8
Table 8. Centralization of the parameters obtained and their brief
interpretation / country
Independent variables in the representative and valid econometric model
Coefficients of determination
Validation
confirm
ation
test
IPC Cc Eg Ce Es R2 R
2
adjust
ed
F -
statistic
Gre
ece
-0.703256
↑Coruption⟾↓
Trust ⟾ ↓Taxes
6.158088
↑Trust ⟾
↑Taxes
-13.81212
↑public
service quality
↓taxes
-0.011504
∃ and other
revenue with a
major impact on
GDP
-0.277498
Money in the
underground
economy
reduces tax
revenues
0.779106
Reprezenta-
tiv (R)
0.6787
(R)
7.759524
Valid
econometric
Pola
nd
0.480164
↑Coruption⟾↑
fiscal policy ⊃
tax burdens
3.878221
↑trust⟾
↑taxes
-7.381612
↑ public
service quality
⟾ ↓taxes
0.041881
Tax revenues - a
main source of
revenue for BS
0.23305
∃ and other
revenue with a
major impact on
GDP
0.864243
(R)
0.802535
(R)
14.0054
Valid
econometric
Bu
lari
a
1.185643
↑ fiscal policies
⊃ tax burdens
9.510405
↑trust⟾
↑taxes
-9.635512
↑ public
service quality
⟾ ↓taxes
0.041426
Tax revenues - a
main revenue
source for BS
-0.887168
Money in the
underground
economy
reduces tax
revenues
0.826548
(R)
0.747706
(R)
10.48363
Valid
econometric
Table 8 shows that at the level of the three countries (Greece, Poland,
Bulgaria) a higher level of trust in the status authorities can lead to an increase in the taxpayer's motivation to pay taxes and implicitly to increase the revenue
collected from them in the budget of these countries. In Greece, we have noticed
that a high level of corruption is likely to diminish the trust of the population and implicitly their desire to comply with the tax. A high level of corruption in Poland
and Bulgaria can be doubled by fiscal policies that burden the taxpayer's tax
burden. Also, in these countries, we have found that tax revenues are a major
source of income, at least for Bulgaria. According to the results, we could say that it is also the main source for Poland, but we can say that there are other revenues

Silvia Paula Todor, Petre Brezeanu, Florin Dumiter, Rodica Ghiur __________________________________________________________________
216
DOI: 10.24818/18423264/53.2.19.12
with a major impact on GDP, which can also be verified for Greece. As for the
impact of the underground economy, the "axiom" meets that money in the
underground economy reduces tax revenues and, why not, reduces the "breadth" of the economy as a whole.
The results obtained and the interpretations formulated in this paper have
several limitations. These were made strictly based on the empirical results obtained and the statistical data collected from the World Bank's portal, and it is
very likely that, depending on certain political, economic instabilities in these
countries, the results could be interpreted and / or otherwise, in accordance with those country / country specific situations.
Referring to other studies in the literature, regarding indicators such as
corruption perceptions, control and efficiency of governance (we will analyze these
indicators in groups, because the literature presents them as substitutes for the quality of governance), we consider the results obtained by Alabede et al. (2011);
according to the authors' regression at Nigeria level, a positive causal link is
established between the quality of the perceived tax service and the fiscal behavior / tax compliance as well as a positive causal link between the public governance
and the tax compliance of the Nigerian taxpayer. A positive causal link between
"healthy" governance and an efficient fiscal system (with all that it means, including compliance) was also presented by Phillips & Sandall (2009), through
the three key dynamics as presented in the early part of the methodology of this
paper.
Another relevant study is that of Mustapha et al. (2015), because the selected factors would fall, according to the study made by these authors, in the
category of institutional factors. According to the authors, this category includes:
the quality of tax administration, the quality of tax service, the level of awareness among taxpayers and good governance. These factors were also included in a
regression as exogenous variables with an impact on the tax compliance score.
Thus, between good governance and the tax compliance score, a significant
positive relationship has been established, the authors concluding that good governance is an effective engine in conducting tax compliance in the state.
A significant positive relationship between the quality of governance and
the behavior of taxpayers through compliance has also been achieved by Alabede et al. (2011b), which, through the study, confirms once again that there is a
significant positive correlation between the quality of public governance and tax
compliance; moreover, the results indicate that the relationship between the quality of public governance and tax compliance is a significant impact on the financial
condition and the aversion to risk. Regarding the aversion to risk, the authors assert
that they would have a moderately negative moderating effect, as well as the
financial condition the authors show that they would have a positive but insignificant effect.
An important aspect related to the results obtained in the present paper, if
we look at economic growth as an indicator representative of the financial condition of the status, respectively of the taxpayer in the above assertions.

The Taxpayer’s Behavior at South – Eastern European Level __________________________________________________________________
217
DOI: 10.24818/18423264/53.2.19.12
Moreover, in the literature we will frequently identify the impact of the financial
condition in the compliance of the taxpayer.
So, in the following, we will present the results of the studies that analyzed the impact of the financial condition of individuals (because, as we have seen, this
may also be an expression of the economic growth in the analyzed state). Thus, in
our first paper, conducted by Alabede et al. (2011a), the authors show that this financial condition has a strong impact on the tax compliance / morale. However,
this positive relationship between the financial condition and the moral reasoning
gradually turns into a negative one, as this taxpayer's financial condition improves. A taxpayer with a better financial condition and a set of high moral standards tends
to become less compliant with the increase in the financial condition (the results
were obtained using Nigerian data).
Torgler (2003) emphasizes that financial satisfaction has a significant positive effect on tax morale, and higher income has a significant negative effect
on tax morale (financial capacity being described by financial satisfaction and
income levels). This is explained by the author in the fact that financial dissatisfaction is not conferred by the level of income, but by the "stress" on the
financial condition. Regarding the actual economic growth, we will identify in the
literature a growing number of studies which analyze this impact in the opposite direction, namely how the impact of the taxation system (on its various
components) on economic growth.
Ojong et. al. (2016) builds a multifactorial model in which it selects oil tax,
company tax and non - oil income as an independent variable, and as exogenous variable GDP, and according to the results, the profit tax has had a positive impact
on growth economic situation in Nigeria. Clearly, this is a randomly chosen study,
and the list of studies may continue, given that such influence is intuitively possible to materialize.
Intuitively, at first glance, we would also see a negative relationship
between the rate of taxation and the underground economy, but as we have seen
from the results of the econometric study presented in this article, it is supported only at the level of Greece and Bulgaria at the level of Poland between the rate of
taxation and the underground economy, the empirical results reveal a positive
relationship. Also, a negative relationship (r = - 0, 26) between the underground economy and the tax rate is also established by Alm & Martinez-Vazquez (2007),
more than the results of the authors indicate a negative correlation between the
underground economy and GDP per capita, and corruption indices. Alm & Torgler (2006) establish a significant negative relationship
(Pearson r = - 0, 46) between the underground economy (measured as% of GDP)
and the level of tax morale. By means of a simple linear regression, the authors
demonstrate that the variation in tax morals explains 20% the change in the size of the underground economy, showing that if the fiscal morale decreases, the
underground economy is likely to grow. Torgler et al. (2007) emphasizes that
studies have generally shown a negative correlation with a Pearson r coefficient

Silvia Paula Todor, Petre Brezeanu, Florin Dumiter, Rodica Ghiur __________________________________________________________________
218
DOI: 10.24818/18423264/53.2.19.12
between - 0.51 and -0.66, manifested between tax morale and size of the
underground economy in Western, emerging or Latin American countries.
5. Conclusions
Regarding the establishment of the fiscal behavior, the taxpayer is taken
into account the trustworthiness vis – á – vis of the tax authorities, especially within the state, through the control authorities, in case of forced or imposed
conformity, cases in which the taxpayer react’s at risk, penalties and even
detention. In the vast majority of the states, it can be identified two types of non – compliance taxation: tax evasion bidding which regards the exploitation of several
legislative breaches and fiscal fraud by which it violates consciously the legislation
having the final purpose of decreasing the tax obligations.
In conclusion, we can state that the objective of this paper has been achieved, distinguishing in countries in the South - East of Europe, for which the model we
think about influence factors influencing the behavior of the taxpayer should be
representative and valid. We can also assert that tax morality, as it is called in the literature, the intrinsic motivation to pay taxes is a variable dependent on many
other factors, including those related to corruption and its control, the efficiency of
government, economic growth and the underground economy. In other words, these indicators (at the level of the studied region) are checked as indicators that
influence the attitudes and perceptions of the taxpayer on the Fischer model and
ultimately tax compliance.
REFERENCES
[1]Alabede J., O., Ariffin Z., B., Z., Idris K., M. (2011), Does Taxpayer’s
Financial Condition Moderate Determinants of Tax Compliance Behaviour?:
Evidence from Nigeria; British Journal of Economics, Finance and Management
Sciences 109, Vol. 1 (2);
[2]Alabede J., O., Ariffin Z., B., Z., Idris K., M. (2011),Public Governance
Quality and Tax Compliance Behavior in Nigeria: The Moderating Role of
Financial Condition and Risk Preference; Issues in Social and Environmental
Accounting Vol. 5, No. ½, pp. 3 – 24;
[3]Alm J., Martinez – Vazquez J. (2007), Tax Morale and Tax Evasion in Latin
America; International Studies Program, Working Paper 07-04;
[4]Alm J., Torgler (2006), Culture Differences and Tax Morale in the United
States and in Europe; Journal of Economic Psychology 27, pp. 224–246;
[5]Alm J., Torgler B. (2006), Culture Differences and Tax Morale in the United
States and in Europe; Journal of Economic Psychology 27, 224–246;
The Taxpayer’s Behavior at South – Eastern European Level __________________________________________________________________
219
DOI: 10.24818/18423264/53.2.19.12
[6]Al-Ttaffi L., H., A., Abdul-Jabbar H. (2015), A Conceptual Framework for
Tax Non-Compliance Studies in a Muslim Country: A Proposed Framework for
the Case of Yemen; IPBJ Vol. 7(2), pp. 1-16;
[7]Anyaduba J., O., Eragbhe E., Modugu K., P.(2014), Impact of Deterrent Tax
Policies on Tax Compliance: The Nigerian Experience; International Journal of Business and Social Science Vol. 5, No. 9;
[8]Baszczynska A., Pekasiewicz D. (2011), Estimation of the Corruption
Perception Index; Acta Universitatis Lodziensis Folia Oeconomica, 255; [9]Bǎtrâncea L.-M., Nichita R.-A., Bǎtrâncea I. (2012), Understanding the
Determinants of Tax Compliance Behavior as a Prerequisite for Increasing
Public Levies; The USV Annals of Economics and Public Administration, Volume
12, Issue 1(15); [10] Bruce-Twum E. (2014), Gift Tax Compliance in Ghana, an Empirical
Study; Journal of Finance and Accounting, Vol. 2, No. 1, 1 – 7;
[11] Beale T., Wyatt P. (2017), Predicting Taxpayer Behaviour and Compliance:
An Economic Analysis of Jamaica’s Property Tax System; Paper prepared for
presentation at the “2017 World Bank Conference on land and poverty”, The
World Bank - Washington DC; [12] Brezeanu P. (2009), Fiscalitate. Concepte, teorii politici si abordari practice.
Wolters Kluwer Publishing, Bucharest;
[13]Feld L., P., Frey B., S. (2001), Deterrence and Tax Morale: How Tax
Administrations and Taxpayers Interact; Preliminary versions of the paper were presented at the 2nd International Conference on Taxation;
[14] Fischer C.M., Wartick M., Mark M. (1992), Detection Probability and
Taxpayer Compliance: A Review of the Literature; J. Acc. Lit. 11: 1 – 46; [15] Fonseca M, Myles G. D. (2012), A Survey of Experiments on Tax
Compliance;
[16] Lawan J., U. (2017), A New Look for the Fischer Tax Compliance Model: A
Positive Plan for Nigeria; International Journal of Advanced Academic Research,
Social & Management Sciences, Vol. 3, Issue 9; [17] Lawan J., U., Salisu U. (2017), A Review of Fischer Tax Compliance
Model: A Proposal for Nigeria; International Journal of Advanced Academic
Research, Social & Management Sciences, Vol. 3, Issue 7; [18] Kiow T., S., Salleh M., F., M., Kassim A., A., B., M. (2017), The
Determinants of Individual Taxpayers’ Tax Compliance Behaviour in
Peninsular Malaysia; International Business and Accounting Research Journal,
Volume 1, Issue 1, pp. 26 – 43; [19] Marandu E., E., Mbekomize C., Ifezue A. (2014), Determinants of Tax
Compliance: A Review of Factors and Conceptualizations; Proceedings of the
First Middle East Conference on Global Business, Economics, Finance and Banking (ME14 DUBAI Conference) Dubai;

Silvia Paula Todor, Petre Brezeanu, Florin Dumiter, Rodica Ghiur __________________________________________________________________
220
DOI: 10.24818/18423264/53.2.19.12
[20] Mustapha L. O., Zakaree S., Yahaya O., A. (2015), Institutional Factors
and Personal Income Tax Compliance in Kaduna State-Nigeria; Research on
Humanities and Social Sciences, Vol.5, No.24; [21] Ocheni S. (2015), A Causality Analysis between Tax Compliance Behaviour
and Nigerian Economic Growth; Mediterranean Journal of Social Sciences
MCSER Publishing, Rome-Italy, Vol 6 No 1 S1; [22] Ojong C., M., Anthony O., Arikpo O., F. (2016), The Impact of Tax
Revenue on Economic Growth: Evidence from Nigeria; IOSR Journal of
Economics and Finance (IOSR-JEF), Volume 7, Issue 1, pp. 32-38; [23] Torgler B. (2003), Tax Morale: Theory and Empirical Analysis of Tax
Compliance; Dissertation der Universität Basel zur Erlangung der Würde eines
Doktors der Staatswissenschaften;
[24] Torgler B., Schaffner M., Macintyre A. (2007), Tax Compliance, Tax
Compliance, Tax Morale, and Governance Quality; International Studies
Program Working Paper 07-27;
[25] Thức N., T. (2013), A Review of Factors impacting Tax Compliance;
Australian Journal of Basic and Applied Sciences, 7(7), pp. 476-479.