the boat race · reach of the event beyond race day ... a key factor in the boat race experience is...
TRANSCRIPT

The Boat RaceImpact of a Single Day Major Event on a City
Arup & The Boat Race CompanyOctober 2017


3
Executive Summary
The Boat Race is an event steeped in history and tradition, with a high degree of public recognition in the UK and worldwide.
Major events, of which The Boat Race is one, have undergone significant change over the last 30 years. The speed of development in equipment technology, broadcasting and spectator expectations have combined to produce events that reach far beyond their sporting origins.
Through study of the economic, logistical and experiential influences on The Boat Race this document reviews the current ‘state-of-play’ for the event and makes recommendations of areas that should be considered for development in order for the event to maximise its commercial, sporting and social sustainability.
Key to the future of The Boat Race is to maintain and build from its ethos of scholar athletes, elite performance, tradition and accessibility for all and to focus on how to engage with the UK and worldwide audience in order to generate income and extend the reach of the event beyond Race Day itself.
The report also provides high level case studies of sporting events which have successfully managed the transition from traditional sports into highly regarded, well supported events that focus on fan experience and long term event sustainability.
This document proposes that public and commercial engagement can be enhanced on various levels for The Boat Race. The report highlights the key themes for future development as digitalisation, extension of the event profile, recognition of the commercial asset, diversity of revenue streams and using the event to positively influence the sport of rowing.

4
The Boat Race Company (BRC) is responsible for the planning and delivery of The Boat Race which is an annual contest between the Men’s and Women’s Blue Boats of Oxford University and Cambridge University.
The Men’s Boat Race first took place in 1829 and the Women’s Boat Race in 1927. The Boat Race takes place in late March or early April depending on the tides. Race Day also features two reserve races namely Osiris versus Blondie (Women) and Isis versus Goldie (Men).
The Boat Race takes place on the Tideway, starting in Putney and finishing in Mortlake. The Championship Course is 4.25 miles long and winds its way through the boroughs of Wandsworth, Hammersmith and Fulham, Richmond and Hounslow.
BRC operates on a year-round basis working closely with the four Clubs, sponsors, Host Broadcaster, local agencies and stakeholders. BRC has a flexible workforce model which replicates the key stages of the rowing season and University timetables:
• September > December – Strategic Planning • January > April – Operational Delivery• May > August – De-brief and initial planning
for the following season
BRC is responsible for day-to-day Club liaison, sponsor sales process and rights delivery, contractual arrangements with key suppliers and partners, interface with London boroughs and Boat Houses along the Championship Course, oversight of 3rd party agencies, financial management and the marketing and communication strategy of The Boat Race.
The BRC Board consists of a Chairman, two Executive Directors, The Race Director, one representative from each of the four Clubs and the Chair of the Oxford and Cambridge Rowing Foundation. Reports are regularly received from 3rd party agencies, financial and legal partners.
5
Arup are an independent firm of designers, planners, engineers, consultants and technical specialists offering a broad range of professional services. We operate globally, bringing creativity and technical excellence to everything we do. We shape a better world.
Founded in 1946, Arup is an independent firm with more than 12,500 engineers, consultants and support staff. The company first came to global prominence with its pioneering design for the Sydney Opera House and through excellent design has built a reputation in the industry as an innovative design house that works on the worlds most recognised structures and events.
Our work on projects such as Beijing National Stadium, China, Singapore Sports Hub and our role on the London 2012 Olympic Games have further developed our reputation for delivering venues and operational planning that support venue owners and event operators.
At Arup, we help businesses improve performance by giving them the complete picture. To do so we combine strategic commercial thinking with precise, hands-on experience of processes, assets and people.
Our people combine the management calibre of a blue chip consultancy with the ability to speak in technical and operational terms. By doing so, we can act as translators between financial institutions and technical experts, for example, to give our clients clearer insight – for a competitive edge.
This unconventional approach to design springs in part from Arup’s ownership structure. The firm is owned in trust on behalf of its staff. The result is an independence of spirit that is reflected in the firm’s work, and in its dedicated pursuit of technical excellence.

7
Overview of Report
Reviewing The Boat Race in its current planning cycle and through the activities it currently undertakes provides an opportunity to interrogate the event to ensure its long-term sporting, operational and commercial sustainability.
There is a clear desire to develop what the event can bring to it stakeholders, both formal and informal, beyond the event day itself. To enable informed choices to be made by BRC regarding opportunities in the coming years it is necessary to first understand the event from a technical perspective.
To support the review there was a need to analyse the event from a city wide strategic standpoint to inform the Arup and BRC team in two key areas; to understand the event opportunities available to sponsors and event partners and to understand the current experience of the Race Day spectator.
The report is supported by analysing data from Transport for London and Greater London Authority. This has provided a dataset that has been interrogated to define where opportunities exist to offer greater accessibility for spectators and increase profile and event opportunities for sponsors and event partners.
Data and observations collected from the 2017 Race Day have been collated and aligned with the strategies being developed within the business plan to give a measured, validated and interpreted account of the event, along with recommendations to be considered for further projects.

8
Course Map for 2017 Edition of The Boat Race
9
The Boat Race 2017Technical Review
The Boat Race was held on Sunday 2nd April on the Championship Course in west London. In total, there were four races held over a 90 minute period, beginning at 16.35 in the afternoon.
• The Cancer Research UK Women’s Boat Race• Osiris v Blondie (Women’s Reserve Crews)• Isis v Goldie (Men’s Reserve Crews)• The Cancer Research UK Men’s Boat Race
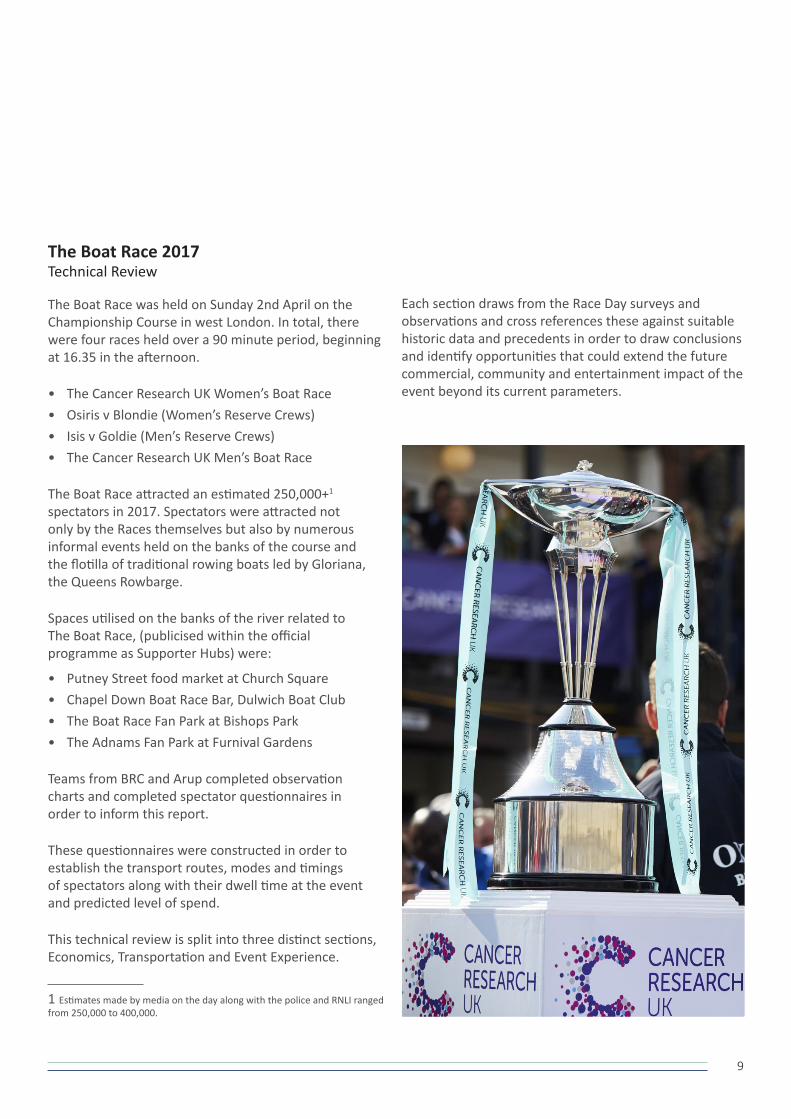
The Boat Race attracted an estimated 250,000+1 spectators in 2017. Spectators were attracted not only by the Races themselves but also by numerous informal events held on the banks of the course and the flotilla of traditional rowing boats led by Gloriana, the Queens Rowbarge.
Spaces utilised on the banks of the river related to The Boat Race, (publicised within the official programme as Supporter Hubs) were:
• Putney Street food market at Church Square• Chapel Down Boat Race Bar, Dulwich Boat Club• The Boat Race Fan Park at Bishops Park • The Adnams Fan Park at Furnival Gardens
Teams from BRC and Arup completed observation charts and completed spectator questionnaires in order to inform this report.
These questionnaires were constructed in order to establish the transport routes, modes and timings of spectators along with their dwell time at the event and predicted level of spend.
This technical review is split into three distinct sections, Economics, Transportation and Event Experience.
1 Estimates made by media on the day along with the police and RNLI ranged from 250,000 to 400,000.
Each section draws from the Race Day surveys and observations and cross references these against suitable historic data and precedents in order to draw conclusions and identify opportunities that could extend the future commercial, community and entertainment impact of the event beyond its current parameters.

11
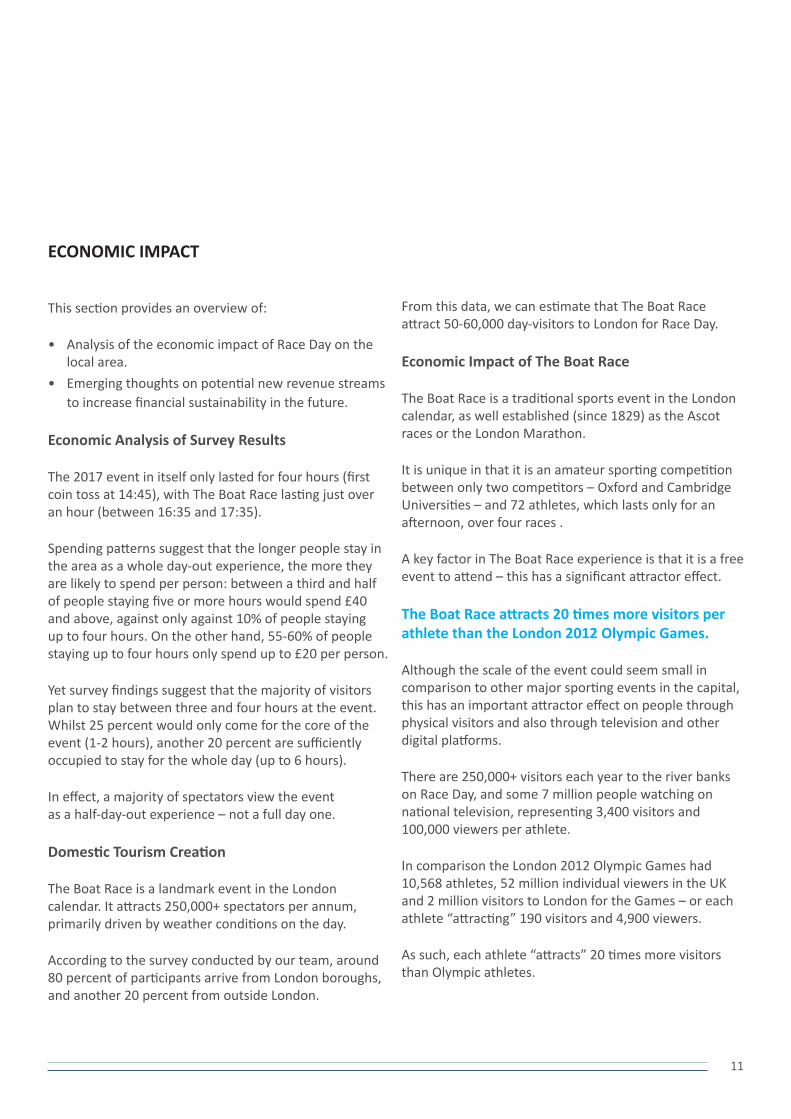
ECONOMIC IMPACT
This section provides an overview of:
• Analysis of the economic impact of Race Day on the local area.
• Emerging thoughts on potential new revenue streams to increase financial sustainability in the future.
Economic Analysis of Survey Results
The 2017 event in itself only lasted for four hours (first coin toss at 14:45), with The Boat Race lasting just over an hour (between 16:35 and 17:35).
Spending patterns suggest that the longer people stay in the area as a whole day-out experience, the more they are likely to spend per person: between a third and half of people staying five or more hours would spend £40 and above, against only against 10% of people staying up to four hours. On the other hand, 55-60% of people staying up to four hours only spend up to £20 per person.
Yet survey findings suggest that the majority of visitors plan to stay between three and four hours at the event. Whilst 25 percent would only come for the core of the event (1-2 hours), another 20 percent are sufficiently occupied to stay for the whole day (up to 6 hours).
In effect, a majority of spectators view the event as a half-day-out experience – not a full day one.
Domestic Tourism Creation
The Boat Race is a landmark event in the London calendar. It attracts 250,000+ spectators per annum, primarily driven by weather conditions on the day.
According to the survey conducted by our team, around 80 percent of participants arrive from London boroughs, and another 20 percent from outside London.
From this data, we can estimate that The Boat Race attract 50-60,000 day-visitors to London for Race Day.
Economic Impact of The Boat Race
The Boat Race is a traditional sports event in the London calendar, as well established (since 1829) as the Ascot races or the London Marathon.
It is unique in that it is an amateur sporting competition between only two competitors – Oxford and Cambridge Universities – and 72 athletes, which lasts only for an afternoon, over four races .
A key factor in The Boat Race experience is that it is a free event to attend – this has a significant attractor effect.
The Boat Race attracts 20 times more visitors per athlete than the London 2012 Olympic Games.
Although the scale of the event could seem small in comparison to other major sporting events in the capital, this has an important attractor effect on people through physical visitors and also through television and other digital platforms.
There are 250,000+ visitors each year to the river banks on Race Day, and some 7 million people watching on national television, representing 3,400 visitors and 100,000 viewers per athlete.
In comparison the London 2012 Olympic Games had 10,568 athletes, 52 million individual viewers in the UK and 2 million visitors to London for the Games – or each athlete “attracting” 190 visitors and 4,900 viewers.
As such, each athlete “attracts” 20 times more visitors than Olympic athletes.

12
The Boat Race generates 40 percent more spend per athlete than the London Olympics.
In the spirit of sport competition, The Boat Race has always been inclusive to all visitors, with no ticketing costs to the visitor. Yet the total spend from visitors is estimated between £7 million and £8.5 million, averaging £30 per person or £100,000 per athlete.
The visitor spend generated by the London 2012 Olympic Games was about £760 million (in the UK), averaging £1,290 per person1, or £72,000 per athlete. Again, the Races have a yield per athlete (based on visitor spend) 40 percent higher than the London 2012 Olympic Games.
The Boat Race attracts 50,000 additional day-visitors to London.
The Race attracts 200,000 visitors living in London who would not be considered additional visitors to the local area as the vast majority of them come from one of the four adjoining boroughs along the route.
Yet it attracts over 50,000 people from outside London each year to west London.
The direct net economic impact on the local economy is estimated between £2.1 and £2.9 million.
The 50,000 day-visitors spend £1.4 to £1.7 million in the local economy. Whilst London-based visitors are not additional as such to London or the local area, they will likely be spending more than on their average Saturday day-out, due to the event and celebratory atmosphere.
1 London 2012 Facts & Figures November 2012 (https://stillmed.olympic.org/Documents/Reference_documents_Factsheets/London_2012_Facts_and_Fig-ures-eng.pdf). The spend per capita is based on overseas visitors.
The direct economic impact of The Boat Race in the local economy is estimated between £2.1 and £2.9 million, with indirect contribution reaching £2.8 to £3.7 million each year.
Other wider benefits to the UK economy could also be considered, but have not been quantified. These include:
• Positive impact on youth through uplifting values of sport, raising aspiration and educational attainment – in particular higher education.
• Positive impact on the City of London, providing a free event for residents that is truly world class.
A few potential impacts (unquantified) to the local economy should be noted, such as:
• Higher levels of road and traffic congestion due to the volume of visitors in areas not usually used to such densities.
• Additional maintenance costs for the local authorities (for littering), and policing for the Metropolitan Police (although these services are paid for by BRC).
13
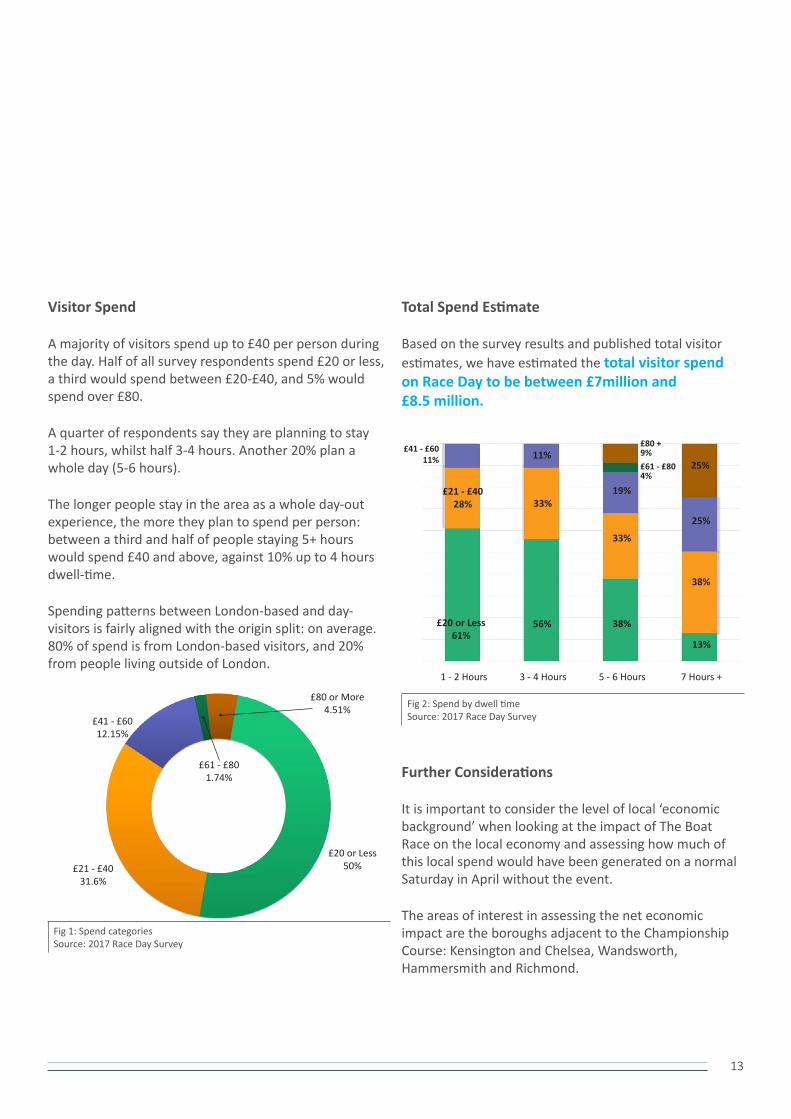
Visitor Spend
A majority of visitors spend up to £40 per person during the day. Half of all survey respondents spend £20 or less, a third would spend between £20-£40, and 5% would spend over £80.
A quarter of respondents say they are planning to stay 1-2 hours, whilst half 3-4 hours. Another 20% plan a whole day (5-6 hours).
The longer people stay in the area as a whole day-out experience, the more they plan to spend per person: between a third and half of people staying 5+ hours would spend £40 and above, against 10% up to 4 hours dwell-time.
Spending patterns between London-based and day-visitors is fairly aligned with the origin split: on average. 80% of spend is from London-based visitors, and 20% from people living outside of London.
Fig 1: Spend categoriesSource: 2017 Race Day Survey
Total Spend Estimate
Based on the survey results and published total visitor estimates, we have estimated the total visitor spend on Race Day to be between £7million and £8.5 million.
Fig 2: Spend by dwell time Source: 2017 Race Day Survey
Further Considerations
It is important to consider the level of local ‘economic background’ when looking at the impact of The Boat Race on the local economy and assessing how much of this local spend would have been generated on a normal Saturday in April without the event.
The areas of interest in assessing the net economic impact are the boroughs adjacent to the Championship Course: Kensington and Chelsea, Wandsworth, Hammersmith and Richmond.
£20 or Less50%£21 - £40
31.6%
£41 - £6012.15%
£80 or More4.51%
£61 - £801.74%
£20 or Less61%
£21 - £4028%
1 - 2 Hours
£41 - £6011%
56%
33%
3 - 4 Hours
11%
5 - 6 Hours
38%
33%
19%
£80 +9%£61 - £804%
13%
38%
25%
25%
7 Hours +

14
We have divided visitors and ‘economic background’ assumptions based on spectator’s place of origin:
For all day-visitors living outside of London, we assume they would not be visiting and spending in London – or the local area – if The Boat Race had not taken place, but in their local areas outside of London. As such we assume a high proportion (70-80%) of their spending impact to be net additional.
Of London-based visitors, the majority come from the boroughs hosting or directly adjoining the route (see diagram below). It is very likely that on a normal
Saturday, people would spend a proportion of what they spend during Race Day in their local area (or elsewhere in London). A conservative estimate is 20-30% net additional spend is being created from people being at an event and willing to spend more.
Arup have conducted a sensitivity analysis of the net additional spend in the local area based on different ’economic background’ assumptions.
This analysis lead us to the conclusion, as stated previously, that the net impact of the event to the local economy ranges between £2.1 and £2.9 million.
Fig 3: Survey participants by London boroughSource: 2017 Race Day Survey
15
Multiplier Effect
The additional spend in local businesses has an indirect impact on the wider supply chain, called the ‘multiplier effect’. In this case for every £1 spent directly, it will generate £0.30 in the supply chain.
As such, we estimate the total net economic benefit to the local area from The Boat Race to be between £2.8 and £3.7 million each year.
Potential New Revenue Streams
To support the commercial sustainability of the event BRC should consider options available to increase and diversify revenue streams. Opportunities exist to generate additional income both on the day of the event itself and also by extending the event beyond Race Day.
Race Day opportunities include:
• Driving additional revenue from general spectators• Creating a premium spectator revenue stream• Merchandising of BRC product• Creating income from digital platforms• Additional ‘Supporter Hubs’• BRC ownership of hospitality• Event day advertising revenue• Extending the river activity pre and post race• Event day product/company placement
Opportunities related to spectators are discussed in greater detail later in this report.
Whilst advertising and product association are within BRC’s control internally – upgrading of the event day digital platform will require specialist knowledge, development and investment in order to bring a quality product to market.
There are significant opportunities to drive income by extending the public exposure of the Boat Race event and its ethos beyond the event day itself.
Non-event day opportunities include:
• Generating revenue from BRC data• Year round merchandising• Providing access to race crews• Increasing coverage of race crews in training and
competition in the build-up to the event• Promoting direct (virtual) competition for the public
against race crews• Community outreach partnerships• Initiate mass participation running/walking events
around the Championship Course
Of these the most exciting opportunities can be provided through a digital medium, thus reducing BRC’s reliance on physical attendance at any events.
Working with partners such as Concept21 and ErgData2, who both have online/app based activity tracking could give the worldwide rowing family an opportunity and incentive to interface with the event – the inspiration of racing against the crews would be an exciting prospect that could generate licensing income and also give a platform for an increase in merchandising income.
1 https://log.concept2.com/
2 http://www.concept2.co.uk/service/software/ergdata


17
TRANSPORTATION IMPACTS
This section provides an overview of:
• The spectator modal split – who attends from where?• The public transport network that serves the
spectators attending The Boat Race• The arrival, dwell time and departure profiles of
spectators on Race Day
Background
The Boat Race is held on the Championship Course in west London, a densely populated area with approximately 950,000 residents within the four London boroughs that the course runs through.
As the event itself is limited to the activity occurring along the river banks, transport to and from these areas is under significantly more pressure on the day of the race as opposed to a usual weekend demand.
Spectator Access
Spectators accessing the Championship Course on Race Day arrive at the river in predominately three locations:
• Putney (north and south of the river)• Hammersmith (north of the river) • Barnes (south of the river)
From the survey information collected on Race Day 2017 it can be seen that there are two primary modes of access for spectators.
• Walking• Rail
The survey results show the following overall modal split for spectators.
Transport Modal SplitFig 4: Spectator Transport Modal SplitSource: 2017 Race Day Survey
Spectator Origin
A total of 70% of all spectators come from within London boroughs. Using data gathered during the Race Day surveys it is possible to define in more detail where in London these spectators live.
Visitor LocationsFig 5: London Spectators residence boroughSource: 2017 Race Day Survey
Car10%
Bus10%
Walking40%
Rail40%
Wandsworth33%
Hammersmith20%
Other25%
Richmond6%
Kensington7%
Westminster9%

18
Spectator Dwell Time
Knowing the modal split of the crowd, with rail being confirmed as the primary transport mode leads us to review the impact the Race Day has on the rail infrastructure.
Using data collected from ticket offices at the most frequently used stations (Putney Bridge, Hammersmith & Ravenscourt Park) it is possible to assess the periods
Fig 6: LUL (Blue) & Overland (Red) StationsSource: Google Earth + Arup
of time that spectators utilise trains, and therefore the amount of time typically spent before and after the race itself – this gives us an estimation of event dwell time.
Whilst the spectator survey and observations were completed at the 2017 event, it has been necessary to utilise historic data to analyse spectator flow from public transport stations.
Barnes
Barnes Bridge
Chiswick
Putney
Putney Bridge
Parsons Green
Barons Court
Hammersmith
Ravenscourt ParkStamford Brook
Turnham Green
Gunnersbury
Chiswick Park
Star
t
Finish

19
2014 Data Capture
It can be seen from this data that the spectators using Putney Bridge (PB) have an extended dwell time from both Hammersmith (H) and Ravenscourt Park (RP).
0
50
100
150
200
250
300
350
400
450
Fig 7: 2014 Putney Bridge Gate line countSource: Transport for London
0
200
400
600
800
1000
1200
Fig 8: 2014 Hammersmith Gate line countSource: Transport for London
0
20
40
60
80
100
120
140
160
Fig 9: 2014 Ravenscourt Park Gate line countSource: Transport for London
It can also be seen that at both (H) and (RP) the arrival profile is far more compressed than (PB). This is a metric that could be improved with greater entertainment and family attractions prior to the Race.
RACE
- 17
55
0700 0800 0900 1000 1100 1200 1300 1400 1500 1600 1700 1800 1900 2000 2100 2200 2300
Putney Bridge Station Arrival Departure
Non event day exitNon event day entryEvent day exitEvent day entry
0700 0800 0900 1000 1100 1200 1300 1400 1500 1600 1700 1800 1900 2000 2100 2200 2300
DepartureArrivalHammersmith Station
0700 0800 0900 1000 1100 1200 1300 1400 1500 1600 1700 1800 1900 2000 2100 2200 2300
Ravenscourt Park StationDepartureArrival

20
2015 Data Capture
As in 2014, the spectators using Putney Bridge (PB) have an extended dwell time from both Hammersmith (H) and Ravenscourt Park (RP).Arrival profiles suggest a much more even spectator
0
50
100
150
200
250
300
350
400
450
Fig 10: 2015 Putney Bridge Gate line countSource: Transport for London
0
200
400
600
800
1000
1200
1400
1600
1800
Fig 11: 2015 Hammersmith Gate line countSource: Transport for London
0
20
40
60
80
100
120
140
160
Fig 12: 2015 Ravenscourt Park Gate line countSource: Transport for London
arrival across all stations, however people began departing from Putney prior to the Race start. This could be attributed to the weather in 2015 which was more in line with the average for the time of year.
RACE
- 17
50Putney Bridge Station
Arrival Departure
Non event day exitNon event day entryEvent day exitEvent day entry
0700 0800 0900 1000 1100 1200 1300 1400 1500 1600 1700 1800 1900 2000 2100 2200 2300
0700 0800 0900 1000 1100 1200 1300 1400 1500 1600 1700 1800 1900 2000 2100 2200 2300
Arrival Departure
0700 0800 0900 1000 1100 1200 1300 1400 1500 1600 1700 1800 1900 2000 2100 2200 2300
Arrival Departure
Hammersmith Station
Ravenscourt Park Station
RACE
- 16
50
21
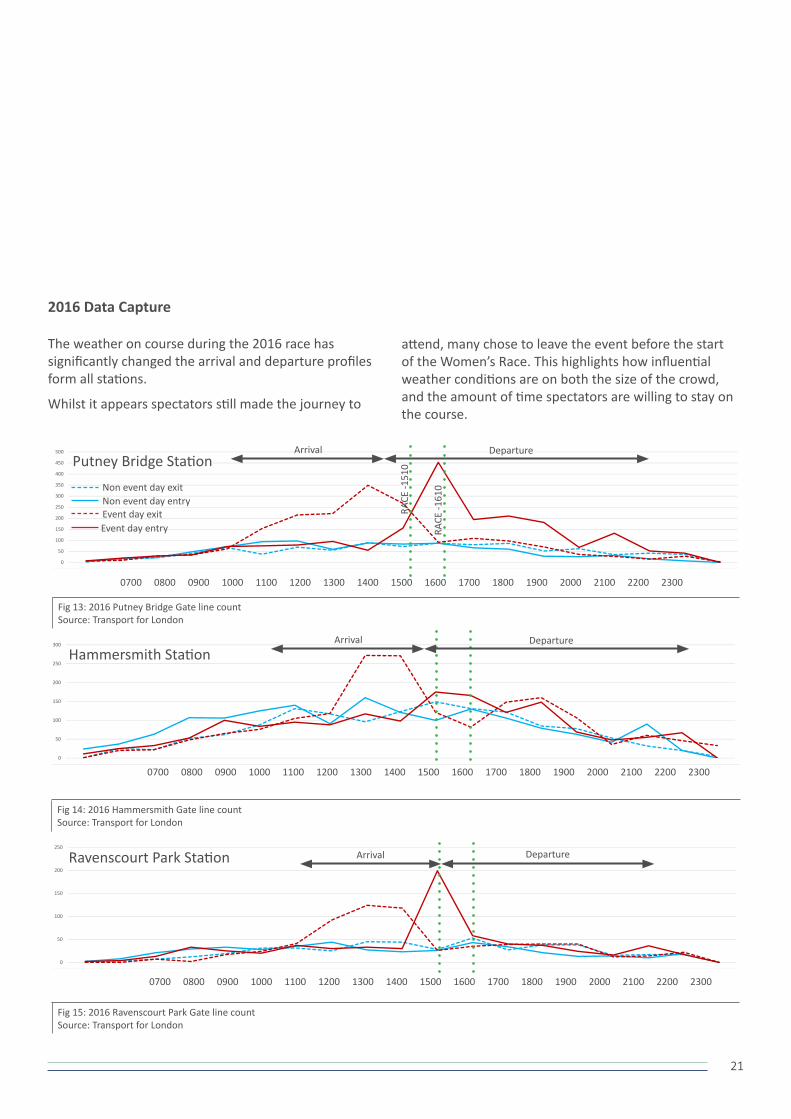
2016 Data Capture
The weather on course during the 2016 race has significantly changed the arrival and departure profiles form all stations.
Whilst it appears spectators still made the journey to
0
50
100
150
200
250
300
350
400
450
500
Fig 13: 2016 Putney Bridge Gate line countSource: Transport for London
0
50
100
150
200
250
300
Fig 14: 2016 Hammersmith Gate line countSource: Transport for London
0
50
100
150
200
250
Fig 15: 2016 Ravenscourt Park Gate line countSource: Transport for London
attend, many chose to leave the event before the start of the Women’s Race. This highlights how influential weather conditions are on both the size of the crowd, and the amount of time spectators are willing to stay on the course.
0700 0800 0900 1000 1100 1200 1300 1400 1500 1600 1700 1800 1900 2000 2100 2200 2300
RACE
-161
0
Putney Bridge StationNon event day exitNon event day entryEvent day exitEvent day entry
Arrival Departure
0700 0800 0900 1000 1100 1200 1300 1400 1500 1600 1700 1800 1900 2000 2100 2200 2300
Hammersmith StationArrival Departure
0700 0800 0900 1000 1100 1200 1300 1400 1500 1600 1700 1800 1900 2000 2100 2200 2300
Ravenscourt Park Station Arrival Departure
RACE
-151
0

22
2017 Data Capture
2017 saw a significant increase in visitors to the event, however the spectators using Putney Bridge (PB) have an extended dwell time from both Hammersmith (H) and Ravenscourt Park (RP).
The key observation from this data is the gap that can be seen between arrival and departure peaks – this suggests a longer dwell time at the event itself. Weather is likely to be a key factor in this along with entertainment and an increase in spectator engagement from previous years.
Fig 16: 2017 Putney Bridge Gate line countSource: Transport for London
Fig 17: 2017 Hammersmith Gate line countSource: Transport for London
Fig 18: 2017 Ravenscourt Park Gate line countSource: Transport for London
RACE
- 17
35
Putney Bridge StationArrival Departure
Event day entry (Bi Directional)Event day entryEvent day exit (Bi Directional)Event day exit
0800 0900 1000 1100 1200 1300 1400 1500 1600 1700 1800 1900 2000 2100 2200 2300
0800 0900 1000 1100 1200 1300 1400 1500 1600 1700 1800 1900 2000 2100 2200 2300
Arrival Departure
0800 0900 1000 1100 1200 1300 1400 1500 1600 1700 1800 1900 2000 2100 2200 2300
Arrival Departure
Hammersmith Station
Ravenscourt Park Station
RACE
- 16
35
23
Transport Summary
In reviewing the data available from the transport network, along with observations during Race Day 2017 some key trends can be seen.
• The event is primarily attended by the local population from the four adjacent London boroughs.
• Overall attendance numbers and spectator dwell time are significantly influenced by the prevailing weather conditions at the time of the race. If weather deteriorates through the day, such as in 2016, some spectators leave the area before the race begins.
• The peak load on the transport network is typically immediately after The Men’s Boat Race.
• The area around Putney Bridge shows the longest dwell time, perhaps in part due to the amount of food and beverage options available. This suggests that if additional entertainment, food and beverage options are available in other locations spectators will increase their dwell time at the event.
• Areas beyond Barnes Bridge on the north and south of the river are not highly populated with spectators, and are not served by mass transit modes of transport.
• On days where weather is warm and sunny, such as 2017, there is a significant background population utilising the banks of the river, particularly the north of the river adjacent to the bandstand. This adds to the number of cars attempting to access the nearby road network and leads to congestion upon departure.
25
SPECTATOR EXPERIENCE
This section provides an overview of:
• The feedback received from spectators during Race Day 2017
• Proposals for possible future interventions in order to enhance spectator experience
• Moving the event into the digital age• Key precedent events
Background
The Boat Race is an event which is steeped in history, a key component of its popularity. This history has seen a constant desire for people to watch crews racing and, for a significant period, training on the Tideway.
The current day event day focusses on delivery of elite level sporting competition. In certain locations on the course spectator interaction with the event is managed (Putney Embankment, Bishops Park and Furnival Gardens), but in general terms interaction is informal with spectators deciding how they choose to interface with the event at their chosen location on the course.
Race Day 2017 Observations
Arup, supported by BRC, deployed a team of 20 people to make observations of the event. Our team on the Championship Course in 2017 consisted of specialists in transportation planning, event operations, sports venue design and economic planning.
The observations made were both formal through surveys, and also informal in order to capture a technical snapshot of the day, along with the more subjective observations of how people were experiencing their day.
In total the team conducted in excess of 400 surveys with spectators on the event day. Questions posed to spectators can be summarised into the following themes.
• Transportation mode• Frequency of attendance • Spectator dwell times• Spending profiles
The technical components of the survey data have been discussed in previous sections of this report.
The observations made by the event day team in regard to the spectator experience, both positive and negative, lay the foundation to the themes discussed in this section of the report.
As the observations and recommendations in this section are specifically related to a particular demographic groups of spectators, they are discussed individually before combined recommendations are made at the end of the report. These groups of spectators are:
• Those who wish to attend The Boat Race as general spectators
• Those who wish to enhance their experience though a premium spectator experience
• Those who do not physically attend, but wish to follow The Boat Race through digital interfaces

26

27
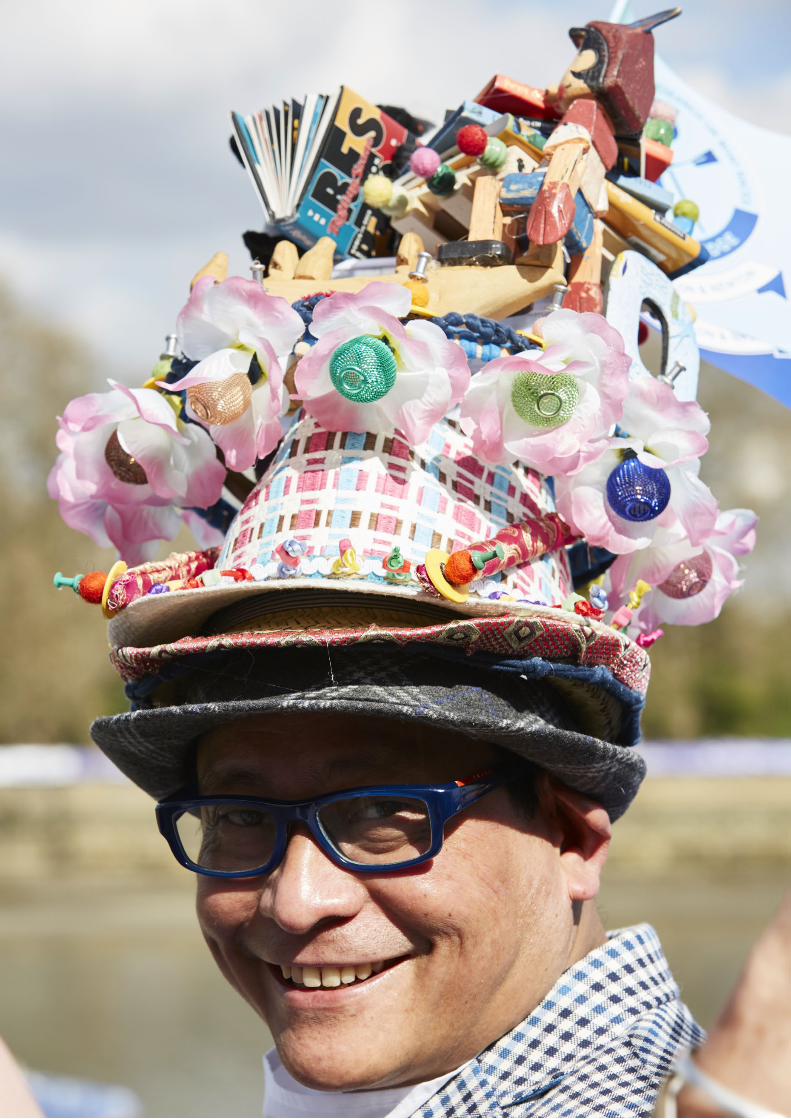
LEFT: Images taken by observation team during Race Day 2017
General Spectators Observations and Recommendations
One of the most appealing part of the The Boat Race for spectators is the fact that it is a non-ticketed, free to attend event – this is fundamental to the continued success of the event day.
Feedback received at the event shows a generally positive feeling towards the event, however, most of those questioned did have feedback on where they felt the event could be enhanced to deliver a better experience for those attending.
The primary theme in this feedback was a perceived lack of spectator information for those who were not familiar with the course, Race Day, or the area.
As discussed previously, the spectators attending the event are primarily from the local boroughs. These boroughs have a social and financial demographic of people who are highly likely to attend sporting and other events regularly. This results in spectators expectations of the event to be comparable with what is seen in other events.
Investigating the theme of information further it is possible to see three components.
Wayfinding
The lack of general signage including directional signage from public transport, to fan parks, to Food, Beverage and WC facilities caused a minor level of frustration. Here there is an opportunity to install temporary ‘event overlay’ to address this feedback and to extend the footprint of the event away from the river towards the routes used to access the river.
Event communication
Secondly, it was a common observation that spectators were expecting more interaction with the event itself.
Comments were made specifically relating to the number of video screens showing The Boat Race along the Championship Course (not enough provided to meet spectator expectations) and the lack of a commentary system for the spectators to follow Race Day in real time.

28
Spectator profile and location
On Race Day it was noted that the profile of spectators changes noticeably along the course – this could result in distinctly different experiences being sought in different locations on the course.
Putney Bridge and its immediate surrounding area was by far the highest populated area of the course. People here were far more engaged with the event from a sporting perspective. New to the event in 2017 was the Chapel Down Bar on Putney Embankment. Based on our observations footfall to this location would have been high.
The Fan Park located in Bishops Park was a success from a fan perspective with the space provided leading to families being drawn to that area. This space was managed by BRC who in turn engaged with a number of BRC partners to create a fan experience.
The Fan Park located in Furnival Gardens (managed by Adnams) was extremely busy and was generally populated by spectators in their mid-late 20’s in groups of friends. These spectators were drawn by the ‘festival’ feeling of the space.
Walking west along the course, there is a noticeable change in demographic from younger groups to families and older groups. This could provide opportunities to utilise Dukes Meadow as an event space focused on a different spectator profile however major rail public transport network does not serve this area well and transport would need to be managed carefully to avoid major impacts on surrounding residents.
Whilst the south of the river remains populated beyond Barnes Bridge, particularly towards the finish line. It is interesting to note that the north side of the river is very sparsely populated at this point and could offer opportunities for activation in future years.

29
Premium SpectatorsObservations and Recommendations
A major observation from the 2017 event was an apparent lack of publicly accessible ‘premium’ options for spectators to enhance their experience. It is common at major sporting events to offer a certain number of commercially marketed premium facilities.
These can range from full hospitality suites and seating areas, through to simple reserved areas that allow preferential access, views and a comfortable environment from which to watch the event.
Opportunities exist for the event to develop this type of offer to increase event day income. Key locations such as The Boat Race start, Hammersmith Bridge, Barnes and The Boat Race Finish could all accommodate these facilities, either hosted in existing buildings that are leased for the purpose, or via temporary installations of ‘event overlay’ that are only in place for the event itself, such as those used to deliver hospitality at Henley Royal Regatta.
On the river itself, there could be opportunities to drive revenue from offering places on flotilla craft before the race (such as the flotilla of small craft in 2017), this could be combined with access to dedicated spectator areas at the race start and finish to offer a full event experience.
Another option would be to utilise moored hospitality barges in areas of the course where they do not impede the views of those watching from the bank of the river or impact on the staging of The Boat Race itself.
As commercial premium spectator areas are not currently part of the event day, there is no set model for how this opportunity would be taken to market. In addition to the traditional sales model it would be beneficial to consider auctioning opportunities at select events, partnering with individuals and companies that share the ethos of The Boat Race or developing a ticketing model that could directly benefit the foundation through charitable donations.
30
31
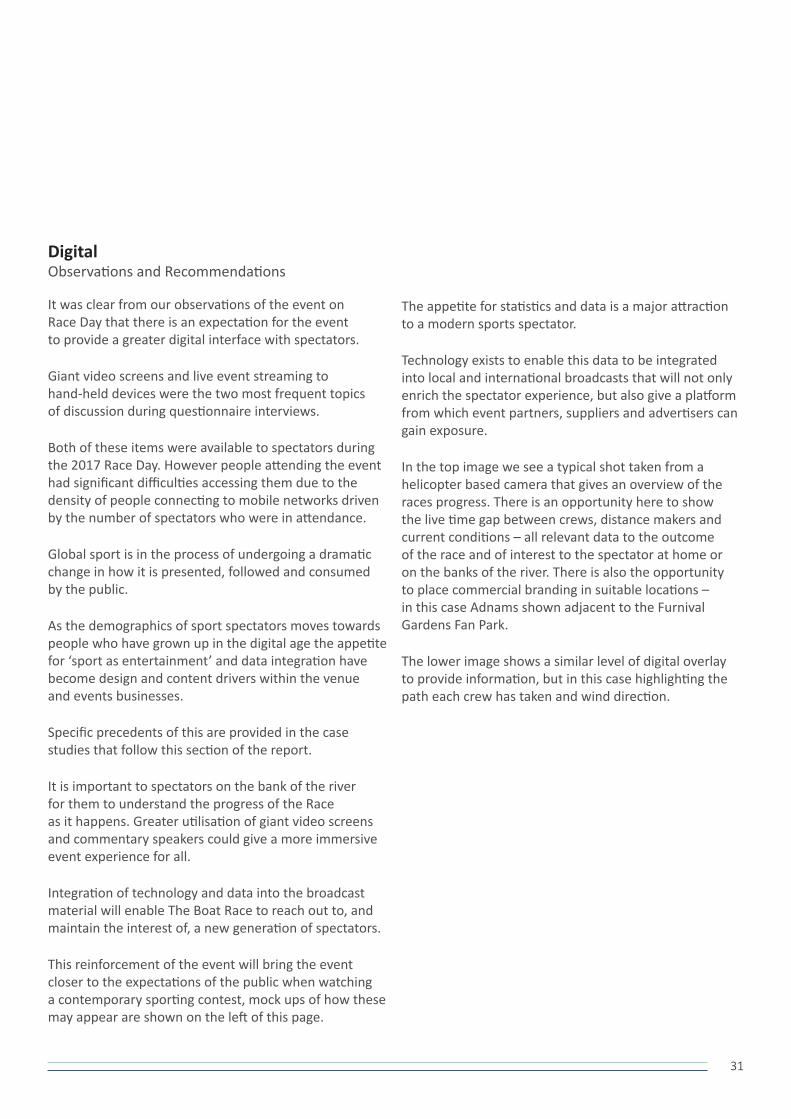
DigitalObservations and Recommendations
It was clear from our observations of the event on Race Day that there is an expectation for the event to provide a greater digital interface with spectators.
Giant video screens and live event streaming to hand-held devices were the two most frequent topics of discussion during questionnaire interviews.
Both of these items were available to spectators during the 2017 Race Day. However people attending the event had significant difficulties accessing them due to the density of people connecting to mobile networks driven by the number of spectators who were in attendance.
Global sport is in the process of undergoing a dramatic change in how it is presented, followed and consumed by the public.
As the demographics of sport spectators moves towards people who have grown up in the digital age the appetite for ‘sport as entertainment’ and data integration have become design and content drivers within the venue and events businesses.
Specific precedents of this are provided in the case studies that follow this section of the report.
It is important to spectators on the bank of the river for them to understand the progress of the Race as it happens. Greater utilisation of giant video screens and commentary speakers could give a more immersive event experience for all.
Integration of technology and data into the broadcast material will enable The Boat Race to reach out to, and maintain the interest of, a new generation of spectators.
This reinforcement of the event will bring the event closer to the expectations of the public when watching a contemporary sporting contest, mock ups of how these may appear are shown on the left of this page.
The appetite for statistics and data is a major attraction to a modern sports spectator.
Technology exists to enable this data to be integrated into local and international broadcasts that will not only enrich the spectator experience, but also give a platform from which event partners, suppliers and advertisers can gain exposure.
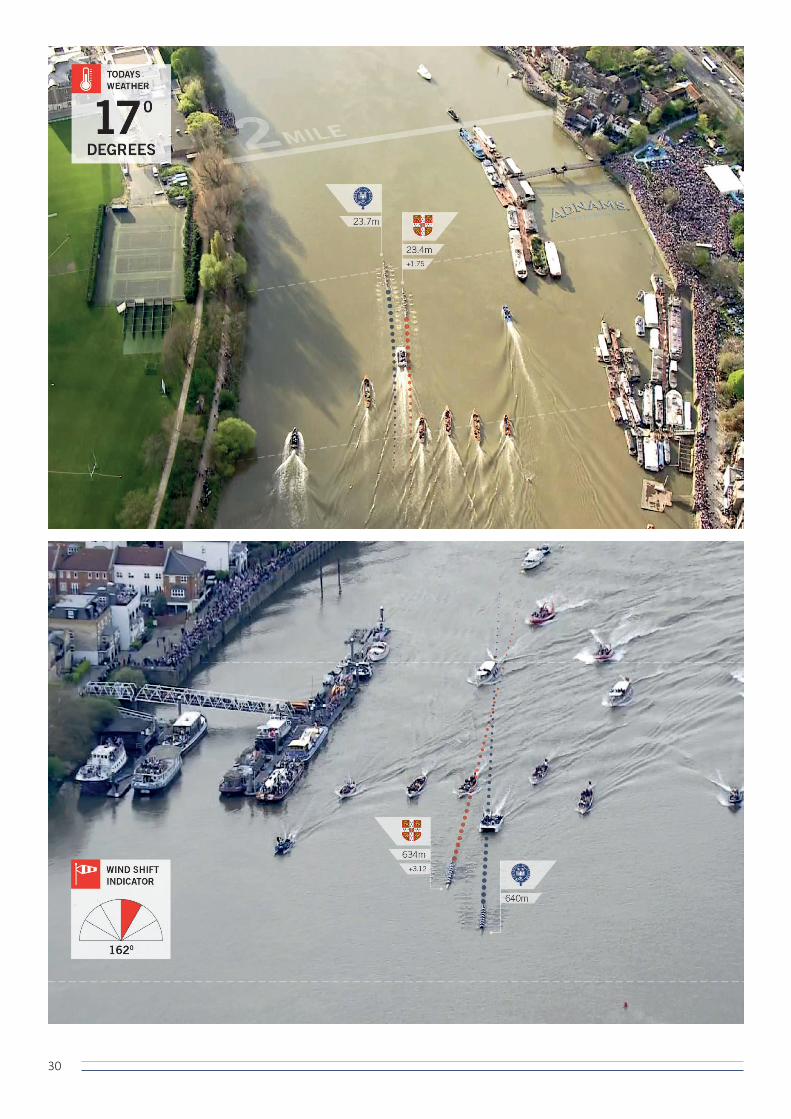
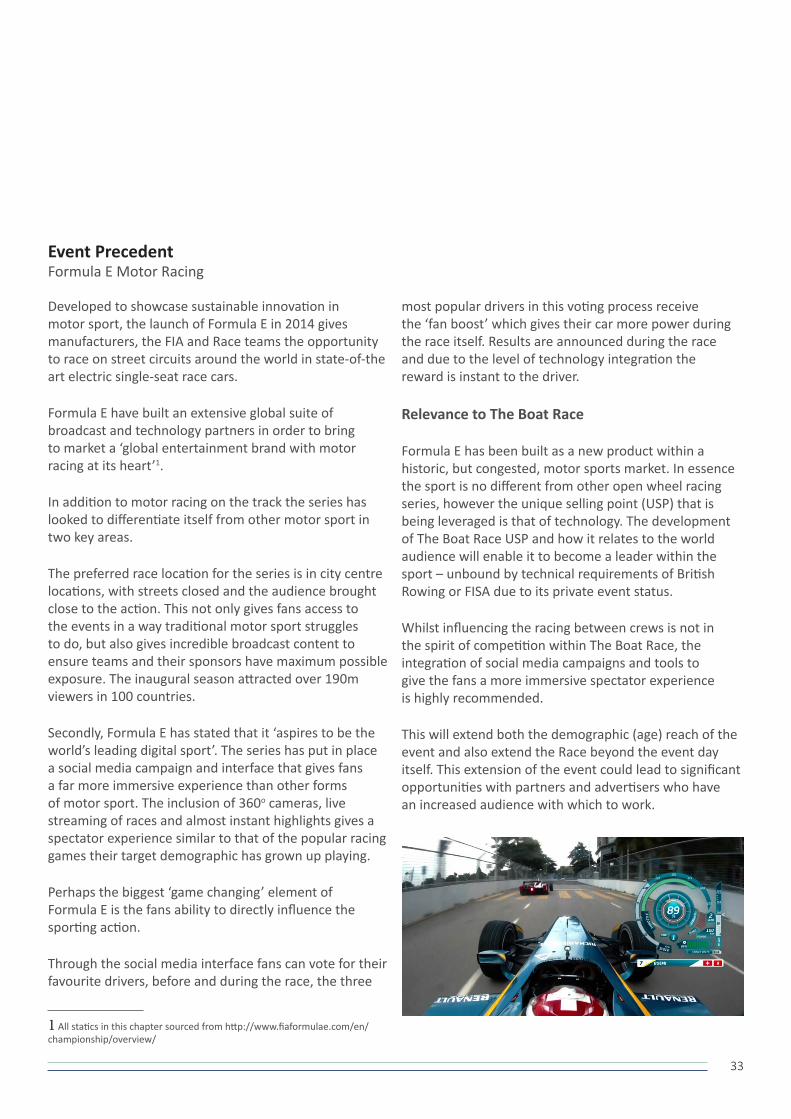
In the top image we see a typical shot taken from a helicopter based camera that gives an overview of the races progress. There is an opportunity here to show the live time gap between crews, distance makers and current conditions – all relevant data to the outcome of the race and of interest to the spectator at home or on the banks of the river. There is also the opportunity to place commercial branding in suitable locations – in this case Adnams shown adjacent to the Furnival Gardens Fan Park.
The lower image shows a similar level of digital overlay to provide information, but in this case highlighting the path each crew has taken and wind direction.
33
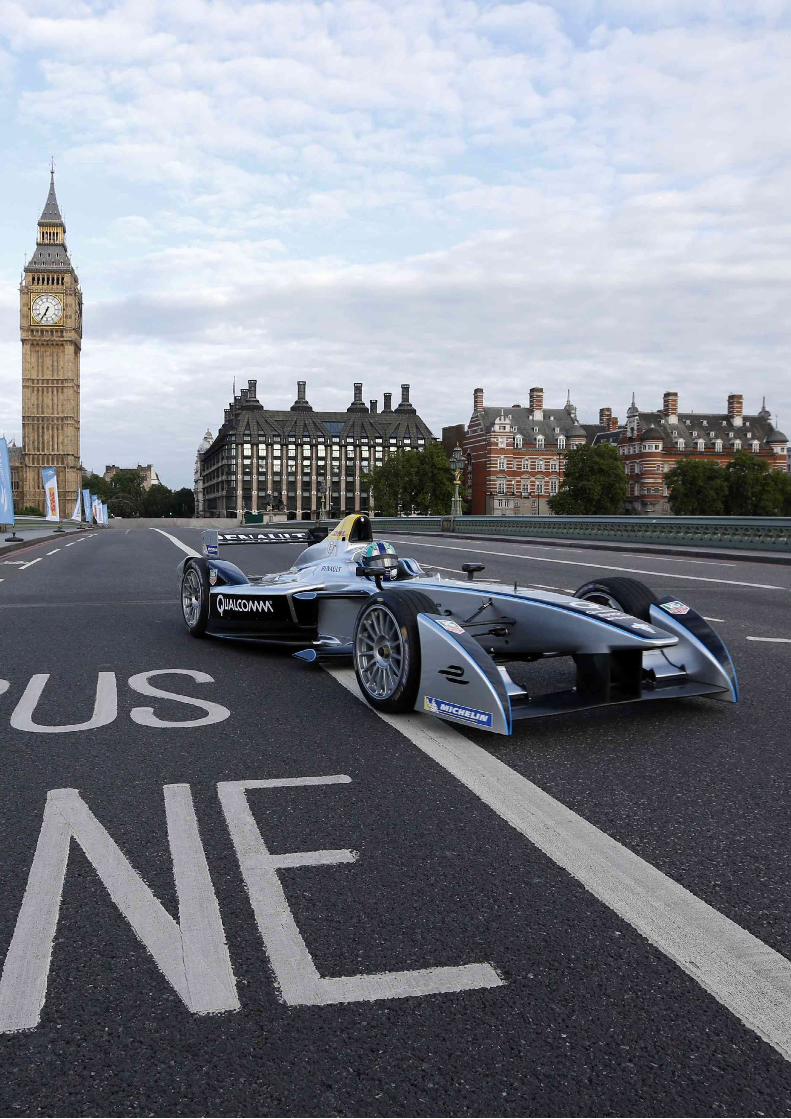
Event PrecedentFormula E Motor Racing
Developed to showcase sustainable innovation in motor sport, the launch of Formula E in 2014 gives manufacturers, the FIA and Race teams the opportunity to race on street circuits around the world in state-of-the art electric single-seat race cars.
Formula E have built an extensive global suite of broadcast and technology partners in order to bring to market a ‘global entertainment brand with motor racing at its heart’1.
In addition to motor racing on the track the series has looked to differentiate itself from other motor sport in two key areas.
The preferred race location for the series is in city centre locations, with streets closed and the audience brought close to the action. This not only gives fans access to the events in a way traditional motor sport struggles to do, but also gives incredible broadcast content to ensure teams and their sponsors have maximum possible exposure. The inaugural season attracted over 190m viewers in 100 countries.
Secondly, Formula E has stated that it ‘aspires to be the world’s leading digital sport’. The series has put in place a social media campaign and interface that gives fans a far more immersive experience than other forms of motor sport. The inclusion of 360o cameras, live streaming of races and almost instant highlights gives a spectator experience similar to that of the popular racing games their target demographic has grown up playing.
Perhaps the biggest ‘game changing’ element of Formula E is the fans ability to directly influence the sporting action.
Through the social media interface fans can vote for their favourite drivers, before and during the race, the three
1 All statics in this chapter sourced from http://www.fiaformulae.com/en/championship/overview/
most popular drivers in this voting process receive the ‘fan boost’ which gives their car more power during the race itself. Results are announced during the race and due to the level of technology integration the reward is instant to the driver.
Relevance to The Boat Race
Formula E has been built as a new product within a historic, but congested, motor sports market. In essence the sport is no different from other open wheel racing series, however the unique selling point (USP) that is being leveraged is that of technology. The development of The Boat Race USP and how it relates to the world audience will enable it to become a leader within the sport – unbound by technical requirements of British Rowing or FISA due to its private event status.
Whilst influencing the racing between crews is not in the spirit of competition within The Boat Race, the integration of social media campaigns and tools to give the fans a more immersive spectator experience is highly recommended.
This will extend both the demographic (age) reach of the event and also extend the Race beyond the event day itself. This extension of the event could lead to significant opportunities with partners and advertisers who have an increased audience with which to work.
35
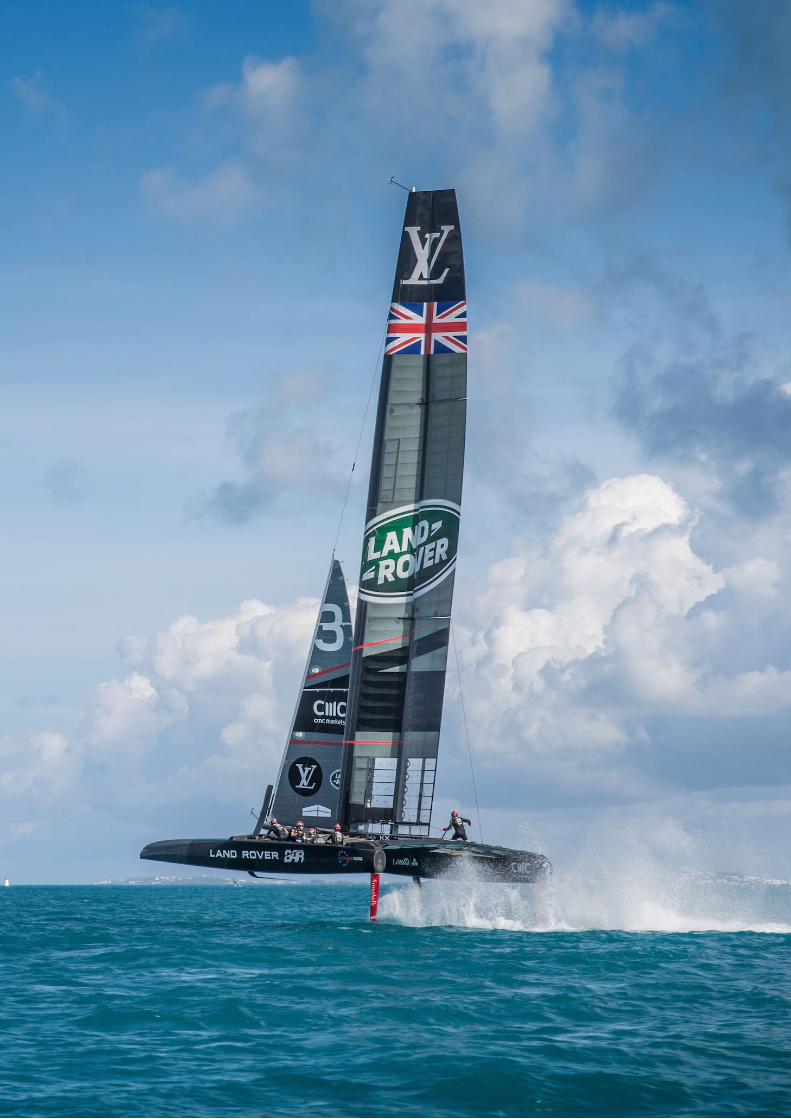
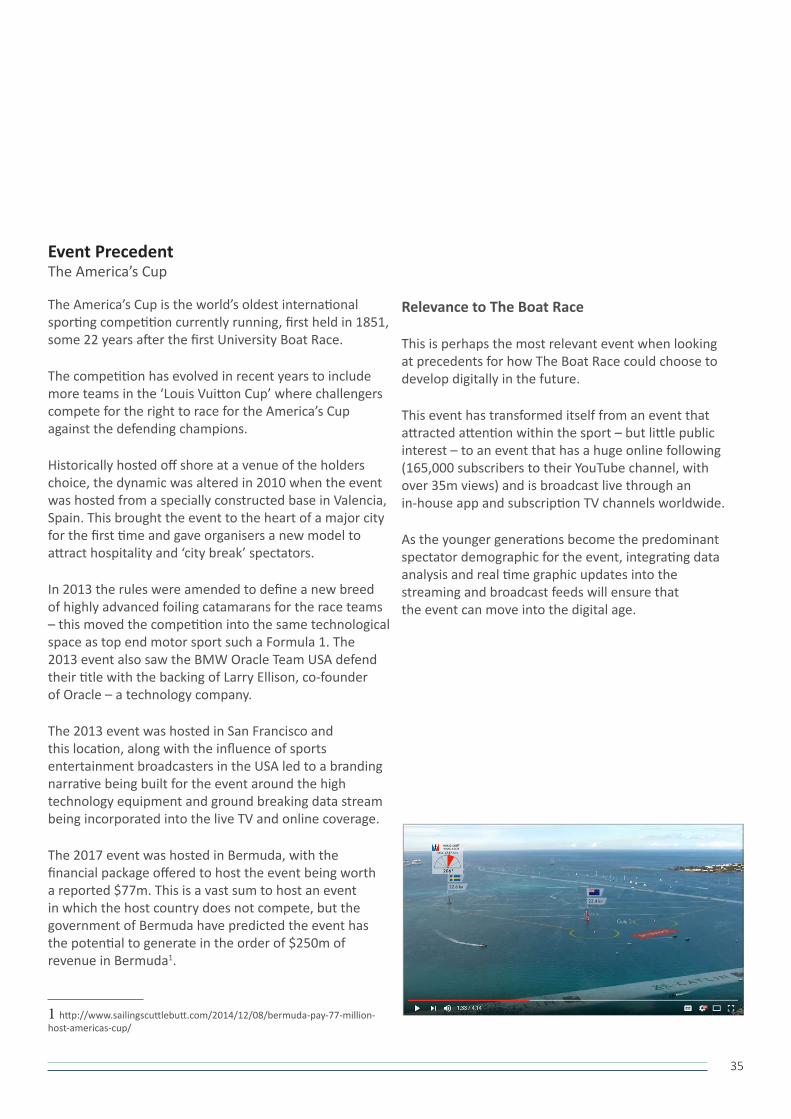
Event PrecedentThe America’s Cup
The America’s Cup is the world’s oldest international sporting competition currently running, first held in 1851, some 22 years after the first University Boat Race.
The competition has evolved in recent years to include more teams in the ‘Louis Vuitton Cup’ where challengers compete for the right to race for the America’s Cup against the defending champions.
Historically hosted off shore at a venue of the holders choice, the dynamic was altered in 2010 when the event was hosted from a specially constructed base in Valencia, Spain. This brought the event to the heart of a major city for the first time and gave organisers a new model to attract hospitality and ‘city break’ spectators.
In 2013 the rules were amended to define a new breed of highly advanced foiling catamarans for the race teams – this moved the competition into the same technological space as top end motor sport such a Formula 1. The 2013 event also saw the BMW Oracle Team USA defend their title with the backing of Larry Ellison, co-founder of Oracle – a technology company.
The 2013 event was hosted in San Francisco and this location, along with the influence of sports entertainment broadcasters in the USA led to a branding narrative being built for the event around the high technology equipment and ground breaking data stream being incorporated into the live TV and online coverage.
The 2017 event was hosted in Bermuda, with the financial package offered to host the event being worth a reported $77m. This is a vast sum to host an event in which the host country does not compete, but the government of Bermuda have predicted the event has the potential to generate in the order of $250m of revenue in Bermuda1.
1 http://www.sailingscuttlebutt.com/2014/12/08/bermuda-pay-77-million-host-americas-cup/
Relevance to The Boat Race
This is perhaps the most relevant event when looking at precedents for how The Boat Race could choose to develop digitally in the future.
This event has transformed itself from an event that attracted attention within the sport – but little public interest – to an event that has a huge online following (165,000 subscribers to their YouTube channel, with over 35m views) and is broadcast live through an in-house app and subscription TV channels worldwide.
As the younger generations become the predominant spectator demographic for the event, integrating data analysis and real time graphic updates into the streaming and broadcast feeds will ensure that the event can move into the digital age.

37
Event PrecedentT20 Cricket
Twenty20 was launched in England in 2003 and has become the format of the game that attracts the most spectators globally.
Whilst the rule differences between Twenty20 and Test cricket are minor to the general spectator, subtle changes have been made to encourage quicker, more dynamic play with a focus on hitting the ball to the boundary.
Whilst the format was introduced at a domestic scale, the game quickly expanded globally to now encompass 15 recognised first class leagues led by the Indian Premier League (IPL), English T20 Blast and Australia’s Big Bash League.
Twenty20 cricket have also been in a position to benefit from the introduction of professional sports presentation to a sport where opportunities were previously limited.
Whilst there has been technological success within the T20 game, such as the development of the Decision Review System which has fed back into ODI and Test cricket, the primary success of T20 is to have engaged the spectator in a way that has not been possible in other forms of the game previously.
By holding games at times that make it easy to attend, that last a maximum of 3 hours, T20 has created an event that is attractive to a wide range of spectators from groups of adults through to families.
The high profile that the format attracted and the interest generated led to the International Cricket Council creating a T20 World Cup tournament that was first played in 2007 (men) and 2009 (women).
T20 cricket has managed to redefine its sport, it has now taken a lead for the sport on integrating technology and fan engagement that has advanced the sport in entirety.
Relevance to The Boat Race
The leadership shown by Twenty20 cricket gives a model of how a single component of sport can take a leadership role that is not only commercially successful but also increases the level of the elite sports people who participate.
The ability for this format of the sport to take this role, but also to move the sport as a whole in terms of how it engages with spectators in both stadiums and to a global broadcast audience, could provide key lessons that could be investigated further within The Boat Race event in order to develop a relationship with local communities, broadcast partners and the event operations team.
38
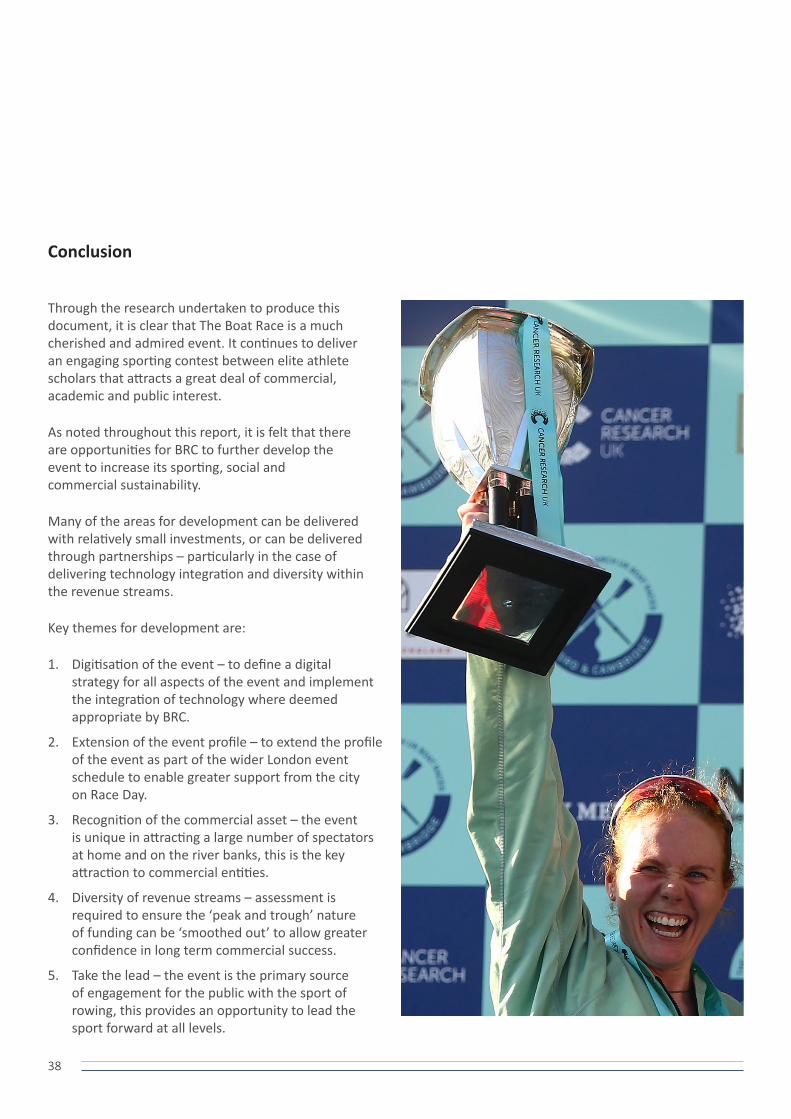
Conclusion
Through the research undertaken to produce this document, it is clear that The Boat Race is a much cherished and admired event. It continues to deliver an engaging sporting contest between elite athlete scholars that attracts a great deal of commercial, academic and public interest.
As noted throughout this report, it is felt that there are opportunities for BRC to further develop the event to increase its sporting, social and commercial sustainability.
Many of the areas for development can be delivered with relatively small investments, or can be delivered through partnerships – particularly in the case of delivering technology integration and diversity within the revenue streams.
Key themes for development are:
1. Digitisation of the event – to define a digital strategy for all aspects of the event and implement the integration of technology where deemed appropriate by BRC.
2. Extension of the event profile – to extend the profile of the event as part of the wider London event schedule to enable greater support from the city on Race Day.
3. Recognition of the commercial asset – the event is unique in attracting a large number of spectators at home and on the river banks, this is the key attraction to commercial entities.
4. Diversity of revenue streams – assessment is required to ensure the ‘peak and trough’ nature of funding can be ‘smoothed out’ to allow greater confidence in long term commercial success.
5. Take the lead – the event is the primary source of engagement for the public with the sport of rowing, this provides an opportunity to lead the sport forward at all levels.
39
Acknowledgements
This report has been prepared jointly by The Boat Race Company and Arup. Many technical consultancy specialists and event management experts have produced content and narrative for inclusion in this report, individuals who have been part of this project are listed below.
The Boat Race CompanyRobert Gillespie, David Searle, Fergus Murison, Anna Troup, Pete Bridge, Cath Bishop, Paul Withers, Fiona Morrison, Michelle Dite.
ArupMaja Belic, Nick Birmingham, Paul Brislin, Maria Canovas, Chris Dite, Chris Du Sautoy, Chris Dunn, Andrew Edge, Jerome Frost, Will Goode, Suzanne Harb, Zoe Jankel, Phillip Jones, Ernie Lee, Ana Loreto, Aude Lucien, Nic Merridew, Jo Ronaldson, Chris Rooney, Doug Rose, Manan Shah, Malcolm Smith, Ken Tagoe, Paul Thorpe, Eugene Uys, Clara Yeung.
Race Day Questionnaire teamCharlie Austen, Saskia Barnes, George Blake, Morgan Freeman, Lauren Hines, Izzy Maxwell, Theo Le Morvan.
Images in this report of The Boat Race 2017 are taken from official race photographs provided by The Boat Race Company, or were taken by members of the Arup team during the Race Day observations programme.