the biopsychosocial model of risk for … · the biopsychosocial model of risk for depression ......
TRANSCRIPT

THE BIOPSYCHOSOCIAL MODEL
OF RISK FOR DEPRESSION Kimberly Dienes, Ph.D.
Assistant Professor
Department of Psychology
Roosevelt University
What distinguishes individuals
who develop depression
following a life stressor
from those that do not?
Outline Introduction to the literature
Study 1
Part 1-Cortisol secretion in depressed and at-risk
adults
Part 2-Stress sensitivity and risk for depression
Study 2-Characterization of the stress sensitive
phenotype
Study 3-Interventions for stress sensitivity
Racial Differences in HPA Axis Functioning
Future Directions

Depression Second most burdensome disease in terms of disability-adjusted life years by 2020 (Global Burden of Disease Study, 2010)
Lifetime incidence is 20% in the US and yearly prevalence between 8-12% in the UK (Kessler et al., 2005, NCS-R, The Office for National Statistics Psychiatric Morbidity report, 2001)
Annual salary-equivalent costs of depression related lost productivity in the U.S. exceeds $33 billion.
In the UK, around 10 billion pounds in terms of yearly costs for treatment of depression are reported

Genes
Cognitive Style
HPA Axis Dysregulation
Personality Style
Early Adversity
Personality Type
Chronic Stress
Stressful Life Events
Mood Reactivity to Stress
DIATHESES
DEPRESSION
Stress
Diathesis Stress Models

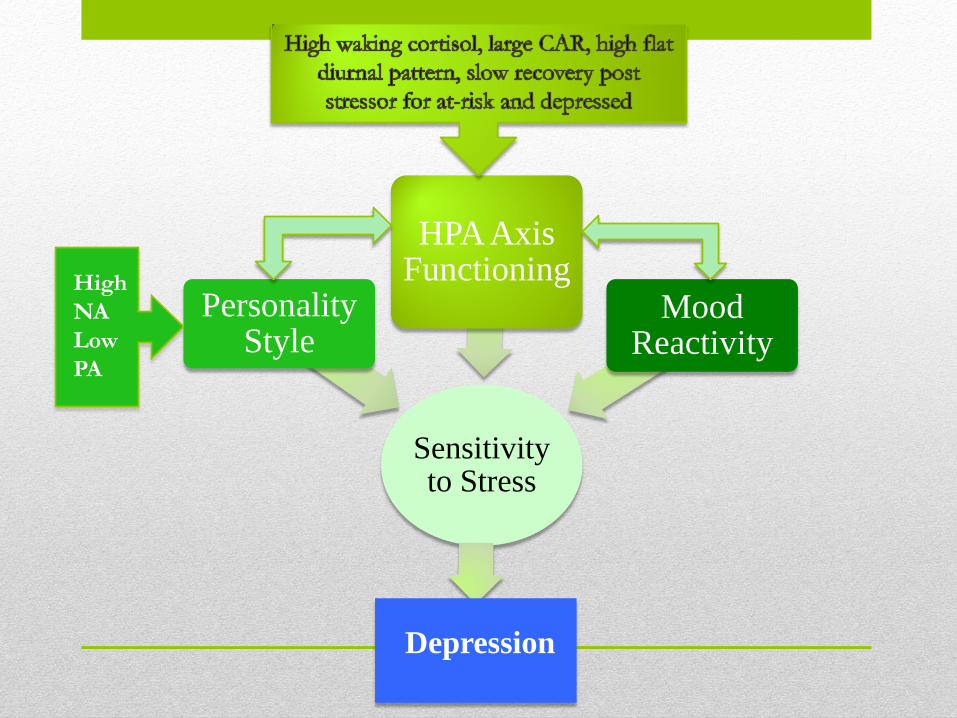
Sensitivity to Stress
Personality Style
HPA Axis Functioning
Mood Reactivity
Depression
The Biopsychosocial Model of Stress Sensitivity and Risk for Depression
High
NA
Low
PA

HPA Axis
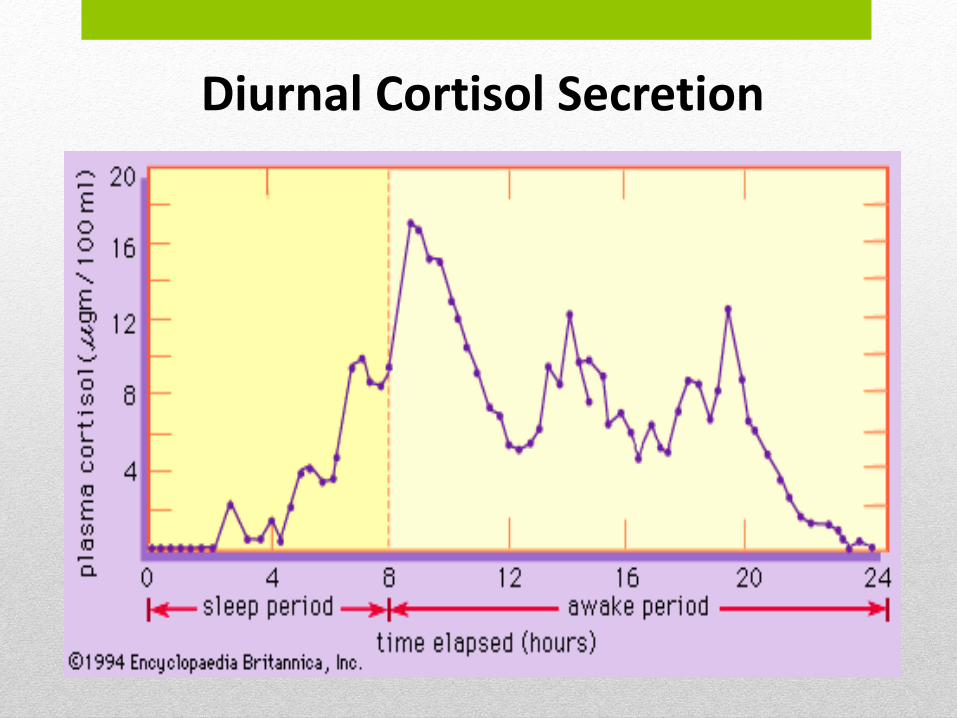
Diurnal Cortisol Secretion

Cortisol Reactivity to an Acute Stressor
STRESSOR

Past Research
At-Risk for Depression Currently Depressed
Diurnal
Cortisol
Secretion
Higher waking cortisol
Large CAR
High flat pattern
High waking
Large CAR
Low evening
Cortisol
Reactivity ? Slow return to baseline
STUDY 1-PART 1 Cortisol Secretion in Depressed and At-Risk Adults
Dienes et al., 2013, PNEC
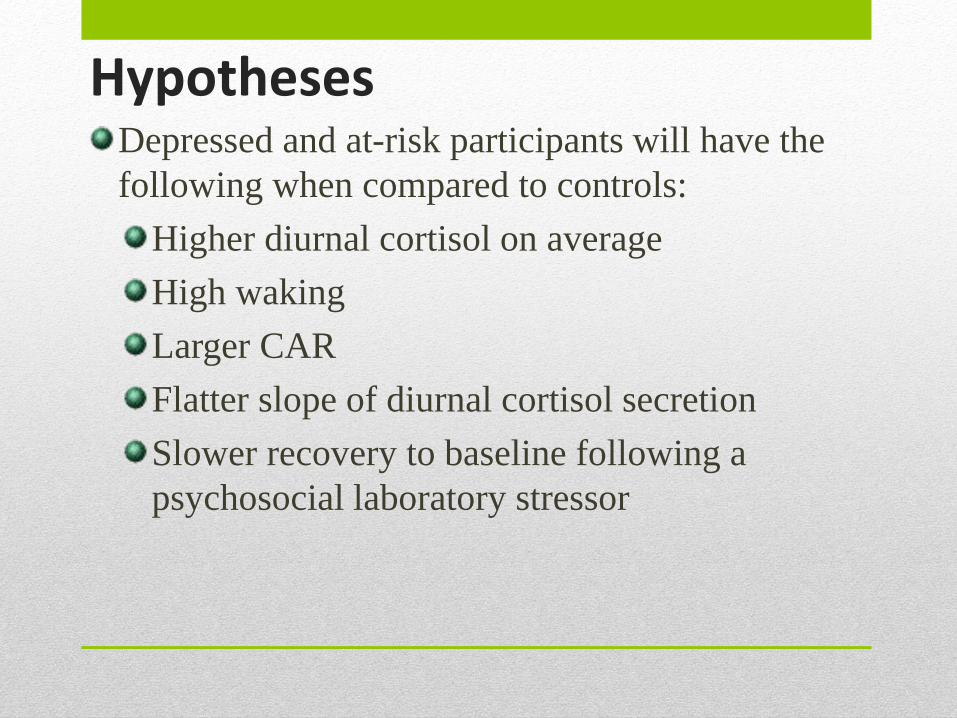
Hypotheses Depressed and at-risk participants will have the
following when compared to controls:
Higher diurnal cortisol on average
High waking
Larger CAR
Flatter slope of diurnal cortisol secretion
Slower recovery to baseline following a
psychosocial laboratory stressor
Sensitivity to Stress
Personality Style
HPA Axis Functioning
Mood Reactivity
Depression
High
NA
Low
PA

Participants 57 women ages 18-23
24. 6% Caucasian, 26.3% Asian/Pacific Islander, 19.3%
Hispanic, 7.0% Middle Eastern, 5.3% Indian, 7.0%
Biracial, 1.8% African American
Exclusion Criteria
Heavy smokers, steroid medication use, pregnancy, serious medical condition
Generalized anxiety disorder, dysthymic disorder, panic disorder, obsessive-compulsive disorder, psychotic symptoms, psychoactive substance abuse, post-traumatic stress disorder, anorexia and bulimia nervosa

Initial Interview Modified SCID (Structured Clinical Interview for DSM-IV: First et al., 1995)
Life Stress Interview (Hammen et al., 1987)
Early Adversity Questionnaire (Cohen et al., 2004)
Beck Depression Inventory II (Beck et al., 1996)

Groups Depressed
(N=15)
At-risk (high NA, low PA)
(N = 20)
Control (high PA, low NA)
(N = 22)

Cortisol Sampling Daily sampling - 4 samples a day for 5 days; wakening,
30 min, 8 hours and 11 hours post wakening
Trier Social Stress Test (TSST; Kirschbaum et al., 1993)
– Baseline sample, 5 min prep, 5 min speech task, 5
minute math task, immediate post-task sample, 10 min, 25
min, and 40 min post task samples (total 5 samples)
Prep 10 min 15 min 15 min ST MT
1 2 3 4 5

Control
(N = 22)
At-risk
(N = 20)
Depressed
(N = 15)
Total
(N = 57)
Anxiety Sx* 36.4% 65.0% 80% 57.9%
Early Adversity* 54.6% 90% 73.3% 71.9%
Total Chronic Stress*
(M ± SD)
19.4 ± 2.58 21.9 ± 3.08 23.7 ± 3.27 21.4 ± 3.38
BDI-II*
(M ± SD)
4.39 ± 3.30 6.10 ± 5.48 18.0 ± 7.67 8.57 ± 7.86
Psychosocial Variables
* Groups significantly different at p < 0.05
Note: Subscripts indicate groups that are not significantly different from each other

Statistics Hierarchical Linear Modeling
Diurnal cortisol-Three level model, samples within days
within persons for diurnal cortisol.
TSST-Two level model, samples within persons.
Level 1: LNCORT = b0j + b1j(MIN12) + b2j(MIN23) + b3j(MIN35) + eij
Level 1: LNCORT = b00 + b01(TIME) + b02(TIMESQ) + b03(MORNRISE) + r
Level 3: g00 = d00 + d01(GROUP)j + d02(BIOBEH)j + d03(PSYCHOSOC)j + ej
Level 2: b00 = g00 + g01(WAKETIME)j + u
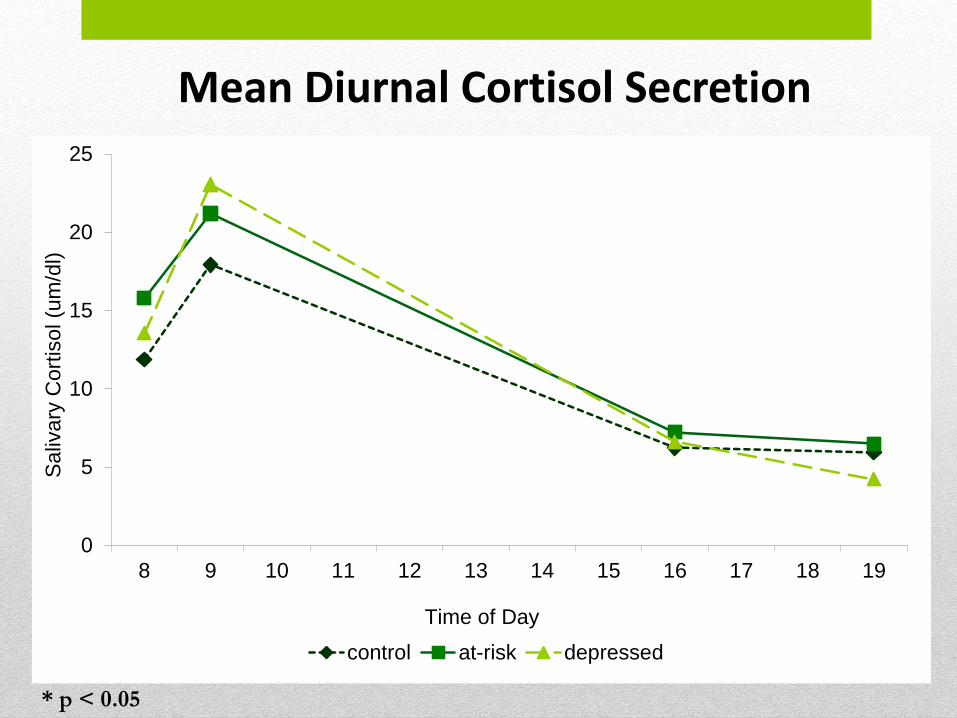
Mean Diurnal Cortisol Secretion
+
0
5
10
15
20
25
8 9 10 11 12 13 14 15 16 17 18 19
Saliv
ary
Cort
isol (u
m/d
l)
control at-risk depressed
Time of Day
* p < 0.05

Control
(N = 21)
(M ± SD)
At-risk
(N = 20)
(M ± SD)
Depressed
(N = 13)
(M ± SD)
Total
(N = 54)
(M ± SD)
Embarrassed during speech* 2.95 ± 1.99a 4.94 ± 1.91b 4.25 ± 2.06ab 3.93 ± 2.13
Eye contact during speech* 4.71 ± 1.49a 3.13 ± 1.36 5.14 ± 1.29a 4.33 ± 1.61
Voice steady during speech* 4.48 ± 1.17ab 3.63 ± 1.20b 4.75 ± 1.45a 4.28 ± 1.32
Fidgety during speech* 3.38 ± 1.63a 5.06 ± 1.73 3.50 ± 1.23a 3.94 ± 1.71
Voice steady during math* 4.81 ± 1.17a 3.56 ± 1.63b 4.64 ± 1.65ab 4.37 ± 1.54
Difficulty of the experience* 2.38 ± 1.07a 3.25 ± 1.07b 3.00 ± 1.18ab 2.85 ± 1.15
Tense* 2.76 ± 1.22a 3.75 ± 1.16b 3.21 ± 1.19ab 3.24 ± 1.25
TSST Psychosocial Variables
* Groups significantly different at p < 0.05
Note: Subscripts indicate groups that are not significantly different from each other
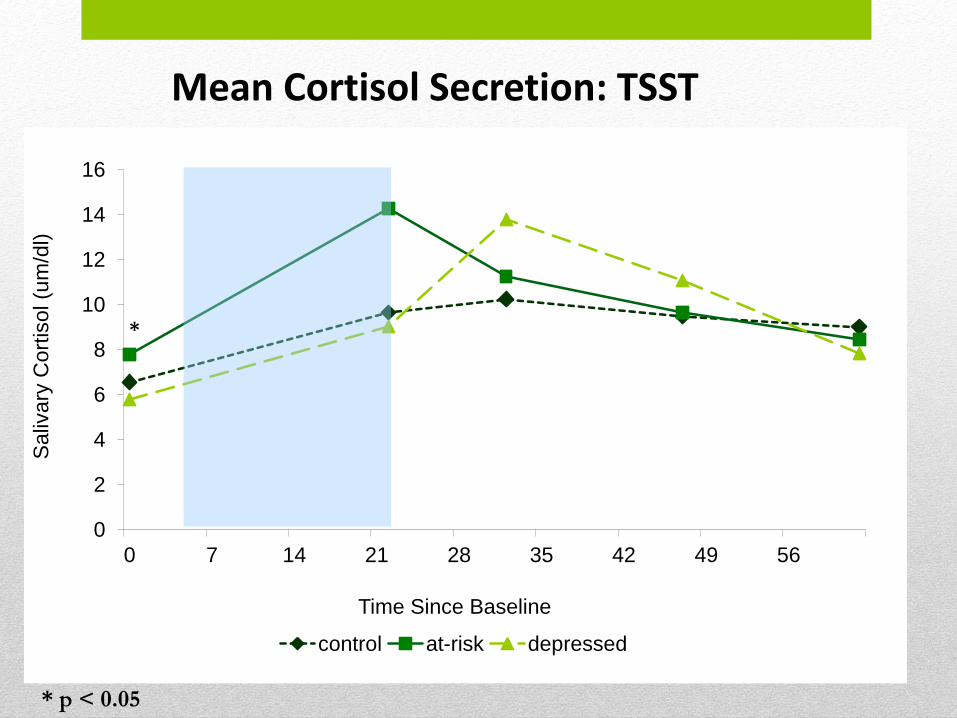
Mean Cortisol Secretion: TSST
0
2
4
6
8
10
12
14
16
0 7 14 21 28 35 42 49 56
Saliv
ary
Co
rtis
ol (u
m/d
l)
Time Since Baseline
control at-risk depressed
*
* p < 0.05
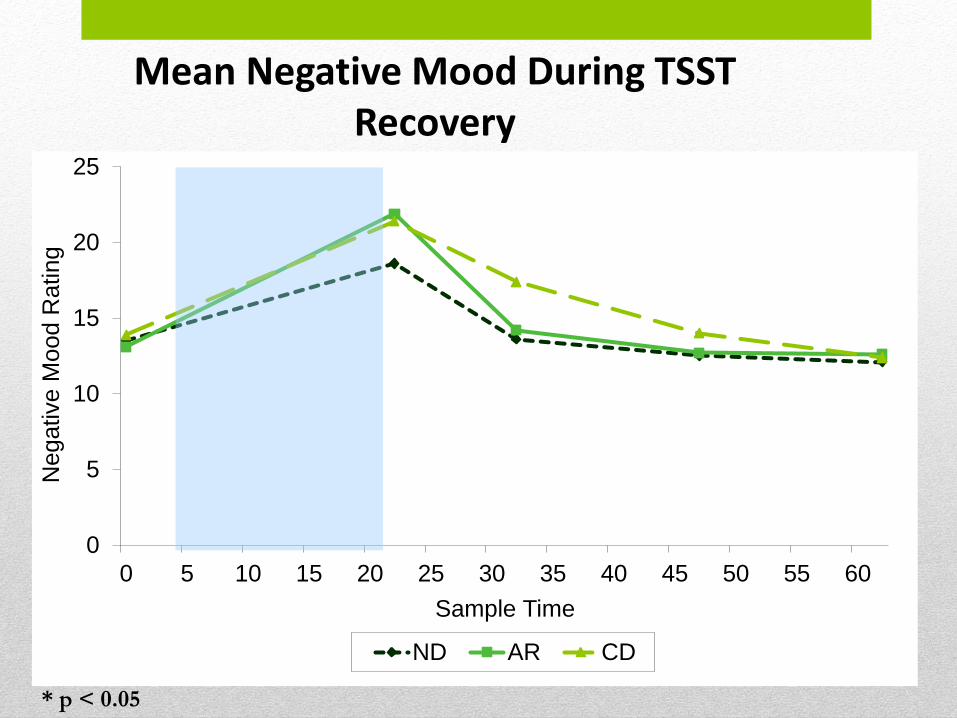
Mean Negative Mood During TSST Recovery
0
5
10
15
20
25
0 5 10 15 20 25 30 35 40 45 50 55 60
Negative M
ood R
ating
Sample Time
ND AR CD
* p < 0.05

Discussion Diurnal cortisol for depressed vs. controls were
mainly in keeping with prediction and community
research.
Higher waking levels but not CAR for the at-risk
group compared to controls.
Rapid cortisol reactivity for the at-risk group
compared to the depressed group-resilience and/or
sensitivity to threat?
STUDY 1-PART 2 Mood Reactivity to Naturalistic and Laboratory Stressors and the Relationship Between Cortisol and Mood Reactivity
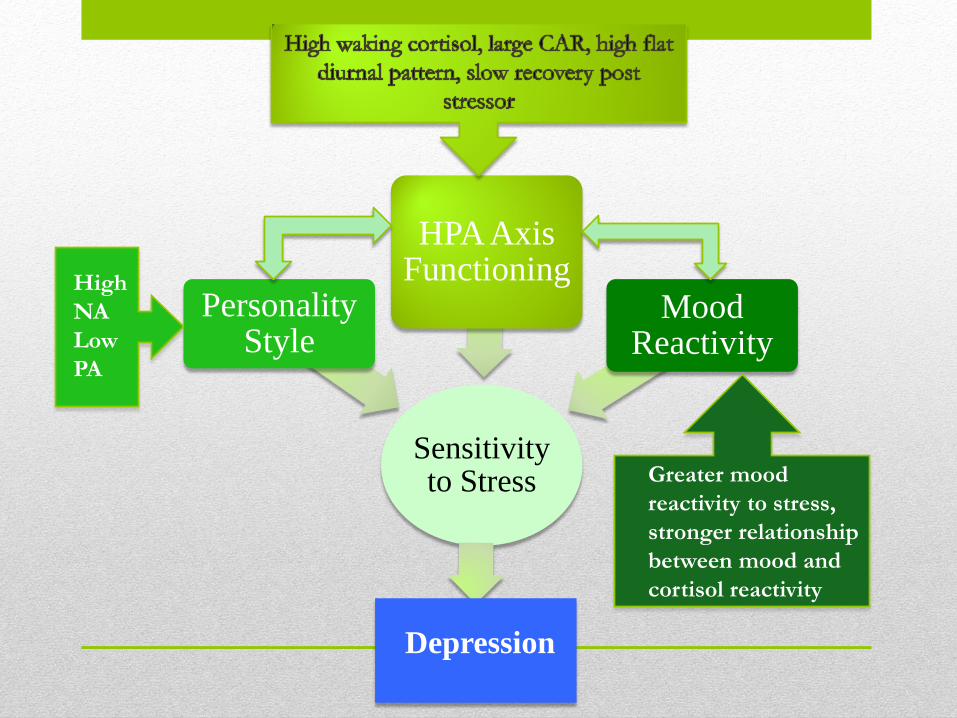
Sensitivity to Stress
Personality Style
HPA Axis Functioning
Mood Reactivity
Depression
High
NA
Low
PA
Greater mood
reactivity to stress,
stronger relationship
between mood and
cortisol reactivity

Hypotheses Greater severity of stress will predict increased
negative mood, especially for depressed and at-
risk participants compared to controls.
There will be a significant relationship between
elevated cortisol secretion and increased mood
reactivity to daily naturalistic stressors.
Depressed and at-risk participants will have a
stronger relationship between cortisol and mood
reactivity to both naturalistic and laboratory
stressors compared to controls.

Procedure Daily Diary (Computerized, nightly before bed for 2 weeks, 5 min)
The Multiple Adjective Affect Checklist (MAACL)
Stressful Events Checklist
Momentary PANAS filled out at each point of diurnal cortisol sampling and across the TSST
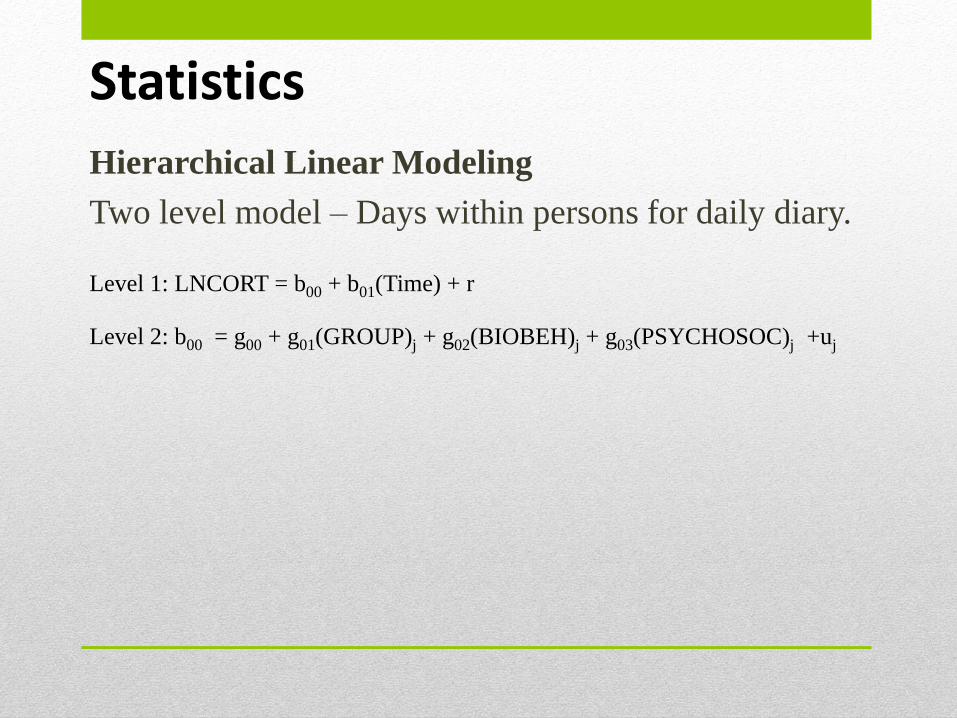
Statistics
Hierarchical Linear Modeling
Two level model – Days within persons for daily diary.
Level 1: LNCORT = b00 + b01(Time) + r
Level 2: b00 = g00 + g01(GROUP)j + g02(BIOBEH)j + g03(PSYCHOSOC)j +uj

Daily Mood and Stress
The depressed group had elevated negative mood and
reported greater severity of stress on a daily basis than
both the at-risk and control groups.
The at-risk group had a significant decrease in negative
mood with increased reported stress compared to the
depressed group, but did not differ significantly from the
control group.

Equation Model of Mood and Stress
Negative Mood, Stress and Diurnal Cortisol
Overall, a flatter, or more positive, slope of diurnal
cortisol secretion was predictive of increased emotional
reactivity to stress.
There were no significant differences among the groups in
the relationship among negative mood, stress, and cortisol
Diurnal Cortisol and Mood at Time of Sampling
The depressed group had significantly less of an increase
in cortisol secretion with an increase in negative mood
compared to the at-risk and control groups for diurnal
cortisol secretion
The three groups differed significantly in the
relationship between cortisol and negative mood in
response to the TSST. The depressed group had the
strongest relationship between cortisol secretion and
negative mood.

Regression Lines for Negative Mood and Diurnal Cortisol at Time of Sampling
0
5
10
15
20
25
30
35
40
45
50
11 13 15 17 19 21 23 25 27 29 31 33 35 37 39 41
Saliv
ary
Cort
isol
Negative Mood
control at-risk depressed

25
30
35
40
45
50
55
60
65
70
75
low negative mood high negative mood
Perc
en
t in
Cate
go
ry
low cortisol
secretion
high cortisol
secretion
Depressed Group
Discussion
Depression and major stressful life events
At-risk group and reactivity/resilience

STRESS GENERATION AND HPA
AXIS FUNCTIONING
Stress Generation Hypothesis: Dependent events and interpersonal
events will significantly predict diurnal cortisol
secretion, whereas achievement events will not.
Procedure: Life Stress Interview (Hammen et al.,
1987)
Events rated 3 or higher across the two weeks
Objective stress rating teams
Dependency, Interpersonal, Achievement

STUDY 2 Stress Sensitivity and Cortisol Secretion

Sensitivity to Stress
Personality Style
HPA Axis Functioning
Mood Reactivity
Depression
High
NA
Low
PA
Negative self
evaluation, and quick
recovery in negative
mood following the
TSST

Objectives Replication and improved methodology
Further characterization of stress sensitive
individuals to determine factors that might be
associated with
High waking levels of cortisol
Rapid rise in cortisol in response to the TSST
Quick recovery in negative mood following the
TSST
Factors Associated With the Stress Sensitive Phenotype
Early Adversity
Emotion Regulation
Personality Variables
Coping Style
Anxiety comorbidity
Chronic and Episodic Life Stressors-number, type,
duration, dependency

Procedure Prescreening
Initial Interview: SCID, LSI-6 months
Questionnaire Packet
Diurnal Cortisol Sampling
CAR-0, 30, 60 min post waking
12 hours post waking
TSST
Prep 10 min 15 min 15 min ST MT
1 2 3 4 5
Res
t

Measures Life Experiences Questionnaire (Gibb et al., 2001)
Early Adversity Questionnaire (EAQ; Cohen et al. 2004)
State-Trait Anxiety Inventory (STAI-T and STAI-S:
Spielberger, 1983)
IPIP Neuroticism Scale
BIS/BAS Scales (Carver & White, 1994)
Difficulties in Emotion regulation Scale (DERS; Gratz &
Roemer, 2004
Multidimensional Perfectionism Scale (MPS: Hewitt et
al., 1991)
Ways of Coping (Revised)
BDI-II
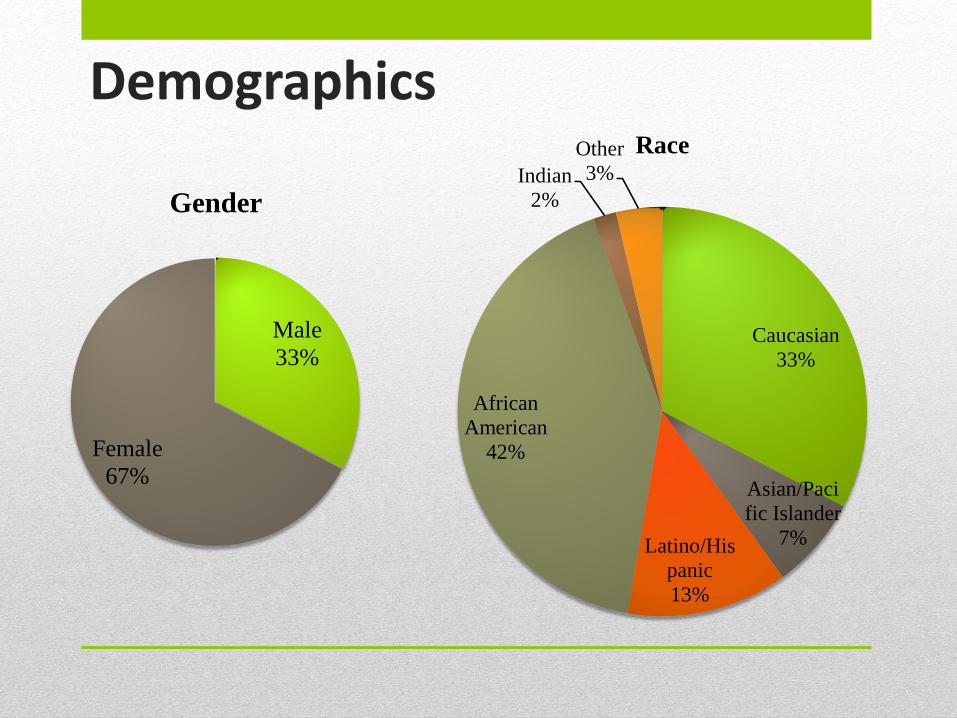
Demographics
Male
33%
Female
67%
Gender
Caucasian
33%
Asian/Paci
fic Islander
7% Latino/His
panic
13%
African
American
42%
Indian
2%
Other
3%
Race

STUDY 3 Interventions for Stress Sensitivity

Group CBT Intervention for Stress Reduction
The CAR was compared pre and post a four week
group CBT intervention for stress reduction for
eleven participants
Three of the eleven participants were deemed
compliant based on negative CAR profiles
AUCi was significantly lower post intervention for
compliant participants, though if all participants are
included in analyses the decrease is not significant

CAR Pre and Post Intervention

CAR Pre and Post Intervention

RACIAL DIFFERENCES IN HPA
AXIS FUNCTIONING

Relationship among race, discrimination and cortisol secretion
Differences in diurnal cortisol secretion have been
found among racial groups, but there is less research
on racial differences in response to the TSST
Study 1
Study 2

0
2
4
6
8
10
12
14
16
0 min 22 min 32 min 47 min 62 min
Asian American Caucasian Hispanic American
Study 1:Mean Cortisol Secretion in Response to the TSST
by Group
Sa
liv
ary
Cort
isol
(um
/dl)
Minutes Since Baseline

19.3
30.5
0 5 10 15 20 25 30 35
C
AA
GEDS Lifetime Score
Race
Study 2: Mean Lifetime Discrimination Scores

0
2
4
6
8
10
12
14
16
18
20
0 5 10 15 20 25 30 35 40 45 50 55 65
Cort
isol
(um
/dl)
Minutes
Caucasian African American
Study 2: Cortisol Secretion Across the TSST

Future Directions
Longitudinal study stress sensitive individuals to
determine if they develop depression
Experience Sampling Methodology to investigate mood
and cortisol reactivity to naturalistic stress in stress
sensitive individuals
Treatment study to determine if several interventions
(self compassion, mindfulness meditation) can reduce
biopsychosocial stress sensitivity in individuals at-risk
for depression

Thank You!!!!! Roosevelt University
Nick Hazel
Sheila Collins
DAS Lab: Michelle Montero, Bethany Apa, Allison Asarch, Sam Macy, Justin Garber, Nick Calingaert, Orly Weltfried, Joe Freundlich, Sarah Fredickson, Matt Harker, Kristy Engel
Connie Hammen and the Hammen Lab at UCLA
Study 1 Team: Chin Man, Lindsay Boulineau, Anibal, Jorge, Daisy, Samanda, Samia, Donna, Esther
Dr. Emma Adam, Northwestern University