the binding ability of alpha-1-acid ... - …/media/worktribe/output-206019/thesis... · dsm-iv...
TRANSCRIPT
THE BINDING ABILITY OF ALPHA-1-ACID
GLYCOPROTEIN AS A MECHANISM OF RESISTANCE
TO METHADONE.
Submitted by
Jennifer Lucy Behan
A thesis submitted in partial fulfilment of the
requirements of Edinburgh Napier University for the award
of Doctor of Philosophy.
October 2010
School of Life, Sport and Social Sciences
Edinburgh Napier University
Edinburgh

I
Declaration
It is hereby declared that this thesis is the result of the author’s original research. It has
been composed by the author and has not been previously submitted for examination
which has lead to the award of a degree.
Signed:

II
Acknowledgements
First and foremost I would like to thank all those who have been involved in making
this experience possible.
I would like to highlight a number of individuals who have played a pivotal role during
the past three years. My thanks go to Dr. Kevin Smith for encouraging my application
for the Caledonian Scholarship and for the subsequent supervision and wisdom
extended to me. His permission to attend and present at numerous International
conferences has been hugely rewarding, providing the opportunity to meet many great
people in some fantastic countries.
Thanks also to Mrs. Yvonne Cruickshank for all her help and advice in getting the
project off the ground. Similarly, I wish to thank Dr. Malcolm Bruce at the Community
Drug Problem Service in Edinburgh for collaborating with us on the project. I cannot
thank him and the patients enough. Alongside this I would like to note my appreciation
to the Carnegie Trust for not only awarding me the Caledonian Research Scholarship
but for providing the funds to attend so many conferences. Additionally, I am grateful
to the Society for Glycobiology for their generous travel grants to allow attendance at
two of their annual conferences.
I would like to thank all the research students at Edinburgh Napier. A special thanks to
Dr. Gemma Gallacher for all her help, advice and - most importantly - her friendship
throughout the last two years of her PhD and thereafter. Thanks also to Amy, Emily,
Fiona, Julie and Matt who have made the last three years so much fun.
I am also incredibly grateful to all the staff at the University, especially Sandra Dunbar,
Laura Hutchison, Kim Kellet, Dr. David Mincher, Dr. Agnes Turnball and Dr. Lesley
Young for all their advice and help with equipment.
Last but by no means least; a huge thanks to my family for all their support and
encouragement, especially to my Mum - her patience during this time, particularly
during the write-up, has been amazing.

III
Finally, as a special note of thanks, I would like to dedicate this thesis to my Gran. Our
‘research’ chats and her travel advice always put a smile back on my face and I hope
hers too. Sadly she will not get to see the finished article but I can only hope she would
be proud. I will always be thankful for her never-ending encouragement, support and
great sense of humour.

IV
Abstract
Dependence on heroin and other opioids represents a considerable problem worldwide.
There is a continual need to improve therapy and/ or find more efficacious alternatives
if these issues are to be addressed. The most commonly implemented pharmacological
therapy in treating said dependencies is methadone; however its success is the subject of
ongoing debate. Certain plasma proteins including alpha1-acid glycoprotein (AGP) bind
to drugs which causes inactivation and, if low enough, may prevent a therapeutic effect
being attained. The hepatic synthesis of AGP increases two- to five-fold during
numerous physiological and pathophysiological conditions, becoming the most
prevalent acute phase protein in the blood. Additionally, the structure of the sugar
chains (glycans) attached to the surface of underlying polypeptide backbones can differ,
potentially altering the functions performed.
AGP was isolated from blood samples obtained from patients undergoing various stages
and types of opioid-replacement therapy and from heparinised blood samples provided
by the Blood Transfusion Service. Structural analysis of the glycans was undertaken
primarily through the use of high pH anion-exchange chromatography (HPAEC) and
intrinsic fluorescence used as a measure of drug binding. The composition of glycans
attached to the polypeptide backbone of AGP isolated from patient samples was found
to markedly differ from that of a ‘normal’ healthy population. Levels of galactose and
N-acetyl-glucosamine were amplified in all methadone treatment groups which
suggested increased branching of glycans; this was supported by HPAEC analysis of
complete glycan chains. Binding of methadone to all isolated AGP samples was
elevated at the highest drug concentrations tested; however the degree of quenching
appeared to be greater in patients.
Therefore, the glycoforms expressed by AGP appear to be associated with the
subsequent binding of the glycoprotein to methadone. It is possible that altered
glycosylation could increase affinity for the drug, reducing its bioactive concentration to
below that required to produce the pharmacological effect. Currently, the doses of
methadone used in opioid replacement therapy are primarily influenced by the
expression of physical symptoms, however this preliminary study has indicated that
determination of the level and glycoform expression of AGP may offer potential use
when determining the most effective therapy and dosage regimen.

V
List of figures
Page
Chapter 1
Figure 1.1 Summary of common glycan monosaccharides. 6
Figure 1.2 The glycosidic linkage. 7
Figure 1.3 The glycosylation pathway of N-linked glycoproteins. 12
Figure 1.4 Linkage formation between Asn and the first GlcNAc of the 13
glycan pentasaccharide core.
Figure 1.5 The structure of the three types of N-linked glycan. 16
Figure 1.6 Examples of the branching in complex and hybrid glycans. 17
Figure 1.7 Summary of the APR. 19
Figure 1.8 The amino acid sequence of AGP. 26
Figure 1.9 A diagrammatic representation of possible N-linked glycosylation 29
of AGP.
Figure 1.10 Representation of the therapeutic range of drugs. 36
Figure 1.11 Diagrammatic representation of synaptic activity in the absence (a) 43
and the presence (b) of heroin.
Figure 1.12 The chemical structure of a) heroin (diacetylmorphine), 45
b) morphine and c) methadone.
Figure 1.13 Research Summary. 59
Chapter 2
Figure 2.1 Pulsed potentials of the PAD system during HPAEC. 77
Chapter 3
Figure 3.1 Stability of monosaccharides. 90
Figure 3.2 Release of monosaccharides from commercial AGP. 94
Figure 3.3 Fluorescence spectra of commercial AGP over 300-400nm when 97
excited at 280nm in a) the absence and b) the presence of STI571
and c) the presence hydroxyurea.
Figure 3.4 Intrinsic fluorescence at 340 nm of 5mg/mL and 0.5mg/mL 99
commercial AGP in the presence of theophylline.
Figure 3.5. Intrinsic fluorescence at 340nm of 5mg/mL and 0.5mg/mL 99
commercial AGP with methadone.
Figure 3.6. Intrinsic fluorescence of 5mg/mL and 0.5mg/mL commercial AGP 100
with methadone dissolved in DMSO.

VI
Page
Chapter 5
Figure 5.1 Traces generated during the isolation of AGP by low pressure 119
chromatography.
Figure 5.2 The effectiveness of low pressure chromatography in isolating 122
and purifying AGP.
Figure 5.3 Standard curve produced using commercial AGP. 124
Figure 5.4 Summary of the mean level of AGP isolated. 127
Chapter 6
Figure 6.1 Oxyanion formation at C1 (mannose). 138
Figure 6.2 Traces generated during HPAEC separation. 140
Figure 6.3 Traces generated during HPAEC separation of a) neutral and 141
b) basic monosaccharides from commercial AGP alongside an I.S.
Figure 6.4 Trace generated during HPAEC separation of a) neutral and b) 142
basic monosaccharides from patient sample AGP alongside an I.S.
Figure 6.5 The five monosaccharide standard curves. 144
Figure 6.6 Bar chart summarising the mean level of 150
monosaccharide/mol AGP.
Figure 6.7 Box plot of monosaccharide distribution. 151
Chapter 7
Figure 7.1 Oligosaccharide library trace generated during separation by 163
HPAEC.
Figure 7.2 HPAEC chromatograms of oligosaccharide library versus a) 164
commercially sourced AGP and b) AGP form ‘normal’ heparinised
blood samples.
Figure 7.3 Chromatograms of oligosaccharide library versus titration patients. 166
Figure 7.4 Chromatograms of oligosaccharide library versus harm reduction 170
methadone patients.
Figure 7.5 Chromatograms of oligosaccharide library versus long term 173
methadone patients.
Figure 7.6 Chromatograms of oligosaccharide library versus patients on 179
alternative therapies.
Figure 7.7 Signal intensity at 405nm over a range of AGP concentrations. 184
Figure 7.8 α2,3 – linked sialic acid activity. 184

VII
Page
Chapter 8
Figure 8.1 Intrinsic fluorescence at 340nm of 0.5mg/mL and 5mg/mL 195
commercial AGP.
Figure 8.2. Intrinsic fluorescence at 340nm of AGP. 196
Figure 8.3. Intrinsic fluorescence at 340nm of AGP isolated from ‘normal’ 199
Heparinised blood and opioid-replacement patients in the presence
of methadone.
Figure 8.4. Intrinsic fluorescence at 340 nm of commercial AGP in the 201
presence of codeine.

VIII
List of Tables
Page
Chapter 1
Table 1.1 Classification of acute phase proteins. 22
Chapter 2
Table 2.1 Patient Demographics. 62
Table 2.2: Isolation buffers for low pressure chromatography. 68
Table 2.3 Composition of the 10% (w/v) resolving gel for SDS-PAGE. 72
Table 2.4 Composition of the stacking gel. 72
Table 2.5 Composition of Tris-glycine electrophoresis buffer. 72
Table 2.6 Composition of the coomassie blue protein stain. 72
Table 2.7 Composition of de-staining solution. 72
Table 2.8 Composition of 1x continuous transfer buffer (pH 8.3). 74
Table 2.9 Composition of 1x Tris buffered saline. 74
Table 2.10 Composition of substrate buffer. 74
Table 2.11 Composition of reaction mixture for enzyme digestion. 79
Chapter 3
Table 3.1 A comparison of the mean mass of monosaccharides. 93
Table 3.2 Summary of the difference in mass of monosaccharides obtained 93
during hydrolysis.
Table 3.3 Mean mass of monosaccharides obtained upon removal of the 93
dowex cation exchange resin.
Chapter 4
Table 4.1 Patient data. 108
Chapter 5
Table 5.1 Summary of the levels of AGP in blood samples. 125
Chapter 6
Table 6.1 Monosaccharide composition of ‘normal’ AGP samples. 147
Table 6.2a Monosaccharide composition of AGP from ‘normal’ blood 147
and patients undergoing titration (T), harm-reduction (HR) and
long-term (LT) methadone therapies.
Table 6.2b Monosaccharide composition of AGP from ‘normal’ and patients 148
undergoing Buprenorphine (B), DHC (D) and heroin (H) opioid
replacement treatments.
IX
Page
Chapter 8
Table 8.1 Intrinsic fluorescence of AGP in absence and presence of 1.07 µM 200
and 250µM methadone.

X
Abbreviations
AA amino acid
AAT α1-antitrypsin
AGP α1-acid glycoprotein
AIDS acquired immune deficiency syndrome
Ala alanine
ANOVA analysis of variance
APP acute phase proteins
APR acute phase response
Arg arginine
Asn asparagine
Asp aspartate
B buprenorphine
BBB blood brain barrier
BCIP 5-Bromo-4-Chloro-3'-Indolyphosphate p-
Toluidine Salt
BDZ benzodiazepine
CAIE crossed affinity immunoelectrophoresis
cAMP cyclic adenosine monophosphate
CMP caseinomakropeptide
CDG congenital disorder of glycosylation
CDPS Community Drug Problem Service
CE capillary electrophoresis
CF cystic fibrosis
CHO aldehyde
CM carboxymethyl
CNS central nervous system
Con A Concanavalin A
CRP C-reactive protein
CTB continuous transfer buffer
CYP cytochrome P
Cys cysteine
D (small) dextrorotatory
D Dihydrocodeine
DA dopamine

XI
DEAE diethylaminoethyl
DHC dihydrocodeine
DMSO dimethyl sulphoxide
d-PBS Dulbecco’s phosphate buffered saline
Dol-P dolichol pyrophosphate
DORIS Drug Outcome Research in Scotland
DSM-IV Diagnostic and Statistical Manual of Mental
Disorders
EDDP 2-ethylidene-1,5-dimethyl-3,3-diphenylpyrrolidine
ELISA enzyme-linked immunosorbent assay
ENL Erythema nodosum leprosum
EPO erythropoietin
ER endoplasmic reticulum
ESL E-selectin ligand
ETC endothelial cell
F Bioavailability
FA frontal analysis
Fe iron
FRET fluorescence resonance energy transfer
Fuc fucose
GABA γ-aminobutyric acid
Gal galactose
GalN galactosamine
GalNAc N-acetylgalactosamine
GCSF granulocyte colony stimulating factor
GDP guanine diphosphate
Glc glucose
GlcN glucosamine
GlcNAc N-acetylglucosamine
Gln glutamine
Glu glutamate
Gly glycine
GP General Practioner
H heroin
HCl hydrochloric acid

XII
His histidine
HIV human immunodeficiency virus
H2O water
HPAEC high pH anion-exchange chromatography
HPLC high performance liquid chromatography
HR harm reduction
HSA human serum albumin
IEF isoelectric focusing
IFN-γ interferon-gamma
Ig immunoglobin
IL-1 interleukin-1
IL-1Ra IL-1 receptor antagonist
IL-6 interleukin-6
IL-8 interleukin-8
Ile isoleucine
IS internal standard
i.v intravenous
KCl potassium chloride
Ki affinity constant
KSCN potassium thiocyanate
L (small) Levorotatory
LAAM Levo-alpha acetyl methadol
LC locus ceruleus
Leu leucine
LeX Lewis-X
LT long-term
Lys lysine
MAL Macckia amurensis Leukoagglutinin
MALDI matrix-assisted laser desorption/ionisation
Man mannose
MDR multi-drug resistance
MEC minimal effective concentration
Met methionine
MgCL2 magnessium chloride
MMT methadone maintenance therapy

XIII
MOR mu opioid receptor
MS mass spectrometry
MS multiple sclerosis
NA nucleus accumbens
NaCl sodium chloride
NAdr nor-adrenaline
NaOAc sodium acetate
NaOH sodium hydroxide
NBT Nitro-Blue Tetrazolium Chloride
NeuAc N-acetylneuraminic acid
NH2 amino group
NHS National Health Service
NMDA N-methyl-D-aspartic acid
NMR nuclear magnetic resonance
NTORS National Treatment Outcome Research Study
OH hydroxyl
OIH opioid induced hyperalgesia
OR opioid receptor
ORM orosomucoid (AGP)
OST oligosaccharyltransferase
P phosphate
PAD pulsed amperometric detection
PACE pressure-assisted capillary electrophoresis
PAGE polyacrylamide gel electrophoresis
PBMC peripheral blood mononuclear cells
PD pharmacodynamics
PEG polyethylene glycol
Phe phenylalanine
pI isoelectric point
PK pharmacokinetics
pKa acid dissociation constant
PKC protein kinase C
PMN polymorphonuclear leukocytes
PNGase F Peptide-N-Glycosidase F
Pro proline
XIV
R Rectus
RBC red blood cell
R2 Pearson correlation coefficient
RA rheumatoid arthritis
RER rough endoplasmic reticulum
S Sinister
SA sialic acid
SACDM Scottish Advisory Committee on Drugs Misuse
S.D standard deviation
SDS sodium-dodecyl sulphate
SDS-PAGE sodium dodecyl sulphate – polyacrylamide gel
electrophoresis
Ser serine
SF synovial fluid
SH steroid hormone
SLex Sialyl Lewis X
SML serum methadone level
SNA Sambucus nigra aglutinin
SNRI serotonin norepinephrine reuptake inhibitors
SSRI selective serotonin reuptake inhibitors
T titration
t1/2β elimination half-life
TBS tris buffered saline
TCA tricyclic antidepressant
TEMED tetramethylethylenediamine
TFA trifluoracetic acid
Thr Threonine
TNF-α tumour necrosis factor α
tPA tissue plasminogen activator
Trp Tryptophan
Tyr Tyrosine
UDP uridine diphosphate
v volume
Val valine
Vd volume of distribution

XV
w weight
WHO World Health Organisation
Zn zinc

XVI
Publications
Refereed Journals
Invited Review
Behan, J. and Smith, K.D. (in press) The analysis of glycosylation: A continued need
for high pH anion exchange chromatography. Biomedical Chromatography.
(published online July 2010)
Conference Abstracts (published)
Behan, J., Bruce, M., Cruickshank, Y., Smith, K. (2008) The altered Glycosylation
Pattern of Alpha-1-acid Glycoprotein may Affect Drug Binding ability to methadone.
Glycobiology 18 (11): 966.
Conference Posters
Behan, J., Bruce, M., Cruickshank, Y., Smith, K. (2008) The altered Glycosylation
Pattern of Alpha-1-acid Glycoprotein may Affect Drug Binding ability to methadone.
Glycobiology 18 (11) 966 (abstract number 62), Fort Worth, TX, November 2008.
Behan, J., Bruce, M., Cruickshank, Y., Smith, K. (2009) The presence of an acute
phase protein (α-1-acid glycoprotein) in the blood may contribute to the failure of
methadone therapy in vivo altered. Royal Society of Medicine 9th
Jenner Glycobiology
and Medicine Symposium (abstract number 1), Brussels, September 2009.
Behan, J., Bruce, M., Cruickshank, Y., Smith, K. (2010) The existence of a plasma
Acute Phase Protein (Alpha-1-Acid Glycoprotein) may contribute to the limited success
of methadone therapy in vivo. EUROPAD 2010 (abstract number 4), Zagreb, May 2010.

XVII
Contents Page
Declaration I
Acknowledgements II
Abstract IV
List of Figures V
List of Tables VIII
Abbreviations X
Publications XVI
Chapter 1 Introduction 1
1.1. Glycosylation 2
1.1.1 The emergence of Glycobiology 2
1.1.2 The importance of Glycosylation 2
1.1.3 The components of Glycans 4
1.1.4 Glycoproteins 8
1.1.4.1 N-linked Glycan Biosynthesis 10
1.1.4.2 High Mannose, Complex and Hybrid N-linked 14
Glycoproteins
1.2 APR: Acute phase response 18
1.3 α1 -Acid-Glycoprotein (AGP) 23
1.3.1 Structure of AGP 24
1.3.2 Analysis of glycan microheterogeneity 30
1.3.3 AGP Structure and Disease 31
1.3.4 Functions of AGP 32
1.3.4.1 Immunomodulation 33
1.3.4.2 Drug Binding 34
1.4 Opiates 40
1.4.1 Opiate addiction: a global problem 40
1.4.2 The mechanism of opioid action 41
1.5 Heroin 44
1.5.1 Heroin addiction 44
1.5.2 Dependence and Tolerance 46

XVIII
Page
1.6 Methadone 47
1.6.1 Methadone: a brief history 47
1.6.2 Methadone therapy: its usefulness and 48
dosing schedule
1.6.3 Methadone has two forms administered during therapy 52
1.6.4 Minimal effective concentration and the role of AGP 52
1.6.5 Methadone therapy is not without its problems 54
1.7 Research Strategy 56
1.7.1 Aims and Objectives 57
1.7.1.1 Aims 57
1.7.1.2 Objectives 57
Chapter 2 Materials and Methods 60
2.1 Materials 61
2.1.1 Patient clinical samples 61
2.1.2 AGP isolation 63
2.1.3 Desalting 63
2.1.4 Determination of AGP level in blood 63
2.1.5 SDS-gel and Western Blot 64
2.1.6 High pH anion Exchange Chromatography 64
2.1.6.1 Monosaccharide analysis 64
2.1.6.2 Oligosaccharide analysis 65
2.1.7 Determination of SA content (ELISA) 65
2.1.8 Drug Binding 65
2.2 Methods 66
2.2.1 Clinical Samples 66
2.2.2 Isolation and determination of the level of AGP 66
2.2.2.1 Polyethylene Glycol Precipitation 66
2.2.2.2 Low Pressure Chromatography 66
2.2.3 Desalting 69
2.2.4 AGP level determination 69
2.2.5 SDS-gel and Western Blot 70
2.2.5.1 Discontinuous SDS-PAGE 70

XIX
Page
2.2.5.2 Resolving gel preparation 70
2.2.5.3 Stacking gel preparation 71
2.2.5.4 Protein gel staining 71
2.2.6 Western blotting 73
2.2.6.1 Blot sandwich assembly 73
2.2.6.2 Blocking of the membrane (reduction of non- 73
specific binding)
2.2.6.3 Immunoprobing with primary antibody 73
2.2.6.4 Immunoprobing with secondary antibody 73
2.2.6.5 Immunodetection of proteins 75
2.2.7 High pH Anion Exchange Chromatography 75
2.2.7.1 Acid Hydrolysis 75
2.2.7.2 Monosaccharide Analysis 76
2.2.7.3 Oligosaccharide analysis 78
2.2.7.3a Enzyme Digestion 78
2.2.7.3b Oligosaccharide HPAEC Analysis 80
2.2.8 Sialic acid determination ELISA 80
2.2.9 Drug Binding analysis 82
2.2.9.1 Commercial AGP and Methadone standards 82
2.2.9.2 Determination of methadone binding to sample 82
AGP
2.2.10 Statistical Analysis 83
Chapter 3 Validation of Methods 84
3.1 Introduction 85
3.2 Methodology 86
3.2.1 Optimisation of monosaccharide release 86
3.2.1.1 Monosaccharide stability 86
3.2.1.2 Development of optimal hydrolysis conditions 86
3.2.1.3 Dowex®
Cation-Exchange Column study 86
3.2.2 Microtitre plate drug binding assay 87
3.2.2.1 Testing method with Theophylline 88
3.2.2.2 Microtitre plate and Methadone 88
3.2.2.3 Methadone dissolved in d-PBS versus DMSO 88

XX
Page
3.3 Results 89
3.3.1 Optimisation of monosaccharide release methodology 89
3.3.1.1 Monosaccharide stability 89
3.3.1.2 Acid Hydrolysis optimisation 89
3.3.2 Microtitre plate drug binding assay 96
3.4 Discussion 101
3.4.1 Monosaccharide release optimisation 101
3.4.2 Drug binding analysis 103
Chapter 4 Patient Demographics 106
4.1 Patient Demographics 107
4.2 Discussion 110
Chapter 5 AGP isolation and level determination 114
5.1 Introduction 115
5.1.1 Isolation of AGP 115
5.1.2 Level determination 117
5.2 Results 118
5.2.1 Isolation and purification of AGP from samples 118
5.2.2 Evaluation of isolated AGP purity 120
5.2.3 AGP level determination 123
5.3 Discussion 128
Chapter 6 AGP Monosaccharide Analysis 135
6.1 Introduction 136
6.2 Results 139
6.3 Discussion 153
Chapter 7 AGP Oligosaccharide Analysis 158
7.1 Introduction 159
7.2 Results 161
7.2.1 HPAEC oligosaccharide analysis 161
7.2.2 Sialic Acid ELISA 182

XXI
Page
7.3 Discussion 185
Chapter 8 Drug Binding 190
8.1 Introduction 191
8.2 Results 193
8.3 Discussion 202
Chapter 9 Conclusions 207
9.1 Conclusions 208
9.2 Future Work 213
Chapter 10 Bibliography 215
Appendix 240

1
Chapter 1
Introduction

2
1.1 Glycosylation
1.1.1 The emergence of Glycobiology
Fundamentally, Glycobiology comprises the study of biological macromolecules,
namely proteins and lipids, whose surfaces are covalently modified by the enzymatic
addition of oligosaccharide chains (sugars with the empirical formula (CH2O)n).
Commonly known as glycosylation, it occurs co- and/or post-translation in the
endoplasmic reticulum (ER) and Golgi apparatus to produce specific glycoconjugate
structures belonging to the glycoprotein and glycolipid families respectively. It is a
complex, ordered and energy consuming process that has become widely recognised as
both functionally significant and responsible for providing huge structural diversity
(Varki et al., 2009; Taylor and Drickamer, 2003). The presence of oligosaccharide
chains (known as glycans) had historically been given little credence in the study of
these biomolecules, considered only as stores of residual energy or an embellishment of
the macromolecule to which they were attached. Removal of the glycans was thus
commonplace during the study of glycoproteins, instead interest focussed on the
analysis of the protein backbone alone.
Technological developments have caused views regarding the importance of
glycosylation to change and allowed the field of Glycobiology to grow – so named by
Rademacher et al. in 1988. It has now become widely accepted that glycans have
crucial roles in determining the properties expressed by a glycoconjugate. Through
such research, numerous physiological and pathophysiological conditions in which
glycan structure has huge functional significance have been identified (Varki, 1993).
1.1.2 The importance of Glycosylation
Glycosylation takes the form of variable sugar chain structures, the quantity of which is
dependent on the availability of attachment sites. Through interactions forged with the
surfaces of proteins or lipids, glycans affect their stability, conformation and
consequently the overall function. These factors may explain why up to 70% of
proteins are reportedly modified in this way (Wormald and Dwek, 1999).

3
The glycans expressed by a glycoprotein are determined by the specific enzyme clusters
- particularly the glycosyltransferases – residing in a cell’s ER and Golgi, thus
glycosylation is not directly regulated at the genetic level. Glycosyltransferases catalyse
the fusion of monomeric building blocks of the carbohydrate complexes
(monosaccharides), arranging them in specific sequences which then associate with the
remaining polypeptide fragment (Kobata, 1992; Sasisekharan and Myette, 2003).
If transcription of genes encoding the specific glycosyltransferases involved in glycan
synthesis is altered during certain physiological and pathophysiological conditions,
variations in the structure and function of the glycoconjugate is likely to occur. When
specific to the causative condition, these structural alterations can offer use as
biomarkers, implemented in their diagnosis and management. Studies have shown that
aberrant glycosylation is expressed in various diseases but whether it is due to, or a
cause of, the disease is unknown. A recent example suggested that the expression of
specific glycoforms (glycoproteins with an identical amino acid sequence but variations
in the surface glycosylation) of α1-acid glycoprotein (AGP) is correlated with the
inflammatory phases of leprosy (Gupta et al., 2010). The glycoforms expressed by
patients with ENL differed to those enduring other stages of the disease and a healthy
population.
There are a specific group of inherited disorders, known as the congenital disorders of
glycosylation (CDGs), which arise when the biosynthetic and processing pathways
involved in glycosylation are not performed correctly (Durand and Seta, 2000; Jaeken
and Matthijs 2007). In the absence of correct glycan expression various irregularities
arise, particularly in neuronal development – reaffirming the importance of the
structural modification. Efficiency of infectious agents and cancer progression were
shown by various groups to be dependent on the presence of glycosylated structures
(Bertozzi and Kiessling, 2001; Dell and Morris, 2001). Many pathogens, including
E.coli and N. Meningitides, display ‘normal’ sugar chains on their surface allowing
them to evade the immune response of infected hosts. For example, the occurrence of
polysialic acids resembling those in normal developing neuronal tissues prevent the
destruction of these pathogens, allowing subsequent infection of eukaryotic cells (Sears
and Wong, 1998).
4
The occurrence of a glycocalyx (a 60-100 angstrom extracellular structure) surrounding
all cells signifies that glycans are likely to function as ligands for receptors; determining
the intramolecular functions of a glycoconjugate - also promoting interactions with
signalling molecules and cell-to-cell and cell-to-extracellular matrix communication.
Intermolecular properties such as circulating half-life and immunogenicity are further
examples of the influence of glycan expression (Varki, 1993).
1.1.3 The components of Glycans
Monosaccharides represent the monomeric units of glycans, comprising two groups -
the aldoses and ketoses corresponding to the expression of an aldehyde or keto
functional group which are composed of a carbon covalently linked to an oxygen atom
by a double bond; situated at the end (-CH=O) or within (>C=O) a chain, respectively.
Upon polymerisation of eight or fewer monosaccharides, oligosaccharides are formed
but if more than eight are involved in the structure they are termed polysaccharides
(Bertozzi and Rabuka, 2009). Sub-classifications of monosaccharides focus upon the
number of carbon atoms in the structure; the most common being six (hexose) as found
in glucose (Glc), galactose (Gal) and mannose (Man). Fucose (Fuc) is termed a
deoxyhexose due to the absence of the hydroxyl group (-OH) on C6. N-acetyl
neuraminic acid (NeuAc), a nine carbon sugar present at the termini of glycan chains,
belongs to the sialic acid family (Varki, 1992). Additionally, the hexosamines form a
group of monosaccharides expressing an amino group on the second carbon and often
exist in an N-acetylated form in glycan chains, for example N-acetylglucosamine
(GlcNAc) and N-acetylgalactosamine (GalNAc).
Simple monosaccharide structural representations use the Fischer projection
implementing linear structures. However, these do not depict their existence in nature;
instead they close into a cyclic hemiacetal ring to acquire increased stability. The -OH
of C5 and the aldehyde group (-CHO) of C1 react as demonstrated in figure 1.1a using
Man. A summary of the monosaccharides commonly found in glycans is shown in
figure 1.1b; including Gal, Man, Fuc, GlcNAc and GalNAc which all adopt the chair
conformation as illustrated for Man in figure 1.1a. In this more stable conformation, C1
becomes the anomeric carbon as it is a chiral centre – the –OH group joined to the
anomeric C may sit below the plane of the ring (termed alpha, α) or above (beta, β).

5
The orientation of the -CHOH group located furthest from the functional -CHO can also
exist in one of two configurations allowing them to be classed as either D-, which exists
most commonly in nature, or the L- form. The monosaccharides composing glycan
chains are attached through the formation of glycosidic bonds between the -OH
reducing group of C1 and any other -OH of an adjacent residue (either an α or β
anomeric configuration, depending on the conformation of the -OH group on C1 of the
donating monosaccharide). Bond formation requires a condensation reaction; ergo a
molecule of H2O is expelled as depicted in figure 1.2, and the resultant oligosaccharide
chains may be homogenous or heterogeneous in structure, as determined by the
constituent monosaccharides.
The glycan structures may differ only slightly in sequence, length of chains, type of
bond or number of chains that are attached, providing a wide diversity of structures
(heterogeneity) from relatively few monosaccharide units. Consideration of the ability
of three amino acids to produce only six tripeptides while three hexoses are capable of
generating thousands of trisaccharides (27,648), illustrates how the synthesis of long
glycan chains significantly increases glycoconjugate structural diversity (Maeder,
2002). There is enhanced potential for the generation of variable structures as each
sugar can display different anomeric configurations – α and β. Additionally linkage
position may differ thus leading to more complex structures.
These glycan chains have functions both individually important but are also involved in
determining the physical properties and physiological functions of the various structures
of which they become a physical component. Of particular interest to this study is the
ability of oligosaccharides to covalently attach to proteins, producing glycoproteins,
discussed in more detail in section 1.2.

6
Fischer projection of cyclic hemiacetal Stable chair conformation
aldehydo form (of mannose)
D-Mannose
b)
Figure 1.1. Summary of common glycan monosaccharides. a) A demonstration,
using Mannose, of the reaction which occurs between the -OH of carbon 5 and -CHO of
carbon 1 (blue) to produce the stable ring conformation. b) Monosaccharides common
to glycoprotein oligosaccharide chains represented in their stable cyclic hemiacetal
configuration. The lack of an -OH group on C6 of fucose is highlighted – fucose is a
deoxyhexose. α and β configurations are represented by and respectively.
O
CH2OH
H
H OH
OH
OH
OH
H
H
H
O
CH2OH
OH
OH
OH
OH
H
H
H
H H
OH
OH
α-D-Galactose α-D-Glucose
α-D-N-acetylglucosamine α-L-Fucose
O
OH
OH OH OH
H H
H H
O
OH
OH
HO
HO
CH2OH
=
CH3
H
H
H
H
H OH
OH
OH O
CH2OH
H
O
NH
CO
CH3
H
H
OH
OH
H
H
CHO
HO
HO
OH
OH
H
H
H
H
CH2OH
C
C
C
C
CH2OH anomeric
centre

7
Figure 1.2. The glycosidic linkage. [Adapted from Ferrier and Collins, 1972].
Two monomeric units have been used to demonstrate the formation of a β1,4 glycosidic
linkage which leads to the formation of the disaccharide lactose (β-D-galactopyranosyl-
(1 4)-β-D-glucopyranose).
O
CH2OH
OH
OH
OH
H
H
H
H
H
O
CH2OH
H
H
H
OH
OH
OH
H
H
1
4
O O

8
1.1.4 Glycoproteins
Glycoproteins are unique biomolecules composed of one or more glycans covalently
bound to a protein ‘backbone’ and often terminated by sialic acid (SA) residues. The
complicated synthesis and modification of glycans takes place co- and/ or post-
translation and is fundamental to the determination of the function and stabilisation of
the underlying polypeptide. Although it was thought to be specific to eukaryotes,
glycosylation of proteins has been reported in eubacteria (Dobos et al., 1996) and
archaea (Lechner and Wieland, 1989). In fact those discovered in bacteria display much
greater variation than those in eukaryotes, some directly affecting the function of the
underlying protein and others crucial to interactions with the host immune system (Benz
and Schmid, 2002).
The reducing end of the oligosaccharide chain component becomes attached to the
polypeptide either through N-linkages (via the amide nitrogen of specific asparagine
residues) or O-linkages (via the -OH of serine/threonine). N-glycans are prevalent in
plasma proteins and do not contain glucose (Glc), while the latter predominate in
glycoproteins of epithelial origin and may incorporate Glc as a chain constituent (Dell
and Morris, 2001).
Glycoprotein expression is dependent on the cell type to which the structures are
integrated. Certain genes encode information that, once transcribed and translated,
produce the protein backbone, which is subsequently responsible for directing the sites
of glycosylation (Freeze, 2001). Glycoform expression promotes a high degree of
heterogeneity, essentially a result of different cell types possessing a diverse array of
enzymes thus catalysing a range of reactions and producing distinct glycans. Variable
structures therefore not only reflect the source cell or tissue but also the physiological
and biochemical conditions present during synthesis (van Dijk et al., 1994).
Heterogeneity can alter physical properties like stability and solubility thus affecting the
conformation and ability to perform the typical function of the biomolecule including
protein-protein or protein-saccharide recognition, intracellular trafficking of enzymes,
cell-cell recognition, and inhibition of leukocyte rolling during the inflammatory
response (Durand and Seta, 2000; Sears and Wong, 1998).

9
Glycans are widely distributed on the cell surface potentially linked through various
combinations of N- and O-linkages, for example erythropoietin (EPO) and coagulation
factor VIII. Some glycoproteins however display only one type of linkage; α1-acid
glycoprotein (AGP), α1-antitrypsin, interferon β, interferon γ, and tissue plasminogen
activator (TPA) are solely N-linked, whilst Interleukin 2 and GCSF express O-linked
only (Lis and Sharon, 1993; Durand and Seta, 2000). The presence of a consensus
sequence, Asn-X-Ser/Thr, in N-linked glycoproteins often allows predictions to be
made as to which Asn residues of the protein will become glycosylated - only those
situated in the sequence have this potential (Gavel and von Heijne, 1990). Kornfeld and
Kornfeld (1985) reported that approximately one third of Asn residues become N-
glycosylated, limited by specific requirements including a ‘sufficient pool of completely
assembled and glycosylated lipid-linked oligosaccharide donor, an adequate activity of
oligosaccharyltransferase, and a properly oriented and accessible Asn-X-Ser/Thr
sequence in the acceptor’. O-linked glycan synthesis is far simpler - numerous core
structures can be generated, increasing glycan diversity thus making them more difficult
to characterise than N-linked which share a core structure, GlcNAc2Man3.
Most serum proteins express glycans on their surface, particularly secretory proteins
and those incorporated into the plasma membrane. Glycosylation ensures maturation of
the underlying protein is correct; if absent, the function of the biomolecule may be
changed or possibly lost. Some proteins like albumin do not require glycosylation to
bestow functionality (Sabatini et al., 1982). An example where incomplete
glycosylation prevents the glycoprotein achieving optimal bioactivity is when
erythropoietin (EPO), released from the kidney to regulate red blood cell (RBC)
production, has reduced sialic acid (SA) content - under these circumstances it is rapidly
cleared by the liver. Ordinarily sialylation prevents elimination, promoting its
effectiveness in treating anaemia. For optimal solubility, biosynthesis and circulating
half-life, EPO must express one O-linked glycosylation site at position 126 and three N-
linked at 24, 38 and 83 (Macdougall and Eckardt, 2006; Paulson and Colley, 1989).
Van Dijk and colleagues (1994) reported reduced sialylation of certain glycoproteins
can also arise in rheumatoid arthritis (RA).
Despite their association with disease, the potential for glycoproteins in therapeutics has
intensified with research. It has lead to the production of recombinant forms of EPO
used to treat anaemia and tPA (tissue plasminogen activator - a serine protease

10
inhibitor), which induces fibrinolysis through the conversion of plasminogen to plasmin
(Williams et al., 1986; Adamson and Eschbach, 1989). More recently, the potential of
recombinant glycoproteins in the treatment of Herpes Simplex Virus 2 and
inflammatory bowel disease (IBD) has been indicated (Hoshino et al., 2005 and Li et
al., 2009 respectively).
Understanding the pathways involved in the synthesis and modification of N-linked
glycans, as discussed below, is of paramount importance when studying the
physiological and pathological states during which these are known to be altered.
Analysing the levels of glycoproteins has shown use clinically, often correlating with
numerous physiological and pathophysiological conditions alongside fluctuations in the
level of inflammatory cells (Fournier et al., 2000). However, studying the glycan
structures could offer more accurate and condition-specific markers, important when
early treatment and monitoring is crucial in tackling diseases.
1.1.4.1 N-linked Glycan biosynthesis
N-glycosylation relies on a complex enzyme catalysed synthetic- (within the cytosol
and ER), and processing- (in the ER and Golgi) pathway. Initially component
monosaccharides are converted into activated high-energy sugar nucleotides e.g. UDP-
GlcNAc and GDP-Man, and are subsequently transferred to a membrane-bound lipid
dolichylphosphate (Dol-P), on the cytosolic side of the ER to form Man5GlcNAc2-Dol-
P. GlcNAc-1-phosphotransferase, GlcNAc-transferase and mannosyltransferases are
required to catalyse the transfer from their donor sugar nucleotide, to the Dol-P. The
structure then translocates through the activity of a flippase to the lumenal side of ER.
A further seven monosaccharides are donated, binding together via glycosidic bonds to
produce the fourteen residue Glc3Man9(GlcNAc)2 oligosaccharide precursor.
Dennis et al. (1999) effectively summarised N-glycan biosynthesis in four distinct
phases occurring after the formation of this precursor and associated with different
compartments of the secretory pathway. First, transfer of the oligosaccharide precursor
from a dol-P donor to nascent glycoproteins occurs in the RER lumen; requiring a
multimeric oligosaccharyltransferase complex (OST; Imperiali and O’Connor, 1999).
Glycosidases then trim the structure while being transported in the RER and Golgi.

11
Substitution occurs in the medial-Golgi by GlcNAc-transferases and finally elongation
takes place in the trans-Golgi network. These stages are encapsulated in figure 1.3.
As illustrated in figure 1.4, N-glycosylation of the Asn amide group requires formation
of β-turns or loops in the secondary structure of the polypeptide; hydrogen-bonds form
between the amide (-NH2) group of Asn and the hydroxyl (-OH) group of Ser/Thr
(Smith et al, 1997). The amino acid proline (Pro) lacks an α-amide proton; preventing
the formation of loops/turns thus it is never present in the consensus sequence (Bause,
1983). A bond is formed between the anomeric -OH group of the terminal
monosaccharide (GlcNAc) and the -NH group of Asn. Yet and Wold (1990) reported
that interactions can occur between N-linked oligosaccharides and aromatic, un-charged,
amino acid (AA) side chains within the three AAs on either side of the glycosylated Asn.
The addition of N-glycans bestows protection, stability and solubility to the underlying
protein. The glycan structures which are newly attached to Asn can then be processed
through the competitive action of glycosidases such as glucosidases and mannosidases,
and glycosyltransferases like galactosyltransferases during passage through the ER and
Golgi compartments. It is the competition between enzymes for substrates that
facilitates the expression of increased microheterogeneity; catalysing numerous
different sets of reactions (Guile et al., 1996; Couldrey and Green, 2000).
Several regulatory steps are in place to prevent the synthesis of incorrect glycoproteins;
upon trimming of two Glc by α1,2-glucosidase I and α1,3-glucosidase II in the ER, the
nascent glycoproteins enter the calnexin/calreticulin cycle which ensures only correctly
folded proteins continue in the pathway. If folding is incorrect, a luminal
glycosyltransferase adds a Glc residue onto the unfolded/misfolded molecule forcing it
re-enter the calnexin/calreticulin cycle where it remains until correctly folded and the
remaining Glc is removed by glucosidase II (Sousa et al., 1992; Deprez et al., 2005).

12
Figure 1.3. The glycosylation pathway of N-linked glycoproteins. [Adapted from
Rich and Withers (2008) and Varki et al. (2009)]. A summary of the synthetic and
processing pathways catalysed by enzymes residing in the ER and Golgi; these differ
depending on the type of N-linked glycans expressed.
GlcNAc Man Glc Gal NeuAc Fuc
Dol-P Dol-P
Dol-P Dol-P Dol-P
OST
ER Cytosol
P P P P
ER Lumen
Cis
Golgi
Medial
Golgi
Trans
Golgi
EXIT
lysosomal
Non-
lysosomal Targeted
to
lysosomes
UDP-GlcNAc GDP
- Man
GDP- Man
Transfer to Asn UDP-
Glc Glc Glc Man
Man P Man
UDP-GlcNAc
Man UDP-GlcNAc GDP-Fuc
UDP-Gal
NeuAc
Dol-P Asn Asn Asn Asn
Asn Asn Asn Asn
Asn Asn Asn Asn
Asn Asn Asn

13
Figure 1.4. Linkage formation between Asn and the first GlcNAc of the glycan
pentasaccharide core. [Adapted from Metzler, 2001]. OST catalyses the formation of
a bond between the side-chain –NH2 group of Asn and the C-1 of the first core GlcNAc
residue. The hydrogen bonds formed with the Ser/Thr residue when transfer takes place
from dolichol to protein are important in forming a loop. It helps polarise the –NH2
group of the Asn side chain, making an electrophilic centre as shown in step 1 that can
participate in a displacement reaction.
Protein backbone
Asn: in Asn-X-Thr/Ser
sequence
GlcNAc residue
Dol-P-P Dol-P
Pi
H2O
Further
cycles
dolichol
Hydrogen
bonds to
Ser/Thr
residue
Rest of
glycan O OH
CH2OH
H
H
NH
CO
CH3
O
C O-
N
H
CO NH
OH
CH2OH
O
H
H
NH
CO
CH3
O P P O
O
H
Nucleophilic
attack
Rest of
glycan
Electrophilic
centre
C
C O
N H
H
C
O
N
H

14
1.1.4.2 High Mannose, Complex and Hybrid N-linked glycoproteins.
Despite N-linked glycans sharing a common pentasaccharide core (Man3GlcNAc2), the
overall structures can vary widely - primarily differing by the sequence and quantity of
monosaccharides of which they are composed (Albani and Plancke, 1999). Enzymes
residing in the ER and Golgi trim and process the glycan precursor determining whether
it will be of high Man, complex or hybrid form. These structures are illustrated in
figure 1.5.
Between two and six Man residues may connect to the pentasaccharide core, producing
the common heptasaccharide core of high Man structures:
Man α1 6(Manα1 3)Man α1 6(Man α1 3)Manβ1 4GlcNAcβ1 4GlcNAc
Only Man is present in the chains of these structures, up to four can bind the Man
residues at the non-reducing terminal (Kobata, 1992; Imperiali and O’Connor, 1999). A
common substitution of these glycans is the addition of one or more phosphate groups
to the outer Man residue, producing mannose-6-phosphate in lysosomal hydrolases. It
can then bind to the Man-6-phosphate receptor (Smith et al., 1997).
For the biosynthesis of complex N-linked glycans more processing is required because,
although the only Man residues they contain belong to the trimannosyl core, they
ordinarily express a greater variety of monosaccharides and linkages. The outer
GlcNAc, Gal, Fuc and SA residues typical of such structures become attached to a
GlcNAc residue at the reducing end, which in turn binds to the core α-Man residues. It
is also possible that a Fuc residue may become linked to the innermost GlcNAc residue,
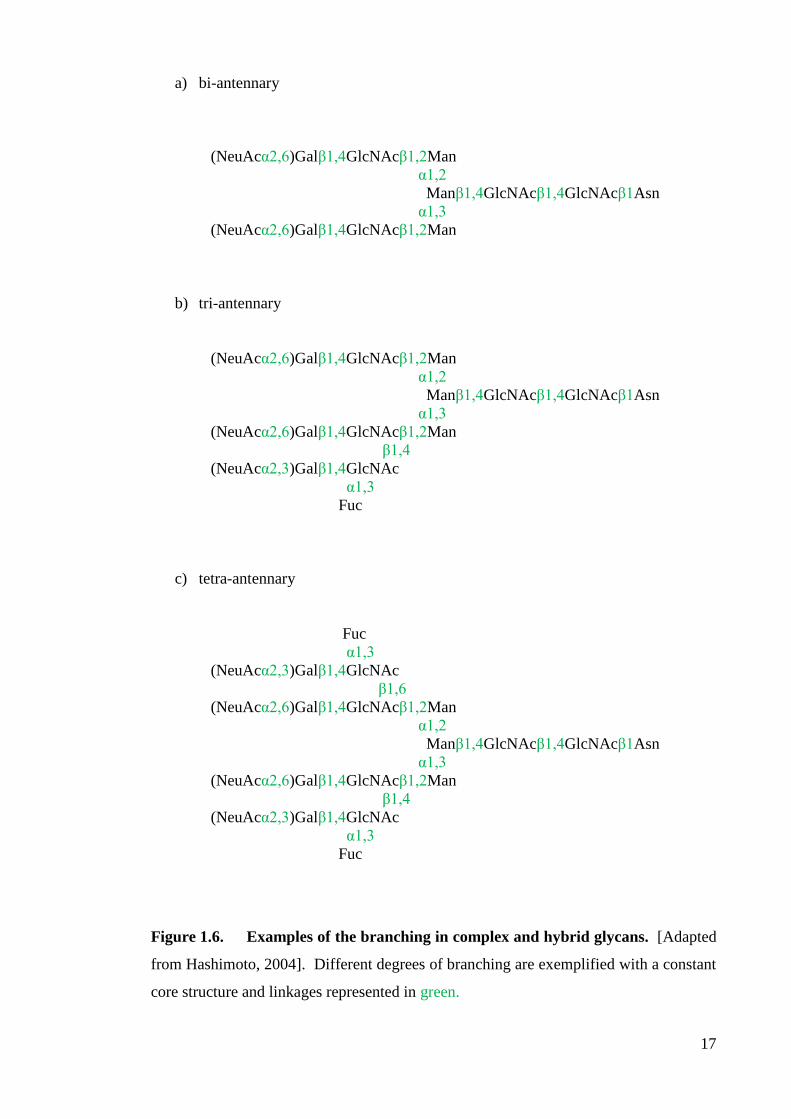
further increasing the potential structural variation (Kobata, 1992). Complex glycan
structures typically express 4-6 GlcNAc residues and 5-7 neutral sugars while high Man
may only have 2 GlcNAc but approximately 5-9 Man (Fan et al., 1994). The complex
group can be subdivided based on the number of branches present i.e. bi-, tri-, tetra-,
and penta-antennary chains (figure 1.6). Neu5Ac - a SA residue - commonly terminates
these glycan branches allowing them to circulate in the blood (Morell et al., 1971); in
their absence, the molecules may be targeted by the liver.
When oligosaccharides exhibit features of both high Man and complex type glycans,
they are categorised as hybrids. Man residues can join to GlcNAc and core outer Man
residues; comparable to those observed in the high Man structures. In similarity to

15
complex glycans, a Fuc residue may bind to the innermost GlcNAc residue (Kobata,
2000; Durand and Seta, 2000). Therefore, although they exhibit characteristics of high
Man glycans with a Man α1,6 branch, they are also similar to complex-type glycans
with a Man α1,3 branch composed of Gal and further GlcNAc residues.
An important example of a naturally occurring N-linked plasma glycoprotein is α1 –
acid glycoprotein (AGP, or orosomucoid), secreted by liver parenchymal cells. It solely
expresses complex N-linked glycans and although its specific biological role/function
has yet to be clearly defined it is known to bind steroids, catecholamines and certain
drugs: transporting them through the plasma. AGP can also be considered a natural
anti-inflammatory and immunomodulatory agent, the concentration and/or ‘normal’
glycosylation of which may change under various physiological and pathophysiological
conditions. During the acute phase response (APR), stimulated during many of these
conditions, the production of AGP is increased, possibly limiting the activity of certain
drugs to which it binds (Kremer et al., 1988; Israili and Dayton, 2001).

16
High Mannose Complex Hybrid
Figure 1.5. The structure of the three types of N-linked glycan. [Adapted from
Varki et al., 2009]. All share the same pentasaccharide core structure with different
appendages.
GlcNAc Man Gal NeuAc
Asn Asn Asn
17
a) bi-antennary
(NeuAcα2,6)Galβ1,4GlcNAcβ1,2Man
α1,2
Manβ1,4GlcNAcβ1,4GlcNAcβ1Asn
α1,3
(NeuAcα2,6)Galβ1,4GlcNAcβ1,2Man
b) tri-antennary
(NeuAcα2,6)Galβ1,4GlcNAcβ1,2Man
α1,2
Manβ1,4GlcNAcβ1,4GlcNAcβ1Asn
α1,3
(NeuAcα2,6)Galβ1,4GlcNAcβ1,2Man
β1,4
(NeuAcα2,3)Galβ1,4GlcNAc
α1,3
Fuc
c) tetra-antennary
Fuc
α1,3
(NeuAcα2,3)Galβ1,4GlcNAc
β1,6
(NeuAcα2,6)Galβ1,4GlcNAcβ1,2Man
α1,2
Manβ1,4GlcNAcβ1,4GlcNAcβ1Asn
α1,3
(NeuAcα2,6)Galβ1,4GlcNAcβ1,2Man
β1,4
(NeuAcα2,3)Galβ1,4GlcNAc
α1,3
Fuc
Figure 1.6. Examples of the branching in complex and hybrid glycans. [Adapted
from Hashimoto, 2004]. Different degrees of branching are exemplified with a constant
core structure and linkages represented in green.

18
1.2 APR: Acute phase response
Initiation of the APR (summarised in figure 1.7) occurs upon systemic tissue injury,
acute and chronic inflammation, and viral or bacterial infection as part of the body’s
defence system, attempting to regain homeostasis (Kushner and Rzewnicki, 1994).
Inflammation at the site of injury results from a local immune response. Cytokine and
glucocorticoid hormone release - primarily by tissue macrophages (and to a lesser
degree T-lymphocytes, platelets, fibroblasts and polymorphonuclear leukocytes) - can
cause a systemic immune response to follow, thereby affecting many organs. They
induce the APR, disturbing the vascular system and altering the breakdown of various
muscle proteins and lipids. Changes occur to the concentrations of specific plasma
proteins including α1-acid glycoprotein and albumin (Brinkmann-van der Linden et al.,
1998; Menkes, 1993), collectively known as acute phase proteins (APPs); the majority
of which are glycoproteins (Ebersole and Cappelli, 2000). The APR is an extremely
important but short-lived process, initiated minutes after the stimulus it lasts up to two
days and is responsible for minimising damage to surrounding tissue and destroying
foreign molecules. Anti-inflammatory cytokines are released with subsidence of the
APR; IL-10 inhibits synthesis of the proinflammatory cytokines interleukin-1α (IL-1α),
tumour necrosis factor α (TNF-α) and interleukin-6α (IL-6α), representing a natural
feedback loop alongside the glucocorticoids. Resolution of the APR involves the
restoration of membrane integrity, diuresis of excess fluid and a decrease in the
catabolism of endogenous protein stores (Koj, 1998; Crestani et al., 1998).
The APR reprioritises the hepatic synthesis of export proteins like albumin for an up-
regulation of acute phase reactants like α1-acid glycoprotein; a process thought to be
primarily under the control of IL-6 activity on hepatocytes which induces acute phase
protein transcription (Morrone et al., 1988). The concentration can increase from 2 fold
- as reported by Voulgari et al. (1982) after surgery, during infections and breast, lung
and ovarian cancers - to several hundred fold (Johnson and Smith, 2006; Ebersole and
Cappelli, 2000). An increase has also been observed in arteriosclerosis and type 1
diabetes (Gomes et al., 2003). Fibroblasts and endothelial cells are recruited, further
increasing the level of cytokines produced - fevers, leukocytosis and increased hormone
production can also arise (Hochepied et al., 2000).

19
Figure 1.7. Summary of the APR. [Adapted from Koj, 1996].
Trigger: Injury/infection
Fever, anorexia,
somnolence, leukocytosis,
gluconeogenesis, increased
serum Fe and Zn
Altered
production of
acute phase
proteins.
Local immune response: macrophages, fibroblast, and
endothelial cells stimulated
Secondary
systemic effects. Biochemical and
physiological
changes
Increased production
of inflammatory
mediators: IL-1, Il-6,
TNFα

20
AGP is a constitutively expressed positive APP i.e. hepatic synthesis is increased during
the APR, potentially amplifying its concentration by over 25% (Ceciliani and Pocacqua,
2007). It has been suggested that a marked increase in AGP concentration may limit
adverse reactions such as inflammation by providing a form of negative feedback
(Crestani et al., 1998). Negative APPs include albumin, α-fetoprotein and transferrin
whose concentrations are correlated with a diminished hepatic synthesis during the
APR. APPs can be grouped by the extent of up-regulation as illustrated in table 1.1.
Alternatively it has been shown APPs can be separated into two major classes based on
their response to cytokines. Type I - including AGP and serum amyloid A - are
regulated by IL-1, IL-6 and glucocorticoids like dexamethasone. Type II are regulated
by IL-6-type cytokines, for example the three chains of fibrinogen (Ebersole and
Cappelli, 2000).
There have been studies indicating that extra-hepatic expression of APPs, although
generally infrequent and less well understood than hepatic expression, can occur from
human breast epithelial cells, endothelial cells and lymphocytes including the
monocytes and granulocytes (Gendler et al., 1982; Adam et al., 2003). When increased
production of AGP and other plasma proteins occur, drugs possessing a high affinity for
them become increasingly bound and inactivated. Consequently, the plasma level of
bioactive (unbound) drug available to the target site of action or receptor is reduced,
alongside its efficacy (Kremer et al., 1988). The fact that changes in APP concentration
affect many aspects of health and subsequent treatment is therefore hardly surprising.
Expression of these proteins can be greatly increased in response to numerous factors
therefore limiting their use as markers of specific diseases. However, additional
specific alterations in glycan structure during the APR to tissue injury and inflammation
can occur. In fact some studies have correlated microheterogeneity with particular
diseases, therefore offering potential use as biochemical markers. Minor micro-
heterogeneity for example was shown by De Graaf and colleagues (1993) to be altered
during acute and chronic inflammation when there is an increase in α1-3 fucosylation of
AGP; sialylation was also reported to decrease (Moule et al., 1987). Additionally,
Adam et al. (2003) reported glycosylation patterns might be useful when determining
the stage of a patient’s multiple sclerosis (MS); however - despite its sensitivity - they
were sceptical of its specificity. The degree of branching (major microheterogeneity)
21
has often been reported to alter during pathological conditions; in RA for example a
decrease has been detected (Pawlowski et al., 1989).
AGP is one of the APPs which can undergo extensive post-translational modification.
It is involved in the regulation of inflammation; perhaps through the acquisition of SLex
containing glycans which help AGP bind to leukocyte and endothelial cell (ETC)
selectins, suppressing inflammation by preventing the movement of leukocytes, keeping
the inflammatory response localised (De Graaf et al., 1993).

22
Protein name Class of
APP
Sub-class Function
Ceruloplasmin
Positive
I
(Concentration increases
by approx. 50%)
Copper transport
protein
Complement C3 and
C4
Opsonin
α1-acid glycoprotein
II
(2-5 fold increase)
Immunomodulation,
transport
α1-antitrypsin
Antiprotease
Fibrinogen
Coagulation
C-reactive protein
III
(up to 1000-fold increase
in concentration)
Opsonin,
immunomodulation
Serum amyloid A
Leukocyte activation,
chemotaxis,
phagocytosis
Albumin
Negative
-
Transport
Transferrin
-
Transport
Table 1.1. Classification of acute phase proteins. Based on information from
Ceciliani et al. (2002) and Ceciliani and Pocacqua (2007).

23
1.3 α1 -Acid-Glycoprotein (AGP)
In 1882, AGP was first identified as a ‘reddish-brown residue that remained in solution’
(Chiu et al., 1977) but the protein was not isolated or characterised until 1950 by the
Weimer and Schmid groups. It is a constitutively produced glycoprotein, hepatically
synthesised in parenchymal cells at a rate of 10mg/kg/day with a plasma concentration
of approximately 0.3-1.46gL-1
in healthy young adult humans (Blain et al., 1985;
Ceciliani and Pocacqua, 2007). Like other APPs, its mRNA expression is influenced by
cytokines and steroid hormones. Levels of AGP, as discussed in the previous section,
can increase 2- to 5-fold as a result of the APR to pathological and physiological
stimuli. Concentrations have been reported to increase during myocardial infarctions
and stress (Duché, 2000). It is known that various factors act to influence AGP
glycosylation including the inflammatory state (Van Dijk et al., 1998), pregnancy
(Havenaar et al., 1998), drug or glucocorticoid use (Pos et al., 1988), and oral
contraceptive use (Brinkman-van der Linden et al., 1996).
Being a secondary APP, AGP should reduce the harmful systemic effects induced
during the initial stages of acute inflammation (Van den Heuvel, 2000). Its ability to
inhibit the complement cascade is reliant on the microheterogeneity of its glycans which
in turn is dependent on the expression of (patho)physiological conditions.
Microheterogeneity is described as either major, reflecting changes in the number of
branches on N–linked glycans, or minor which occurs through variation in the SA or
Fuc content (Kalmovarin et al., 1991).
Transcription of AGP encoding genes can be both endogenous and exogenous.
Although extra-hepatic expression has been reported, they are most commonly
hepatically expressed (Adam et al., 2003). In vivo, the human liver synthesises AGP
from the information encoded by 3 adjacent genes, namely AGP-A, B and B', which
form a cluster of 70kb on chromosome 9 (Lögdberg and Wester, 2000). All three genes
exhibit six exons and five introns but code for different variants. The hepatic
expression of the genes is regulated both transcriptionally and posttranscriptionally
through the activities of inflammatory cytokines including glucocorticoids, Il-1β, TNF-
α and Il-6 (Chang et al., 1998). Native (commercial) AGP is reported to consist of more
AGP-A encoded material than AGP-B/B' but unlike the former gene, AGP-B/B' only

24
encodes a single variant (Eap et al., 1988a). A study by Van Dijk (1991) found both
gene products increased during inflammation in burn patients but the contribution made
by the AGP-A gene was greater.
AGP-A codes for the predominantly monomorphic ORM-1 variant (ORM1 F1 and
ORM1 S) and the identical AGP-B and AGP-B' genes encode a single ORM-2 variant
(ORM2 A). They differ from AGP-A by a 22 base substitution and are expressed
around 100 times less. Dente and colleagues (1985) identified the two genes using
southern blotting showing they were present in normal serum in a ratio of 3:1
respectively. AGP-B and B' produce low levels of bi-antennary glycans while AGP-A
primarily gives rise to tri-/tetra-antennary glycans (Dente et al., 1987; Tomei et al.,
1989; Duché et al., 2000). Normal pooled serum can contain ORM1 F1, ORM1 S and
ORM2 A variants; according to Eap and colleagues (1988a) the three main human AGP
phenotypes depend on whether two or three of the variants are expressed in plasma,
namely F1S/A (50%), F1/A (35%) and S/A (15%).
1.3.1 Structure of AGP
AGP has a chemical nature identical to many serum components which also interact
with hormones like progesterone, producing dissociable complexes (Albani, 1997). It
has a molecular weight between 38.8kDa-48kDa (Israeli and Dayton, 2001); the value
reported is likely to depend primarily on the method of isolation used. Unusually, it is
soluble in both water and polar organic solvents (Fournier et al., 2000). AGP belongs
to the subfamily of immunocalins - binding proteins with immunomodulatory functions
but can also be classed as a mucoprotein, seroglobulin and α-1-globulin (Kremer et al.,
1988). In 1973, Schmid and colleagues were the first to identify the structure of AGP,
however they had believed there to be only 181 amino acids constituting the peptide
backbone. This was refuted in 1985 when it became widely accepted that an extra Lys
and Arg resided at positions 173 and 174 respectively, producing a 183 amino acid
backbone (Dente et al., 1985). The 22 sites for possible amino acid substitution which
present the differences between AGP-A and AGP B/B', may lie within the glycosylation
sites (positions 15, 75 and 85) but whether it causes altered glycosylation of the gene
products is unknown (Van Dijk, 1991). The sequence of amino acids is illustrated in
figure 1.8. Using homology modelling, Hazai et al., (2006) found that serine (Ser) is

25
located at position 77 and glutamate (Glu) at 92 in ORM2 but not in ORM1. Also, at
positions 98 and 115, ORM1 has phenylalanine (Phe) and aspartate (Asp) respectively
but ORM2 expresses valine (Val) and tyrosine (Tyr).
The human AGP precursor consists of 201 residues; the first 18 residues become
cleaved during protein processing (Ceciliani and Pocacqua, 2007). Its protein portion
constitutes 23kDa of the mass and approximately 59% of the structure (Albani et al.,
2000; Liao et al., 1985). Polymorphisms can arise; at positions 32 and 47, various
amino acids can be expressed and substitutions can occur at residues 21 and 181.
Despite the potential for polymorphisms, the structure of AGP still shows an 80%
homology with immunoglobulin G (Kremer et al., 1988).
Proportionally, the different secondary structures including α-helix, β-sheet, reverse β-
turns, and unordered structures account for 15%, 41%, 12%, 8% and 24% of the AGP
molecule respectively – as reported by Kopecký and colleagues (2003) upon analysis by
infrared and Raman spectroscopy. The large proportion of β-sheet in the structure is
common to proteins exhibiting the transport-trafficking function - lipocalins. These
molecules consist of a single eight-stranded antiparallel β-sheet closed back on itself to
form a continuously hydrogen-bonded β-barrel (Flower, 1996).
Four of the five AGP glycan chains are linked to Asn residues within reverse β-turns or
in regions where charged and polar residues are numerous (Kremer et al., 1988;
Ceciliani and Pocacqua, 2007); the glycosylation process may force the nascent peptide
to twist from an Asn turn to a β-turn. This has been supported by nuclear magnetic
resonance (NMR) analysis (O’Connor and Imperiali, 1997). As previously described
(section 1.1.3.1), proline cannot form part of the consensus sequence Asn-X-Ser(Thr) as
it prevents the formation of a β-turn which is required for the glycan attachment.
Studies have shown that certain amino acids show particular preferences regarding their
locations in the folded structure. There are three tryptophan (Trp) residues; Trp 25 is
buried in the hydrophobic binding site while the others are closer to the surface; Trp 160
is exposed and Trp 122 lies between the hydrophobic binding site and the surface
(figure 1.8). The closer the Trp residues are to the surface, the more they can rotate
(Friedman et al., 1985). Additionally, nearly all the Phe and 5-7 Tyr are completely or
partially buried in the native state.

26
Glu – Ile – Pro – Leu – Cys – Ala – Asn – Leu – Val – Pro – Val – Pro – Ile – Thr –
Asn – Ala – Thr – Leu – Asp – Gln/Arg – Ile – Thr – Gly – Lys – Trp – Phe – Tyr – Ile
– Ala – Aer – Ala – Phe/Ala – Arg – Asn – Glu – Glu – Try – Asn – Lys – Ser – Val –
Gln – Glu – Ile – Gln – Ala – Thr/Ala – Phe – Phe – Try – Phe – Thr – Pro – Asn – Lys
– Thr – Glu – Asp – Thr – Ile – Phe – Leu – Arg – Glu – Tyr – Gln – Thr – Arg – Gln-
Asp/Asn – Gln – Cys – Ile/Phe – Try – Asn – Thr/Ser – Tyr – Leu – Asn- Val – Gln –
Arg – Glu – Asn – Gly – Thr – Ile/Val – Ser – Arg – Tyr – Val/Glu – Gly – Gly –
Gln/Arg – Glu – His – Phe/Val – Ala – His – Leu – Leu – Ile – Leu – Arg – Asp – Thr –
Lys – Thr – Tyr/Leu – Met – Leu/Phe – Ala/Gly – Phe/Ser – Asp/Tyr – Val/Leu –
Asn/Asp – Asp – Glu – Lys – Asn – Trp – Gly – Leu – Ser – Val/Phe – Tyr – Ala –
Asp – Lys – Pro – Glu – Thr – Lys – Glu – Gln – Leu – Gly – Phe – Tyr – Glu – Ala –
Leu – Asp – Cys – Leu – Arg/Cys – Ile – Pro – Lys/Arg – Ser – Asp – Val – Val/Met –
Tyr – Thr – Asp – Trp – Lys – Lys – Asp – Lys – Cys – Glu – Pro – Leu – Glu – Lys –
Gln – His – Glu – Lys – Glu – Arg – Lys – Gln – Glu – Glu – Gly – Ser – COOH
Figure 1.8. The amino acid sequence of AGP. [reproduced from Dente et al., 1985]
The five Asn sites to which glycans attach are labelled in green and the amino acid
residues where substitution occurs are purple. Trp 25 (red) indicates the residue buried
in the hydrophobic pocket, Trp 160 (orange) is exposed and Trp 122 (blue) resides
between the surface and pocket.

27
Glycan chains account for the remaining 41-45% of the molecule. Despite such an
abnormally high content, galactoglycoprotein (identified in 1980 by Schmid and
colleagues) supersedes it with 76%. There are five variable, highly sialylated
heteropolysaccharide complex-type glycans Asn-linked at residues 15, 38, 54, 75, and
85 - normally becoming bound in the first half of the polypeptide (Israeli and Dayton,
2001; Eap and Baumann, 1993). The presence of acidic amino acids and the -COOH
group at C1 of SA (a common terminating sugar α2-3 or α2-6 linked to Gal; also called
neuraminic acid-NeuAc) gives rise to the negative charge and the very low pI of 2.8-3.8
(Hochepied et al., 2003; Elg et al., 1997). There can be up to 16 SAs, which account
for approximately 11-12% of the structure and each is reported to have a molecular
weight of 314Da. If the glycoprotein is desialylated, the molecule is rendered inactive.
The structures are also constructed from 14% neutral hexoses [Gal, Man and GlcN (a
hexosamine)] and 1% Fuc (Albani, 2003; Kremer et al., 1988; Dente et al., 1987). As
discussed in section 1.3, there is a region of commonality between N-linked glycans like
those of AGP, namely the pentasaccharide core.
Fuc is a terminating sugar which can link to GlcNAc (α1-3) on the external branch. It
can also be linked through an α1-6 bond to a core GlcNAc and α1-2 to Gal (Fournier et
al., 2000). It is therefore not surprising that the degree of fucosylation can vary between
individuals, generally greater in structures with elevated tri- and tetra antennary chains.
AGP is one of the few glycoproteins that contain tetra- as well as bi- and tri-antennary
N-linked glycans. Fournier et al. (2000) reported that 30% of human serum proteins
actually have no Fuc. Within the Byers et al., (1999) study, it was shown that AGP
appeared to contain 11.3% NeuAc, 0.8% Fuc, 14.9% GlcNAc, 6.3% Gal and 5.2% Man.
There is potential for the existence of 105 different glycoforms of AGP due to the huge
structural variability provided mainly by the presence of glycans (microheterogeneity).
However in normal, non-pathological conditions there are only 12-20 expressed, each
exhibiting various degrees of branching, fucosylation and sialylation (Albani, 1997).
The number of feasible glycoforms is reduced because the Asn residues selective for the
type of glycans they express in terms of the degree of branching (figure 1.9). The first
and second Asn sites (Asn 15 and 38) prefer to harbour bi-antennary glycans whilst Asn
15 will not bind a tetra-antennary chain and Asn 38 never binds fucosylated glycans.
Conversely, Asn 75 and Asn 85 prefer more branched glycans; in fact site Asn 75 never
carries bi-antennary chains and Asn 85 usually expresses the greatest degree of α1,3-
28
fucosylation (Higai et al., 2005). This increased branching could explain why only
these two sites potentially carry a tetra-antennary chain with more than one Fuc residue
(Fournier et al., 2000). It has been found that the majority of AGP glycans have a
tri/tetra-antennary structure (85-90%) and the remaining 10-15% is bi-antennary
glycans (Perkins et al., 1985).
Anti-inflammatory properties have been shown to be dependent upon glycan
composition. For example, Pos and colleagues (1990) showed that biantennary glycans
must be expressed by AGP if it is to inhibit CD3-induced proliferation of lymphocytes
while another group (Williams et al., 1997) reported that the presence of SLex groups
enable it to cause amelioration of neutrophil- and complement-mediated injuries.
There are two types of microheterogeneity expressed by AGP; each can be further
subclassified and are associated with the glycan chains not the peptide backbone; the
peptide remains constant. For the major form, type I causes the degree of tri- and tetra-
antennary branching to be reduced in preference for bi-antennary chain expression; the
opposite occurs in type II, as shown in ConA studies (van Dijk et al., 1994) where the
most strongly retained fraction possess the greatest biantennary content while the
unretained fraction represents those without any biantennary chains. According to
Bayard and Kerckaert (1980), in normal plasma the three fractions account for 46%,
39.1% and 14.9% of the AGP conveyed (un-retained, weakly retained and strongly
retained respectively), therefore supporting the theory that structure of AGP is highly
branched.
The minor form is not directly associated with branching but instead the extent of
fucosylation and sialylation of the five oligosaccharide chains (Albani et al., 1997). In
2002, Smith and co-workers reported that the termini of tri- and tetra-antennary chains
are more tightly bound to the polypeptide core than those of bi-antennary; this makes
the glycoconjugate more metabolically stable. It is the tissue-specific regulation of
glycosyltransferase genes, the availability of sugar nucleotides, and competition
between enzymes during glycan processing that determines the variation in glycan
microheterogeneity.

29
Figure 1.9. A diagrammatic representation of possible N-linked glycosylation of
AGP. The common degrees of branching are indicated, as described in the text; the
lengths of the chains can vary. Also, the specific Asn residues to which glycans become
attached are labelled. Branching can be bi-, tri-, or tetra-antennary with some of the Asn
sites specific in the type they will express.
GlcNAc Man Gal NeuAc
PROTEIN
GLYCO-
183 amino acid backbone
Asn 15 Asn 38 Asn 54 Asn 75 Asn 85
Tri-antennary Bi-antennary Tetra-antennary

30
1.3.2 Analysis of glycan microheterogeneity
The functions attributed to AGP, like all glycoproteins, are largely determined by the
glycans with which they are associated. During various physiological and
pathophysiological conditions, the heterogeneity of the glycoforms expressed can
become altered, potentially affecting the functions subsequently performed. It is
therefore of interest to analyse these structures. The microheterogeneity of AGP can be
ascertained using CAIE (crossed affinity-immunoelectrophoresis), which uses a
Concanavalin (con A) lectin isolated from the jackbean to interact with the glycans -
fractionating AGP according to the bi-antennary content, without altering the structure
(Van Dijk et al., 1994; Hansen et al., 1989). Another highly desirable technique in the
field of glycomics due to its sensitivity is high pH anion-exchange chromatography
(HPAEC) which primarily separates structures based on the negative charge expressed.
Coupling HPAEC with pulsed amperometric detection (PAD) transformed the analysis
of glycans by offering highly sensitive (10–100 pmol) detection and effective separation
without the need for prior derivatisation. Both the monosaccharide components and
whole oligosaccharides of N-linked glycans can be analysed using the technique
(Townsend et al., 1989; Smith et al., 1997). More than 20 years after its introduction,
the use of HPAEC remains widespread and competitive with other techniques.
Recently, Adamo and colleagues (2009) concluded that its sensitivity compared
favourably with capillary electrophoresis–laser induced fluorescent detection and
reverse-phase HPLC coupled to electrospray mass spectrometry for the analysis of the
monosaccharides of IgG glycans.
Tandem Mass Spectrometry (MS/MS) is seeing increasing use in glycoprotein analysis.
It was first utilised in the analysis of N-linked glycans by Mock et al. (1991) but the
methodology is not without problems, hindered by the potentially high proportion of
peptides in a sample which can exceed that of glycopeptides. Thus, because the signals
generated by peptides are often much higher, those of the glycopeptides can be masked;
especially if they are terminated in negatively charged SA residues (Annesley, 2003).
Difficulties also arise in its ability to distinguish oligomers of similar masses and linear
isomers unlike HPAEC-PAD.

31
1.3.3 AGP Structure and Disease
It is unlikely that the exact cause of elevated AGP can be determined however,
alterations in the microheterogeneity of the glycoprotein may offer more potential as
they often correlate with specific conditions (Hansen et al., 1984). Although the
glycosylation of AGP is generally reproducible in healthy individuals, it is known to be
altered – alongside the levels of its expression - in response to certain
pathophysiological conditions like inflammation, cancer and RA (Van Dijk et al.,
1994).
Hashimoto (2004) for example, reported that it may be possible to analyse the
glycosylation pattern of AGP to determine the progression of cancer; there were
significant differences between pre-operative patients and a healthy population,
indicating their clinical status. Merely analysing the levels of AGP, although
significantly different between groups, did not allow the clinical status to be
determined. The poorest prognosis was found in patients with advanced malignancies
and highly fucosylated triantennary and tetraantennary AGP glycans for long periods
after surgery. Significant changes to the level and glycosylation of AGP have also been
reported by Haston (2003) during inflammation. The degree of fucosylation and sialyl
Lewis X (SLex : Neu5Ac α2-3Galβ1-4(Fucα1-3)GlcNAc-R) expression is increased
during acute inflammation; thought to be part of a humoral feed-back response to the
interaction of leukocytes with E-selectin which is required for extravasation into
inflamed tissues (van der Linden, 1994). A decrease in tri- and tetra-antennary
structures but an increase in bi-antennary glycans attached to the five sites of
glycosylation was reported in acute inflammation along with increased α1,3
fucosylation at most sites (Higai et al., 2003; 2005). In chronic inflammatory
conditions like grade III and IV RA, Mackiewicz et al. (1987) reported that the
expression of bi-antennary glycans and sialylation decrease in preference for tri- and
tetra-antennary chains occurring alongside hyperfucosylation – as demonstrated a
decade later by Elliott and colleagues (1997). Asn 75 and Asn 85 (figure 1.9) show
increased tri- and tetra-antennary α1,3 fucosylation. When comparing acute and chronic
sera to that of healthy individuals, they did not find any significant alterations in the N-
glycan composition. In 2001, Rydén et al. (2002) indicated that AGP fucosylation was
increased with disease severity in male patients. An increase in α2-3 linked SA
expression is also associated with RA (Elliott et al., 1998). Smith et al. (2002) reported
32
on the possibility that AGP production is localised in rheumatoid synovial fluid (SF)
because the AGP microheterogeneity differed to that in serum. The latter expressed
fewer branches and a lower degree of fucosylation.
Increased α1,3 fucosylation in hepatitis B and some cancers can cause an increase in the
expression of SLex on tri- and tetra-antennary glycans (Kobata., 1992; Dennis et al.,
1999). Studies by Kremmer et al., (2004) indicated that the AGP of cancer patients
expressed greater Fuc and SA content when compared to a healthy population. The
increase in SA expression in cancer was shown previously by Moule (1987) who
studied the microheterogeneity of serum AGP in patients with RA, myocardial
infarction (MI), cancer with elevated AGP, cancer without elevated AGP and compared
them to that obtained a group of healthy volunteers. Unlike the cancer groups, the level
of AGP in RA patients decreased. Cystic fibrosis (CF) sufferers have decreased
sialylation and increased number of Fuc residues bound via an α1,3-linkage to
antennary GlcNAc. The length of the polymers affects the migration of cells; increased
Fucα1,3GlcNAc and decreased SA on CF airway cells, may present a target for bacteria
and leukocytes (Scanlin and Glick, 2000). It has been shown that the severity of liver
diseases like cirrhosis can be reflected in the structural changes in AGP (Mooney,
2006). Increased expression of Fuc residues occurred in cirrhosis as was indicated in
1987 and 1989 by Biou and colleagues. A decrease in sialylation occurred in fibrosis.
Changes - including an increase in branching and sialylation - also occur under normal
physiological processes like pregnancy (Orczyk-Pawiowicz et al., 2006). Any changes
which occur, whether during physiological or pathophysiological conditions, can cause
alterations in the functions performed by the glycoprotein because they influence the
overall structure and conformation of the biomolecule.
1.3.4 Functions of AGP
It has been established that the constitutive production of AGP contributes to the
maintenance of homeostasis and that the glycan composition of AGP determines the
functional roles of the glycoprotein like those in immunomodulation and drug binding
(Ceciliani and Pocacqua, 2007). However, its primary biological function remains
elusive despite being investigated intensively since the 1950s. AGP is a member of the
lipocalin family (proteins with hugely diverse sequences but highly conserved

33
structures), enabling it to carry out the transport of small hydrophobic molecules
(Treuheit et al., 1992; Flower et al., 2000). As noted by Chiu et al. as early as 1977,
many AGP functions depend on the structure of the attached glycans.
1.3.4.1 Immunomodulation
AGP has been reported to have potential physiological significance as a natural anti-
inflammatory and immunomodulatory agent, both in vitro and in vivo notably with
respect to anti-neutrophil and anti-complement activity (Williams et al., 1997). The
microheterogeneity of AGP is responsible for its fairly non-specific immunosuppressive
properties; it is involved in the inhibition of neutrophil activation, platelet activation,
phagocytosis and – due to interactions formed with collagen - wound healing (Costello
et al., 1979; Bennett and Schmid, 1980). When asialylated and agalactosylated,
immunosuppression of lymphocyte function was maximised (Hochepied et al., 2003;
Bennett and Schmid, 1980). The number of branches and degree of sialylation is
thought to be responsible for its ability to inhibit lymphocyte proliferation.
AGP can inhibit the complement cascade if the glycan composition is correct thereby
reducing the harmful systemic effects induced during the initial stages of acute
inflammation (Kalmovarin et al., 1991). Anti-inflammatory cytokines like IL-1β, IL-6
and TNF-α, are produced in response to AGP production. Daemen et al., (2000)
indicated that exogenous AGP and another APP, α1-antitrypsin (AAT), might also
inhibit inflammation and the apoptosis of hepatocytes. It is possible that AGP evolved
to become part of the body’s defence system, limiting the damage to healthy tissues
caused by inflammation. In vivo, normal serum AGP levels may protect against the
activation of polymorphonuclear leukocytes (PMN) however, during inflammation
chemotoxins and other activators could override this protection (Costello et al., 1984).
The glycan moieties modulate the interaction of AGP with receptors and ligands, the
extent of which depends on variations in glycosylation (Ceciliani and Pocacqua, 2007).
One alteration, which occurs during acute inflammation, is the expression of the E-, L-
and P- selectin ligand, SLex. Selectins are important for interactions between
leukocytes and the endothelium thus any modification to the structure subsequently
affects the interactions. For example, E- selectin binds SLex on AGP and therefore
competes with leukocytes expressing the E-selectin ligand ESL-1. A consequence of

34
increased SLex-substituted glycan expression is the inhibition of leukocyte rolling and
diapedesis into inflamed tissues, acting similarly to a negative feedback mechanism (De
Graaf, et al., 1993). It was also shown that the glycans of AGP are critical in
suppressing lymphocyte proliferation induced by mitogens (Pos et al., 1990).
When investigating the anti-inflammatory effects of AGP, Tilg et al., (1993) were
interested in determining if AGP and other APPs; α1-anti-trypsin and C-reactive protein
could induce IL-1β and its specific antagonist, IL-1 receptor antagonist (IL-1Ra) in
peripheral blood mononuclear cells (PBMC). When incubated with AGP, the level of
IL-1Ra induced was significantly less than that with CRP or AAT but the level was
always preferentially induced over that of IL-1β. From this information they concluded
that IL-1Ra induction may contribute to the anti-inflammatory effects of APPs. IL-1Ra
prevents the binding of IL-1 (an important inflammatory mediator in fever, hypotension
and the APR) to its receptors in a competitive manner both in vivo and in vitro (Arend,
1991).
In addition to the various immunological roles that AGP has, it is one of the most
important non-specific binders of drugs.
1.3.4.2 Drug binding
Drug activity is dependent on a number of factors including its ability to bind to other
molecules, affecting their tissue distribution. For over 50 years there has been extensive
research into the binding of molecules to human serum albumin (HSA), subsequently
affecting their efficacy, distribution and disposition. More recently there has been
increasing interest in the study of the degree of binding to other plasma binding proteins
including AGP (especially for basic drugs), to determine if binding affects their
pharmacokinetics (PK) and pharmacodynamics (PD). Under non-pathological
circumstances, AGP is present at lower concentrations than HSA (50-100mg/100mL
compared to 4g/100mL); however its concentration may increase significantly to
become the major drug binding macromolecule during certain pathophysiological
conditions. Conversely, the level of HSA decreases. Such fluctuations in APP
concentrations influences the ability of certain drugs to produce their effect (Ceciliani
and Pocacqua, 2007; Israili and Dayton, 2001). When the drug is administered, the
binding equilibrium is immediately altered between drug and proteins (Kuroda, 2003).

35
Binding to AGP is not universal between drugs; it depends on certain properties and
therefore they are not all affected similarly. For example, AGP shows preference to
basic and neutral drugs - propranolol, methadone and warfarin are among those that the
glycoprotein has been shown to bind with a high-affinity and low capacity. It can also
bind steroid hormones like progesterone and some acidic molecules like the retinoic
acids (Israili and Dayton, 2001). This is in contrast to HSA which mainly binds acidic
drugs as proven by Pike and colleagues (1983) who reported that HSA-deficient plasma
showed a decrease in the binding of acidic and neutral drugs.
The products of the genes encoding AGP (namely AGP-A, AGP-B and B') show
preference for the binding of different drugs. Basic drugs generally favour the ORM2 A
variant, as reported using imipramine by Hervé et al. (1993), while acidic drugs like
warfarin bind the ORM1 F1/S variant. Hervé and colleagues concluded that the ORM2
A variant binding site was specific for basic drugs while ORM1 F1 and/or S for acidic.
There are a number of pharmacokinetic factors associated with the binding of drugs.
When bound it cannot penetrate the blood vessel walls, a process required to reach its
site of action thus it is consequently rendered inactive. The ability to induce the
pharmacological effect is determined by the remaining unbound drug - the free drug
hypothesis (Tillement et al., 1988). In order to produce the effects associated with the
drug administered, a certain free level must be present at its site of action (minimal
effective concentration, MEC), if not its efficacy is reduced. Binding to AGP may
prevent attainment of the MEC therefore rendering the drug ineffective if the dosage is
not adjusted accordingly. The level of bioactive drug therefore varies with altered AGP
concentrations despite the total drug concentration being only marginally affected
(Kremer et al., 1988).
It is possible that binding to plasma proteins could be, at least in part, responsible for
multi-drug resistance (MDR). The concentration of free drug that reaches the target site
may be too low to induce the therapeutic effect, providing time to evolve drug
resistance (Fournier et al., 2000). In some patients a commonly toxic drug dosage may
not cause the associated adverse effects if the AGP concentration is elevated; although
the total drug concentration is high, a large proportion will be inactivated through
binding to the glycoprotein (Israili and Dayton, 2001; Silamut et al., 1991). This
concept was summarised in figure 1.10.

36
Figure 1.10. Representation of the therapeutic range of drugs. The therapeutic
range (represented in green) is the drug concentrations that, if present at the site of
action, will produce the associated effects. Concentrations greater than this can cause
toxicity (red) and those below would be ineffective (blue) in the body, possibly causing
withdrawal symptoms if the drug is used regularly.
Dru
g c
on
cen
tra
tion
Toxic
No effect
Therapeutic range

37
The binding sites are thought to be buried in a hydrophobic pocket, thus drug binding is
generally regarded as hydrophobic. It was initially suggested that AGP expressed one
wide and flexible binding site for drugs (Maruyama et al., 1990). However more recent
studies have refuted this, reporting it to consist of at least three partially overlapping
subsites; the basic ligand binding site, an acidic ligand binding site and a steroid
hormone (SH) binding site (Matsumoto et al., 2002). It has also been suggested that the
number of binding sites expressed on AGP for a particular drug will depend on the
genetic variants of the glycoprotein present (Hervé et al., 1993); imipramine for
example was shown to bind one site on the A variant with high affinity and to two other
sites with a low affinity while warfarin exhibited binding to fewer sites. Therefore,
differences in binding cannot be solely explained by variability in the affinity at a single
binding site. Methadone is thought to bind AGP at a single binding site with preference
to that present on the ORM 2A variant.
When AGP binds to ligands, the dynamics of the binding pocket are affected - the
buried Trp residue becomes more exposed whilst the Trp at the surface becomes
increasingly buried; (Fournier et al., 2000; Johnson and Smith, 2006). It is the ability of
Trp (and to a lesser extent, Tyr) residues to emit fluoresce between 300-400nm (max
approximately 340nm) when excited at 280nm, that allows fluorimetry to be used in the
analysis of drug binding – more binding causes a decreased fluorescence because it
masks (quenches) the underlying fluorescing residues. However, it must be noted that
fluorescence resonance energy transfer (FRET) may occur in such studies. The
phenomenon is particularly problematic when the drug under investigation has
absorption spectra spanning wavelengths used to determine the fluorescence emitted by
AGP and other proteins. Chlorpromazine for example, is a yellow compound which is
well known to absorb at wavelengths including those around 340nm. Therefore a
reduction in the fluorescence is likely to be at least partly due to absorption by the
drugs’ (Shine & Mach, 1965).
It is also possible that in some proteins, when there is a potential change in its
conformation to accommodate the ligand, the position of residues - normally far apart in
the absence of drug - may be altered. Fluorescence of the residues may subsequently be
reduced, not only because they become increasingly buried but due to potential transfer
of fluorescence to other residues. A greater reduction would therefore be recorded than
that solely due to the masking effect in the binding site brought on by the drug.

38
A number of factors affect the ability of AGP to successfully bind drugs in vivo,
including physical-chemical properties and inter-individual differences. Physical-
chemical properties include pH (binding increases with pH), the presence of alosteric
co-operativity with proteins like albumin (Fournier et al., 2000; Israili and Dayton,
2001), and altered glycoprotein concentration in various diseases like breast and liver
cancers where AGP concentration increases (Jackson et al., 1982). Major and minor
heterogeneity, altered conformations induced by disease (for example altered
sialylation, fucosylation and glycosylation pattern) and displacement by other ligands
are further examples (Rydén et al., 1997; Israili and Dayton, 2001).
Gender, age, ethnicity of donor and genetic polymorphisms are examples of inter-
individual differences. It has been noted in a number of studies that healthy females
appear to have more sialylated glycoforms than males but males generally have higher
levels of AGP (Israili and Dayton, 2001). Females can show further interindividual
variation, which suggests their hormones have a role in altering AGP structure.
Younger females, for example those in the later stages of pregnancy and those taking
the contraceptive pill, express even lower levels of AGP (Routledge, 1989). Reports
regarding the levels of AGP in the elderly are in wide disagreement. Veering et al.
(1990) for example, reported no correlation between the increased production of AGP
and age, whilst Davis et al. (1985) found AGP increased slightly with age. However it
is possible, as suggested by Israili and Dayton (2001) that factors such as weight,
inflammation and nutritional status could account for the variation. Research has shown
that there is a difference between Caucasians and African-Americans in the degree of
binding salicylic acid and disopyramide. Caucasians appeared to have more binding
initially however no significant differences were noted when the correlation factor had
been accounted for (Johnson and Livingston, 1997). If any of the numerous factors
cited cause alterations in the expression of AGP, the efficacy of drugs may be affected.
Various studies have been undertaken indicating differences in the ability of the AGP
variants to bind drugs. Most drugs bind both AGP variants however there are some
which show a preference. Disopyramide and imipramine for example, bind only the
ORM2 A variant while warfarin selectively binds to ORM1 F1*S (Matsumoto et al.,
2002). It was Eap et al., (1988c and d) who first reported that the variants could express
different binding properties - these differences could explain why some studies find
only a small number of high-affinity binding sites for basic drugs like methadone

39
(Abramson 1982). A study by Eap et al., (1990) indicated the presence of the AGP
genetic variants could be responsible for interindividual differences in methadone
binding, favouring ORM2 A.
Increases in the concentration of AGP (and other proteins-IgA and C3) were found to
occur in those with high stress perception compared to those with lower (Ebersole and
Cappelli, 2000); other studies found this to occur in stress related to major depression.
Also, Rostami-Hodjegan (1999) noted that heroin dependent individuals have elevated
levels of AGP. These findings could be relevant to this study, titration patients are
newcomers to the therapy and thus still heroin-dependent with high stress levels
common especially while they are titrated onto a steady maintenance dose; as discussed
further in the opiate section of this introduction.
40
1.4 Opiates
1.4.1 Opiate addiction: a global problem
The opiates are a family of drugs commonly abused in society, but also used medically.
Members include the illicit street drug heroin and naturally occurring morphine, from
which heroin is synthetically derived. A UNODC report suggested that in 2008 figures
for opioid abuse ranged between 12.8 and 21.8 million individuals (World Drug Report,
2010) – commonly in conjunction with another family of CNS depressants known as the
benzodiazepines (BDZs), thus it is a huge problem.
Between 0.4-0.8% of adults in Europe, USA and Australia reportedly develop opioid
dependence, escalating their illegal drug habit (Hall and Mattick, 2007; Ward et al.,
1999). A study in 2005 estimated that over 51,500 individuals misused these substances
in Scotland and that were 2,400 registered heroin users in the Lothian region alone (Hay
et al., 2005). Epidemiological studies performed in 2003 in the U.S.A have indicated
that, after marijuana, opioid analgesics are among the most frequently abused illicit
drugs in secondary school students (Johnston et al., 2004). Studies of a similar age
group in the UK reported that, in 2005, 6% had been offered heroin in England and
Wales, and 1% of respondents had used it within the preceding year (NHS Drug Misuse
and young people report, 2005). Long-term use of opioids is associated with abuse or
addiction development; the term ‘addict’ often used to describe individuals whose
repetitive drug taking behaviour stimulates the central nervous system (CNS) causing
specific neurobiological changes which induce repetitive drug consumption (Scimeca et
al., 2000).
The death rate among heroin users is thought to be 13-fold higher than a healthy
population of similar age and gender (Gossop et al., 2002). Contributing factors include
the spread of blood borne viruses associated with intravenous (i.v.) injection. Similar to
the UK, Italy has a high incidence of injecting drug abuse which allowed AIDS to
surpass overdose as the main cause of death among heroin users in late 1980s and early
1990s (peaking in 1991-1992). Its incidence in Italy has reduced, like much of Western
and central Europe, since the early 1990s (Davoli et al., 1997; Bargagli et al., 2001).
Perhaps this is partially due to the widespread introduction of opioid substitute

41
programs which reduce the need for i.v administration (instead a substitute which can be
orally administered is used). However the incidence of HIV/AIDS and hepatitis C in
injecting drug users has been on the rise in Eastern Europe. The occurrence of suicides
in these drug users also differs among countries; in the UK it is thought to be
approximately 10-15 per 105 of the population, similar to the USA and Australia. In
Finland however it may be almost double - 30 per 105 (Diekstra and Gulbinat, 1993;
Lynskey et al., 2000).
Methadone maintenance therapy (MMT) is the most common opioid substitute
treatment. The drug was first identified in the 1960s by Dole and Nyswander (1966) as
a viable substitute in opioid dependence treatment despite decades of use as an
alternative analgesic to morphine. The rate of achieving successful annual abstinence
from heroin in the absence of therapeutic support is reportedly as low as 1-2% (Hall and
Mattick, 2007). Those successful, commonly suffer relapses within 12 months if they
do not receive any pharmacological or psychosocial assistance. Of those receiving
methadone, abstinence from both the abused and therapeutic substitute drug may only
be achieved in approximately 3% of patients annually although figures vary between
studies (McKeganey, 2006). In order to improve treatment and identify viable
alternatives, research must continue to enhance our understanding of why success rates
may be so low.
1.4.2 The mechanism of opioid action
The general pharmacological effect of the opiates is achieved through a depression of
the CNS; promoting the onset of analgesia. However, despite being a cornerstone in the
treatment of moderate to severe pain, opioids can leave a patient more sensitive to pre-
existing pain: this is the concept of opioid-induced hyperalgesia (OIH), for which there
is accumulating evidence (Angst and Clark, 2006). Research has indicated that when
compared to former heroin addicts who are not (or no longer) undergoing MMT or
‘healthy’ subjects, those maintained on methadone are more sensitive to cold pressor
pain with some hyperalgesia. The increased pain sensitivity possibly predisposes them
to recurring addiction as they attempt to prevent the onset of symptoms, thus a vicious
cycle ensues (Doverty et al., 2001; Compton et al., 2000). It is thought that opioid
tolerance and OIH coexist because they share the same neurotransmitter and receptor
42
systems, which may explain why it can be very difficult to distinguish between an
individual displaying tolerance and another suffering from OIH (Angst and Clark 2006).
Under normal physiological conditions, the neurotransmitter γ-aminobutyric acid
(GABA) is released from associated neurones and inhibits the release of dopamine (DA)
from dopaminergic neurons when bound to its receptors on nerve terminals (figure
1.11a). Internally derived endogenous opioids (endorphins) may bind to µ, δ and κ
opioid receptors (ORs) however, when heroin metabolites bind the μ-opioid receptors
(µOR) of the nucleus accumbens (NA) and ventral tegmental area (VTA), the
‘rewarding’ neurobiological circuit (dependent on DA release from opioid-sensitive
neurones) is enhanced, as shown in figure 1.11b. The active heroin metabolites bind to
the ORs which in turn inhibit the synthesis and release of GABA, therefore DA is
increasingly released into synapses and the post-synaptic membrane can be continually
activated, inducing the euphoria and pleasurable feelings associated with heroin use.
These ‘positive’ effects may explain the desire of users to repeatedly administer the
drug despite the risks associated with them. Conditioned responses develop whereby
individuals associate the use of drug and its ‘positive’ effects with particular stimuli,
therefore finding it difficult to resist re-use when faced with said stimuli. In turn the
users become dependent on the drug to perform activities related to daily life (Compton
and Volkow, 2006).
As the dose of drug administered by an individual increases, the body creates stronger
compensatory responses to its effects therefore the user requires increased doses to
produce the responses previously achieved at lower levels; they become increasingly
tolerant. If the concentration of bioactive drug present at receptors is insufficient to
stimulate them effectively, withdrawal symptoms occur; an upregulation of the cAMP
pathway and subsequent increased activity of its Noradrenaline (NAdr) secreting cells
occurs in the locus ceruleus (LC) (Housová et al., 2005; Kreek, 1997).

43
a)
b)
Figure 1.11. Diagrammatic representation of synaptic activity in the absence (a)
and presence (b) of heroin. [Adapted from Schumacher et al., 2009]. Introduction of
μ opioid agonists inhibits the normal release of GABA, therefore allowing greater levels
of dopamine to be released.
Inhibition
Inhibition

44
1.5 Heroin
1.5.1 Heroin addiction
Heroin is a lipophilic morphine derivative with two acetyl groups which allow it to pass
through the BBB more easily than morphine (figure 1.12a and b respectively). The
complete drug remains in this form for a matter of minutes before it is rapidly
hydrolysed to its more stable metabolites morphine and 6-monoacetylmorphine;
approximately 95% of a heroin dose is eliminated within 30minutes. The two main
metabolites allow for the prolonged pharmacodynamic (PD) action of approximately 4-
6hours (Salmon et al., 1999; Rook et al., 2005).
Essentially, increasing the rate of drug delivery to the brain is the primary ‘goal’ of the
drug user. Therefore, because heroin has a poor oral bioavailability (the hypothetical
proportion of administered dose which reaches the circulation is low), users often
progress from smoking to snorting. A study undertaken by van den Brink (1999) noted
many heroin users inhaled heroin vapours, produced when heating on tinfoil –
commonly referred to as ‘chasing the dragon’. Subsequent transfer to injecting the drug
i.v. is widespread in heroin users as this provides the most direct rate of delivery to the
brain ORs. Hay et al. (2004) reported that in 2003, over 18,500 of the ~51,500 opiate
and/or BDZ misusers were injecting the drugs in Scotland. However, this route thereby
increases the risk of transmitting blood-borne viruses like HIV (60% opioid-dependent
persons are HIV positive according to Nadelmann and McNeely, 1996), and hepatitis C
(50-70% injecting drug users infected; Krambeer et al., 2001) through the sharing of
needles. Holmberg (1996) reported that up to 50% of newly diagnosed cases of HIV
infection are linked to injecting drug use.
It has been reported that heroin users tend to use a combination of drugs alongside
heroin including BDZs (a common family of psychotropic drugs), cannabis, alcohol and
amphetamines although they are not necessarily dependent on all of them (Klee, 1990).
The use of alcohol and BDZs, alongside heroin is correlated with fatal and non-fatal
heroin overdoses because they too are respiratory depressants, (Zador et al., 1996;
Darke et al., 1996).

45
a)
b)
c)
Figure 1.12. The chemical structure of a) heroin (diacetylmorphine), b) morphine
and c) methadone. [Adapted from Rodriguez-Rosas et al. (2003) and Galloway and
Bellet (1999)].

46
1.5.2 Dependence and Tolerance
All opiates have the potential to cause dependence; a complex condition involving
social, psychological and biological components. Within-system adaptations that can
occur in the acute reinforcing activity of drugs may involve neurochemical changes
associated with certain neurotransmitters. The desire to re-experience positive ‘reward’
outcomes and prevent withdrawal symptoms which arise when dopaminergic and
serotinergic transmission in the nucleus accumbens (NA) is reduced, affects the
development of dependence. To function normally, these individuals require opioid
administration resulting in compulsive drug taking with which there are significant costs
to society in terms of crime, social damage, loss of earnings and productivity (Weiss et
al., 1992; Parsons et al., 1995). Ward (1999) implied that dependence can be diagnosed
if an individual persists in their use of a drug in spite of damages to health, law, social
achievements and personal relationships. Various schemes are available to aid in the
identification of individuals displaying physical dependence, most commonly based on
recommendation of the WHO in the UK or the DSM-IV (Diagnostic and Statistical
Manual of Mental Disorders) as used in the USA.
Upon initial heroin injection the drug rapidly occupies ORs to produce its effects, yet
repeated administration causes a reduction in the drug’s potency or efficacy due to
depleted expression of these receptors (physiological tolerance). Alternatively, as
suggested by Borgland and colleagues (2003), the ORs may become internalised -
consequently, receptor expression is reduced. The effect is often not apparent during
analysis because radiotracers used in these studies are not specific to surface ORs thus
they can label internalised structures, causing the overall expression of ORs to appear
relatively consistent.
Increased doses are required to reproduce the effects previously acquired with lower
concentrations; a threshold is associated with tolerance to drugs, which deviates
between individuals. When doses are below this level withdrawal symptoms may arise,
including nausea, anxiety, tremors and dissipation of the euphoric ‘high’ (Drummer and
Odell, 2001; Scimeca et al., 2000). Conversely, if concentrations exceed the threshold
too rapidly or by too much, the effects of an overdose are displayed. When at the
threshold, cognitive and motor functions are normal, making it difficult to determine if
those persons are abusing opioids (Dole et al., 1966). Therapy for opioid dependence is

47
therefore based on achieving a stable and continuous brain opioid receptor occupation to
prevent heroin binding, consequently avoiding the unwanted effects like craving;
allowing patients to gradually return to a normal lifestyle (Scimeca et al., 2000).
1.6 Methadone
1.6.1 Methadone: a brief history
Methadone - (±)-6-dimethylamino-4,4-diphenylheptan-3-one – figure 1.12c) was first
produced in Germany in the late 1930s as an alternative analgesic to morphine (figure
1.12b); despite possessing a very different chemical structure, it binds the same
receptors (Bernard et al., 2007). Three decades later, in the 1960s, after the diligent
research of Dole and Nyswander (1966), it was identified as the only viable synthetic
opioid which could be substituted for abused heroin due to its low side effect expression
and long half-life – criteria for treatment of opioid dependencies. At the time the
primary use of methadone was in treating chronic cancer pain, but this research
pioneered it as a maintenance treatment. Unlike heroin, its rapid absorption by the oral
route and slow breakdown is favourable for use in therapy. The drug is now employed
worldwide. In Scotland, its use as a controlled and allegedly safe heroin substitute was
not realised until the 1980s (SACDM, 2007) and its use has become increasingly
controversial. Some countries, including Germany, have limited methadone use opting
instead for shorter acting (half-life of 4h) dihydrocodeine (Krausz, 1998).
It is a basic and lipophilic (fat soluble) drug that is mainly ionised at physiological pH
(it has an ionisation constant, or pKa, of 9.0) and is primarily stored in the liver but
quickly and widely distributed throughout tissues (Garrido, 1999). Like heroin
metabolites, methadone binds µ, δ and κ ORs which induce the release of intracellular
messengers necessary to create the associated pharmacological effects; many of these
are shared by the opioid agonists e.g. analgesia. The binding of methadone to ORs
prevents the attachment of heroin – the absence of its associated euphoric effects upon
administration should therefore lead to a cessation of heroin use. Due to its longer half-
life, the presence of methadone in the body outlives that of the abused drug. However
some studies have disputed this mechanism of action, arguing that there is no significant

48
alteration in the availability of receptors when methadone is administered (Melichar et
al., 2005). They suggested that as methadone is a high-efficacy agonist, the number of
receptors required to exert its effect may be so low that it was undetectable using the
techniques available.
1.6.2 Methadone therapy: its usefulness and dosing schedule
The primary goal of the administration of the synthetic opioid methadone is to prevent
abstinence syndromes. Blake and colleagues (1997) reported that it has a higher affinity
constant (Ki 3.56nM±0.2) for µORs – the primary site of action - than that of other
opioids like morphine (Ki 1.41nM±0.11). Methadone normalises the hormonal
disruptions often existing in heroin addicts, preventing the onset of euphoric effects and
reducing narcotic cravings associated with heroin use (Vetulani, 2001). It does not
allow rapid abstinence from all drugs and therefore does not represent a cure (Housová,
2005). Nonetheless, the ability to orally administer the drug in a single daily dose
(syrup and tablet forms) is advantageous as is its long duration of action (24-36 hours –
compared to 2-3 hours for heroin) which prevents the onset of withdrawal symptoms for
long periods of time (Fainsinger et al., 1993). Methadone is useful because it has cross-
tolerance with other opioids, enabling it to be substituted for abused drugs such as
heroin and morphine. By binding the same receptors, the inhibition of DA release by
GABA is prevented, similar to the effects of morphine described in section 1.5.2. DA is
increasingly released from the ventral tegmental area and binding of the drug at ORs in
the nucleus accumbens and prefrontal cortex is associated with the acute reinforcing
effects common to heroin use. Their structural differences (refer to figure 1.12, section
1.6.1) may explain the inability of methadone to induce euphoric effects like heroin,
despite being an agonist for the same receptor – they may become bound differently.
An additional advantageous property of the drug is that it acts as an antagonist at
NMDA receptors therefore reducing characteristics associated with the major excitatory
neurotransmitter glutamate, for example anxiety.
Dole et al., (1966) reported that a 100mg dose of methadone can block the effects of
80mg i.v. administered heroin. It is not surprising more methadone is required than
heroin as the latter is injected directly into the blood and the Vd of methadone is much
higher than that of morphine with only 1% reported to be present in the blood (Morley

49
and Makin, 1998). Therefore, in order to account for its loss, methadone must be
administered in much greater doses to achieve the therapeutic plasma levels required.
According to Eap et al. (2000), a 150-600ng/mL serum methadone level (SML) is
necessitated to suppress opioid craving and a trough level ≥400ng/mL required for
maintenance (to ensure sufficient blockade). Reinforcing effects of shorter acting
heroin like euphoria are avoided although there is an increased possibility of methadone
accumulation upon repeated dosing due to its long half-life (Dole et al., 1966; Kreek,
1992). Four or five half-lives usually pass before the elimination and amount of drug in
the body are balanced (attain a steady-state SML). Considerable inter-individual
variability in the PKs and PDs of methadone exist, as is the case for many drugs. Hanna
and colleagues (2005) indicated that interindividual variability in methadone PK
parameters was up to 8-fold greater than that exhibited intraindividually. Due to this
variability in factors including metabolism, distribution, enantiomer selectivity, passage
through BBB and binding to plasma proteins; the level of drug may differ and therefore
adjustments must be made to the dose of orally administered methadone if the
therapeutic concentration is to be attained. Defining a threshold plasma trough level
capable of achieving the desired response is therefore difficult (Loimer and Schmid,
1992).
The response to a drug is directly correlated with the length of time the active form is in
the body. Methadone is ‘foreign’ to the body (a xenobiotic) and is therefore
metabolised in the liver by chemical reactions into more easily eliminated molecules.
The primary metabolic pathway is sequential N-demethylation and cyclisation to
inactive EDDP (2-ethylidene-1,5-dimethyl-3,3-diphenylpyrrolidine) chiefly involving
liver cytochrome P450 (CYP450) enzymes, especially CYP3A4. The activity of these
inducible enzymes affects the rate of methadone clearance from the body and varies
between individuals due to genetic, environmental and/or disease-related factors. It
follows that if the specific enzymes are absent or incorrectly expressed, methadone
cannot be metabolised effectively. Drugs, or other agents, that induce or inhibit the
activity of CYP450 enzymes – especially that of CYP3A4 – can thereby alter the PKs of
methadone. Inducers including the anticonvulsant phenobarbital and the antibiotic
rifampicin accelerate methadone metabolism, increase its rate of clearance, lower the
SML, and potentially precipitate a withdrawal syndrome because insufficient drug
reaches and blocks the ORs. Conversely, inhibitors e.g. SSRIs (sertraline etc), SNRIs
(venlafaxine etc) and HIV drugs (ritinovir, zidovudine) slow metabolism, raising the

50
SML, leading to accumulation which may cause methadone-related toxicity with
oversedation and/or respiratory depression (Leavitt et al., 2000; Wolff et al., 2000).
The interaction between alcohol consumption and methadone efficacy is one of great
concern. It has been reported that the drugs act in a reciprocal manner thereby
enhancing their metabolism. Patients in a study undertaken by Wolff et al. (1991)
indicated that those with the lowest methadone concentrations also had long histories of
alcohol abuse.
The long half-life, although variable between individuals, requires patients to follow a
dosing schedule where the methadone concentration is titrated over a period of 10-14
days upon administration of the initial dose. During this stage, patients must be
monitored closely as it is associated with the greatest risk of overdose and subsequent
death. Doses ought to be kept low because methadone slowly accumulates in the tissues
potentially causing toxicity during concurrent use of additional illicit opioids. Many
patients continue unsanctioned use of heroin and other CNS depressants to combat
withdrawal symptoms like abdominal cramps and diarrhoea, arising due to the low
methadone doses. Wolff and colleagues (1991) reported that plasma methadone
concentration is directly related to the dose of methadone administered. Once the levels
between tissue storage sites and the blood have equilibrated, a maintenance dose is
administered over the remainder of therapy to prevent relapses; methadone is slowly
released from tissues therefore the SML remains fairly constant (Krambeer et al., 2001;
Borg and Kreek, 2003). Small reductions are made when the individual decides to
attempt a future of abstinence. Again, monitoring patients is vital, any dramatic drop in
methadone concentration may lead to a life-threatening relapse - their tolerance to the
illicit drug is commonly reduced therefore toxicity could arise at lower doses than those
administered prior to therapy. Studies have indicated that the risk of death when using
opioids is 3-4 fold lower when undergoing MMT however it is considerably higher than
in the drug free population (Caplehorn et al., 1996).
Guidelines issued in 1991 by the UK Department of Health indicated methadone
prescribing was to be increasingly offered as a long-term treatment than previously
reported when short-term treatment with subsequent detoxification was encouraged.
Support was provided by the recently updated ‘Orange’ Guidelines issued in 2007
(Department of Health, 1999 update 2007b).

51
It is unusual for the initial loading dose administered to patients to be greater than 60mg
per day; between 35-100% (80% average) of a single, orally administered, methadone
dose will pass into the bloodstream and can be detected there after 15-45 minutes.
Therefore, if a patient vomits shortly after ingesting the dose there is uncertainty as to
the extent of absorption; it takes 20-30 minutes for the drug to be fully absorbed.
Similarly, if within the first few days there is strong evidence of withdrawal, doses may
be increased if there is a low risk of abusing other substances. Little is known about the
relationship between dose, brain levels and receptor occupation despite its widespread
use for three decades.
McCarthy and colleagues (2000) demonstrated that when a group of mothers
undergoing MMT consumed between 25 and 180mg of methadone per day, the level
consumed by the infant was approximately 0.05mg/day if ingesting 475mL of breast
milk a day. When a patients’ dose of methadone is greater than 20mg/day, the
American Academy of Paediatrics recommend that nursing should not be undertaken.
Continuing on MMT is however associated with a number of positive qualities – it is
thought to better prepare a mother for parenting and has been shown to improve
obstetrical care compliance (Finnegan, 1991).
Recently, a report compiled by McKeganey (2006), concluded that giving methadone to
heroin addicts has a 3% success rate (97% failed to remain free of all drugs, including
that used in treatment), which was barely better than those attempting abstinence
without any treatment. Subsequent to findings like these, there is a greater demand for
alternatives, such as the opioid dihydrocodeine (DHC – refer to chapter 4), and
increased availability of residential rehabilitation; only 2% of Scotland’s drug users
have adequate access to residential rehabilitation systems (Hay et al., 2005). Their
research did however highlight the social benefits of remaining in therapy; individuals
were 7 times less likely to commit crime and more likely (59%) to be in employment or
education compared to addicts. Despite the study relying on the honesty of the 695
drug users interviewed, it supports previous findings that, regardless of high relapse
rates, methadone is effective in improving the patients’ quality of life (Marsch, 1998).

52
1.6.3 Methadone has two forms administered during therapy.
In the UK methadone is commonly prescribed as a 50:50 racemic mixture of two
enantiomers (molecules which share a common chemical composition but differ in their
special arrangements); (R)-(-)-methadone and (S)-(+)-methadone, or levo- (l) and
dextro- (d) respectively, which differ in their activity. The (R)-enantiomer has
reportedly ten times higher affinity for µORs than morphine (Kristensen et al., 1995)
and is 50 times more potent as an analgesic than the (S)-enantiomer thus it accounts for
most, if not all, the opioid pharmacological activity (Boulton and Devane, 2000; Eap et
al., 2002). There are a number of effects known to arise from the use of the racemic
mixture including miosis (pinpoint pupils), antidiuresis, respiratory depression and
analgesia.
Hallinan et al. (2006) performed research with MMT patients classified as ‘responders’
and ‘non-responders’, based on initial urine toxicological analysis. They reported that
the optimal therapeutic daily dose in the patients was 100mg/day requiring (R)-
methadone concentrations of 200ng/mL and (R,S)-methadone of 400ng/mL, thus using
the R-enantiomer alone is more effective at suppressing withdrawal than the racemate.
The use of S-(+)-methadone alone was shown to be ineffective at preventing withdrawal
symptoms. Although certain patients require only a low dose of methadone in therapy,
controlled studies have indicated that a dose-response relationship exists for methadone
up to 80-100mg/day (Capelhorn et al., 1993; Strain et al., 1999). Thus, the higher the
dose, the better the response i.e. less likely the patient is to enter withdrawal and
relapse.
1.6.4 Minimal effective concentration and the role of AGP
The ability of a drug to confer a desired therapeutic effect is primarily dependent upon
attainment of a certain concentration at its site of action - the minimal effective
concentration, MEC. For the majority of drugs, this is accessed via the bloodstream and
according to the free drug hypothesis, only free drug is capable of executing the
associated effect. There are a number of mechanisms postulated to cause methadone
resistance, however often overlooked is the interaction formed with plasma proteins,

53
such as α-1-acid glycoprotein (AGP), potentially rendering it inactive and reducing the
concentration of drug to below the MEC at the target site.
Like many drugs, methadone binds to proteins in the plasma, lung, liver, kidney and
spleen but as it is a basic drug, it is most strongly associated with AGP (Romach et al.
1981). Methadone binds the APP with an association constant of ~4x10⁵M
-1.
Therefore, alterations in the concentration of the APP, like the increase reported by
Rostami-Hodjegan et al. (1999) in heroin-dependent individuals with signs of opiate
withdrawal, are likely to affect the level of unbound active drug and subsequently its
ability to enforce the desired pharmacological response. In fact research by Olsen
(1973) suggested that the affinity of methadone for AGP is stereoselective; greater
affinity was recorded for the S-enantiomer (90% bound) than the R-form (86%), this
was subsequently supported by Romach et al. (1981). Thus, such high binding and
enantiomeric preference may explain, to some extent, why large doses (mg level) are
required to provide a low (ng) therapeutic plasma level. Eap and colleagues (1988)
suggested that in order to determine what concentrations of methadone are
therapeutically useful; analysis of the enantiomers could be more valuable than total
methadone.
It is not only enantiomeric selectivity that must be considered; methadone possesses a
degree of selectivity for specific genetic variants of AGP. Therefore if the expression of
the AGP-B/ B gene products (ORM2 A) - the genetic variant for which methadone has
the greatest affinity - is increased, the active concentration of methadone decreases.
Additionally, the free level of other drugs which do not bind this glycoprotein variant
will increase, generating an elevated risk of toxicity from their presence alongside the
onset of withdrawal from the reduction of free methadone (Marsch, 1998). Once the
AGP level stabilises, the drug concentration will follow suit.
If binding is enhanced and the plasma levels are insufficient to reach the MEC, an
increase in GABA release and activation of NMDA receptors causes enhanced craving
and withdrawal symptoms including anxiety. An increase in the dose administered may
compensate for binding but increases the risk of toxicity.
A number of drugs have been shown to displace methadone from its binding sites on
AGP including propranolol and chlorpromazine. An elevation in the free plasma

54
concentration of methadone would arise if the drugs were taken simultaneously thus
increasing the possibility of achieving toxic concentrations (Abramson, 1982).
Although studies have acknowledged the ability of AGP to bind methadone, there is a
paucity of research analysing the effect of glycosylation on this function.
1.6.5 Methadone therapy is not without its problems
As alluded to previously when discussing the extent of methadone use in the UK, it is
not a cure for opioid dependence and a number of contraindications have been
identified. The main concern regarding the use of methadone in the treatment of pain is
the risk of delayed toxicity due to its long and unpredictable half-life (Manfredi et al.,
2001). Essentially, the adverse effects of methadone compare to those for other opioid
analgesics for example nausea, vomiting, miosis, constipation, respiratory depression
and possibly comas. Upon long-term use – after accumulation and stabilisation -
individuals usually develop tolerance to most of these effects (Scimeca et al., 2000).
However they are likely to develop dependence on the opioid, becoming hesitant to
reduce their dose and risk the onset of withdrawal symptoms which are reportedly
worse than those for heroin. This was clear in a study by Manfredi and colleagues
(2001) describing patients who had been on the therapy for as long as 10 and 20 years.
Greatest risk of overdose to users therefore occurs in the first 10 days during titration as
the doses are kept low - additional unsanctioned use of opioids and other CNS
depressants often continues, potentially leading to toxicity. Deaths have been found to
occur mainly during sleep after peak blood concentration is attained, usually three to
four days after starting therapy where the risk of death is reportedly 6.7 fold greater than
when not in the program (Caplehorn and Drummer, 1999). During this stage, dosing
must allow for the accumulation of methadone and the additional use of CNS
depressants by patients in their attempt to prevent the onset of withdrawal. In almost all
deaths related to methadone, other CNS depressants are also present; the exacerbation
of respiratory depression is extremely hazardous. Risk decreases after stabilisation on
the therapy; it is nearly 98 times lower than in newly recruited patients (Karch and
Stephens, 2000).
In the decade 1985 - 1995, it was reported that almost 50% of all UK opioid deaths were
related to methadone use however whether the patients were stabilised on the therapy at

55
the time is unknown (Hall and Mattick, 2007). Newcombe (1996) suggested that heroin
actually contributes to fewer deaths than methadone and therefore the substitute may not
be as protective as first assumed.
Therefore, it can be seen that in the ongoing search for improved treatments for opioid-
dependencies a firm understanding of the mechanisms influencing the efficacy of drugs
is being sought. A particular aspect – specifically the structure of AGP and its potential
affect on binding to, and therefore inactivation of, methadone - is the primary focus of
the research detailed herein.

56
1.7 Research Strategy
As a result of the APR, stimulated when certain pathological and physiological states
are expressed, the plasma concentration of a positive acute phase protein called AGP
can be elevated 2-5 fold. Increased synthesis of AGP has been reported in highly
stressed individuals and heroin users showing signs of withdrawal, ergo levels found in
patients undergoing replacement therapy for heroin dependencies ought to differ from
that of a ‘normal’ population.
Alongside overall plasma concentration, the glycosylation pattern of AGP has been
shown to differ in various conditions but has not been closely studied in patients
undergoing methadone therapy. Any alterations to the structure of a glycoprotein can
greatly affect its function. In the case of methadone, glycosylation changes expressed
by AGP could increase the binding affinity thereby reducing the level reaching the
target site and subsequently increasing the risk of withdrawal symptoms developing. If
binding significantly differed in treatment groups, the analyses of a patient’s AGP and
its binding to methadone may have potential in a clinical setting. Identifying
individuals who are less likely to respond to methadone replacement therapy and
therefore will require higher doses or perhaps an alternative substitute could, and
should, improve treatment retention and success.
Consequently, it was hypothesised that the level of AGP isolated from patients
undergoing therapy would be greater than that from a healthy population. Also, patients
were expected to express modified glycosylation for which methadone displays
increased affinity. Although patients receiving higher doses of drug would be expected
to express the greatest levels of AGP and glycans correlated with increased binding if
any were found, these generalisations do not account for the likelihood that the
methadone dose administered to patients newly recruited onto the program will be
lower than that received by patients at the maintenance stage. Dosing during titration
must reflect the ability of methadone to accumulate in vivo and the probability that the
patients themselves will administer additional opiates. Therefore, in terms of relating
methadone dose to AGP concentration it was expected that patients in long term therapy
receiving the greatest doses, would have an increased level of AGP and/or increased
affinity for the drug – more being inactivated by their AGP. Those in the titration phase

57
were expected to express high levels of AGP however the doses were unlikely to be
correlated.
1.7.1 Aims and Objectives
1.7.1.1 Aim:
The primary aim of this research was to determine whether alterations in the level and
glycosylation of AGP occurred in patients undergoing opioid replacement therapy when
compared to a ‘normal’ healthy population. Whether such alterations could contribute to
potential differences in the degree of binding was established.
Preliminary studies such as that presented within could offer use in determining the
likely success of the treatments for individuals; alternative treatment programmes could
be initiated immediately in those unlikely to respond well to methadone. It would
prevent starting a program which is unlikely to offer any benefit to the individuals.
1.7.1.2 Objectives:
Various stages were undertaken to test the hypotheses that the level and structure of
AGP in patients influenced its binding to methadone. Initial experiments were
performed with commercial AGP to ensure techniques were sound and offered controls.
Ethical permission was sought from both the NHS and Edinburgh Napier University.
Isolation and Purification of AGP from ‘normal’ (healthy individuals) blood - pooled by
the blood transfusion service - adopted a method which prevented desialylation and
denaturation i.e. structural integrity was not compromised and remained in the form
found in vivo, which was important to the study. The techniques were subsequently
used in the isolation and purification of AGP from the blood of consenting patients, and
from the serum of an additional ‘normal’ population.
To determine if the glycosylation of AGP differed between subject groups, the
monosaccharides and oligosaccharides were analysed. Quantitative data was generated
through monosaccharide compositional analysis by high pH-anion exchange

58
chromatography (HPAEC). Subsequent oligosaccharide indicated if there were any
changes in the branching of the glycan chains. The type of terminal sialic acid linkage
was determined by ELISA.
Methadone drug binding studies with commercial AGP, normal pooled blood and
patient blood were performed to determine if AGP isolated from certain patients
inactivated more drug. This was then compared to data obtained during structural
analysis to determine if there existed any correlations between AGP glycosylation and
drug binding. Another opioid – codeine - was used in similar studies with commercial
AGP to investigate whether binding occurred. Such studies provide an indication that
other drugs may offer a superior choice in terms of reduced or no plasma protein
binding, despite their use currently being more reserved than methadone. The study
only addressed binding to AGP and there were likely to be many other factors which
could render these alternatives less effective than methadone.
Overall, the project aspired to identify potential relationships between AGP
glycosylation and methadone binding in patient groups so that further studies may be
carried out with increased study populations.

59
Figure 1.13. Research Summary.
Blood from patients undergoing
opioid replacement therapy and
healthy individuals.
Low Pressure chromatography:
isolate and purify AGP
Ultrafiltration: removal of
contaminating salts
Glycan structural analysis Drug binding analysis
Acid
Hydrolysis
Enzyme
Hydrolysis
HPAEC:
Monosaccharide
components
HPAEC:
Oligosaccharide
branching
ELISA
Purity testing:
SDS-PAGE and W. Blot
SA
linkages
ISOLATED AGP

60
Chapter 2
Materials and Methods

61
2.1 Materials
2.1.1 Patient clinical samples
The Lothian NHS and Edinburgh Napier University Ethics committees approved the
initial study where ~5mL blood samples were obtained from patients (n=12) undergoing
various stages of treatment for opioid addictions at the Community Drug Problem
Service (CDPS) in Edinburgh. Treatment groups included those initially recruited in
the Titration phase (T), those attending the Harm Reduction scheme (HR), Long-term
methadone (LT), buprenorphine (B), dihydrocodeine (D) and heroin (H) patients. An
application to increase the study size and specificity by recruiting additional patients
from the T and LT phases was approved. A total of twenty-six patients were recruited
(table 2.1), mainly from LT maintenance therapy who were no longer required to attend
the clinic daily (n=11). Samples were collected in heparinised vacutainers (Becton
Dickinson, France) by a trained phlebotomist and PEG precipitated as described in the
Methods section 2.2.2.1, storing the supernatants at -20ºC until required. The primary
investigator discussed the study with the patients and only in the LT group was it
feasible to involve their mentor in the recruitment process (Dr. Malcolm Bruce –
collaborator). In future studies of a similar nature it would be useful to pursue this
additional interaction, potentially improving participant recruitment due to increased
trust between the care user and mentor. It would also standardise the recruitment
process however careful consideration is required; it was not feasible to request the
supervision of each individual’s mentor during this preliminary study due to constraints
on their time and perception that the investigators were most qualified to discuss the
study.
Professor David George of the Glasgow Western Infirmary donated ‘normal’ serum
samples; however upon analysis they were not deemed to offer a sound comparator as
little information was known about the source population other than they were obtained
from elderly cancer-free individuals. Therefore it could not be known whether other
factors could have initiated an acute phase response to alter AGP levels and
glycosylation. Instead, heparinised blood samples pooled from ‘normal’ healthy
individuals supplied by the Scottish National Blood Transfusion Service were
implemented throughout.

62
Patient number M/F Age Therapy group
JB 0608 01 F 32 T
JB 0608 02 F 23 T
JB 0608 03 F 37 HR
JB 0608 04 M 28 HR
JB 0608 05 F 23 HR
JB 0608 06 F 23 HR
JB 0608 07 M 35 LT
JB 0608 08 M 33 LT
JB 0608 09 M 38 B
JB 0608 10 F 36 LT
JB 0608 11 M 29 B
JB 0608 12 F 44 LT
JB 0509 01 F 37 T
JB 0509 02 M 30 B
JB 0509 03 M 30 LT
JB 0509 04 M 51 LT
JB 0509 05 M 33 T
JB 0509 06 M 20 T
JB 0509 07 M 39 D
JB 0509 08 M 30 B
JB 0509 09 M 34 LT
JB 0509 10 M 42 LT
JB 0509 11 M 34 LT
JB 0509 12 M 31 LT
JB 0509 13 M * H
JB 0509 14 M 30 LT
Table 2.1 Patient Demographics.
T - Titration phase with Methadone; HR - Harm reduction program Methadone
LT – Long-term Methadone; B – Buprenorphine; D – Dihydrocodeine; H – Pure
Heroin
* Data regarding specific age was unavailable

63
2.1.2 AGP isolation
Glacial acetic acid, polyethylene glycol (PEG) 3350, potassium chloride, potassium
thiocyanate, Reactive Blue 2 Sepharose (Cibacron Blue 3GA), Red Sepharose CL-6B,
sodium acetate, sodium azide, sodium chloride and Trizma base were supplied by
Sigma-Aldrich
(Poole, UK). Ethanol was purchased from Bamford Laboratories Ltd.,
(Norden Rochdale, UK); diluted to give a 10% (v/v) solution. HPLC-grade water was
obtained from Rathburn Chemicals Ltd (Walkerburn, UK). The poly prep disposable
10mL columns were purchased from Bio-Rad, (Hemel Hempstead, UK). To load
buffers and sample supernatants, a Pharmacia LKB Pump P-1 was used and the
absorbance of the mobile phase was measured by a single path optical UV-1 monitor
and control unit (all from Pharmacia, UK). The changing absorbance at 280nm was
recorded by a Servogor 120 chart recorder, also from Pharmacia. Blood samples were
initially spun in an Eppendorf Centrifuge 5415C and all eluted samples concentrated
using a Christ RVC 2-18 Concentrator (SciQuip Ltd, Shrewsbury, UK).
2.1.3 De-salting
HPLC grade water was purchased from Rathburn Chemicals Ltd (Walkerburn,
Scotland, UK) and Centricon YM-10 Centrifugal filter devices with a dialysis
membrane MW cut off 12,000-14,000Da were obtained from Millipore (UK) Ltd.
(Hertfordshire, UK). The company then replaced these with Amicon Ultra-4 centrifugal
filter devices with a MW cut off of 10,000. An MSE Centaur 2 (large scale) was used
to spin the samples. The Christ RVC 2-18 Concentrator was purchased from SciQuip
Ltd (Shrewsbury, UK).
2.1.4 Determination of AGP level in blood
Calibration curves were produced using Commercial AGP obtained from Sigma-
Aldrich
(Poole, UK) and HPLC grade water from Rathburn Chemicals Ltd.
(Walkerburn, UK). Absorbance was read on a BioMate 3 spectrophotometer purchased
from Thermo Fisher Scientific
(Loughborough, UK).

64
2.1.5 SDS-gel and Western Blot
The production and staining of the gel required glacial acetic acid, glycine, methanol,
TEMED, Tris-base, and SDS purchased from Sigma-Aldrich
(Poole, UK), along with
commercial AGP controls. A gel casting system VS10CBS was obtained from
Geneflow (Staffordshire, UK). Bromophenol blue, Dithiothreitol, sodium chloride and
Na2 EDTA were purchased from New England Biolabs® Inc (Hertfordshire., UK). For
the Western Blot the nitorocellulose membrane and filter paper were obtained from
Whatman International Ltd., (UK). Bio-Rad Laboratories (Hemel Hempstead, UK)
supplied the non-fat dry milk and Promega (Hampshire, UK) the NBT and BCIP (with
dimethylformamide). The primary antibody (anti-AGP antiserum, rabbit) and secondary
antibody (goat anti-rabbit IgG, AP-linked) was purchased from New England Biolabs®
Inc. (Hertfordshire., UK). Tween®20 was purchased from Sigma-Aldrich
(Poole, UK).
The omniPAGE gel casting system (VS10CBS) was purchased from Geneflow (UK).
2.1.6 High pH anion Exchange Chromatography
2.1.6.1 Monosaccharide Analysis
Monosaccharide standards: 2-deoxy-D-galactose, fucose, galactose, glucosamine,
mannose; along with the commercial AGP, 2mL hydrolysis reaction vials, aluminium
lined screw caps, Dowex®-50WX8 cation exchange resin (hydrogen form, 12% cross
linked, dry mesh 50-100) and constant boiling HCl were supplied by Sigma-Aldrich
(Poole, UK). HPLC grade trifluoroacetic acid (TFA) was supplied by Thermo Fisher
Scientific
(Loughborough, UK). Rathburn Chemicals Ltd. (Walkerburn, UK) supplied
the HPLC-grade water and the 50% w/v sodium hydroxide was supplied by VWR
International
Ltd, (Lutterworth, UK). The solutions were sparged and pressurised with
helium using a Dionex Degas module. To perform HPAEC (High performance anion
exchange chromatography) a CarboPacTM
PA-100 analytical (4x250mm) column and
guard column (4x50mm), were used on a Dionex 600TM
system with pulsed
electrochemical detection (PAD) (Dionex, Camberley, UK). PeakNetTM
software run on
a Dell OptiPlex GX110 computer controlled the GP50 gradient pump and ED40
electrochemical detector (Dionex, Camberley, UK).

65
2.1.6.2 Oligosaccharide Analysis
New England Biolabs
Inc., (Hertfordshire, UK) provided the Peptide-N-Glycosidase F
(PNGase F) purified from Flavobacterium meningosepticum, 10% NP-40 and NE
Buffer G7. HPLC-grade water was purchased from Rathburn Chemicals Ltd.
(Walkerburn, UK). Ethanol was obtained from Bamford Laboratories Ltd. (Rochdale,
UK) and the AGP N-linked glycan library from Prozyme®
(Europa Bioproducts Ltd.
Cambridgeshire, UK). Sigma-Aldrich
(Poole, UK) supplied the Sodium Acetate and
the 50% w/v NaOH 50 by VWR International
Ltd (Lutterworth, UK). A CarboPacTM
PA-100 analytical column (4x250mm) and guard column (4x50mm) were used on a
Dionex 500TM
system with GP50 gradient pump, ED40 electrochemical and pulsed
electrochemical detection to carry out HPAEC (Dionex, Camberley, UK). Samples
were analysed using PeakNetTM
software on a Vtech 486X25 computer (Viglen, UK).
2.1.7 Determination of SA content (ELISA)
GALAB (Geesthacht, Germany) supplied the sialic acid linkage determination kit
consisting of 96-well microplates, α2,3-sialic acid and α2,6-sialic acid lectin conjugates
(<0.1% sodium azide), an enzyme conjugate, substrate, inhibition control, assay buffer
(20x concentrated Tris buffered saline, pH8.0 – 20% Tris aminomethane, 8% Tris
aminomethane, 0.1% sodium azide), detergent (Assay Buffer Additive), detection buffer
(>10% diethanolamine) and equilibration buffer (2x concentrate tris buffered saline, pH
8.0 - >2% Tris aminomethane (hydrochloride), 1% Tris aminomethane, 0.1% sodium
azide). Commercial AGP was purchased from Sigma-Aldrich
(Poole, UK). Analysis
was performed using a microtitre plate reader from Dynex Technologies (Sussex, UK).
2.1.8 Drug binding
(±)-methadone, theophylline, Dulbecco’s phosphate buffered saline and dimethyl
sulphoxide were supplied by Sigma-Aldrich
(Poole, UK). Rathburn Chemicals Ltd
supplied the HPLC-grade water (Walkerburn, UK). 96-well microtitre plates were
purchased from Nunc (Germany). A BMG Labtech Optima fluorimeter (Germany) was
used to analyse the intrinsic fluorescence of samples.

66
2.2 Methods
2.2.1 Clinical Samples
A trained phlebotomist obtained 2-5mL blood samples from patients undergoing
methadone therapy, after informed consent from volunteers over the age of 18 was
acquired. All samples were completely anonymised. Initial methodology development
was carried out using commercial AGP from Sigma-Aldrich
and pooled heparinised
‘normal’ blood (blood transfusion service).
2.2.2 Isolation and determination of the level of AGP
Protocols similar to that reported by Elliott et al. (1997) were implemented in the study.
The method was first published in 1994 (Smith and colleagues) however certain aspects
have been altered over time to allow for reduced sample volumes.
2.2.2.1 Polyethylene Glycol Precipitation
Prior to determining the level of AGP in each patient and normal sample, the blood was
separated into 1mL aliquots and protein precipitation performed by mixing with 40%
(w/v) PEG 3350 (0.4g/1mL sample). They were incubated at 4°C overnight followed
by a 30 minute centrifugation at 14,000 rpm. Centrifugation was repeated if remnants
of the red blood cells were detected. The supernatant was collected in new eppendorfs
and stored at -20°C until required for purification, the pellet was discarded.
2.2.2.2 Low Pressure Chromatography
The AGP present in the supernatant of each sample was isolated and purified through
the use of two low-pressure chromatography columns, implementing dye ligand
chromatography. Two 10mL Bio-Rad poly-prep disposable columns were used; one
filled with ~5mL of Cibacron Blue 3GA Sepharose resin (binds and removes human
serum albumin, HSA) and the second with Red Sepharose CL-6B (to remove remaining

67
α1-anti-trypsin, AAT). The resin slurries were kept wet at all times to ensure no air
bubbles became trapped within the column, causing resin splitting which would affect
the separation of plasma proteins. Buffers required in the low pressure affinity
chromatography protocol were prepared according to table 2.2 and utilised when
necessary.
Initially, the appropriate elution buffer was pumped through the Cibacron Blue 3GA
Sepharose column at a rate of 0.5mLmin-1
, using a Pharmacia LKB Pump P-1, until
equilibration was attained. This was illustrated on the Servogar 120 chart recorder,
running at 12cm/hour, as a ‘flat’ base-line; recording the change in the eluent
absorbance at 280nm, as measured by a UV-1
single path monitor optical unit. The
supernatant formed upon PEG 3350 precipitation of a blood sample was applied to the
column. Elution buffer was applied simultaneously and the eluted sample represented
by the first peak generated by the chart recorder was collected in 15mL centrifuge tubes;
this fraction contained AGP. HSA was removed from the mobile phase – its bilirubin
binding sites becoming bound to the Cibacron Blue. The eluted fraction was then
concentrated to approximately 2mL in a rotary evaporator.
Once entirely collected, the column was regenerated by adding the desorption buffer to
dislodge the HSA bound to the column. It was re-equilibrated using elution buffer to
prepare it for the addition of subsequent samples. All samples were dried under a
vacuum to approximately 2mL ready for loading onto the Red Sepharose CL-6B
column.
After equilibration of the Red Sepharose column with its elution buffer (table 2.2), a
concentrated sample from the Cibacron Blue column was applied and further elution
buffer used to collect the AGP fraction. The eluted AGP peak, the first distinguished by
the chart recorder, was collected in 15mL centrifuge tubes. Any bound AAT was
finally removed upon addition of the cleaning buffer (table 2.2). The pure AGP-
containing fractions were again dried to 2mL in the rotary evaporator prior to desalting.
In order to prevent bacterial growth and the columns drying out after use, 10% Ethanol
was added to each column and stored at 4°C.

68
Column Buffer Reagents
Cibacron Blue 3GA
Sepharose
Elution 0.1mM Potassium Chloride
0.02% Sodium Azide
50mM Trizma
pH 7
(albumin binds to column)
Desorption 0.1mM Potassium chloride
500mM Potassium thiocyanate
0.02% Sodium Azide
50mM Trizma
pH7
(removes bound albumin)
Red Sepharose CL-6B
Column
Elution 1.15% Glacial Acetic Acid
30mM Sodium Acetate,
pH 5.7
(α1-antitrypsin binds column)
Cleaning Buffer 30mM Sodium Acetate
1M Sodium Chloride
Table 2.2. Isolation buffers for low pressure chromatography.

69
2.2.3 De-salting
Salt introduced during isolation was removed from samples T1, T2, HR1 and LT1 using
individual centricon® centrifugal cartridges to prevent contamination. Three drops of
HPLC grade water were used to moisten the membrane. Concentrated sample (~2mL)
collected after isolation was added and, by centrifugation at 4,000 rpm, any salts
introduced during low-pressure chromatography, were removed by filtering through the
membrane (MW cut-off 10,000). Once the salt solution passed through the membrane,
the sample was washed with HPLC grade water until the filtered solution was clear. To
collect the dry desalted AGP sample on the membrane, the cartridges were inverted and
three drops of HPLC-grade water added. The samples were collected in fresh
eppendorfs, dried to completion under a vacuum, and reconstituted in 1mL HPLC grade
water to allow the level of AGP to be determined.
The remaining samples were desalted using Amicon filter devices due to a design
modification made by the company (Millipore, UK). The 2mL sample from the
isolating stage was added to the cartridge and made up to approximately 3.5mL using
HPLC-grade water. The dissolved salt passed through the membrane (MW 10,000 cut-
off) and the sample was washed several times with HPLC-grade water. Desalted
samples collected in the tube were reconstituted in approximately 500µL HPLC-grade
water and added to new eppendorfs; they did not require inversion like the previous
design. These were then dried and reconstituted as above.
2.2.4 AGP level determination
Using the samples re-constituted in 1mL HPLC-grade water, the level of isolated AGP
was determined using a spectrophotometer. Reference was made to a Standard curve
produced using the absorbance values at 280nm of a series of dilutions of commercial
AGP standards in HPLC-grade water (0mg/mL to 3mg/mL) – refer to section 5.2.3.
This wavelength is often chosen in the determination of protein levels because proteins
absorb strongly while other substances commonly in protein solutions do not. A 1mL
quartz cuvette with pathlength of 1cm and an extinction coefficient of 29.7 mM-1
cm-1
was used in spectrophotometric determination.

70
2.2.5 SDS-gel and Western Blot
2.2.5.1 Discontinuous SDS-PAGE
To determine whether the isolation and purification procedures were effective, sodium
dodecyl sulphate – polyacrylamide gel electrophoresis (SDS-PAGE) was performed.
Separation of proteins present in the supernatant of a PEG precipitated blood sample
and those present after the isolation process was performed alongside commercial
controls and a ladder; based on their size and molecular weight. This was not used to
isolate AGP because SDS is an anionic detergent which can damage sugar structures
and would therefore be detrimental in the analysis of glycoproteins. When SDS is
added to a sample of protein and heated to 100oC the protein becomes denatured into
separate polypeptides and a negative charge is generated when they become bound to
SDS, the size of this is dependent on the length of peptide.
The large pore polyacrylamide ‘stacking’ gel - approximately 2pH units lower than the
electrophoresis buffer – was cast over a small pour acrylamide ‘resolving’ gel to
produce a discontinuous buffer system; their preparation is described below. SDS-
bound proteins become concentrated in the stacking gel ready to migrate into the
resolving gel to allow separation based upon size.
2.2.5.2 Resolving gel preparation
Spacers of 2mm and a 2mm, 12-well comb were used to set up the omniPAGE gel
casting system (VS10CBS) and allowed 10cm vertical separations to be performed.
Acrylamide resolving gels (10% w/v) were used because the molecular weight of AGP
is ~43kDa and this gel has a resolution of ~20-75kDa, therefore it is capable of
resolving proteins including albumin and AAT (MW 67kDa and 52kDa respectively).
The gel consisted of the components as stated in table 2.3; all components were added
in the order stated. A final addition of 7.5µl of N,N,N’,N’-tetramethylethyenediamine
(TEMED, >99% pure) allowed polymerisation of the gel components, this was
catalysed by the addition of the oxidising agent APS. To ensure no bubbles formed, the
mixture was carefully mixed before loading between the two glass plates. A 3cm space
was left above the gel and 1mL isopropranol layered on to reduce the gels contact with
71
air and ensure an even surface was formed. This layer was then decanted after a 30min
polymerisation and the top of the gel was rinsed with distilled water and filter paper
used to blot it dry.
2.2.5.3 Stacking gel preparation
On the addition of 6.7µl of TEMED (>99% pure) to the stacking gel components in
table 2.4, the mixture was poured on top of the resolving gel. A comb was inserted and
the gel was left at room temperature for 30min while the gel polymerised. Upon setting,
the comb was removed and the gel rinsed with Tris-glycine electrophoresis buffer (table
2.5) to remove un-polymerised material.
The gel was transferred from the casting chamber into an electrophoresis tank and
submerged in Tris-glycine electrophoresis buffer. The samples and ladder were heat
denatured for 5 min at 100oC and up to 25µl loaded into appropriate wells. The
molecules were concentrated in the stacking gel over 15 min at 50V then separated in
the resolving gel at 100V for a further 50 min.
2.2.5.4 Protein gel staining
When the dye had run the length of the gel, it was carefully separated from the plates
and any electrophoresis buffer was removed through two 10 min washes with distilled
water on a slow rotating platform (50rpm). The gel was immersed in 5x volume of
Coomassie blue protein stain (table 2.6) and put back on the rotating platform (50rpm)
for 1h. The stain was decanted and the gel was de-stained over 6-8h with the solution
recorded in table 2.7, changing the de-staining solution 3-4 times. The gel was then
visualised.

72
10% Resolving gel 1 x 10cm gel
Distilled water
30% (w/v) Stock acrylamide
4x Resolving tris solution pH 8.8*
10% (w/v) Ammonium persulphate
3.15mL
2.5mL
1.875mL
75μL
Table 2.3. Composition of the 10% (w/v) resolving gel for SDS-PAGE.
The APS was always added last. * (1.5M Tris-HCl; 0.4% (w/v) SDS).
Stacking gel 1 x 10cm gel
Distilled water
30% (w/v) Stock acrylamide
4x Stacking tris solution pH 6.8*
10% (w/v) Ammonium persulphate
2.1mL
0.325mL
0.8mL
3.35μL
Table 2.4. Composition of the stacking gel. The APS was always added last. * (0.5M Tris-HCl; 0.4% (w/v) SDS).
Reagents 1 x 10cm gel
Tris-base
Glycine pH 8.3
SDS
5mM
50mM
0.02% (w/v)
Table 2.5. Composition of Tris-glycine electrophoresis buffer.
Table 2.6. Composition of the coomassie blue protein stain.
Reagents Percentage present
Methanol
Distilled water
Glacial acetic acid
45% (v/v)
45% (v/v)
10% (v/v)
Table 2.7. Composition of de-staining solution.
Reagents Percentage present in stain
Coomassie brilliant blue R250
Methanol
Distilled water
Glacial acetic acid
0.25% (w/v)
45% (v/v)
45% (v/v)
10% (v/v)
73
2.2.6 Western Blotting
2.2.6.1 Blot sandwich assembly
Filter paper – 2mm thick – and nitrocellulose membrane (0.2 µm, Optiran BA-S 83)
were cut to fit the gel and pre-soaked in 1x continuous transfer buffer (CTB, table 2.8)
for 15 min, alongside two fibre pads.
The blot sandwich was assembled using forceps with the gel facing the negative pole.
Some pre-chilled CTB was poured into the tank and a magnetic stirrer added. The
module containing the blot sandwich was inserted and the tank placed in a polystyrene
container of ice. The remainder of the cooled CTB was placed in the electrophoresis
tank and the blot run at 75V for 100 min with a magnetic stirrer keeping the cool CTB
circulating.
2.2.6.2 Blocking of the membrane (reduction of non-specific binding)
To saturate the unbound sites in the nitrocellulose membrane the blot was incubated in
50ml 3% (w/v) non-fat dry milk in 1x Tris-buffered saline (table 2.9) for 1.5 h at room
temperature. The blot and solution were placed on a rotating platform (50 rpm).
2.2.6.3 Immunoprobing with primary antibody
Primary anti-AGP antibody (5μl) from the rabbit was added directly into the blocking
solution (1:2,500 dilution). It was then incubated for 30 min at room temperature on a
rotating platform (50 rpm) to allow the antibody to mix, and then incubated overnight at
4oC to bind. Any unbound primary antibody was removed by washing the membrane in
1x TBS/0.1% (v/v) Tween®20 for 6x 10 min washes.
2.2.6.4 Immunoprobing with secondary antibody
A 3μl volume of the secondary antibody (goat anti-rabbit IgG, AP-linked) was added
into 50ml 3% (w/v) non-fat dry milk in 1x TBS (a 1:16,667 dilution) and incubated at
room temperature for 1h on a rotary platform (50 rpm). Any unbound secondary
antibody was washed off as described in section 2.2.6.3.

74
Table 2.8. Composition of 1x continuous transfer buffer (pH 8.3).
Reagents Percentage present
Tris-HCl pH 7.4
NaCl
50mM
0.9% (w/v)
Table 2.9. Composition of 1x Tris buffered saline.
Reagents Percentage present
Tris HCl (pH 9)
MgCl2
NaCl
100mM
1mM
150mM
Table 2.10. Composition of substrate buffer.
Reagents Percentage present in stain
Tris
Glycine
Methanol
25mM
192mM
20% (v/v)

75
2.2.6.5. Immunodetection of proteins
A BCIP (5-bromo-4-cholo-3-indoyl-phosphate)/NBT (nitro blue tetrazolium)
chromogenic assay was used to identify proteins on the membrane. It consists of three
components; a combination of BCIP, NBT and an alkaline buffer resulting in a substrate
solution for alkaline phosphatase. An insoluble NBT diformazan product is formed
upon incubation with the enzyme and was identified as a purple precipitate therefore
allowing colorimetric detection of alkaline phosphate-labelled molecules.
The membrane was rinsed in 50ml alkaline phosphatase buffer (table 2.10) to
equilibrate the pH of the blot. NBT (50mg/ml; 70% (v/v) dimethylformamide) and
BCIP (50mg/ml; 100% (v/v) dimethylformamide) were added to a further 50ml of the
alkaline phosphatase buffer; 330 µl and 165µl respectively. The solution was mixed
and added to the membrane, this was incubated at room temperature in the dark. Colour
development occurred in approximately 30 minutes. The membrane was rinsed with
distilled water to stop the colour reaction and was blotted dry with filter paper. The
membrane was then visualised.
2.2.7 High pH Anion Exchange Chromatography
2.2.7.1 Acid hydrolysis
Volumes of commercial and patient AGP samples corresponding to 50μg were added to
individual reacti-vials and 100μL of 2M TFA added. After replacing the aluminium
lined caps, the samples were incubated at 100°C for 4 hours. The basic sugars fucose
(Fuc), galactose (Gal), and mannose (Man) were hydrolysed using this treatment.
Simultaneously 50μg of AGP taken from the same samples were hydrolysed with 50μL
of 4M HCl, at 100°C for 6 hours to hydrolyse the amine sugar GlcNAc. Subsequently,
1cm glass wool was packed in Pasteur pipettes to act as a plug for 1mL (pH4) Dowex®-
50 WX8 H+ cation-exchange resin, using separate columns for each sample to prevent
contamination. To wash the column, 6mL HPLC-grade water was added and eluted,
followed by the sample hydrosylate from TFA hydrolysis treatments only. HPLC-grade
water (2mL) was added to collect the sample. The eluted solutions were dried to
completion in the rotary evaporator. The HPLC-grade water and acid from HCl

76
hydrolysed samples were evaporated in a rotary evaporator (similar to the method
adopted by Fan et al., 1994).
All samples were then reconstituted in 20µL HPLC-grade water and 5µL internal
standard (2-deoxy-D-galactose) to prepare the samples for monosaccharide analysis
with high pH anion exchange chromatography (HPAEC).
2.2.7.2 Monosaccharide analysis
After drying to completion and reconstituting samples from the different hydrolysis
conditions, the components of the glycans were analysed. The separation of the
monosaccharides was performed using a Dionex 600TM
High pH Anion Exchange
Chromatography (HPAEC) system with pulsed ampertomic detection (PAD). The
pulsed potentials during PAD were 0 seconds (sec), 0.05V; 0.29sec, 0.05V; 0.49sec,
0.05V; 0.5sec, 0.05V; 0.51sec, 0.6V; 0.6sec, 0.6V; 0.61sec, -0.6V; 0.65sec, -0.6V;
0.66sec, 0.05V (refer to figure 2.1). The Dx-600 was fitted with CarboPac PA-100
(containing quaternary-ammonium-bonded pellicular resins) analytical and guard
columns, a GP50 gradient pump and ED40 electrochemical detector. It was operated at
ambient temperature.
Before injecting any samples, the CarboPac PA-100 column was regenerated using 50%
1M NaOH/50% HPLC-grade water for 15 minutes - this was repeated. Mixtures of five
monosaccharides – 5µg of Fuc, GlcNAc, Gal, Man and internal standard (2-deoxy-D-
galactose) - were injected and 3% 1M NaOH / 97% HPLC-grade water was passed
through the column at a flow rate of 0.5ml/min in an isocratic gradient to ensure
effective separation over 35minutes. This was followed by 50% 1M NaOH/50%
HPLC-grade water for 15minutes to allow regeneration of the column. The
monosaccharide represented by each peak was identified by calculating the ratio of their
retention times with the internal standard and comparing the values to those generated
when the individual monosaccharides were run with internal standard. Before any
samples were analysed, standard curves for each of the five monosaccharides were
produced, plotting the peak area values against the mass of monosaccharide present
(µg). The respective equations were used to quantify the monosaccharides present in
the samples of AGP.

77
Figure 2.1. Pulsed potentials of the PAD system during HPAEC.
-0.8
-0.6
-0.4
-0.2
0
0.2
0.4
0.6
0.8
0 0.1 0.2 0.3 0.4 0.5 0.6 0.7
Pote
nti
al
(V)
Time (seconds)

78
Subsequent to sample hydrolysis and reconstitution in 20μL HPLC water and 5μL of
internal standard (1mg/ml), each was independently injected and separated by the
column (using 3% 1M NaOH / 97% HPLC water – pH13) over 50 minutes at a flow
rate of 0.5mL/min - this included a 15-minute regeneration period using 50% NaOH/
50% HPLC. The system was then ready for the injection of the next sample. Again, the
peaks generated for each sample were identified based upon the ratios of retention time
with the internal standard and the monosaccharide.
2.2.7.3 Oligosaccharide analysis
2.2.7.3a Enzyme Digestion
AGP sample volumes corresponding to 100µg of the glycoprotein were dried to
completion under a vacuum and reconstituted in 100µl of HPLC-grade water. The
samples were transferred into separate glass vials and aluminium lined caps fitted. They
were then denatured at 100oC for 3 hours and dried to completion under a vacuum.
A reaction mixture was prepared by adding the reactants stated in table 2.11 to the dry
AGP samples to make a total reaction volume of 100µl. The mixtures were incubated
for 24 hours at 37oC followed by a second addition of 5U of PNGase F. It was then
incubated for a final 24 hours at 37oC.
To separate the protein from the glycan chains ethanol precipitation was performed.
After the 48 hour incubation period, 300µl of ice-cold 80% ethanol was added to the
reaction mixture to provide a ratio of 3 parts ethanol to 1 part reaction mixture. Once
mixed, the samples were incubated overnight at -20oC. They were then centrifuged at
14,000 rpm for 30 minutes and the supernatant (containing the glycans) was collected in
clean eppendorfs, the pellet discarded. The supernatant was dried to completion using a
rotary evaporator ready to be reconstituted in 25µL HPLC-grade water for
oligosaccharide analysis.

79
reagents Volume present
HPLC-grade water
NE Buffer G7
NP-40
PNGaseF
79µl
10µl
10µl
5U
Table 2.11. Composition of reaction mixture for enzyme digestion.

80
2.2.7.3b Oligosaccharide HPAEC Analysis
A Dionex 500TM
system was used with the same pulsed potentials for the PAD as
described in figure 2.1. A CarboPac PA-100 pellicular anion exchange column was
used to separate the differently branched glycans. It was first regenerated over two
20minute cycles using 50% 1M NaOH and 50% HPLC grade water. The dry sample
supernatants from the enzyme digestion stage were reconstituted in 25µL of HPLC-
grade water. Each was independently applied to the PA-100 column and the glycans
separated based on their degree of branching using a series of different eluent
conditions, all added at a flow rate of 1mL min-1
. The column was equilibrated for 10
minutes using 10% NaOH/ 5% 1M NaOAc/ 85% HPLC grade water, the sample was
then separated during a linear gradient over 45 minutes when the eluent proportions
were 10% NaOH/ 20% NaOAc/ 70% HPLC grade water. The column was regenerated
over 10minutes with an eluent composition of 50% NaOH/ 50% HPLC grade water.
The final equilibration step, lasting 5 minutes, required 10% NaOH/ 5% NaOAc/ 85%
HPLC grade water.
To allow comparison of sample and commercial AGP oligosaccharide composition, a
human N-linked oligosaccharide library was separated, providing a reference profile.
Approximately 5µg was injected.
2.2.8 Sialic acid determination ELISA
A 1:20 dilution of assay buffer (Tris buffered saline with detergent; concentration
unavailable) was added to the first row of two 96-well microtitre plates (50% v/v),
representing the 100% signal control i.e. where the binding of lectin enzyme conjugates
would not be inhibited. In the second row the inhibition control (positive control)
supplied was plated (50% v/v) to represent 0% signal – no additional preparation was
required of the reagent.
Serial dilutions of AGP (5mg/mL) from a ‘normal’ healthy heparinised blood sample
and isolated from patients undergoing titration, harm reduction and long-term
methadone therapies were prepared with assay buffer and plated in triplicate (50% v/v)
in the order of decreasing concentration.
81
To one plate, Sambucus nigra agglutinin (SNA) – the lectin conjugate for α2,6-linked
SA - was added (50% v/v) to each well. Macckia amurensis Leukoagglutinin (MAL)
was added in the same volumes to the wells of the second plate to detect α2,3-linked SA
residues. The lectin conjugates were supplied in 100x concentrated form therefore they
were diluted prior to their use.
The microtitre plates were incubated at room temperature in the dark for 2 hours. Upon
removal, they were cooled at 4°C for 5minutes then washed with cold Assay buffer
(~200μL in each well). The plates were then emptied and washed a further four times
with cold assay buffer dropped onto paper towels between each wash to remove
unbound lectin conjugate and AGP.
The enzyme conjugate, which was supplied in a 10,000-fold concentrated form, was
diluted to a working concentration and added to all wells of the two plates in 100μL
aliquots and both were incubated at room temperature in darkness. After 2h incubation
the plates were cooled for 5minutes at 4°C and subsequently washed with cold assay
buffer (200μL pre well) a total of three times.
All wells were then washed twice in diluted equilibration buffer (1:2 dilution of the 2x
concentrated buffer supplied with deionised water).
Immediately prior to measurement of the absorbance of the well reagents at 405nm,
100μL of enzyme substrate was added to each well (2.8mg/mL solution in detection
buffer supplied in the kit; 0.36% w/v) to catalyse the reaction which was followed
colourimetrically.
Absorbance was analysed after 5, 20, 35 and 50 minutes to determine the most
appropriate time interval for the reaction to take place and highlight the greatest
variation between controls and samples.

82
2.2.9 Drug Binding Assay
2.2.9.1 Commercial AGP and Methadone standards
To conserve as much sample as possible and allow drug binding analysis to be
replicated, the study was performed at the microtitre level, using Nunc 96-well
microtitre plates. This technique was tested using theohylline; a drug known to bind
AGP as described in the method validation chapter (section 3.4).
Initially commercial AGP (5mg/mL) was added to a microtitre plates in 10µL volumes
alongside a range of methadone concentrations (25-2500µM), diluted from a 5mM
stock; each at 10µL. The drug was dissolved in DMSO. D-PBS was used to make
wells up to a final volume of 100µL, 80µL applied to those wells containing both AGP
and drug and 90µL in those only containing AGP (0mg/mL drug). Therefore, the AGP
and drug standards were diluted 10 fold on the plate. All conditions were plated in
triplicate. The plates were then excited at 280nm and the fluorescence emitted at
340nm (emission maximum of AGP) was recorded using an Optima fluorimeter. The
method was modified using commercial AGP at a concentration of 0.5mg/mL in order
to provide data relative to that of samples; limited sample availability meant
concentrations of 5mg/mL were unachievable. The concentration of drug standards
remained the same because when made 10 fold lower, the fluorescence was undetected
by the fluorimeter, thus the technique was ineffective.
2.2.9.2 Determination of methadone binding to sample AGP
AGP isolated from the blood of healthy volunteers and patients undergoing methadone
therapy was used at a concentration of 0.5mg/mL (reconstituted in d-PBS). Methadone
standards were produced using DMSO to include values representing the therapeutic
level of methadone (~400ng/mL). The lowest concentration was 370ng/mL (1.07µM);
10 fold lower than the 3700ng/mL (10.7µM) plated. Concentrations much lower than
this did not alter the fluorescence emitted. Higher concentrations were added;
30µg/mL, 75µg/mL and 865µg/mL (86.7, 216 and 250µM respectively) to indicate the
change in binding; all were diluted ten-fold upon plating. Thus, because AGP levels
were not 10 fold greater when plated, results are not indicative of the situation in vivo

83
but still represent useful data when determining differences in binding between
individuals.
2.2.10 Statistical Analysis
The Pearson correlation coefficient (R2) was calculated for the monosaccharide
calibration curves, using Microsoft® Excel 2007; a linear fit represented by a value of 1.
To calculate mean and standard deviations of data Microsoft® Excel 2007 was also
used. Two sample t-tests and one-way ANOVAs (with Tukey’s post hoc) were
performed using Minitab, version 15, to determine the statistical significance of all
quantitative data generated during the various analyses.
SUMMARY STATEMENT
Methods required for the structural analysis of glycans were only utilised and analysed
in subsequent chapters for AGP isolated from heparinised blood samples provided by
the Blood Transfusion Service and patients recruited from various stages of opioid
replacement therapy. That isolated from serum samples taken from elderly individuals
(cancer-free) and commercially sourced AGP were not deemed adequate representations
of a ‘normal’ healthy population – little information regarding the potential presence of
an APR in the former population was available while isolation of commercial AGP
differed to that utilised in this study. The use of acidic conditions in isolation could not
be avoided in the large-scale commercial methodology.

84
Chapter 3
Validation of Methods

85
3.1 Introduction
The following chapter describes the studies that were performed prior to the main
investigation in order to determine the optimal conditions for monosaccharide
compositional analysis and drug binding studies.
Analysis of the monosaccharide composition of AGP glycans required the use of acid
hydrolysis to cleave the glycosidic bonds between the monomeric units prior to
separation by HPAEC. It had been common practice in the laboratory to incubate 50μg
AGP for 4 hours at 100ºC with trifluoroacetic acid (TFA) and hydrochloric acid (HCl)
simultaneously. However, similar studies indicated that separate use of HCl and TFA
provided optimum hydrolysis (Fan et al., 1994). Therefore it was deemed necessary to
investigate the most efficient methodology because the research documented in this
thesis was based on structural analysis thus insufficient cleavage or monosaccharide
instability under acidic conditions risks the generation of erroneous data and subsequent
conclusions drawn would be inaccurate.
Additionally, adaptations to the methodology utilised previously by the group (Johnson
and Smith, 2006) to analyse drug binding to AGP were required. The concept of
exploiting the intrinsic fluorescence of specific amino acids (namely Trp and Tyr) in the
hydrophobic binding pocket for such studies was introduced by Parikh and co-workers
(2000). The fluorescence emitted is highest at 340nm for AGP due primarily to the
emission by Trp residues, and is reduced (quenched) on the binding of drugs or ligands
hence fluorescence studies offer potential in the detection of drug binding.

86
3.2 Methodology
3.2.1 Optimisation of monosaccharide release
3.2.1.1 Monosaccharide stability
Before hydrolysis was undertaken, it was deemed important to ensure the
monosaccharides under investigation were not degraded when incubated at 100°C under
acidic conditions for up to six hours.
Monosaccharide standards (Sigma-Aldrich), each approximately 7μg, were incubated
with TFA or HCl alone, or a combination of the two. HPAEC-PAD (described in
section 2.2.7.2) was performed on the samples of monosaccharide every hour (n=3)
with final analysis occurring at 6h, to determine if they remained stable under the
different conditions.
3.2.1.2 Development of optimal hydrolysis conditions
In order to determine which of the techniques employed by the various groups provided
the optimum hydrolysis of AGP glycans, experiments were performed with 50μg
commercial AGP hydrolysed for 4h with both 100 μL 2M TFA and 50μL HCl, the same
conditions but incubated for 6h, 50μg hydrolysed for 4h with 100 μL 2M TFA alone
and 50μg hydrolysed for 6h with 50μL 4M HCl alone. The levels of each
monosaccharide were determined after these incubation periods. Additionally,
commercial AGP samples were incubated under the same conditions but analysed each
hour to determine whether the hydrolytic conditions deemed most effective in the
previous experiment were not bettered if incubated for alternative time periods.
3.2.1.3 Dowex®
Cation-Exchange Column study
A study was carried out to test whether Dowex®-50 H
+ cation-exchange resins interfere
with the elution of monosaccharide components when used to remove proteins after
hydrolysis. Three 25μg aliquots of the standard control HPAEC mixture (5μg of Fuc,

87
GlcNAc, Gal, Man and an internal standard of 2-deoxy-D-galactose) were passed
through the Dowex® column. The mass of each monosaccharide obtained was
compared to values for an identical mixture that was directly injected into the HPAEC
system in order to determine any losses due solely to the resin.
Additionally, 50µg commercial AGP samples - hydrolysed using the four acidic
conditions above (4M HCl alone for 4 hours, TFA alone for 6 hours, and both acids for
4 and 6 hours), but not passed through Dowex®-50 H
+ cation exchange columns - were
analysed to establish whether there were any significant effects on the component
monosaccharide levels when compared to those passed through the columns. In place
of the Dowex® column, the hydrolysed samples were dried in a rotary evaporator after
hydrolysis and subsequently washed twice with 200µL HPLC-grade water (as reported
by Fan et al., 1994). Post-hydrolysis all samples, regardless of the treatment, were
immediately dried and reconstituted in 20µL water and 5µL IS to allow separation by
HPAEC upon injection, subsequently assisting the identification of the method least
likely to compromise monosaccharide yield.
The hydrolysis conditions chosen after comparing all the results from the studies above
was described in section 2.2.7.1.
3.2.2 Microtitre plate drug binding assay
Initial fluorescence studies were undertaken at the University of Strathclyde where
fluorescence emission spectra were generated in the absence and presence of drugs
known to bind AGP (refer to section 3.3.2). The studies affirmed that maximum
emission occurred at approximately 340nm as has been well documented for Trp
residues (Chen and Barkley, 1998). Therefore in subsequent studies at Edinburgh
Napier University, where the scanning function was unavailable, a specific filter was
utilised.

88
3.2.2.1 Testing method with Theophylline
Initially the micro-titre plate method was tested by performing studies using a range of
theophylline concentrations (25-2500µM), diluted from a 5mM stock, and 5mg/mL
commercial (Sigma) AGP. Both were dissolved in d-PBS. Commercial AGP (5mg/mL)
was added to individual wells on a Nunc 96-well microtitre plate at a volume of 10µL
(10% v/v). Each drug standard was then added to the AGP wells, also at a volume of
10µL (10% v/v) and d-PBS was used to make up a final volume of 100µL. All
conditions were plated in triplicate. The plates were then excited at 280nm and the
fluorescence emitted at 340nm (emission maximum of AGP) was recorded using an
Optima fluorimeter. Results were graphed in figure 3.4.
The method was modified to allow for small volumes of sample AGP; 5mg/mL was
unobtainable due to restrictions enforced on the project. Therefore 0.5mg/mL was used
(figure 3.4). The concentration of drug standards remained consistent with the previous
experiment because when made 10-fold lower, fluorescence was undetected.
3.2.2.2 Microtitre plate and Methadone
The same range of concentrations (25-2500µM) were produced with methadone, in d-
PBS, and added to wells containing 10µL of either 5mg/mL or 0.5mg/mL commercial
AGP. As described above (section 3.2.2.1), finite sample volumes meant 0.5mg/mL
AGP was used in all sample analyses. The effects on the fluorescence of AGP in the
presence of methadone in this case were graphed in figure 3.5.
3.2.2.3 Methadone dissolved in d-PBS versus DMSO
The two concentrations of commercial AGP - 0.5mg/mL and 5mg/mL were made using
d-PBS, as above (section 3.2.2.1). A concentration range similar to that of theophylline
was produced for methadone (25-2500µM) but using DMSO. Each drug standard was
added to wells containing 10% (v/v) of either 5mg/mL or 0.5mg/mL commercial AGP
and made up to 100µL with d-PBS (methadone was therefore present in the
concentration range 2.5-250μM). The results (figure 3.6) were compared to those
generated when d-PBS was used a solvent (figure 3.5), the reduction in fluorescence
was far more evident with DMSO.

89
3.3 Results
3.3.1 Optimisation of monosaccharide release methodology
3.3.1.1 Monosaccharide stability
Overall, the neutral monosaccharides displayed decreased stability in the presence of
HCl (figure 3.1a-c). When combined with TFA, the stability was generally improved
on that in the presence of HCl alone. Fuc levels were most stable over longer periods in
the presence of TFA alone; the other acidic conditions caused a decrease, over time.
Gal and Man also appeared to become less stable as incubation periods lengthened
when HCl was present, either alone or alongside TFA. The basic monosaccharide GlcN
(GlcNAc is deacetylated during hydrolysis) remained largely unaffected by the acidic
conditions however it was more stable in the presence of HCl than any other
monosaccharide (figure 3.1d).
3.3.1.2 Acid Hydrolysis optimisation
Table 3.1 summarises the mean values of each monosaccharide obtained – according to
HPAEC separation and detection – upon hydrolysis of commercially sourced AGP
under four acidic conditions (n=4 for each condition). The amount of monosaccharides
obtained during the combined hydrolysis technique was compared to the other
conditions tested (reported in table 3.2). Tables 3.1 and 3.2 indicate that the most
effective yield of neutral monosaccharides was obtained by using TFA alone (p<0.05).
Greatest significance was found for Gal which is a monosaccharide only present in the
branches of N-linked complex chains, its presence is therefore correlated with chain
branching. Ensuring its optimal release was important for the subsequent structural
studies.
Although the most effective method of cleaving GlcNAc residues initially appeared to
be the combined use of acids (table 3.1 and 3.2), a further study was deemed necessary
upon reading the literature and analysing the values generated during hydrolysis of
commercial AGP, which seemed low. This involved the removal of the dowex column
as described in section 3.1.3.
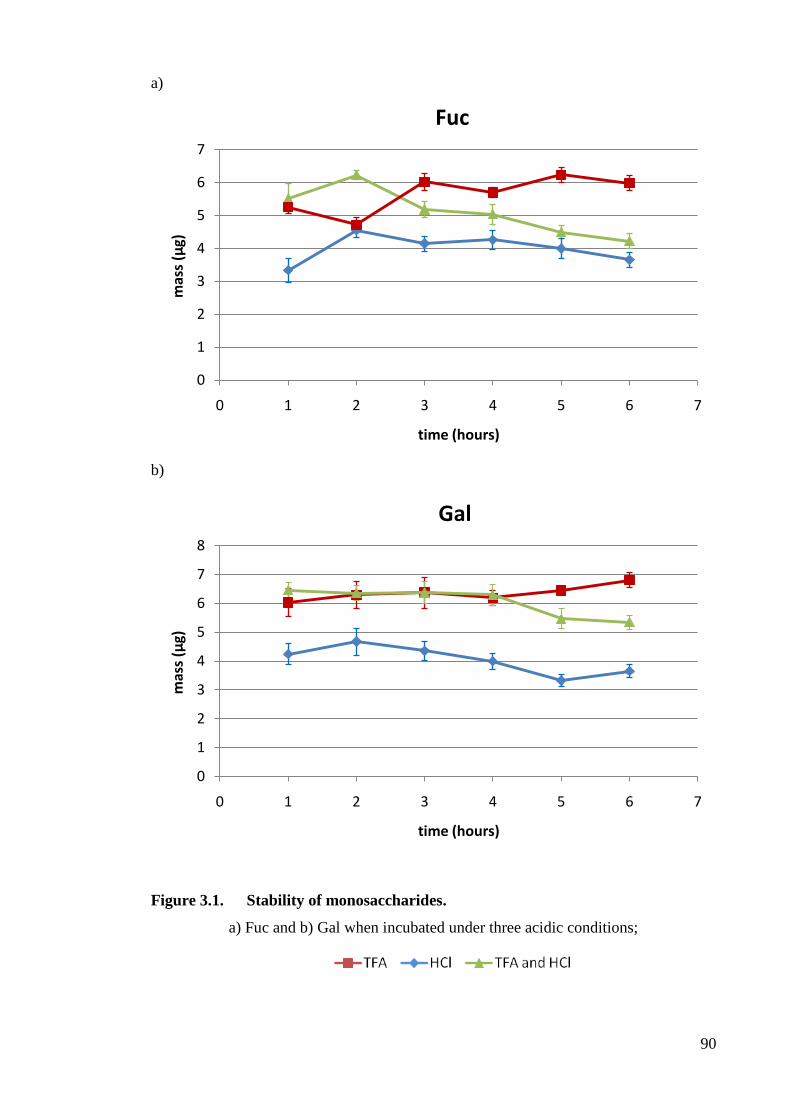
90
a)
b)
Figure 3.1. Stability of monosaccharides.
a) Fuc and b) Gal when incubated under three acidic conditions;
0
1
2
3
4
5
6
7
0 1 2 3 4 5 6 7
mas
s (µ
g)
time (hours)
Fuc
0
1
2
3
4
5
6
7
8
0 1 2 3 4 5 6 7
mas
s (µ
g)
time (hours)
Gal

91
c)
d)
Figure 3.1 continued. Stability of monosaccharides.
c) Man and d) GlcN when incubated under three acidic conditions;
0
1
2
3
4
5
6
7
0 1 2 3 4 5 6 7
mas
s (µ
g)
time (hours)
Man
0
1
2
3
4
5
6
7
8
0 1 2 3 4 5 6 7
mas
s (µ
g)
time (hours)
GlcN
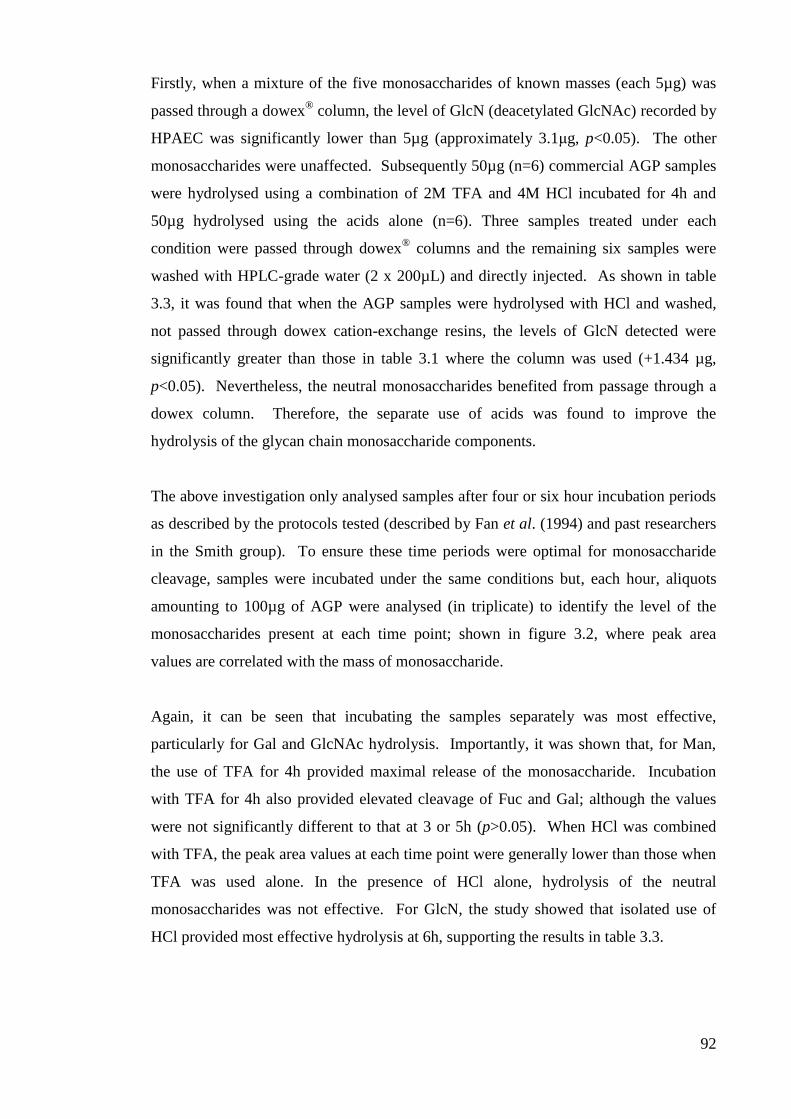
92
Firstly, when a mixture of the five monosaccharides of known masses (each 5µg) was
passed through a dowex®
column, the level of GlcN (deacetylated GlcNAc) recorded by
HPAEC was significantly lower than 5µg (approximately 3.1μg, p<0.05). The other
monosaccharides were unaffected. Subsequently 50µg (n=6) commercial AGP samples
were hydrolysed using a combination of 2M TFA and 4M HCl incubated for 4h and
50µg hydrolysed using the acids alone (n=6). Three samples treated under each
condition were passed through dowex® columns and the remaining six samples were
washed with HPLC-grade water (2 x 200µL) and directly injected. As shown in table
3.3, it was found that when the AGP samples were hydrolysed with HCl and washed,
not passed through dowex cation-exchange resins, the levels of GlcN detected were
significantly greater than those in table 3.1 where the column was used (+1.434 µg,
p<0.05). Nevertheless, the neutral monosaccharides benefited from passage through a
dowex column. Therefore, the separate use of acids was found to improve the
hydrolysis of the glycan chain monosaccharide components.
The above investigation only analysed samples after four or six hour incubation periods
as described by the protocols tested (described by Fan et al. (1994) and past researchers
in the Smith group). To ensure these time periods were optimal for monosaccharide
cleavage, samples were incubated under the same conditions but, each hour, aliquots
amounting to 100µg of AGP were analysed (in triplicate) to identify the level of the
monosaccharides present at each time point; shown in figure 3.2, where peak area
values are correlated with the mass of monosaccharide.
Again, it can be seen that incubating the samples separately was most effective,
particularly for Gal and GlcNAc hydrolysis. Importantly, it was shown that, for Man,
the use of TFA for 4h provided maximal release of the monosaccharide. Incubation
with TFA for 4h also provided elevated cleavage of Fuc and Gal; although the values
were not significantly different to that at 3 or 5h (p>0.05). When HCl was combined
with TFA, the peak area values at each time point were generally lower than those when
TFA was used alone. In the presence of HCl alone, hydrolysis of the neutral
monosaccharides was not effective. For GlcN, the study showed that isolated use of
HCl provided most effective hydrolysis at 6h, supporting the results in table 3.3.

93
Mean mass of monosaccharide ± stDev (µg)
Hydrolysis condition Fucose GlcNAc Galactose Mannose
2M TFA/ 4M HCl 4h 0.13 ± 0.02 3.04 ± 0.35 3.24 ± 0.41 1.62 ± 0.04
2M TFA/ 4M HCl 6h 0.09 ± 0.08 2.37 ± 0.13 3.13 ± 0.33 1.48 ± 0.17
2M TFA 4h 0.26 ± 0.05* 1.54 ± 0.08 4.52 ± 0.80* 2.27 ± 0.25*
4M HCl 6h 0.15 ± 0.15 2.74 ± 0.05 3.62 ± 1.27 1.57 ± 0.46
Table 3.1. A comparison of the mean mass of monosaccharides. Generated
during hydrolysis of commercial AGP under the four different acid hydrolysis
conditions ± standard deviation
Mean difference in mass of monosaccharide compared to
that generated using 2M TFA/ 4M HCl 4h (µg)
Hydrolysis condition Fucose GlcNAc Galactose Mannose
2M TFA/ 4M HCl 4h 0.13 3.04 3.24 1.62
2M TFA/ 4M HCl 6h - 0.06 - 0.67 - 0.10 - 0.13
2M TFA 4h + 0.14 - 1.50 + 1.29 + 0.65
4M HCl 6h + 0.02 - 0.30 + 0.38 - 0.05
Table 3.2. Summary of the difference in mass of monosaccharides obtained
during hydrolysis. Commercial AGP glycan composition under the four different acid
hydrolysis conditions compared to the combined use of TFA and HCl for 4h.
Mean mass of monosaccharide ± stDev (µg)
Hydrolysis condition Fucose GlcNAc Galactose Mannose
2M TFA/ 4M HCl 4h 0 4.217 1.344 0.563
2M TFA 4h 0.050 4.000 2.047 0.881
4M HCl 6h 0 4.477* 1.133 0.341
Table 3.3. Mean mass of monosaccharides obtained upon removal of the dowex
cation exchange resin. * Statistically significant improvement compared to 2M
TFA/4M HCl 4h (p<0.05).
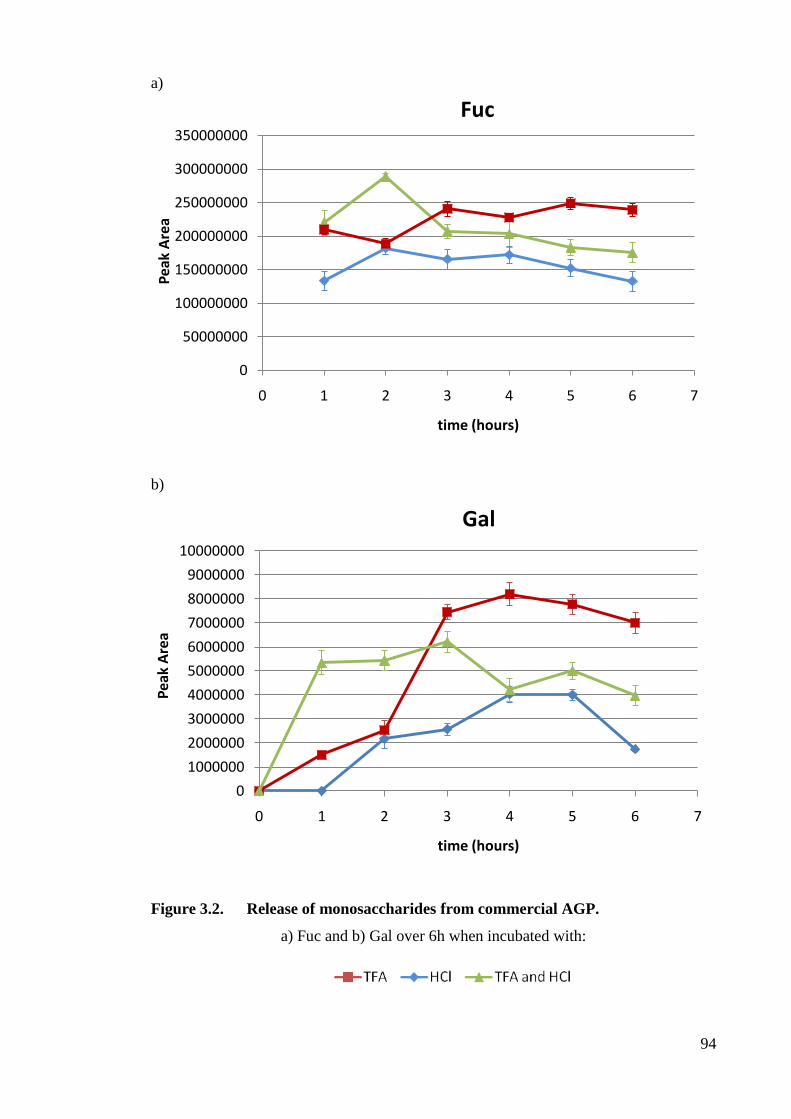
94
a)
b)
Figure 3.2. Release of monosaccharides from commercial AGP.
a) Fuc and b) Gal over 6h when incubated with:
0
50000000
100000000
150000000
200000000
250000000
300000000
350000000
0 1 2 3 4 5 6 7
Pea
k A
rea
time (hours)
Fuc
0
1000000
2000000
3000000
4000000
5000000
6000000
7000000
8000000
9000000
10000000
0 1 2 3 4 5 6 7
Pea
k A
rea
time (hours)
Gal
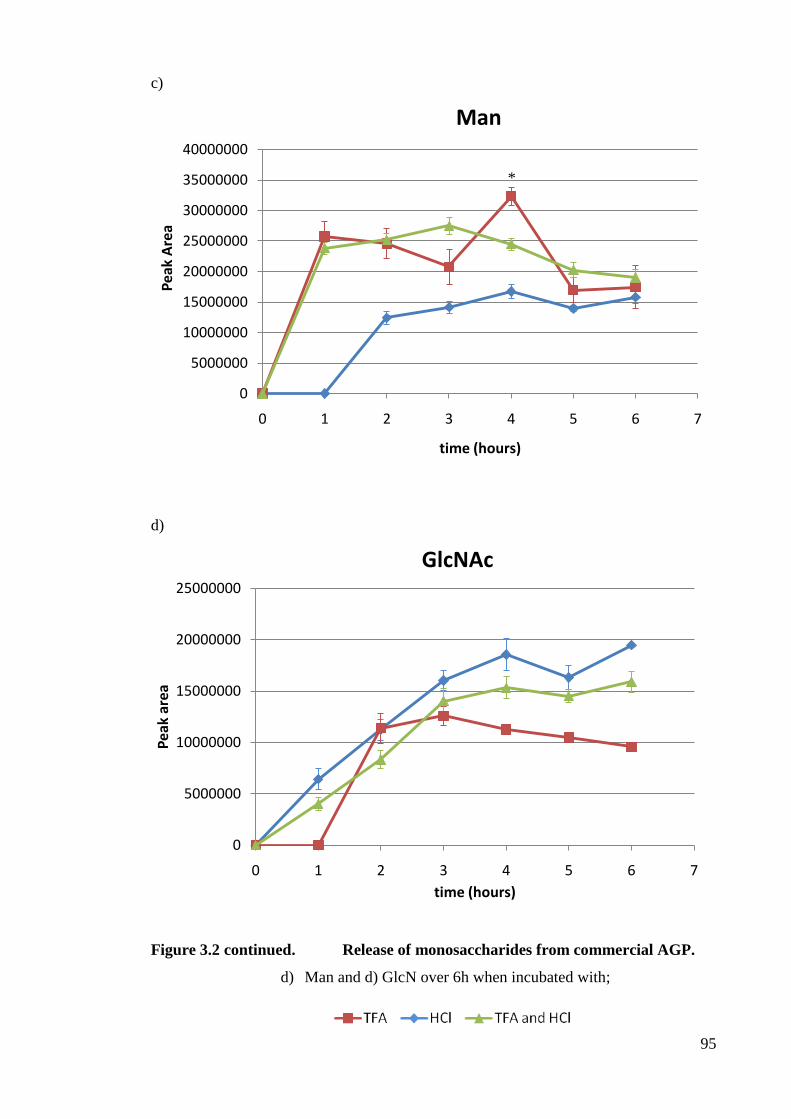
95
c)
d)
Figure 3.2 continued. Release of monosaccharides from commercial AGP.
d) Man and d) GlcN over 6h when incubated with;
0
5000000
10000000
15000000
20000000
25000000
30000000
35000000
40000000
0 1 2 3 4 5 6 7
Pea
k A
rea
time (hours)
Man
0
5000000
10000000
15000000
20000000
25000000
0 1 2 3 4 5 6 7
Pea
k ar
ea
time (hours)
GlcNAc
*

96
3.3.2 Microtitre plate drug binding assay
The excitation of AGP at 280nm generates a fluorescence emission spectra between
300-400nm, as illustrated in figure 3.3a, with the maximum fluorescence occurring at
approximately 340nm. When STI571 - a drug known to bind AGP (Jørgensen et al.,
2002) was introduced to commercial AGP at increasing concentrations, the bell-shaped
curve was found to reduce in height (figure 3.3b); the fluorescence was quenched.
Conversely, when a drug was introduced which did not bind AGP, the spectrum was not
affected (figure 3.3c) hence fluorescence studies are useful in the detection of drug
binding. As formerly stated, emission spectra could not be generated using the
equipment available and therefore a specific 340nm filter was used to detect the
maximal values; important in fluorescence-based drug binding analysis.
As shown in figure 3.4, microtitre plate assays are useful in detecting fluorescence
emitted by Trp and Tyr residues of AGP, a decrease occurring when a drug becomes
bound. Theophylline is a drug known to bind AGP and therefore the various
concentrations allow the effect of increased drug binding on intrinsic fluorescence to be
determined (refer to figure 3.4). The degree of fluorescence was markedly decreased as
the drug concentration was increased thus the drug was used as a positive control
throughout. All drug standards were made 10-fold more concentrated but graphed as
the concentration present on the plate i.e. 2.5-250μM. The values were plotted against
theophylline concentration (figure 3.4) to show the reduction in fluorescence which
occurred with drug binding. When the microtitre plate method was repeated using
methadone in place of theophylline, no significant effect on the fluorescence emitted by
AGP was detected (figure 3.5). However upon adaptation of the method, specifically
by replacing d-PBS with DMSO as the solvent used for dissolving the drug, the level of
binding - as indicated by a reduction in fluorescence - was more apparent, especially at
high concentrations (figure 3.6). The level of binding was not as high as that seen with
theophylline, but the technique remained feasible for the analysis of methadone binding.
The organic solvent DMSO was subsequently deemed the solvent of choice in which to
dissolve methadone; as described in the previous chapter (section 2.2.6.1). It is capable
of dissolving both polar and nonpolar compounds and although concentrated solutions
can cause oxidation of -OH groups to produce ketones, it should not affect the structure
of methadone which does not have free –OH groups.

97
a)
Figure 3.3. Fluorescence spectra of commercial AGP over 300-400nm when
excited at 280nm in a) the absence and b) the presence of STI571.
Maximum fluorescence emitted
300 310 320 330 340 350 360 370 380 390 400
Wavelength (nm)
Flu
ore
scen
ce
RF
U
Flu
ore
scen
ce R
FU
0 µM 2.5 µM 5 µM 10 µM 20 µM
35 µM 50 µM
16
14
12
10
8
6
4
2
0
Flu
ore
scen
ce R
FU
RF
U
16
14
12
10
40
30
20
10
0
60
50
300 310 320 330 340 350 360 370 380 390 400
Wavelength (nm)

98
c)
Figure 3.3 continued. Fluorescence spectra of commercial AGP over 300-
400nm when excited at 280nm in c) the presence of hydroxyurea. [Reprinted with
permission of Dr. P Mooney].
0 µM 2.5 µM 20 µM 125 µM 250 µM
Wavelength (nm)
Flu
ore
scen
ce R
FU
300 310 320 330 340 350 360 370 380 390 400
0
60
50
40
30
20
10

99
Figure 3.4. Intrinsic fluorescence at 340 nm of 5mg/mL and 0.5mg/mL
commercial AGP in the presence of theophylline.
Figure 3.5. Intrinsic fluorescence at 340nm of 5mg/mL and 0.5mg/mL
commercial AGP with methadone.
0
5000
10000
15000
20000
25000
30000
35000
40000
45000
50000
0 50 100 150 200 250
flu
ore
sce
nce
RFU
concentration theophyline µM
Sigma 0.5mg/mL AGP Sigma 5mg/mL AGP
15000
20000
25000
30000
35000
40000
45000
50000
0 50 100 150 200 250
flu
ore
sce
nce
RFU
concentration methadone µM (in d-PBS)
Sigma 0.5mg/mL AGP Sigma 5mg/mL AGP
concentration methadone (µM)

100
Figure 3.6. Intrinsic fluorescence of 5mg/mL and 0.5mg/mL commercial AGP
with methadone dissolved in DMSO.
15000
20000
25000
30000
35000
40000
45000
50000
0 50 100 150 200 250
flu
ore
sce
nce
RFU
concentration methadone (µM)
Sigma 0.5mg/mL AGP Sigma 5mg/mL AGP

101
3.4 Discussion
3.4.1 Monosaccharide release optimisation
It is important to determine the composition of glycan chains when studying the
function of AGP; their specific monosaccharide arrangements influence the overall
glycoprotein structure, dynamics, and subsequently their functions. Analysis requires
the identification and validation of an appropriate analytical technique i.e. acid
hydrolysis. As specific monosaccharides, for example Gal, are unique to the branches
of complex N-linked glycans, alterations in the monosaccharide composition can
suggest changes to the branching. Confirmation requires additional analysis of complete
glycans (chapter 7).
HCl cleaves the basic sugar GlcNAc (causing it to be de-acetylated to GlcN; Kim,
2000) whilst TFA is used to hydrolyse the neutral sugars Fuc, Gal and Man. In the past,
TFA was used alone (e.g. Davies et al., 1993; Elliott et al., 1997) however it is unable
to effectively cleave the basic monosaccharide GlcNAc because the monosaccharide has
a higher degree of resistance to acids, the innermost GlcNAc attached to Asn residues of
a polypeptide backbone particularly.
The use of HCl was introduced to provide more effective hydrolysis of this
monosaccharide (French et al., 2002). An earlier study performed by Fan and
colleagues (1994) suggested that in combination with TFA the yield of the
monosaccharides can be compromised. Therefore an experiment was undertaken within
this study with commercial AGP to determine the most efficient method, it was found to
compare to that described by Fan et al. (1994). Hardy and Townsend (1994) reported
that Man in particular was destroyed with 4M HCl – as supported by this study -
however in the presence of only TFA, it was effectively hydrolysed and stable, thus
supporting the decision to implement separate acid hydrolysis for release of the neutral
and basic monosaccharides.
Dowex® cation-exchange resins are generally used after acid hydrolysis to remove the
polypeptide component of the glycoprotein; the negatively charged amino acids interact
with the column and are thus removed from the monosaccharide components which

102
theoretically elute unhindered. Polypeptide removal is often necessary because it can
interfere with the separation of monosaccharides by HPAEC-PAD; the large structures
may shift the elution of monosaccharides or even prevent their resolution by eluting at
the same time – particularly possible with Fuc which elutes early - rendering it difficult
to determine the monosaccharide composition. During the present study, the level of
GlcN collected after this stage – using commercial AGP samples - was lower than
expected. To determine whether the 2mL of HPLC water used to wash the sample
through the column was insufficient to elute all GlcN, a further 2mL was added and
collected. However, this was not found to generate any further GlcN detected by
HPAEC-PAD. It was postulated that unlike the neutral monosaccharides, GlcN may
interact with the column due to its negative charge. As described above, upon removal
of the column, the level of GlcN was significantly improved which was in agreement
with Fan et al (1994).
Although it had often been reported that the level of GlcN detected by HPAEC-PAD
after hydrolysis with TFA and HCl alone, or in combination, was significantly lower
than that expected and a correction factor was sometimes applied, the possibility that the
Dowex® column could reduce the levels of GlcN made available to the HPAEC-PAD
detector was not considered and therefore its use continued (Smith et al., 2002; Mooney
et al., 2006).
Interestingly, the removal of the Dowex® column did not significantly affect the
resolution of the neutral monosaccharides; further supporting the idea that only GlcN
interacted with the column. Furthermore, the pH of the Dowex® was taken upon each
use to ensure a pH of 4 was maintained therefore it was never overly acidic so could not
cause an unusual increase in sugar degradation. Finally, the detectors of the HPAEC
equipment were cleaned to ensure the detection system was not at fault i.e. causing the
low GlcN data. Fluctuations were minimal with no clear differences to that obtained
before cleaning.
Therefore Dowex® cation-exchange columns were only implemented for TFA
hydrolysed samples to ensure optimal generation of neutral monosaccharides, removing
the protein which potentially complicates and confuses chromatograms. It was not used
for the HCl hydrolysed samples to improve GlcN resolution – its retention is late on in
chromatographic separation therefore any peptide present should not elute alongside.

103
Even if the retention time was prolonged, that of the internal standard would be
similarly affected therefore the peak would still be identifiable. Despite requiring twice
the mass of AGP to perform analysis of the monosaccharide composition, the enhanced
effectiveness could not be ignored. This was especially true when considering the
significantly improved levels of Gal and GlcN obtained (Man or Fuc were increased but
statistically not significant). These two monosaccharides are present in glycan branches
and thus provide useful evidence of structural changes. Gal is only present in branches
and therefore it was important to ensure the separation and hydrolysis of this
monosaccharide was as effective as possible. Although GlcN can provide similar
information, it is also present in the pentasaccharide core and therefore it must be
analysed with caution alongside Gal levels and oligosaccharide analysis. The innermost
GlcNAc attached to the peptide backbone is difficult to hydrolyse as the bond is very
strong (Fan et al., 1994) thus higher levels in some patients are not necessarily
correlated with branching but instead perhaps more efficient cleavage of the core
GlcNAc residues. If an elevation coincides with that of Gal levels then it is probable
that branching has increased.
In summary, it has been found that the use of a cation-exchange column, although
important when analysing neutral monosaccharides, affects the level of GlcN
subsequently detected by the HPAEC equipment. Therefore, for the monosaccharide
analysis of AGP samples, separate hydrolytic conditions were implemented. Using
these methods in the study may give an indication of, but does not definitively allow,
the degree of branching of glycans attached to the AGP protein backbone to be
determined however in chapter 7, the analysis of complete oligosaccharide chains is
described and allows qualitative estimation of glycan branching.
3.4.2 Drug binding analysis
Although a more in-depth discussion will follow in chapter 8, when reporting the
binding of methadone to patient AGP samples, a short discussion is necessary in order
to explain why the particular assay was chosen.
All drugs must attain a specific level at their site of action in order to exert their
pharmacological effect (minimal effective concentration, MEC). It is well documented

104
that, at physiological pH, AGP is capable of binding basic and neutral drugs with a high
affinity and low capacity (Fournier, 2000; Israili and Dayton, 2001). When a drug
becomes bound and therefore rendered inactive, the level present may fall below the
MEC. If the effect is widespread the drug subsequently loses its ability to provide the
desired pharmacological effect.
As methadone is a basic drug, it binds AGP (Kremer et al., 1988; Rodriguez-Rosas et
al., 2003). However, whether the glycosylation of this glycoprotein affects the degree
of binding and subsequent level of free active drug available, has remained largely
unstudied in patients undergoing opioid replacement therapy. Analyses such as those
detailed in this study are limited by the availability of sample thus performing large-
scale techniques to analyse drug binding was unfeasible (even the cuvette-scale requires
10 fold more reactants), especially as samples were required for structural analysis.
Therefore, the use of a microtitre plate method was useful. It was first described by
Parikh and colleagues (2000) as a valuable mechanism for drug binding analysis;
detecting alterations in intrinsic fluorescence. Essentially, as a drug becomes bound, the
underlying Trp and Tyr residues which fluoresce when excited at 280nm are masked
and therefore the fluorescence is decreased (quenched).
The studies with commercial AGP indicated that 5mg/mL AGP allowed the effects of
drug binding on fluorescence to be distinguished more clearly than in the presence of
0.5mg/mL. Initially, the methodology was tested using theophylline (results graphed in
figure 3.4) as its binding to AGP has been well documented (Parikh et al., 2000) and so
allowed the validity of the experiment to be tested. Despite this, restrictions meant the
lower concentration was used in all subsequent analyses; higher concentrations were
impractical. Nevertheless, 0.5mg/mL commercial AGP responded to the presence of
increased concentrations of drug (theophylline and methadone) with a decreased
fluorescence (figures 3.4 and 3.6 respectively). It was unsurprising as an increase in
concentration renders more drug available to the binding sites therefore their occupation
was enhanced thus masking increased Trp and Tyr residues. As methadone became
increasingly concentrated the degree of quenching slowed – the availability of binding
sites must have become limited.
Overall it can be seen that the microtitre plate method was useful in intrinsic
fluorescence analysis, as reported in previous studies (e.g. Johnson and Smith, 2006)

105
providing an indirect indication of drug binding when samples are low in supply.
Chapter 8 discusses in detail why methadone may not be able to quench the intrinsic
fluorescence of AGP to the same extent as theophylline.
SUMMARY STATEMENT
It was shown that separate hydrolysis of isolated AGP with 2M TFA and 4M HCl was
necessary to ensure effective glycan structural analysis, which is important in studies
such as this investigating whether altered glycosylation may affect the function of a
glycoprotein. Therefore these conditions were adopted throughout. Additionally, drug
binding studies implementing fluorescence at the microtitre plate level were shown to
be useful.
106
Chapter 4
Patient demographics

107
4.1 Patient Demographics
A trained phlebotomist obtained blood samples from consenting individuals who were
enrolled in different stages or types of opioid replacement therapy at the Community
Drug Problem Service (CDPS) in Edinburgh, Scotland. The subjects were grouped by
type and stage of therapy (table 4.1) including those having recently become enrolled in
the initial two week Titration phase of the program receiving methadone (n=5), those
attending the Harm Reduction program having received maintenance doses for less than
1 year (n=4) and finally those who have been stable on methadone therapy for
prolonged periods of time thus attending the clinic only occasionally (n=11). Patients
receiving alternative treatments were also included; buprenorphine (n=4),
dihydrocodeine (n=1) and heroin (n=1). Methadone was prescribed at the clinic as a
solution with a 1mg/mL or 2mg/mL concentration.
The dose of opioid substitute administered to each patient, additionally prescribed
medications and recent recreational drug use (within last week) was noted and
summarised in table 4.1. New identities were assigned to the blood samples to
correspond with the drug therapy they were receiving, reducing confusion in the
subsequent chapters. Eighteen male and eight female volunteers were recruited into the
study, ranging from 20 to 51 years of age with a mean ± standard deviation of 33.0 ±
7.0 (33.5 ± 6.7 and 31.9 ± 7.0 for males and females respectively) – refer to section
2.1.1.
Blood samples were also obtained from the Blood Transfusion Service; these consisted
of a mixture of blood from a healthy ‘normal’ population, hence no individual patient
data was available. ‘Normal’ serum samples were provided by Professor David George
of the Glasgow Western Infirmary. These samples were taken from a cancer-free
elderly female population resident in the West of Scotland. No other medical
information specific to each individual was provided.

108
Patient
Number
Stage/type of
therapy
Dose
(mg)
Additional
prescribed
drugs
Recent
Recreational
drug use
New
Identity
JB 0608 01
Titration
(T)
95 * Heroin – smoke T1
JB 0608 02 65 - Heroin T2
JB 0509 01 55 - T3
JB 0509 05 40 Diazepam T4
JB 0509 06 60 - T5
JB 0608 03
Harm Reduction
(HR)
90 * Heroin HR1
JB 0608 04 85 * Heroin HR2
JB 0608 05 150 * Heroin HR3
JB 0608 06 150 - - HR4
JB 0608 07
Long Term
(LT)
95 Diazepam Cocaine
MDMA, Speed LT1
JB 0608 08 150 - - LT2
JB 0608 10 40 Mirtazapine,
Statin
Chlorpromazine LT3
JB 0608 12 90 Diazepam Amitryptline LT4
JB 0509 03 105 Diazepam Heroin, Crack
cocaine LT5
JB 0509 04 85 - - LT6
JB 0509 09 150 Diazepam Prozac LT7
JB 0509 10 50 Diazepam Cannabis LT8
JB 0509 11 150 Diazepam Cannabis LT9
JB 0509 12 200 Diazepam - LT10
JB 0509 14 90 Diazepam - LT11
JB 0608 09
Buprenorphine
(B)
1.6 Diazepam,
Chlorpromazine
- B1
JB 0608 11 10 Mirtazapine,
Amitryptiline
- B2
JB 0509 02 6 Diazepam,
Mirtazapine
Cannabis B3
JB 0509 08 6 Diazepam,
Mirtazapine
- B4
JB 0509 07 Dihydrocodeine
(D)
60 Amitryptiline,
Olanzepine,
Depixole
- D1
JB 0509 13 Heroin (H) * * * H1
Table 4.1. Patient data
T: Titration phase; HR: Harm Reduction; LT: Long-term methadone;
B: Buprenorphine; D: Dihydrocodeine; H: Heroin.
M/F: Male/Female; * Data was unavailable; - Nothing to declare

109
It could be seen from table 4.1 that a large number of patients undergoing opioid-
replacement therapy were co-prescribed the benzodiazepine diazepam (n=12). The
actual number may have been greater but data was not available for all patients. In
terms of the study group for which prescribed drug data was available, this equated to
57.1% of patients. Interestingly, almost three quarters of LT patients were receiving
diazepam alongside methadone (~72.7%). Mirtazapine – a tricyclic antidepressant
(TCA) - was prescribed in four patients, three of which were receiving buprenorphine as
the substitute opioid. Another TCA, amitryptiline, was prescribed to two individuals.

110
4.2 Discussion
As discussed with some depth in section 1.5.1, the identification of effective treatment
strategies is central to addressing the huge problem opioid dependence poses not only to
the UK but worldwide. A recent Scottish Government study (SACDM, 2007) used
information provided by the country’s NHS boards to illustrate that there has been an
increase in GP-based patient treatment; approximately 22,224 (including 1,093 in
prison) were receiving substitute therapy – an increase of 1,904 on the figures in 2004
(19,227 - not including prisoners).
As reported in table 4.1, not all patients recruited into this study were receiving
methadone as the substitute treatment, instead four received buprenorphine, one
dihydrocodeine and another individual was prescribed pure heroin. Generally,
alternatives are only considered when methadone has proved unsuccessful in aiding an
individual to abstain from illicit heroin use. Initially it was hoped to focus sample
collection to the long-term and titration methadone groups however this was virtually
impossible, certainly for the latter group where recruitment was hindered by their
apprehension. Therefore it was decided an interesting alternative for this preliminary
study was to recruit patients undergoing therapy at the clinic with the alternative drugs.
Limitations put in place by the NHS ethics board regarding the number and volume of
blood samples rendered it difficult to recruit a larger number of individuals in each
category.
A report by Strang et al. (2005) indicated that DHC is the most commonly prescribed
drug after methadone in the UK although the number of studies and trials undertaken
with the drug are few. As for patient D1, it is generally implemented if methadone is
unsuccessful. Within the four year period of 1995-1999, prescriptions for DHC
increased by 11% in the West of Scotland alone. It has been shown that the sedative
effects and dangers of toxicity associated with methadone mean patients would often
prefer the shorter acting DHC (Robertson et al., 2006). Within the same period of the
late 1990s, an increase in the number of DHC-related deaths was also reported; 55% of
deaths in a study population of 89 individuals were a direct result of DHC use (Seymour
et al., 2001; Power et al., 2002).

111
Buprenorphine is a partial opioid agonist which is demonstrating increased usage and
competes with full agonists like heroin for the opioid receptor. It carries a decreased
risk of overdose due to its longer t1/2 and helps achieve stabilisation of neurobiological
pathways (Auriacombe et al., 2001). Efficacy can therefore be maintained with less
frequent dosing than methadone, as reported by patients B1-B4 in this study. The
bioavailability of buprenorphine is lower than methadone with much of it lost during
first pass metabolism therefore it is administered sublingually rather than orally,
allowing diffusion into the tissues under the tongue. Therefore, lower doses of
buprenorphine are required in comparison to methadone, as demonstrated in table 4.1.
It can potentially increase the number of patients seen by a single clinic as the number
of visits required is decreased (making it more convenient for the patient) and the need
for take-home doses is lessened. Accumulation of the drug should also be less likely.
At high doses the euphoric effects are low thus it has potential in the long-term
treatment of opioid dependence as a substitute but also in the short-term management of
withdrawal (Walsh and Eissenberg, 2003). In France it has been used as a substitute
therapy since 1996 with less monitoring required than that associated with methadone
therapy because it is only available from specialised centres. It does however carry a
greater risk of adverse effects and diversion than methadone. In 2001, Auriacombe and
co-workers estimated that there were 1.4 times more buprenorphine-related deaths in
France during 1994-1998 than those due to methadone however, to put this in
perspective, 14 times more patients received buprenorphine than methadone. It was
found in the current study that 75% of the patients receiving buprenorphine were also
prescribed diazepam which was similar to those having received methadone long-term
however only four patients were recruited from this treatment group.
Despite the widespread recreational use of impure heroin, research has shown the
potential of pure heroin as a means of treating illicit heroin use. Studies performed in
Switzerland (Rehm et al., 2001) suggested 70% of individuals treated with pure
injectable heroin can be retained on the treatment over a year which may make it a
useful alternative treatment in those where MMT is unsuccessful, as was the case for
patient H1. It was found that this heroin-assisted treatment was more effective than
methadone and a feasible treatment for reducing physical, mental and social problems.
However, the research did not account for any psychological treatment received by
patients. A more recent German study (Haasen et al., 2007) subsequently examined the

112
effectiveness of medically prescribed heroin and supervised heroin injection in an open-
label randomised controlled trial while addressing the problems identified in the Swiss
study. Some of the participants had not responded sufficiently to MMT and others were
not in a drug misuse program. It was found that heroin-assisted treatment of people
with severe opioid dependence and treatment resistance, had significantly improved
health and decreased illicit drug use than MMT individuals, supporting the results seen
by previous studies like Rehm et al. (2001) and Perneger et al. (1998). Pilot studies
undertaken in England and the Netherlands indicated the combined prescription of pure
heroin and methadone could provide a 25% improvement in physical and mental health
compared to methadone alone (SACDM, 2007). Recently news headlines indicated the
Scottish government have been contemplating the introduction of pure heroin treatment
and clinics where users can inject heroin safely.
As can be seen from the tables in section 4.1, despite receiving substitute treatment,
patients are often discovered to continue a degree of illicit heroin drug use, certainly in
the earlier stages (T and HR). Such behaviour is partly expected due to the low doses of
methadone administered during the initial titration phase while treatment teams
determine the degree of tolerance possessed by a patient - the doses are rarely sufficient
to prevent the onset of withdrawal symptoms. However it is important that treatment is
administered in this manner and patients are closely monitored because - although the
effects of methadone take a number of days to be expressed - the drug slowly
accumulates in tissues therefore additional opioids can exacerbate its effect potentially
causing overdose.
Heroin addicts are also commonly reported to co-abuse BDZs, particularly
flunitrazepam (Woods and Winger, 1997; Peles et al., 2007) probably due to their anti-
anxiolytic properties; individuals often become extremely anxious as part of
withdrawal. In one study 35-41% of patients undergoing MMT reported use of BDZs
three or more times a week (DuPont, 1988). Therefore, when undergoing substitute
therapy patients are often prescribed a BDZ e.g. diazepam in an attempt to treat both
addictions; unless the patient is pregnant in which case diazepam should not be
administered as it is known to cause birth defects (Laegreid et al., 1992). Similar
treatment regimens with both a substitute opioid and a BDZ were recorded for the
patients recruited in this study. More than half the patients, for which data was
available, were prescribed diazepam, the majority receiving approximately 5mg along

113
with their daily methadone dose. As a BDZ, it enhances the activity of γ-aminobutyric
acid (GABA), causing sedative effects which help stabilise the patient’s sleep patterns
and – alongside other drugs including the anti-psychotics chlorpromazine and
olanzapine - it has anxiolytic properties. Darke and Ross (1997) administered the BDZ
diazepam (10 or 20mg per 70kg) to patients on MMT and found that their subsequent
methadone consumption was reduced, supporting earlier research by Preston et al.
(1984) where a combination of diazepam and methadone enhanced the opioid effects.
Thus less opioid was required to achieve similar effects as that previously attained with
higher doses of methadone alone. When comparing the patients in the current study
there was no clear reduced dosing in those co-prescribed diazepam.
The TCAs, co-prescribed in some patients, are normally given to treat mood-disorders
such as depression. Euphoria is not the only effect produced by heroin, like other
opioids and the BDZs, its administration is correlated with the occurrence of depression
in frequent users (Havard et al., 2006) perhaps explaining why certain individuals
require a TCA alongside their opioid substitute.
While the current study was interested in the possibility the efficacy of methadone was
affected by the presence and structure of a specific protein in the blood, it was only
possible to compare patients receiving opioid-replacement therapy to a ‘normal’ healthy
population. A useful comparative group would be heroin dependent individuals whom
are not receiving therapy to determine whether any effects detected in the patients were
a direct result of therapy or perhaps due to underlying stresses associated with the prior
illicit drug use. This was impossible in the current study. Instead the structure and
level of AGP isolated from patient blood was analysed, its ability to bind methadone
determined and compared to all other patients and a ‘normal’ healthy population.
Results pertaining to these studies are described in the following chapters.
SUMMARY STATEMENT
Numerous opioids can be utilised as substitutes in the treatment of opioid dependencies.
Methadone is the most commonly prescribed in the UK with huge variability in doses
required to prevent withdrawal symptoms. Increasing our understanding as to why
methadone may be less effective in certain individuals is important and investigated
further in the following chapters.

114
Chapter 5
AGP isolation and level determination
Results and Discussion

115
5.1 Introduction
5.1.1 Isolation of AGP
Prior to the 1980s it was commonplace to disregard sugar components during
investigations into the functions performed by glycoproteins - instead interest was
focussed on the underlying polypeptides which were more easily analysed. It is now
well established that glycans are vital in the determination of overall structure and
subsequent function of these biomolecules, often uniquely altered during some
physiological and pathophysiological states. Thus it is not only the hepatic synthesis of
AGP which is augmented during the APR. Consequently, a prerequisite of studies
investigating the structure and subsequent roles of glycoproteins like AGP is that their
in vivo glycan structures must remain uncompromised during isolation from other
plasma proteins.
Despite the availability of a number of well documented isolation techniques developed
for proteins and glycoproteins, the majority require harsh acidic conditions thereby
causing a loss of glycan structural integrity - desialylation and other forms of
degradation common under acidic conditions. In the first reported methods for AGP
isolation, described by Schmid (1950) and Weimer et al. (1950), ammonium sulphate
was used to precipitate AGP at low pH. The first large-scale fractionation of AGP-
containing Cohn Fraction V supernatant, described by Hao and Wickerhauser (1973)
also implemented acidic conditions to promote the removal of HSA. AGP became
bound to diethylaminoethyl (DEAE)-Sephadex and the DEAE elate was then introduced
to a carboxymethyl (CM)-cellulose column to allow separation of the Cohn Fraction V
by ion-exchange chromatography. Before these techniques, AGP had often been
contaminated with HSA, its removal is therefore important especially as HSA generally
represents the main proportion of plasma proteins - over 50% (by weight) - thus
complicating isolation of other proteins, especially if they share similar MW or charge.
In 1978 Plancke et al. implemented ion-displacement chromatography, gel filtration
chromatography and ion-exchange chromatography to purify AGP, a method later
repeated by Albani et al. (2000). In the preparation of the glycopeptides from AGP, the
116
samples were in brief contact with HCl. Therefore to ensure the structure remained
unchanged, the use of methods similar to those cited was discouraged.
Methods like those utilised in this study where AGP isolation and purification was
undertaken without the use of acids, were previously employed in the mid 1980s by
Laurent and colleagues (1984), using a three-stage purification procedure; Cibacron
Blue F3GA and Procion Red HE3B pseudo-ligand chromatography columns followed
by isoelectric focusing (IEF). HSA was removed through strong interactions formed by
its bilirubin binding sites to the Cibacron Blue resin. It had previously been suggested
by Wilson and colleagues (1976) that weak interactions were formed with hydrophobic
fatty acid-anion-binding sites or dinucleotide-binding domains. IgA, IgG,
ceruloplasmin, most transferrin and prealbumin were then removed during passage
through the Procion Red column with NaOAc buffer. Any remaining contaminants
were eliminated by isoelectric focussing (IEF) to ensure the final 88% AGP yield
obtained was of enhanced purity as indicated by gel electrophoresis and
immunoelectrophoresis. ConA crossed affinity immunoelectrophoresis (CAIE)
demonstrated that the glycans remained intact with no loss of structural integrity -
probably because acids were not required.
Both Cibacron blue and Procion Red sepharose columns were fundamental to the
methodology reported by Smith and colleagues (1994). However, eluent from the Blue
column was passed through a Q-sepharose column before its introduction to Red
sepharose in an attempt to improve the purity of isolated AGP. The intermediary Q-
sepharose column removed α1-antitrypsin (AAT) by anion-exchange chromatography
thus reducing potential contamination. They considered this a useful alternative to the
Laurent method, the results of which they were unable to reproduce. Purity was
demonstrated through the use of SDS-PAGE and immunodiffusion; indicating the
presence of AGP at each stage and the efficiency of the purification process.
Therefore, in terms of glycan analysis, isolation through low pressure chromatography
has proven efficiency; the absence of acidic conditions prevents any structural
degradation. The levels of isolated AGP can then be determined; values thus
representing only the glycoprotein, not other contaminants. Although other
methodologies may provide a greater yield, they also risk altering the glycosylation of

117
AGP, rendering them useless when glycan structure is the primary focus of studies such
as that detailed herein.
5.1.2 Level determination
It is well understood that the hepatic production of AGP, a positive acute phase protein
(APP), increases during the APR. The levels present under ‘normal’ disease-free states
can rise 2-5 fold during conditions such as rheumatoid arthritis and cancer (Fournier et
al., 2000).
In order to perform comparative studies of the structure of AGP between different
groups of individuals, it was important to determine the level present in an isolated
sample. The volume required to ensure mass consistency in each analysis could then be
determined. If not, it would be impossible to ascertain whether variations were
structural or due to disparity in the level of AGP between samples.
There are numerous techniques utilised in the determination of AGP concentration.
Commonly an immunoturbimetric assay technique was used by the group (French et al.,
2002) which relies on the spectrophotometric measurement of the formation of an
immunoprecipitate with AGP antiserum at 340nm. However, these studies were
indulged by the availability of large volumes of sample which could be distributed to
other groups for the relevant analyses. Alternative means were sought in the current
study to accommodate the sample availability. It was shown that absorbance of AGP is
dependent on the Beer Lambert Law (Albani, 2004) thus absorbance values of AGP
standards at 280nm (primarily due to Trp residues) can be used to produce standard
curves and determine the relative level of AGP isolated from blood samples.

118
5.2 Results
5.2.1 Isolation and purification of AGP from samples
For the purpose of this study, an adapted form of the large-scale low pressure
chromatography procedure established by Smith et al. (1994) to isolate and purify AGP
from patient blood samples was used, thereby conserving structural integrity through
the absence of acidic buffers. Cibacron Blue 3GA and Procion Red CL6B sepharose
columns were used but the Q-sepharose intermediary step was removed to minimise
loss of AGP. SDS-PAGE and Western Blots were performed to indicate that the two
column technique preserved AGP purity, as reported in the following section (5.2.2).
Upon precipitation with PEG3350, AGP isolation and purification was initiated by
introducing the remaining soluble proteins to a Cibacron Blue 3GA Sepharose low-
pressure chromatography column. The first fraction, containing AGP, eluted after
approximately 5 minutes and was illustrated by the chart recorder as a peak extending
from the baseline (figure 5.1a). The fraction was collected until the baseline was
retained, usually within 45- 55 minutes. Removal of HSA bound to the Cibacron Blue
Sepharose beads by desorption buffer was represented by the second peak (figure 5.1a).
Complete column regeneration occurred within approximately 30 minutes. The
concentrated fraction collected during the previous stage was applied to the Red
Sepharose CL-6B column. The first AGP-containing fraction eluted within
approximately 10 minutes of application and, again, was represented by a peak (figure
5.1b) which required roughly 20 minutes to elute. Impurities such as α1-antitrypsin
(AAT) were removed from the sample, binding to the column. They were eluted upon
application of a cleaning buffer and represented by the smaller peak (figure 5.1b)
allowing regeneration of the column after approximately 40 minutes.
All samples were desalted and concentrated using Amicon or Centricon filter devices to
prevent sample contamination and any subsequent interference with the absorbance of
AGP at 280nm during spectrophotometry which was used to calculate the relative AGP
level isolated from samples.

119
a)
b)
Figure 5.1. Traces generated during the isolation of AGP by low pressure
chromatography using a Cibacron Blue Sepharose (a) and Red Sepharose (b) column.
collection started collection stopped
0
10
20
30
40
50
60
70
80
90
0 20 40 60 80 100 120
Ab
sorb
ance
at
28
0n
m
Time (mins)
0
10
20
30
40
50
60
70
80
90
100
0 10 20 30 40 50 60 70
Ab
sorb
ance
at
28
0n
m
Time (mins)
Collected fraction
Sample Desorption
buffer
Collected fraction
Sample Cleaning
Buffer
Albumin peak
AAT peak

120
5.2.2 Evaluation of isolated AGP purity
Isolated and purified AGP was analysed using SDS-PAGE and Western Blots to
determine the effectiveness of the two-column low-pressure chromatography technique.
It was necessary to ensure that the adaptations made to the large-scale methodologies of
Smith and colleagues (1994) did not compromise the final purity of the glycoprotein.
The Coomassie brilliant blue-stained SDS-PAGE gel and Western Blot (figure 5.2a and
b respectively) indicated that PEG3350-precipitated blood samples contained numerous
highly soluble proteins, demonstrated by a number of bands in lane 2. HSA, ATT and
AGP are the three most common (MW 67, 52 and 41-43kDa, respectively). The
inclusion of commercial AGP (lane 1) in the analysis further supported the presence of
the glycoprotein in the PEG3350-precipitated and isolated samples; each lane contained
a band which migrated the same distance, corresponding to the ladder marker at
~43kDa. The two isolated samples tested (which had also been desalted), appeared to
be relatively pure; only one band was present in lanes 3 and 4 with no others evident.
On performance of the Western Blot using anti-AGP antibody, the bands present in
lanes representative of isolated and desalted samples were confirmed to be AGP.
Importantly, the SDS-PAGE performed in this study was used only to determine
whether AGP was successfully isolated using the techniques of section 2.2.2.2;
indicated through a reduction in the number of bands visualised when compared to the
PEG-precipitated sample (lane 3). The band densities could not be used as a means of
determining whether the mass was compromised during isolation. Although the same
level of AGP was used for the commercial and isolated samples, it was not possible to
determine the specific level of AGP present in the supernatant of PEG-precipitated
protein.
Overall, the use of an SDS-PAGE and Western Blot indicated that the isolation process
generated pure AGP and therefore the two-stage low pressure chromatography was a
valid technique at the micro-scale. Analysis of the eluted components after each stage
of isolation was deemed unnecessary as the final isolated samples showed no indication
of contamination by other proteins. Also, the group recently implemented
immunodiffusion to indicate that albumin was removed by the Blue sepharose column
and most of the remaining contaminants like AAT, by the Procion Red column

121
(Gallacher, 2010). Subsequent spectophotometric analysis at 280nm, the results of
which are provided in the following section, therefore allowed the level of AGP present
in samples to be determined. The absence of contaminating trace proteins assured that
values were not skewed.

122
a)
Ladder 1 2 3 4
b)
ladder 1 2 3
Figure 5.2. The effectiveness of low pressure chromatography in isolating and
purifying AGP as shown by a) an SDS-PAGE gel and b) a Western Blot with anti-
AGP. Ladder – ladder of MW markers, lane 1 – Commercial (Sigma) AGP positive
control, Lane 2 - PEG-precipitated normal blood sample; Lane 3 - isolated AGP sample
no.1; Lane 4 (SDS-PAGE only) - isolated AGP sample no.2.
43kDa
42.7kDa
66.4kDa
55.6kDa
97.2kDa

123
5.2.3 AGP level determination
Absorbance values of the commercial AGP standards (0-3mg/mL, n=5) at 280nm,
produced a line of best fit (figure 5.3) with equation y = 0.8316x (R²= 0.99). Table 5.1
summarises the level of AGP isolated from normal blood samples pooled by the blood
transfusion service (n=4), those from ‘normal’ serum samples obtained from an
unknown group of elderly patients (n=4), and from each patient undergoing various
stages of opioid replacement therapy (n=26). The values were reported as the sum of
four 1mL blood aliquots, the mean in each aliquot and finally the difference in the level
of AGP per mL of blood compared to that isolated from ‘normal’ blood. Samples were
separated into more manageable 1mL volumes to ensure that if errors in the isolation
procedure occurred, the whole sample would not be compromised. Statistical analysis
of the difference in level between each patient group and a ‘normal’ population was
undertaken with two sample t-tests.

124
Figure 5.3. Standard curve produced using commercial AGP (Sigma-Aldrich)
standards (n=3). R2>0.9. Relative amount of AGP in a sample (x):
x = Abs at 280nm/0.8316.
0
0.2
0.4
0.6
0.8
1
1.2
1.4
1.6
1.8
2
2.2
2.4
2.6
0 0.5 1 1.5 2 2.5 3 3.5
Ab
so
rba
nc
e a
t 2
80
nm
Commercial AGP concentration (mg/ml)
y = 0.8316x (R2 = 0.99)

125
Sample Mean level of isolated
AGP (mg/mL)
Level compared to
1mL normal blood
Normal pooled blood 1 ۩ 0.076 -
Normal pooled blood 2 ۩ 0.080 -
Normal pooled blood 3 ۩ 0.066 -
Normal pooled blood 4 ۩ 0.081 -
Normal pooled blood 5 ¥ 0.072 -
Normal pooled blood 6 ¥ 0.084 -
Normal pooled blood 7 ¥ 0.086 -
MEAN normal blood 0.078 -
T1 0.337 +0.261
T2 0.141 +0.065
T3 0.248 +0.172
T4 0.131 +0.055
T5 0.175 +0.099
MEAN T group 0.210*
HR1 0.227 +0.151
HR2 0.169 +0.093
HR3 0.258 +0.182
HR4 0.143 +0.067
MEAN HR group 0.190*
LT1 0.152 +0.076
LT2 0.125 +0.049
LT3 0.333 +0.257
LT4 0.196 +0.120
LT5 0.208 +0.132
LT6 0.173 +0.097
LT7 0.083 +0.007
LT8 0.078 +0.002
LT9 0.172 +0.096
LT10 0.113 +0.037
LT11 0.132 +0.056
MEAN LT group 0.163*
B1 0.111 +0.035
B2 0.168 +0.092
B3 0.272 +0.196
B4 0.231 +0.155
MEAN B group 0.138*
D1 0.178 +0.102
MEAN D group 0.178
H1 0.078 +0.002
MEAN H group 0.078
Table 5.1. Summary of the levels of AGP in blood samples.
*p<0.05, ۩ isolated from same source and using same techniques as patient
samples. ¥ Data obtained from previous studies (unpublished).
126
The mean level of AGP in each group was also highlighted in table 5.1 and graphed in
figure 5.4 to summarise the differences in expression between groups of individuals.
Approximately 0.08mg/mL AGP was isolated from the healthy ‘normal’ blood group;
this was significantly lower than that isolated from ‘normal’ serum. However, values
derived from the blood samples were deemed the most appropriate representation of a
‘normal’ population when compared to that from serum and commercially sourced
AGP.
The T, HR, LT and B treatment groups expressed significantly higher levels of isolated
AGP than that in a ‘normal’ population (p<0.05). Recruitment of a single patient from
the D and H treatment populations rendered statistical analysis somewhat uncertain as it
was unknown if the values were representative of the groups as a whole. The
parametric two-sample t-test could not be applied using single values. When a one-way
ANOVA with Tukey’s post hoc test was performed to allow all groups to be compared
to one another, not just to the ‘normal’, the H1 and D1 individuals were included. No
significant difference in the levels isolated were identified between the treatment groups
(p>0.1), excepting H1. The level of AGP isolated from the single patient receiving
heroin (0.078mg/mL) was indistinguishable from the ‘normal’ group (0.076mg/mL).
Finally, the levels of AGP within each group were similar; no statistically significant
difference was found between the patients within a single group.
In summary, the levels of AGP isolated from patients undergoing T, HR, LT and B
opioid-replacement therapies were significantly higher than that from a ‘normal’
population but showed no significant variation from each other. Despite the indication
that H1 expressed significantly lower levels of AGP than other treatment groups, a
single sample was not deemed reliable enough on which to base conclusions.

127
a)
b)
Figure 5.4. Summary of the mean level of AGP isolated.
from a) all treatment groups and b) patients at different stages of methadone therapy.
* statistically different to ‘normal’ blood (p<0.05).
0
0.05
0.1
0.15
0.2
0.25
0.3
Leve
l of
AG
P (
mg/
mL)
0
0.05
0.1
0.15
0.2
0.25
0.3
Normal blood Titration HR Long term methadone
leve
l of
AG
P (
mg/
mL)
*
*
*
*
*
*
*
Treatment group
Treatment group

128
5.3 Discussion
As described by Gelpi (2003), both purity and integrity of biologically active analytes
are the most important prerequisites in structural and functional studies. It was
therefore essential that the glycoprotein of interest to this study (AGP) was isolated
from patient samples using methods which retained its structural integrity. Although
methods available for the isolation of AGP from blood or plasma are plentiful, many of
these utilise harsh acidic conditions which can compromise the structure of the glycans.
These are therefore unacceptable as any results pertaining to subsequent structural
analysis would be erroneous - in order to determine the degree of branching of AGP
glycans for example, SA residues must remain intact which is unlikely at low pH.
Therefore, low pressure chromatography (based upon the Smith et al., 1994 method)
using two consecutive columns was implemented without the need for harsh acidic
conditions; it was also sufficiently sensitive to isolate AGP from other plasma proteins.
Despite the common use of SDS-PAGE in isolating specific proteins from samples with
variable content (Zdebska and Koscielak, 1999), the acidic conditions rendered it of use
only when testing the purity of fractions eluted from the low-pressure chromatography
columns in this study. The small masses required were sacrificed from the ‘normal’
blood sample to ensure the techniques were effective in generating pure AGP before
patient samples were subjected to the treatment. The Western Blot (figure 5.2b)
confirmed that the single band in lane 3 (figure 5.2a) was AGP as the same sample was
run in both SDS-PAGE and Western Blot. AAT, which had previously been shown to
be present in trace levels by Gallacher (2010), was not found during this study; a band
in lanes 3 and 4 of the SDS-PAGE gel (figure 5.1) corresponding to its molecular
weight (approximately 67kDa) would have been expected had it been a contaminant. Its
absence was important in this study as it too is a glycoprotein therefore it could have
affected structural analysis. Other contaminants could include albumin with a molecular
weight of approximately 67kDa; the presence of either of the proteins would have
suggested incomplete removal by the blue and red sepharose columns respectively.
However the absence of bands corresponding to the MW of the protein in lanes 3 and 4
of the SDS-PAGE gel (figure 5.1) suggested there was no such contamination.
129
The Western Blot appeared to indicate other proteins or contaminants were present on
the membrane in addition to AGP that were not picked up by the coomassie stain (the
amount of protein was probably below detectable levels). Due to the nature of the
antibody used, non-specific binding was possible; polyclonal antibodies are not directed
towards AGP solely. Also, it is possible that not all proteins were transferred onto the
membrane, affecting the clarity of the blot and as experiments were preliminary, the
protocol requires optimisation. Restaining the gel to confirm the transfer of AGP would
potentially allow this to be taken into consideration.
As anticipated, the PEG-precipitated sample generated numerous bands because the
polymer does not exhibit specificity to a single plasma protein. PEG 3350 was used at
40% w/v to separate soluble proteins like AGP from less soluble proteins and blood
cells. Proteins precipitate in its presence because the water soluble polymer boosts the
number of protein-protein interactions by drawing water molecules away from the
protein; when these interactions become sufficiently extensive, the protein can no longer
dissolve and therefore they concentrate – or ‘precipitate’ (Ingham, 1990). An additional
quality of PEG was that it does not denature the proteins it comes into contact with,
which is extremely important if the in vivo structure is to be maintained. A sample
which had been precipitated with PEG3350 was included in the blot to demonstrate the
success of two-stage low pressure chromatography in removing other soluble proteins,
leaving a single anti-AGP reactive band in the lane 3 representing samples from which
AGP had been isolated. Commercial AGP was included as a control, migrating the
same distance as corresponding bands in the other lanes. It was not deemed necessary
to analyse the eluted samples after each stage of low-pressure chromatography because
the final isolated sample was shown to be AGP thus the technique was effective.
Isolated samples were run in the desalted form to reduce any possibility that the
presence of salt (primarily introduced by sodium acetate buffer) could interfere with the
migration of the proteins. It was removed by Amicon or Centricon filter devices
(molecular weight cut off 10,000Da); molecules greater than 10kDa (AGP) are collected
on the filter while those with a lower MW (including the salt) dissolve in HPLC-grade
water and pass through the filter, thus removing them from the sample.
The potential of Cibacron Blue sepharose in HSA removal from serum has been
acknowledged for decades; Travis and colleagues (1976) reported that 98% of HSA

130
could be removed from a sample through its use – sodium thiocyanate (NaSCN) is
required to cause desorption and collection of the protein. Leatherbarrow and Dean
(1980) showed this was possible because the dye binds to the bilirubin binding sites of
HSA – like bilirubin, cibacron blue contains planar aromatic ring systems with negative
charges in analogous positions. A similar interaction was not found for other serum
albumins sourced from bovine, horse or rabbit; instead a low level of binding occurred
at long-chain fatty acid binding sites in these species. It should be noted that Cibacron
blue is capable of binding other proteins, not just HSA; in 1978, Angal and Dean
reported the elution of 11 proteins from the column using a pH gradient. For the
purpose of this study, the value of the Cibacron blue column was in the ability to
separate AGP from its common contaminant HSA, the latter formed interactions while
the former eluted unhindered.
Smith et al. (1994) indicated the removal of the protein by subjecting the first eluted
fraction to immunodiffusion, highlighting the presence of AGP and AAT but no HSA.
Subsequently, the second fraction representing the proteins which were bound to the
column surface was eluted and reacted with anti-albumin in immunodiffusion
experiments. Further research by the group using SDS-PAGE and immunodiffusion
indicated that PEG precipitation, low-pressure and dye-ligand chromatography with
Cibacron Blue Sepharose, Q-sepharose and Red Sepharose columns yielded pure AGP
(Smith et al., 1994; Elliott et al., 1997; Haston et al., 2003). However this was for
isolation on a relatively large scale and recently, it had been proposed that the slight
improvement in purity bestowed upon isolated AGP by the Q-sepharose column did not
justify the reduction in the level of protein isolated. Gallacher (2010) indicated that
when the Q-sepharose column was removed the AGP isolated was relatively pure with
virtually undetectable levels of contaminants in immunodiffusion; the blue and red
sepharose columns were still useful at the micro-scale. Although it was found that HSA
was incompletely removed after passage through the blue column, comparable to the
study by Travis and colleagues (1976), the subsequent use of Red Sepharose columns
removed additional HSA along with most other contaminants. The purity of AGP after
two-stage low-pressure chromatography was supported by the current study using SDS-
PAGE and Western Blots.
There have been other combinations of techniques described since the early 1990s
offering variable success in yielding pure AGP. Non-miscible solvent extraction

131
demonstrated potential in the isolation of AGP from serum (Kremmer et al., 1995) with
a recovery over 95%; however the actual yield was approximately 89% due to loss
during phase separation. Hervé and colleagues (1996) also utilised IEF techniques,
alongside Cibacron blue F3GA cross-linked to agarose and chromatography on
hydroxyapatite (buffers pH 5.8-5), achieving an 80% yield. Acidic conditions were not
required but the techniques used are more appropriate on a larger scale which was not
feasible in the current study.
More recently, low-pressure chromatography has demonstrated consistent effectiveness
in the isolation and purification of AGP e.g. Elliott et al. (1997), Jørgensen et al. (2002)
and Haston et al. (2003); although the exact methodology often deviates depending
upon sample availability. A similar yield to that of Hervé et al. (1996) was obtained by
Azzimonti et al. (2003) using a single-step precipitation with Cibacron Blue F3GA, but
use of acidic buffers (pH 4.0 and 4.95 respectively) render such a technique invalid for
investigations of this nature. It was however useful in the separation of the genetic
variants of AGP. To isolate AGP from patients with cancer and acute inflammation,
Szollosi and colleagues (2004) also implemented Cibacron blue F3GA dye-ligand
chromatography using Toyopearly AF-Blue HC-650M columns that had been
equilibrated with 10mM Phosphate buffer at a pH of 5.8, collecting UV detectable
fractions which were then desalted and lyophilised. They also compared methods for
isolating AGP; deducing that 100% recovery was feasible using solvent extraction and
precipitation while affinity chromatography, using a new generation of dye-ligand
phase, yielded over 85%. Ethanol was used by the group to eliminate the bulk of serum
proteins (mainly albumin), and/or solvents and low molecular contaminants.
Contamination of isolated AGP by salts primarily introduced during low pressure
chromatography would interfere with and skew the calculation of AGP levels because
they too absorb at 280nm, therefore affecting all subsequent analyses which were reliant
on the use of consistent masses of AGP to ensure valid interindividual comparisons.
The presence of salt could explain why the level of AGP in patient T1 (0.337mg/mL)
was considered higher than in other patients in this group; perhaps it was not completely
removed thus absorption figures were inaccurately high. However, later analysis of
glycan composition proved this not to be the case; the levels of components were not
significantly low in comparison to other glycans of AGP samples which would be
expected if AGP was contaminated with salt (chapter 7). The high values may instead

132
be due to contamination by other proteins which also contain the Trp and Tyr residues
responsible for absorbance at 280nm. As most plasma proteins are glycosylated any
contamination would be problematic in structural analysis if wrongly assumed to be
AGP. The tests used to determine purity of AGP samples (section 5.1.2) indicated the
technique, which was common to all samples, provided pure AGP, thus contamination
by other glycoproteins was unlikely to be noteworthy. The patient must therefore
express a higher level of AGP.
Although the construction of a calibration curve with commercial standards was not the
most accurate way to determine the level of AGP in a sample, it was the most
appropriate considering the restrictions in place, such as sample availability.
Importantly, the terms ‘concentration’ and ‘level of AGP isolated’ were not used
interchangeably within this study because some of the glycoprotein may have been lost
during isolation and purification, therefore it was inaccurate to suggest that the levels
obtained were identical to the in vivo concentrations. As the same procedures were
implemented in the isolation and purification of AGP from all samples, the results
themselves were comparable. The partial desialylation which can occur during large-
scale isolation, like that used by Sigma-Aldrich (based on that originally described by
Hao and Wickerhauser, 1973), would not affect the reliability of the standard curve in
the determination of patient sample AGP levels because it is the Tyr and Trp residues of
the protein backbone responsible for absorbance at 280nm – which are unaffected
(Stoscheck, 1990). The correlation between absorbance and AGP level was
demonstrated by an R2
value >0.9.
Alternative methods used in the determination of AGP concentration include a
sandwich-type ELISA using antihuman AGP and horseradish peroxidise-conjugated
antihuman AGP (Hashimoto, 2004). Despite the requirement of minimal levels of
sample in techniques such as this and immunoturbimetric assays, it still reduces that
available for use in structural and drug-binding analysis. Spectrophotometry was useful
because it did not require the removal of any AGP or cause its degradation.
The levels of AGP determined in table 5.2 were found to be at least two-fold higher
which is comparable with the APR (Ceciliani and Pocacqua, 2007). In a clinical setting,
levels of C-reactive protein (CRP) are commonly used to gauge the expression of
inflammatory conditions. As described in section 1.2, the concentration of the class III

133
positive acute phase protein is increased during inflammatory conditions when the APR
is initiated. It is normally present at concentrations lower than 10mg/L but levels may
be amplified up to 1000-fold during the APR to bacterial infections, as described by
Clyne and Olshaker (1999). Although levels were not so grossly elevated in patients,
levels over 10mg/L supported the probability that an APR was expressed in the patients.
In some cases, the level of AGP appeared to be correlated to dose (summarised in
chapter 4). However it was not possible to include the titration phase patients within
this generalisation; the individuals commonly received low doses of methadone or
substitute opioid to allow for the accumulation and the continued administration of
illicit opioid sources. The risk of overdose is high during this stage so precautions must
be enforced. Patients with high levels of AGP in this group would perhaps be expected
to require higher doses of methadone to become stable due to its potential removal by
AGP; however such follow-up information was unavailable due to the nature of the
study.
The five samples taken from the titration phase participants indicated a significant
increase in the level of AGP isolated, perhaps a result of the APR. Commonly, in the
clinical setting, levels of C-reactive protein (CRP) are used to gauge the presence of an
APR – as described in section 1.2, the concentration of class III positive acute phase
protein is increased during the APR
Rostami-Hodjegan and colleagues (1999) reported that the levels of AGP in heroin
dependent individuals with signs of opiate withdrawal (a common problem in the initial
stages of therapy when methadone doses are kept low) were greater than in a drug free
population and also showed a higher proportion binding to the glycoprotein when
analysed ex vivo. Therefore over time, as treatment-related stresses are expected to
decrease, the stimulation of the APR may lessen in order to regain baseline homeostasis.
For example, anti-inflammatory cytokines may be released in order to stop the APR
(negative feedback) and therefore the levels of AGP stabilise or even decline during this
period; possibly explaining why patients LT7 and LT8 for example, had lower levels of
AGP – they have been maintained on the therapy for over 4 years and with generally
less chaotic lifestyles than those faced with the sudden change from short acting heroin
to long acting methadone. However, this was not true for the majority of other patients
in the LT group, with levels similar to those in the titration phases, thus there must be
other explanations. Perhaps a sustained response by the body to the xenobiotic

134
occurred, at least partly explaining why all patients had elevated levels. This would
also correlate with the fact that patients in LT therapy were often receiving high doses
of the drug to remain withdrawal-free even if a decrease was expected - AGP levels
may remain high as a mechanism to remove the drug from the system. A cycle could
ensue - like tolerance an increase in AGP in response to the drug could lead to the
requirement of higher doses if the drug binds with a high affinity, removing it from the
active concentration. Thus the levels required to induce the desired effect were not
attained. It may be possible that the stimulation of dopamine (DA) release during
heroin use causes an increase in the synthesis of AGP. DA is a neurotransmitter
commonly released during stress; perhaps the increase in production deceives the body,
causing further stimulation of an APR (Pruessner et al., 2004). The concept of drug
binding is described more thoroughly in chapter 8.
Alternatively, the elevated levels of AGP in patients may be completely unrelated to
stress or the presence of opioid substitute; smoking for example has been shown to
increase level of AGP (Benedek et al., 1984b). The possibility that factors such as
smoking may be responsible cannot be ignored and should be investigated in more
detail. Recruitment of non-smoking patients, in an already hesitant study population,
was near impossible.
It must therefore be acknowledged in studies such as this that various factors may be
responsible for the disparity seen in levels of AGP. Thus it would not be valid to
presume all data collected from analyses is due to the therapy alone.
SUMMARY STATEMENT
The level of AGP isolated from heparinised blood samples taken from a ‘normal’
population (the Blood Transfusion Service) differed significantly to that isolated from
patients undergoing various stages of opioid replacement therapy. The level between
treatment groups did not differ. If methadone exhibits considerable binding to AGP, the
increase in its expression detected may affect the drug’s efficacy. However, important
to the current study is that alterations in the glycosylation can affect the function of a
glycoprotein – this concept was investigated further in the following chapters.

135
Chapter 6
AGP Monosaccharide Analysis
Results and Discussion

136
6.1 Introduction
Certain physiological or pathological conditions can alter the structure of glycans
attached co- or post-translation to a polypeptide backbone thereby causing the
conformation of the glycoprotein to be incorrect, rendering it unable to perform the
functions normally attributed to the particular glycan expression. Structural analysis of
the glycan chains and their components (microheterogeneity) is therefore important.
Some of the monomeric units used in the construction of complex N-linked glycans,
like those in AGP, are exclusive to branches - for example galactose (Gal). These offer
potential indicators of altered branching if distinctly different between two populations.
A common technique for the analysis of glycan monosaccharide composition is
HPAEC-PAD, the use of which has been well documented since its conception (for a
recent review refer to Behan and Smith, 2010). Although a number of alternative
analytical methods are available to investigate glycan structural composition, including
lectin ELISAs (Rydén et al., 1999), nuclear magnetic resonance (van Halbeek et al.,
1981) and Mass Spectrometry (Imre et al., 2008), HPAEC remains one of the most
effective (Sim et al., 2009). The implementation of HPAEC in oligosaccharide analysis
of AGP is discussed in the following chapter, supporting the versatility of the technique.
Its use in this study was valuable as a means of providing sensitive analysis (it is
capable of detecting 10-100 picomolar quantities) without the requirement for large
samples or prior derivatisation as is the case in gas chromatography and other liquid
chromatography-based methods (Hardy et al., 1988; Townsend et al., 1989; Smith et al.,
1997). Techniques like MS are commonly undertaken offline due to the high salt
concentration of the mobile phase. However the coupling of the technique to HPAEC
has been reported (Okinaga et al., 1992).
Prior to separation by HPAEC-PAD, component monosaccharides must be released.
Commonly implemented are TFA and HCl for the cleavage of the different
monosaccharides respectively. Zdebska and Koscielak (1999) hydrolysed samples from
SDS-PAGE with 0.2M TFA for 1h at 80°C to release sialic acids, then 2M TFA for a
further 4h at 100°C – releasing the neutral sugars. Finally 6M HCl was utilised to
remove the amino acids maintaining the temperature at 100°C. TFA and HCl were also

137
used in the current study, in order to prepare the neutral and basic monosaccharides for
HPAEC-PAD analysis respectively - optimal conditions were discussed in chapter 3.
Analysis of the released monosaccharides by HPAEC required the use of a stationary
phase with high mechanical and chemical stability - usually a column with polymer
based pellicular resin, the active component of which is a quaternary ammonium ion
(for a recent review of columns available that allow selective analysis see Behan and
Smith, 2010). An alkaline mobile phase (0.03M NaOH) and detection by pulsed
amperometry were also important (McGuire et al., 1999). NaOH was used in an
isocratic gradient, to cause electrocatalytic oxidation of weakly acidic sugars, ionising
the hydroxyl groups (-OH) and forming oxyanions when the pH is 12 or higher (figure
6.1). There are therefore several potentially ionisable –OH groups and due to variation
in the position of these groups in monosaccharides, each exhibit different dissociation
constants (pKa 12-14). Anomeric –OH groups are the most acidic, the others follow a
hierarchy of acidity: 1-OH>2-OH>>6-OH>3-OH>4-OH. The strength with which
oxyanions bind to pellicular anion-exchange resins of CarboPacTM
PA-100 columns
commonly used in HPAEC analysis to separate monosaccharides, subsequently depends
on their pKa values; those with higher pKa form weaker interactions with the resin and
are therefore eluted more easily (Lee, 1990; McGuire et al., 1999). Fuc oxyanions for
example have a high pKa and are therefore less well retained compared to Man thus
they elute early in a chromatogram. Sugars expressing anomeric -OH groups are less
well retained than essentially the same sugar with normal -OH groups at this position;
this effect is exemplified by the long retention times of inositols which do not contain
anomeric -OH groups. Generally, the greater the collative negative charge of a
monosaccharide, the stronger the interaction formed with the column.
Fouling of the gold electrode occurs as the oxides build up and form a coating.
However the addition of PAD in the 1980s, as first documented by Rocklin and Pohl
(1983) and highlighted during research by the Johnson group (Neuburger and Johnson,
1987; Johnson et al., 1992), was shown to vastly improve the technique. Pulsed
potentials (figure 2.1, chapter 2) allow oxides to form as the potential is increased but
follow this by lowering the potential to remove the layer of oxide from the electrode
surface. Therefore, reproducibility is ensured as the electrode is constantly ‘cleaned’.

138
Figure 6.1. Oxyanion formation at C1 (mannose). The presence of NaOH causes basic
separating conditions (pH 13) where the monosaccharide oxyanion interacts with positively
charged Na+ ions until it is introduced to the positively charged resin. The strength of interaction
– based on the negative charge of the monosaccharide – determines when it will elute.
OH
H2O
O
OH
OH
HO
HO
CH2OH OH on anomeric
group is
most acidic
O
δ+
δ-
O
HO
<
Na+
Introduction of
NaOH before
injection into
column
NaOH
O
OH
HO
HO
CH2OH
H
+
O
HO
O
OH HO
CH2OH
-
Anion-exchange
column -
+
+
+
+
+ +
+
+ + +
+
+
+ +
+
O Na
OH HO
CH2OH
-
Na +
Association formed
with Na+ periodically
Preference for the positively
charged resin
+
+
+ +
+

139
6.2 Results
In any study of the structure of glycans it is important to ensure efficient cleavage and
subsequent separation of components - degraded or un-cleaved monosaccharides are not
detected, thus compromising the accuracy of the analysis.
HPAEC separation of two mixtures of standard monosaccharides is shown in figure
6.2a and 6.2b; the former a mixture of monosaccharides common to glycans in general
and the latter those representing the components of complex N-linked glycans. The
traces demonstrated the ability of the technique to separate stereoisomers; isomers that
differ in the orientation of their atoms in space e.g. Glc and Man (figure 6.2a), the
structures of which were illustrated in figure 1.1 (refer to section 1.1.2, chapter 1).
HPAEC resolves monosaccharides, which can be identified by the ratio of their
retention times in relation to that of an internal standard (2-deoxy-D-galactose).
Standards for GlcNAc and GalNAc were glucosamine (GlcN) and galactosamine
(GalN) respectively, representing the deacetylation of the N-acetylated hexosamines
which occurs during acid hydrolysis with HCl and subsequent HPAEC under alkaline
conditions (NaOH).
However, as mentioned, Glc and GalNAc are not routinely present in N-linked complex
glycans - AGP was no exception. The retention ratios of the unknown peaks generated
on separation of commercial AGP glycan monosaccharide components (figure 6.3) with
the IS were compared to those generated during the separation of six standard
monosaccharides (figure 6.2a) and no values were ascertained to represent Glc or GalN.
Therefore, a mixture of five monosaccharides Fuc, IS, GlcN, Gal and Man were used as
a standard solution injected prior to samples; not only ensuring the effective operation
of equipment, but also to assist in the identification of peaks generated upon HPAEC
analysis of samples (figure 6.2b).
Figures 6.3 and 6.4 demonstrate the need for separate use of TFA and HCl, the former
effectively hydrolysed neutral monosaccharides (figure 6.3a and 6.4a) but that of
GlcNAc (represented as a small GlcN peak) was incomplete. HCl (figures 6.3b and
6.4b) was required as investigated in greater detail in chapter 3.

140
a)
b)
Figure 6.2. Traces generated during HPAEC separation of a) a mixture of
monosaccharides common to glycoproteins, separating isomeric monosaccharides and
b) the 4 monosaccharides commonly found in AGP alongside an I.S.
Fucose (Fuc), 2-deoxy-D-galactose (I.S), Galactosamine (GalN), Glucosamine (GlcN),
Galactose (Gal), Glucose (Glc), Mannose (Man). Nano Culon (nC)
-100
0
100
200
300
400
500
600
700
800
0 5 10 15 20 25 30 35
nC
time (min)
-100
0
100
200
300
400
500
600
700
800
0 5 10 15 20 25 30 35
nC
time (min)
Fuc IS
GlcN
Gal Man
Fuc IS
GlcN
GalN
Man
Glc
Gal

141
a)
b)
Figure 6.3. Traces generated during HPAEC separation of a) neutral and b)
basic monosaccharides from commercial AGP alongside an I.S.
No Fuc detected at the expected retention time.
-100
0
100
200
300
0 5 10 15 20 25 30 35
nC
time (min)
-100
0
100
200
300
400
500
0 5 10 15 20 25 30 35
nC
time (min)
IS
IS
GlcN
GlcN Gal
Man
Solvent front

142
a)
b)
Figure 6.4. Traces generated during HPAEC separation of a) neutral and b)
basic monosaccharides from patient sample AGP alongside an I.S.
No Fuc detected at the expected retention time.
0
100
200
300
400
500
600
700
800
0 5 10 15 20 25 30 35
nC
time (min)
-100
0
100
200
300
400
500
600
700
800
0 5 10 15 20 25 30 35
nC
time (min)
IS
IS
GlcN
GlcN
Gal
Man

143
The denaturation of the peptide backbone and desialylation which occurs at low pH
does not hinder the analysis of glycan structure at this stage because the individual
monosaccharides of interest are uncompromised and removed from the protein.
Exclusion of terminal SA residues at this stage was unimportant; their presence was not
essential until the analysis of complete glycan chains (chapter 7).
Unknown peaks generated by HPAEC-PAD separation for each ‘normal’ heparinised
blood, commercial and patient sample were identified through comparison to those
obtained during separation of the mixture of standard monosaccharides (figure 6.2b).
Generally, every sample was analysed in triplicate.
To quantify the newly identified monosaccharides in patient (titration, HR, long-term
methadone, buprenorphine, DHC or heroin) and ‘normal’ heparinised blood samples;
standard curves were produced for Fuc, GlcN, Gal and Man (figure 6.5). Analysis of
each mass (0-5 µg) was repeated five times to determine the mean values and standard
deviations (error bars). The peak area data generated by HPAEC analysis indicated that
the area increased with mass of each monosaccharide. Each R2 value was >0.9
therefore there was a strong linear association between the two variables.

144
Figure 6.5. The five monosaccharide standard curves; mass of monosaccharide
versus the mean peak area values (n=5) - error bars signify the standard deviation. All
correlation coefficients (R2) >0.9.
R² = 0.9506
R² = 0.9031
R² = 0.9896
R² = 0.9928
0
50000000
100000000
150000000
200000000
250000000
0 1 2 3 4 5 6
aver
age
pea
k ar
ea
mass of monosaccharide (µg)
fucose Glucosamine Galactose MannoseFucose

145
Following the identification of unknown peaks in the HPAEC chromatograms generated
for all patient AGP samples, the relative mass of each monosaccharide present was
finally converted to moles of each sugar / mol AGP. Values were recorded as the mean
± standard deviation in table 6.1, 6.2 and 6.3 (‘normal’ heparinised blood; titration,
harm reduction and long-term phase patients; non-methadone therapies respectively).
This allowed comparisons to be made between the glycosylation of AGP expressed in
patient blood samples with that from a ‘normal’ healthy population. It must be
remembered that data for the glycan composition of commercial AGP and that isolated
from ‘normal’ serum was not included – as summarised previously in chapter 2, these
were not deemed adequate representatives of ‘normal’ AGP.
Four ‘normal’ heparinised blood samples were hydrolysed using the two acids
individually. All patient samples were similarly treated with the exception of LT3, LT9
(with HCl), B4 (TFA) and HR4 (HCl and TFA) where only single analysis for each acid
was possible.
Fuc was detected in some ‘normal’ heparinised blood samples. Other monosaccharides
common to complex N-linked glycans were detected in the patient, ‘normal’ and
commercial samples. Statistical analysis of the data was performed using one-way
ANOVA with a Tukey’s post hoc to allow comparison not only with a ‘normal’
population but also between treatment groups. Whether variation in the data generated
achieved statistical significance was indicated in table 6.2 and 6.3. The levels of the
monosaccharides in commercial AGP were greater (p<0.05) than those in AGP isolated
from ‘normal’ blood. Direct comparisons were not deemed adequately valid, despite
the analysis of consistent masses of AGP because the large-scale techniques used in the
isolation of commercial AGP differed to those used in this study. Therefore, in making
comparisons between patient samples and ‘normal’ populations it was considered more
appropriate to use the blood values as comparisons as they were isolated using a
common technique. Also, serum samples were donated by individuals who, although
known to be cancer free, were an elderly group and therefore may have an APR
expressed; the samples may not be an accurate representation of a truly healthy
population.
One-way ANOVA analysis indicated that the level of Gal and GlcN (GlcNAc in the in
vivo structure) were significantly greater in patients from the various stages of

146
methadone therapy (T, HR and LT treatments) compared to ‘normal’ blood (p<0.05)
which may suggest an increase in chain branching. The p-value was slightly improved
upon removal of the outlying value in GlcN analysis (representative of patient LT6)
however, significance was gained without its removal. Although some of the AGP
isolated from individuals receiving buprenorphine therapy displayed apparently higher
levels of the two monosaccharides than that in the ‘normal’ group, the values were not
found to reach significance upon statistical analysis.
The level of the two monosaccharides remained relatively constant within and between
treatment groups. Patient T1 and LT6 expressed higher levels of GlcN (also Gal in
patient T1) compared to other members of their respective groups, making the deviation
from the mean relatively high in comparison to other groups. Levels of Gal varied
between 3.87-5.97 mols/mol AGP, 2.55-4.47 mols/mol AGP, 3.27-4.63 mols/mol AGP,
2.24-4.06 mols/mol AGP for T, LT, HR and B treatment groups respectively. GlcN,
which is not exclusive to branches like Gal, was higher at 6.52-10.2 mols/mol AGP,
5.47-9.03 mols/mol AGP (both groups indicating a large variation about the mean due
to patients T1 and LT6), 6.70-8.84 mols/mol AGP and 4.99-8.99 mols/mol AGP in the
groups above.
Although patient D1 and H1 had a significantly lower level of Gal (p<0.05) than the
titration phase group but no significant differences in the level of either monosaccharide
to that of ‘normal’, it could not be known if these levels were representative of others on
the therapy thus it would have been inaccurate to assume so.
The level of Man was relatively consistent – no statistically significant differences were
found in the AGP of patient and ‘normal’ samples - suggesting the presence of
pentasaccharide core structures remained consistent and therefore, as required, the
approximate level of the glycoprotein analysed was equivalent; Man is only present in
core structures of complex N-linked glycans.
Therefore, as the only significant alterations occurred in the Gal and GlcN levels, there
was a suggestion of increased branching of glycans in the AGP of patients, although it
did not appear to be dependent upon stage or types of opioid replacement therapy as the
groups do not significantly differ to each other.
147
Mols monosaccharide/mol AGP
Sample Fuc GlcN Gal Man
Normal 1 0.0 2.55 2.36 0.905
Normal 2 0.57 3.7 1.02 0.98
Normal 3 0.7 4.27 2.41 1.22
Normal 4 0.0 3.86 1.47 0.75
Normal 5 ¥ 0.7 6.27 2.41 1.22
Normal 6 ¥ 0.55 4.62 2.23 1.08
Normal 7 ¥ 0.57 5.70 3.00 0.75
Normal 8 ¥ 1.29 5.60 1.29 0.60
Mean ‘normal’ heparinised
blood
0.32±0.37 3.60±0.74 1.82±0.68 0.96±0.20
Table 6.1. Monosaccharide composition of ‘normal’ AGP samples.
Mols monosaccharide/mol AGP
Sample GlcN Gal Man
Mean ‘normal’ heparinised
blood
3.60±0.74 1.82±0.68 0.96±0.20
T1 9.99±0.51▪ 8.24±0.46▪ 2.77±0.24
T2 6.79±0.87▪ 3.51±0.61▪ 1.53±0.33
T3 10.69±0.24▪ 3.65±0.26▪ 1.03±0.43
T4 7.45±0.08▪ 4.21±0.49▪ 1.65±0.05
T5 6.88±0.54▪ 4.99±0.10▪ 2.11±0.48
Mean T 8.36±1.84 ♦ 4.92±1.05 ♦ 1.82±0.66
HR1 9.24±0.31▪ 3.60±0.27▪ 1.14±0.02
HR2 7.63±2.04▪ 3.81±0.06▪ 1.44±0.09
HR3 7.22±1.02▪ 4.87 ª 2.07 ª
HR4 6.98* 3.51* 1.52*
Mean HR 7.77±1.07 ♦ 3.95±0.68 ♦ 1.54±0.47
LT1 6.21±3.82▪ 4.64±0.42▪ 2.17 ±0.13
LT2 4.03±1.02 ‡ 1.67 ª ‡ 1.00 ª
LT3 7.38 * 3.45±0.70▪ 2.60±0.19
LT4 7.08±1.95▪ 4.46±0.37▪ 2.21±0.07
LT5 5.56±0.43▪ 3.30±1.00‡ 1.12±0.20
LT6 10.57±0.36 ▪ 4.65±1.89▪ 1.93±0.22
LT7 7.95±0.76 ▪ 2.27±0.04‡ 0.49±0.02
LT8 7.38±0.51▪ 3.03± 0.41▪ 1.32± 0.09
LT9 9.62 * 3.52 ª 1.73 ª
LT10 7.08±1.95▪ 4.21±0.37▪ 2.01±0.16
LT11 6.92±0.49▪ 3.40±0.26▪ 1.98±0.05
Mean LT 7.25±1.78 ♦ 3.51±0.96 ♦ 1.45±0.96
Table 6.2a. Monosaccharide composition of AGP from ‘normal’ blood and
patients undergoing titration (T), harm reduction (HR) and long-term (LT)
methadone therapies.

148
Mols monosaccharide/mol AGP
Sample GlcN
Gal
Man
Mean normal heparinised blood 3.60±0.74 1.82±0.68 0.96±0.20
B1 9.62±0.51▪ 4.18±0.21▪ 1.11±0.09
B2 6.92±0.49▪ 1.97±0.35 0.56±0.18
B3 7.38±1.90▪ 3.31±0.07▪ 0.81±0.17
B4 4.03±1.02 3.13* 1.20*
Mean B 6.99±2.00 3.15±0.91 0.83±0.29
D1 3.81±0.9 3.26±1.00 1.38±0.58
H1 5.56±0.75 1.01±0.32 0.95±0.42
Table 6.2b. Monosaccharide composition of AGP from ‘normal’ and patients
undergoing Buprenorphine (B), DHC (D) and heroin (H) opioid replacement
treatments.
Data in tables 6.2a and 6.2b is reported as the mean number of moles of
monosaccharide / mole AGP ± the standard deviation (n=3). Exceptions are those
where the monosaccharide was only detected in a single run due to equipment
malfunctions (ª) or where there was insufficient sample to duplicate analysis (*). Mean
values for each group are highlighted in green; ♦ Mean value significantly different
(p<0.05) to ‘normal’ heparinised blood. ‡ Individual level expressed in patient glycan
not significantly different to normal. ▪ Level significantly different to ‘normal’ mean
value (p<0.05). ¥ Data obtained from analysis of monosaccharides during a previous
study using the same techniques.

149
The mean monosaccharide levels were then graphed in figure 6.6a however because
there was only a single patient representing the treatment groups for DHC and heroin,
these values were removed (figure 6.6b); it could not be known if they represented the
majority of patients on the respective therapies. To allow closer inspection of the
difference in the level of sugar in each group, a series of boxplots were created (figure
6.7), indicating the distribution of the sugar in each group and highlighting the outlier in
the LT group mentioned previously. Again, patients D1 and H1 were not included as
there was only one sample and therefore only variation in the levels detected in it, not
within a group. Both the graphs and boxplots illustrated the findings of statistical
analysis, with an apparent increase in the Gal and GlcN (therefore GlcNAc in the in vivo
structure) components in the methadone patients, suggesting an increase in the
branching of glycans in patients undergoing treatment for opioid dependencies.

150
a)
b)
Figure 6.6. Bar chart summarising the mean level of monosaccharide / mol AGP
in a) the separate treatment groups and b) in the different stages of methadone therapy,
where ‘normal blood’ represents heparinised blood from the Blood Transfusion Service
* Statistically significant difference compared to normal heparinised blood sample
(p<0.05) HR – harm reduction; LT – long term treatment. ‡standard deviation
calculated from triplicate analysis of a single sample while others were calculated from
data from more than one patient (n = 4/+).
0
2
4
6
8
10
12Fuc GlcN Gal Man
0
2
4
6
8
10
12
normal blood Titration HR LT methadone
Fuc GlcN Gal Man
Treatment group
Mol
mon
osa
cch
ari
de
/ m
ol
AG
P
Treatment group
Mol
mon
osa
cch
ari
de
/ m
ol
AG
P
*
*
*
*
*
*
‡
*
*
*
*
*
*
*
*

151
a)
long-termharm reductiontitrationnormal blood
11
10
9
8
7
6
5
4
3
2
Da
ta
Boxplot of normal blood, titration, harm reduction, long-term
b)
long-termharm reductiontitrationnormal blood
9
8
7
6
5
4
3
2
1
0
Da
ta
Boxplot of normal blood, titration, harm reduction, long-term
Figure 6.7. Box plot of monosaccharide distribution - a) GlcN (and by extension
GlcNAc) and b) Gal in AGP isolated from ‘normal’ heparinised blood, patients
undergoing titration, long-term methadone, HR and buprenorphine treatment for opioid
dependence.
mol
monosa
cchar
ide
/mo
l A
GP
m
ol
monosa
cchar
ide
/mo
l A
GP
152
c)
long termharm reductiontitrationnormal blood
3.0
2.5
2.0
1.5
1.0
0.5
Da
ta
Boxplot of normal blood, titration, harm reduction, long term
Figure 6.7 continued. Box plot of monosaccharide distribution c) Man in AGP
isolated from ‘normal’ heparinised blood, patients undergoing titration, long-term
methadone, HR and buprenorphine treatment for opioid dependence.
mol
Man
/m
ol
AG
P

153
6.3 Discussion
It is not only the in vivo concentration of AGP which can be altered as a result of the
APR, structural alterations may also arise in the glycosylation, potentially affecting the
ability of the glycoprotein to perform functions for which it was intended. Müller
(1989) reported that AGP glycans are not critical in the interaction with drugs at the
binding site and instead it is solely dependent on the formation of the correct tertiary
structure; describing the folding of the protein into its three dimensional structure which
is essentially determined by the sequence of amino acids (primary structure). However,
it has become increasingly understood that glycans play an important role in
determining the ability of glycoproteins to bind drugs and other ligands by ensuring the
correct folding of the polypeptide backbone and therefore without it, the binding site
would not form correctly. Therefore it is important to analyse glycan structures during
studies interested in the functions of glycoproteins, such as that undertaken and
documented.
Although cleavage of glycan chains into component monosaccharides does not allow
the exact sequence to be determined, they can provide an indication of structural
changes; especially when coupled to data gathered during analysis of the complete
glycans (chapter 7). Gal is a key example because its presence is limited to the
branches of complex N-linked glycans (Hashimoto et al., 2004). GlcNAc is another
however its levels have the potential to be misleading – it is not unique to the branches
of these structures as two residues also form part of each pentasaccharide core alongside
three Man (GlcNAc2Man3). As it is difficult to ensure the strong covalent interaction
between the innermost GlcNAc and the Asn residues of the polypeptide chain is
cleaved, an increase in its detection does not automatically denote changes in branching
but perhaps improved cleavage of this bond. Nevertheless, when levels are increased in
conjunction with Gal it is likely they signify structural changes in glycans.
Commercially sourced AGP was rendered an inappropriate representation of ‘normal’
AGP in this study because it was isolated using alternative methodologies to those
implemented in this study – adapted from the large-scale methodology developed by
Hao and Wickerhauser in 1973. All factors considered, it was deemed most suitable to
use AGP isolated from ‘normal’ blood as the source material and isolation techniques

154
were common to those for patient samples, reducing the number of factors which may
induce structural changes.
Results generated after acid hydrolysis and subsequent separation by HPAEC-PAD
indicated a significant change in the glycosylation of AGP in individuals receiving
methadone as an opioid replacement therapy compared to that from a ‘normal’ healthy
population. All had significantly greater levels of Gal and GlcNAc. In the
buprenorphine group, the levels appeared to be similar to the HR and LT groups but it
did not reach significance. Patients D1 and H1 expressed significantly lower levels of
Gal when compared to the titration group but there was no difference when compared to
those of the ‘normal’ population. Although the increased expression of Gal and
GlcNAc could infer increased branching, additional analysis of intact glycans was
required (chapter 7). It could not be established without said analysis whether
expression was a result of branching or perhaps elongation of the branches already
present. Unlike AGP isolated from ‘normal’ blood, the monosaccharide Fuc was not
detected in any patient sample. A negligible level or apparent absence of Fuc is typical
of the glycans expressed by the AGP in healthy individuals; its expression is generally
increased in pathophysiological conditions such as inflammation and cancer (Turner et
al., 1985; Listinsky et al., 1998).
Also, as was mentioned in section 6.2, no patient AGP glycans contained GalNAc or
Glc; this was expected as these monosaccharides are not associated with complex N-
linked glycans. Instead, GalNAc is a common constituent of O-linked glycans while
Glc expression generally targets the structure to the calnexin/calreticulin cycle because
it should be cleaved prior to transfer from the ER lumen to the cis Golgi (refer to figure
1.3, section 1.1.3.1).
The separate use of TFA and HCl in achieving optimal hydrolysis of neutral and basic
monosaccharides respectively had been discussed in chapter 3 with cleavage of Gal and
GlcNAc being especially improved. If the monosaccharides were not effectively
cleaved or became denatured, they would not have been detected during HPAEC
separation because formation of correct oxyanion structures would be hindered thus an
accurate picture of the glycan composition would not be obtained.
155
Zdebska and Koscielak (1999) reported that a low ratio of Gal or SA to Man in
glycoproteins may reflect either underglycosylation of the outer portions of glycan or an
excess of core Man. The current study suggested the opposite occurred in the AGP of
patients studied as there was always a high level of Gal compared to Man.
It must be remembered that although suggestions of altered branching after analysis of
this type were apparent, even if levels of Gal and GlcN were extremely high, it could
not be unequivocally ascertained whether this was due to an increase in the number of
branches or perhaps an increase in the length of the branches already present. Sialic
acid (SA) residues may provide more detailed information as the residues terminate
branches and therefore an increase in their presence suggests an increase in the number
of branches. However, it is well known that acid hydrolysis causes the SA of glycans to
become unstable and destroyed therefore undetected by HPAEC-PAD (Smith et al.,
1997). During monosaccharide analysis, it was sufficient to analyse the other
components because not only is it accepted that the majority of branches are terminated
by SA (if not, the exposure of Gal targets the structures for degradation or repair), but in
the following chapter, when complete glycans were analysed, the SA residues remained
intact to allow determination of the relative level of branching using HPAEC and an
ELISA.
The moles mono/mol AGP data was compared to determine whether any disparity
existed in the glycosylation of patient samples and ‘normal’ blood samples. Patients
T1, T3 and LT6 had the greatest mol GlcN/mol AGP however only T1 also had a higher
level of Gal compared to other individuals in the treatment group. Although the level of
AGP isolated from patients T1 and T3 (table 5.2) were relatively high (0.34 and
0.25mg/mL respectively) for the group, that of LT6 was comparatively similar to others
of the LT group (0.173mg/mL). An increased synthesis during the APR could not
explain the elevations in the monosaccharide because the analysis was performed on a
common mass of AGP (50µg) as calculated from the levels isolated thus any difference
could only be due to glycan expression. Support of this concept was provided by the
relatively consistent level of Man detected in all samples; the number of
pentasaccharide cores should not change.
Interestingly, the two oldest patients (LT4 and LT6 - 44 and 51 years old respectively)
presented high levels of Gal (4.46±0.37 and 4.64±1.89 mol/mol AGP respectively)

156
compared to other members of the group (mean 3.51±0.91mol/mol AGP) however, the
high standard deviation for LT6 demonstrated that the value was not necessarily as high
as first suggested. Only LT6 presented much higher than average GlcN levels
(10.57±0.36 mol/mol AGP), in fact this was the highest value out of all the patients, that
of LT4 was similar to the mean.
Various teams have indicated the presence of altered glycosylation of AGP with age
when individuals were considered healthy while others disagreed (Davis et al., 1985;
Veering et al., 1990). In those who suffer from inflammatory conditions, the incidence
of which often increases with age, the appearance of alterations in the glycosylation are
well documented (Smith et al., 1994; Rydén et al., 2001). It was therefore unlikely that
the alterations in AGP glycosylation suggested by HPAEC-PAD data were due to age,
especially as most participants had levels of GlcN and Gal consistent with others from
their respective treatment groups. Moreover, a study with only two patients >40 years
old does not provide enough data to ensure they are representative of this population.
Similarities were found between the single patient receiving pure heroin as a
replacement treatment and the ‘normal’ population, not only with respect to the level of
AGP isolated but also in the level of all the monosaccharides constituting the glycans,
and indicated that a change in type of drug administered may stimulate, or at least
augment changes in AGP glycosylation. H1 remained on a similar type of drug to that
which was abused - the stresses associated with factors such as a new drug dosage
regimen may have been more manageable and prevented the onset of an APR. Also, the
continuation with a similar drug, albeit in a more pure form, would not necessarily
stimulate a reaction as the body had become accustomed to it over the duration of illicit
drug use. However it could only be speculated upon as H1 was the only patient
undergoing such treatment. Rostami-Hodjegan et al. (1999) reported that individuals
abusing heroin had greater levels of AGP however these individuals were reported to be
exhibiting withdrawal unlike patient H1. Even if monosaccharide levels were similar, it
did not necessarily signify a common structure, merely that the overall composition was
analogous, the order and linkages binding the monomeric units could vary widely. Such
information could not be gathered using the technique described in this chapter.
There are no known studies which have investigated the potential that AGP
glycosylation may be altered in individuals undergoing opioid replacement therapy,

157
potentially affecting the efficacy of treatments. Therefore it was not known if the data
generated in this small preliminary study was representative of patients on the whole.
The results from monosaccharide analysis in this study have indicated that although
altered glycan composition of AGP did not appear to be associated with any particular
treatment stage, all methadone patients had a demonstrable change in glycosylation
hence there was potential that its subsequent ability to bind basic drugs like methadone
may have been affected, altering its efficacy. Prior determination of the glycosylation
of patient AGP may be useful when considering the type of therapy to be administered.
For example, if patient AGP expressed a high level of branching – as indicated by Gal
and GlcNAc residues – and this was found to be associated with increased binding to
methadone, it would be beneficial to consider an alternative therapy as high doses of
methadone would be required to allow for inactivation by AGP, subsequently increasing
the risk of toxicity.
It was important to perform subsequent analysis of complete glycans as it is the whole
structure which determines the ability of a glycoprotein to execute its functions.
SUMMARY STATEMENT
The monosaccharide composition of glycans cleaved from the polypeptide backbone of
AGP differs significantly (in terms of Gal and GlcNAc content) between that isolated
from ‘normal’ heparinised blood and from individuals undergoing various stages of
opioid replacement therapy. There was no significant difference between individuals
receiving methadone as a substitute. Results suggested an increase in branching
therefore additional oligosaccharide profiling was required – as discussed in the
following chapter.

158
Chapter 7
AGP Oligosaccharide Analysis
Results and Discussion

159
7.1 Introduction
Understanding the close relationship between the specific structure of AGP glycans and
the influence they have on the functions performed by the glycoprotein is paramount to
the hypothesis of this study.
HPAEC is a highly reliable method used in the detection and separation of glycans thus
it was implemented to separate those generated upon cleavage of the isolated AGP
samples by the enzyme PNGaseF. Similar to monosaccharide compositional analysis,
the separation of whole glycans relies upon the presence of weakly acidic sugars in a
basic media (pH13) which undergo electrocatalytic oxidation when in contact with the
gold electrode to form oxyanions. The conditions required for its optimal performance
differ slightly to account for the new analytes of interest. Along with negatively
charged terminal 9-carbon carboxylated SA residues (specifically N-acetylneuraminic
acid, NeuAc), the negative charge contributed by component monosaccharides under
alkaline conditions determine the strength with which the glycans interact with the
stationary phase - a pellicular anion exchange resin (ammonium-bonded beads)
ionically attached to large cation-exchange spheres. In the late 1980s Townsend and
colleagues demonstrated that glycans could be separated solely by the presence of SAs,
using relatively acidic pHs as low as 4.6 (Townsend et al., 1988; 1989). The formation
of oxyanions under strongly alkaline conditions enhances separation, allowing isomers
to be recognised as structurally distinct based on the differing pKa values of constituent
monosaccharides (Lee, 1990).
The sensitivity of HPAEC-PAD technology (shown to be 10-100pmol by Hardy and
Townsend, 1988) owes itself to the detection and separation of glycan chains in addition
to that of monosaccharide analysis. Again, the introduction of pulsed amperometric
detection (PAD) to HPAEC vastly improved the sensitivity of detection by ensuring
periodic decontamination of the sugar oxide coating which formed on the electrode
under the highly alkaline conditions. Throughout the late 1980‘s and early 1990‘s,
HPAEC was by far the most commonly used and sensitive technique available for
glycan structural analysis after enzymatic or chemical release of the oligosaccharides
from the underlying protein. One of the primary advantages of HPAEC-PAD was that

160
sensitivity does not require prior derivatisation to enhance hydrophobicity as is
necessary in many other techniques such as MS (Lee, 1990).
Removal of glycans bound to the anion-exchange resin requires an increasing linear
gradient of a pushing agent, commonly sodium acetate (50-250mM NaOAc over 30min)
which competes with the glycans for the column surface thereby displacing the
oligosaccharide chains. The gradient of NaOAc ensures that all structures are released,
the most difficult being highly branched sialylated structures. NaOH is used at 100mM
to provide an alkaline pH. There are two major forms of SA, N-glycolyl- and N-
acetylneuraminic acid, which differ by the presence or absence of a single -OH group.
Despite this small difference, HPAEC-PAD can successfully separate them by more
than ten minutes when the NaOAc gradient is used (Behan and Smith, 2010). Without
sodium acetate it would not be possible to dislodge the glycans from the column.
If two similar oligosaccharide structures differing only in degree of sialylation were
analysed, elution would occur in separate charge bands because the collative negative
charge differs substantially (figure 7.1). The size of the glycans subequently determine
at what stage they elute within a given charge band; glycans with a greater
monosaccharide composition elute later than glycans with the same sialylation but
fewer monosaccharides. Sugars with more carbon atoms have an increased number of
-OH groups and negative charge, thus they are retained for longer (Paskach et al., 1991).
For example, a mixture of bi-sialylated bi-antennary, tri-antennary and tetra-antennary
structures would elute in this order within the bi-sialylated charge band because the
structures increase in size and therefore in strength of interactions formed with the
column. By extension, it is possible for a highly branched, but incompletely sialylated,
glycan to elute before a fully sialylated structure with fewer branches e.g. a bi-sialylated
tetra-antennary glycan would elute earlier than a tri-sialylated tri-antennary structure.
Such circumstances are relatively uncommon because the absence of SA at branch
termini causes exposure of the Gal to which it is attached. This would normally target
the structure for degradation, unless another structure is expressed in its place.
Townsend and colleagues (1988 and 1989) also indicated the possibility of separating
oligosaccharide chains by manipulating the ability of Gal to bind the pentasaccharide
core via a β(1, 4) or β(1, 3) linkage to GlcNAc. The former elutes faster because the

161
-OH groups are less able to associate with the column surface when converted to
oxyanions at pH 13 (Townsend et al., 1988; Townsend et al., 1989).
It is also possible to distinguish glycans with a common degree of sialylation by the
types of linkage existing within the chains. NeuAc for example is capable of binding to
the outer Gal residue through an α(2, 6) or α(2, 3) linkage; the greater the expression of
the latter, the stronger is the interaction with the column (Townsend et al., 1988). This
is because α(2, 6) causes elimination of the oxyanion effect at the C6 –O- group of Gal
(formed at the –OH group under alkaline conditions); it then becomes involved in the
linkage to NeuAc. Therefore, the overall charge is decreased causing it to be more
easily eluted by NaOAc than a similar structure expressing an α(2, 3) linkage which
does not impede the interaction of the oxyanion group of C6 (Townsend et al., 1989).
The two types of linkage can be detected using specific lectin conjugates and
performing an ELISA; the relative level can thereby be investigated.
7.2 Results
7.2.1 HPAEC oligosaccharide analysis
The generation of distinct peaks in the chromatograms is thought to be due to the
absence of tautomerisation, epimerisation and other Lobry de Buyn-van Ekenstein
transformations; reactions which carbohydrate structures may undergo at high pH
subsequently interfering with chromatography. However at room temperature and
during the time-course of the chromatography, it is reported that these do not arise (Lee,
1990; Dionex Corp., 1994).
HPAEC-PAD firstly separated glycans into specific charge bands. Those glycans
expressing a single SA residue elute first (10-20 minutes), followed by bi-sialylated (20-
30minutes), tri-sialylated (30-40minutes) and finally tetra-sialylated, eluting between
40-50 minutes. Figure 6.1, demonstrates this with an oligosaccharide library containing
bi-, tri- and tetra-sialylated chains; each group of peaks representing the different
degrees of sialylation as labelled. The library was used as a comparison trace for patient

162
samples, allowing identification of the sialylation of branches. Although
monosaccharides can be easily quantified through the use of calibration curves, this was
not possible for oligosaccharides because there was no similar availability of pure forms
to use as reference material.
A commercial AGP sample was run and compared to the library, generating peaks
within the same charge bands however there was a reduction in the variability of tetra-
sialylated structures, indicated by fewer peaks (figure 7.2a). Similar results were found
for AGP isolated from ‗normal‘ heparinised blood samples (figure 7.2b). Although
some tetra-sialylated structures appeared to be present, favouritism was demonstrated
for bi-sialylated forms. There were fewer peaks than in commercial sample suggesting
less variability.

163
Figure 7.1. Oligosaccharide library trace generated during separation by HPAEC.
Separation based on the charge of oligosacchiarde chains as measured using nano
culons (nC). Degree of sialylation highlighted in purple.
0
2
4
6
8
10
12
14
16
18
20
15 20 25 30 35 40 45 50 55
nC
Time (min)
Bi-sialylated
Tri-sialylated Tetra-sialylated

164
a)
b)
Figure 7.2. HPAEC chromatograms of oligosaccharide library versus a)
commercially sourced AGP and b) AGP form ‘normal’ heparinised blood samples.
Separation based on the charge of oligosaccharide chains as measured using nano
culons (nC). Degree of sialylation highlighted in dashed boxes. ‗Normal‘ sample data
represented the oligosacchairde profiles of AGP isolated from heparinised blood
samples obtained from the Blood Transfusion Service.
0
2
4
6
8
10
12
14
16
18
20
15 20 25 30 35 40 45 50 55
0
2
4
6
8
10
12
14
16
18
20
15 20 25 30 35 40 45 50 55
nC
n
C
Time (min)
Time (min)
Commercial AGP
Normal sample 1 Oligosaccharide library
Oligosaccharide library
Bi- sialylated
Tri- sialylated
Tetra- sialylated
Bi- sialylated
Tri- sialylated Tetra- sialylated
Normal sample 2
Normal sample 3

165
Patient samples from the titration phase of therapy (n = 5) were analysed and each
chromatogram generated during HPAEC was graphed alongside the library (figure 7.3).
In general it could be seen that, when compared to the library, these glycans displayed a
preference for the charge bands representing bi- and tri-sialylated structures with very
few peaks in the tetra- sialylated region. This appeared to be common with the ‗normal‘
and commercial samples of figure 7.2 suggesting the AGP of these individuals had low
level branching. However, all titration samples displayed some, albeit relatively few,
peaks in the tetra-sialylated charge band. The most noteworthy being T3 and the least
T2. Additionally, the chromatograms of T1 and T3 displayed higher levels of branhes
terminated in three SA residues, with much larger distinct peaks compared to the other
samples within the group; peaks were more comparable with those in the library.
The two main peaks within the tri-sialylated charge band of T1 (34 and 35 minutes)
were almost identical to the library in size and shape and probably represented similar
structures, however they eluted slightly earlier. Perhaps this could explain why the peak
at approximately 42 minutes lay at the interface of the tri- and tetra-sialylated bands; it
may be a tetra-antennary structure that eluted earlier than expected in line with the
previous peaks. A similar pattern was identified at this time point in the chromatogram
of patient T2 but the remainder of the profile was composed of smaller peaks. There
was a novel peak at approximately 53 minutes in T3 AGP, unlike any of the other
titration group samples where glycans tended to elute earlier in the tetra-siaylated region
representing shorter chains. HPAEC-PAD separation of T3 glycans also generated
numerous peaks in the tetra-sialylated region, more so than any other titration pateint.
There were also two small peaks (17-18minutes) in the chromatogram of patient T1 and
a relatively large peak at approximately 16 minutes in that of T2 which may indicate the
presence of monosialylated oligosaccharides. This was unusual and unexpected
because the absence of terminal SA residues causes the underlying Gal to be exposed
which should cause its subsequent degradation.
Overall the glycans expressed by AGP isolated from those in the titration phase of
therapy appeared to show preference for branching of the bi- and tri-sialylated type,
much like that in the ‗normal‘ and commercial samples (figure 7.2).

166
a)
b)
Figure 7.3. Chromatograms of oligosaccharide library versus titration patients a)
T1 and b) T2 (orange). Separation based on the charge of oligosaccharide chains as
measured using nano culons (nC). Degree of sialylation highlighted in dashed boxes.
0
2
4
6
8
10
12
14
16
18
20
15 20 25 30 35 40 45 50 55
0
2
4
6
8
10
12
14
16
18
20
15 20 25 30 35 40 45 50 55
Oligosaccharide Library
T2
Oligosaccharide Library
T1
nC
n
C
Time (min)
Time (min)
Bi- sialylated
Tri- sialylated Tetra- sialylated
Bi- sialylated
Tri- sialylated
Tetra- sialylated

167
c)
d)
Figure 7.3 continued. Chromatograms of oligosaccharide library versus titration
patients c) T3 and d) T4 (orange). Separation based on the charge of oligosaccharide
chains as measured using nano culons (nC). Degree of sialylation highlighted in dashed
boxes.
0
2
4
6
8
10
12
14
16
18
20
22
24
15 20 25 30 35 40 45 50 55
0
2
4
6
8
10
12
14
16
18
20
15 20 25 30 35 40 45 50 55
Oligosaccharide Library
T4
Oligosaccharide Library
T3
nC
n
C
Time (min)
Time (min)
Bi- sialylated
Tri- sialylated
Tetra- sialylated
Bi- sialylated
Tri- sialylated Tetra- sialylated

168
e)
Figure 7.3 continued. Chromatogram of oligosaccharide library versus titration
patient e) T5 (in orange). Separation based on the charge of oligosaccharide chains as
measured using nano culons (nC). Degree of sialylation highlighted in dashed boxes.
0
2
4
6
8
10
12
14
16
18
20
15 20 25 30 35 40 45 50 55
Oligosaccharide Library
T5
nC
Time (min)
Bi- sialylated
Tri- sialylated Tetra- sialylated

169
Figure 7.5 illustrates the HPAEC-PAD separation of AGP glycans from patients in the
harm reduction (HR) scheme alongside that of an oligosaccharide library. The only
commonality between the chromatograms obtained for this group was that all displayed
bi-sialylated structures. Apart from this, the three samples representing the HR phase of
opioid replacement therapy shared very few similarities with respect to their
oligosaccharide profiles.
HR1 displayed few peaks in any other charge band, with no discernable tetra-sialylated
structures and limited evidence of tri-sialylated, although there was a small but broad
peak at approximately 39 minutes which suggested there were some glycans terminated
in three SA residues. The large peak at 15 minutes followed by another smaller peak
may represent a large number of mono-sialylated AGP glycans.
Although there were few peaks spread throughout the chromatogram in pateints HR1
and HR3, there were some in HR2, albeit much more broad than that of the library or
patients from the other therapy groups, suggesting more of this particular glycan
structure was expressed. It should be noted that the chromatogram of sample HR3 may
show more peaks if the scale was truncated; the peak in the tri-sialylated region was
amost twice the height of the library therefore dwarfs the smaller peaks because the y-
axis scale accounted for the highest value.

170
a)
b)
Figure 7.4. Chromatograms of oligosaccharide library versus harm reduction
methadone patients a) HR1 and b) HR2 (in blue). Separation based on the charge of
oligosaccharide chains as measured using nano culons (nC). Degree of sialylation
highlighted in dashed boxes.
0
2
4
6
8
10
12
14
16
18
20
15 20 25 30 35 40 45 50 55
nC
time (min)
0
2
4
6
8
10
12
14
16
18
20
22
24
15 20 25 30 35 40 45 50 55
nC
time (min)
Oligosaccharide Library
HR1
Oligosaccharide Library
HR2
Bi- sialylated
Tri- sialylated
Tetra- sialylated
Bi- sialylated
Tri- sialylated
Tetra- sialylated
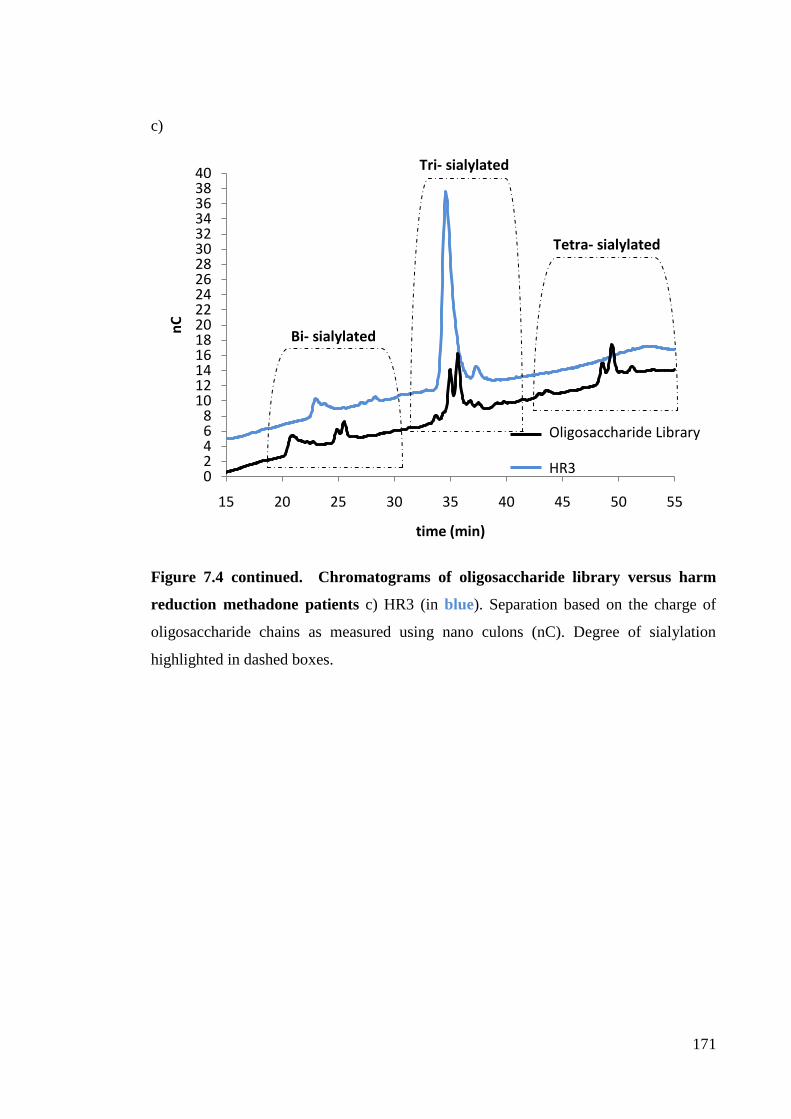
171
c)
Figure 7.4 continued. Chromatograms of oligosaccharide library versus harm
reduction methadone patients c) HR3 (in blue). Separation based on the charge of
oligosaccharide chains as measured using nano culons (nC). Degree of sialylation
highlighted in dashed boxes.
02468
10121416182022242628303234363840
15 20 25 30 35 40 45 50 55
nC
time (min)
Oligosaccharide Library
HR3
Bi- sialylated
Tri- sialylated
Tetra- sialylated

172
Subsequently, chromatograms generated during the HPAEC-PAD analysis of glycans
cleaved from the AGP of long-term methadone therapy (LT) patients were graphed
alongside the oligosaccharide library (figure 7.5).
Like the AGP isolated from patients within the titration phase of opioid-replacement
therapy, the glycans of LT patients appeared to be mainly bi- and tri-sialylated. The
peaks of LT1, LT3, LT5, LT9 and LT10 chromatograms were large and more distinct
than in other members of this treatment group such as LT4, LT6 and LT7. Dissimilar to
the titration phase group however, the peaks representing tetra-sialylated structures in
the chromatograms of some LT patients (for example LT4, LT9 and LT10) were more
defined. There was one main peak present in the chromatogram of LT1 within the tetra-
sialylated region eluting at approximately 43 minutes suggesting most tetra-antennary
glycans existing in their AGP were of a common structure. Comparison of LT9 and
LT10 chromatograms suggested similar glycans were expressed, the main difference
being that peaks in LT10 were generally much larger.
LT1, LT3 and LT5 all expressed peaks in the latter region of the bi-sialylated charge
band along with the early part of that corresponding to tri-sialylated structures,
suggesting numerous long bi- and short tri-antennary structures were present. The intial
peaks detected in figure 7.4g (LT7) could represent mono-sialylated glycans
(~17minutes).
The chromatogram of patient LT8 had a high frequency of peaks, albeit small, in the tri-
sialylated region. There appeared to be a preference for increased branching of the
glycoforms of this AGP sample; very few peaks were recorded in the bi-sialylated
region but some in the tetra-sialylated region. The glycans of AGP isolated from
patients LT9 and LT10 were also predominantly tri-sialylated.
Therefore, there were similarities with the titration, ‗normal‘ and commercial groups in
that all appeared to have a high proportion of tri-sialylated structures however, within
the LT, variations existed. Some patients showed apparent preference for more highly
branched structures (e.g. LT4 and LT10) while others for less branched (e.g. LT3).
Those with peaks in the most highly charged band displayed more distinctive peaks than
any in the titration phase where peaks were noted.

173
a)
b)
Figure 7.5. Chromatograms of oligosaccharide library versus long term methadone
patients a) LT1 and b) LT2 (in green). Separation based on the charge of
oligosaccharide chains as measured using nano culons (nC). Degree of sialylation
highlighted in dashed boxes.
0
2
4
6
8
10
12
14
16
18
20
15 20 25 30 35 40 45 50 55
nC
time (min)
0
2
4
6
8
10
12
14
16
18
20
15 20 25 30 35 40 45 50 55
nC
time (min)
Oligosaccharide Library
LT1
Oligosaccharide Library
LT2
Bi- sialylated
Tri- sialylated Tetra- sialylated
Bi- sialylated
Tri- sialylated Tetra- sialylated

174
c)
d)
Figure 7.5 continued. Chromatograms of oligosaccharide library versus long term
methadone patients c) LT3 and d) LT4 (in green). Separation based on the charge of
oligosaccharide chains as measured using nano culons (nC). Degree of sialylation
highlighted in dashed boxes.
0
2
4
6
8
10
12
14
16
18
20
15 20 25 30 35 40 45 50 55
nC
time (min)
0
2
4
6
8
10
12
14
16
18
20
15 20 25 30 35 40 45 50 55
nC
time (min)
Oligosaccharide Library
LT3
Oligosaccharide Library
LT4
Bi- sialylated
Tri- sialylated
Tetra- sialylated
Bi- sialylated
Tri- sialylated
Tetra- sialylated

175
e)
f)
Figure 7.5 continued. Chromatograms of oligosaccharide library versus long term
methadone patients e) LT5 and f) LT6 (in green). Separation based on the charge of
oligosaccharide chains as measured using nano culons (nC). Degree of sialylation
highlighted in dashed boxes.
0
2
4
6
8
10
12
14
16
18
20
15 20 25 30 35 40 45 50 55
nC
time (min)
0
2
4
6
8
10
12
14
16
18
20
15 20 25 30 35 40 45 50 55
nC
time (min)
Oligosaccharide Library
LT5
Oligosaccharide Library
LT6
Bi- sialylated
Tri- sialylated
Tetra- sialylated
Bi- sialylated
Tri- sialylated Tetra- sialylated

176
g)
h)
Figure 7.5 continued. Chromatograms of oligosaccharide library versus long term
methadone patients g) LT7 and h) LT8 (in green). Separation based on the charge of
oligosaccharide chains as measured using nano culons (nC). Degree of sialylation
highlighted in dashed boxes.
0
2
4
6
8
10
12
14
16
18
20
15 20 25 30 35 40 45 50 55
nC
time (min)
0
2
4
6
8
10
12
14
16
18
20
15 20 25 30 35 40 45 50 55
nC
time (min)
Oligosaccharide Library
LT7
Oligosaccharide Library
LT8
Bi- sialylated
Tri- sialylated Tetra- sialylated
Bi- sialylated
Tri- sialylated Tetra- sialylated

177
i)
j)
Figure 7.5 continued. Chromatograms of oligosaccharide library versus long term
methadone patients i) LT9 and j) LT10 (in green). Separation based on the charge of
oligosaccharide chains as measured using nano culons (nC). Degree of sialylation
highlighted in dashed boxes.
0
2
4
6
8
10
12
14
16
18
20
15 20 25 30 35 40 45 50 55
nC
time (min)
0
2
4
6
8
10
12
14
16
18
20
22
24
15 20 25 30 35 40 45 50 55
nC
time (min)
Oligosaccharide Library
LT9
Oligosaccharide Library
LT10
Bi- sialylated
Tri- sialylated Tetra- sialylated
Bi- sialylated
Tri- sialylated Tetra- sialylated
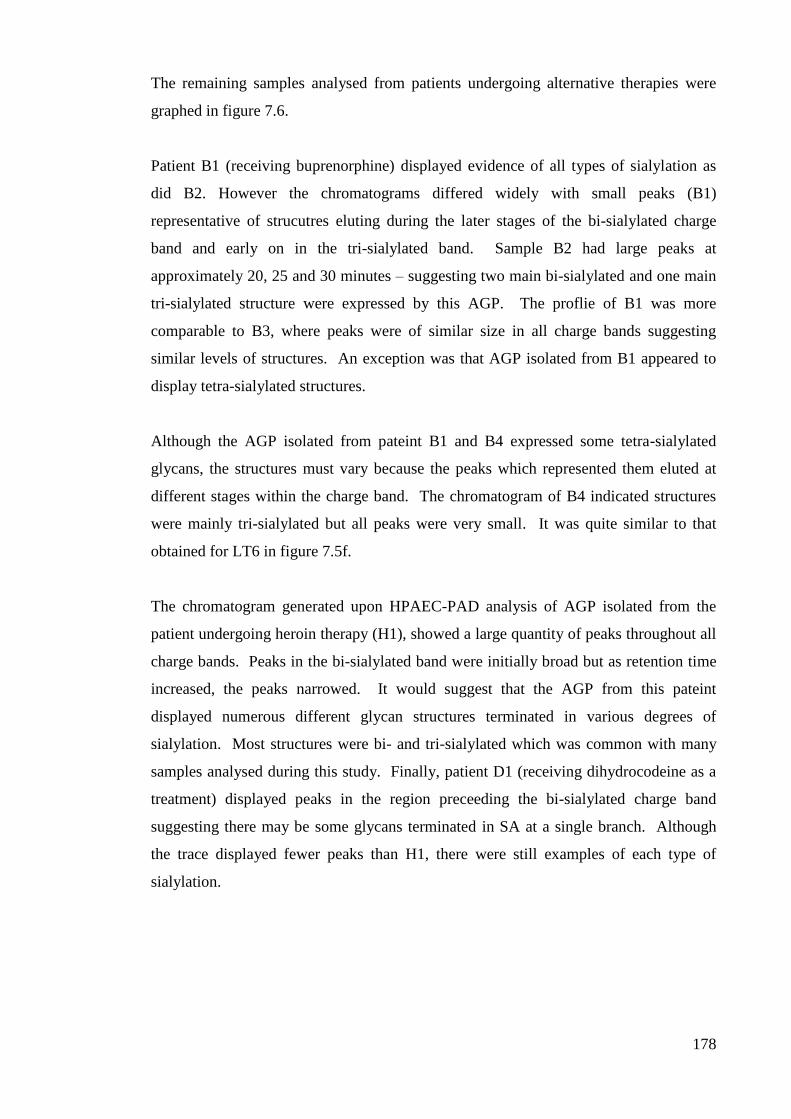
178
The remaining samples analysed from patients undergoing alternative therapies were
graphed in figure 7.6.
Patient B1 (receiving buprenorphine) displayed evidence of all types of sialylation as
did B2. However the chromatograms differed widely with small peaks (B1)
representative of strucutres eluting during the later stages of the bi-sialylated charge
band and early on in the tri-sialylated band. Sample B2 had large peaks at
approximately 20, 25 and 30 minutes – suggesting two main bi-sialylated and one main
tri-sialylated structure were expressed by this AGP. The proflie of B1 was more
comparable to B3, where peaks were of similar size in all charge bands suggesting
similar levels of structures. An exception was that AGP isolated from B1 appeared to
display tetra-sialylated structures.
Although the AGP isolated from pateint B1 and B4 expressed some tetra-sialylated
glycans, the structures must vary because the peaks which represented them eluted at
different stages within the charge band. The chromatogram of B4 indicated structures
were mainly tri-sialylated but all peaks were very small. It was quite similar to that
obtained for LT6 in figure 7.5f.
The chromatogram generated upon HPAEC-PAD analysis of AGP isolated from the
patient undergoing heroin therapy (H1), showed a large quantity of peaks throughout all
charge bands. Peaks in the bi-sialylated band were initially broad but as retention time
increased, the peaks narrowed. It would suggest that the AGP from this pateint
displayed numerous different glycan structures terminated in various degrees of
sialylation. Most structures were bi- and tri-sialylated which was common with many
samples analysed during this study. Finally, patient D1 (receiving dihydrocodeine as a
treatment) displayed peaks in the region preceeding the bi-sialylated charge band
suggesting there may be some glycans terminated in SA at a single branch. Although
the trace displayed fewer peaks than H1, there were still examples of each type of
sialylation.

179
a)
b)
Figure 7.6. Chromatograms of oligosaccharide library versus patients on
alternative therapies a) B1 and b) B2 (in red). Separation based on the charge of
oligosaccharide chains as measured using nano culons (nC). Degree of sialylation
highlighted in dashed boxes.
0
2
4
6
8
10
12
14
16
18
20
22
24
15 20 25 30 35 40 45 50 55
nC
time (min)
0
2
4
6
8
10
12
14
16
18
20
15 20 25 30 35 40 45 50 55
nC
time (min)
Oligosaccharide Library
B1
Oligosaccharide Library
B2
Bi- sialylated
Tri- sialylated Tetra- sialylated
Bi- sialylated
Tri- sialylated
Tetra- sialylated

180
c)
d)
Figure 7.6. continued. Chromatograms of oligosaccharide library versus patients
on alternative therapies a) B3 and b) B4 (in red). Separation based on the charge of
oligosaccharide chains as measured using nano culons (nC). Degree of sialylation
highlighted in dashed boxes.
0
2
4
6
8
10
12
14
16
18
20
22
24
15 20 25 30 35 40 45 50 55
nC
time (min)
0
2
4
6
8
10
12
14
16
18
20
15 20 25 30 35 40 45 50 55
nC
time (min)
Oligosaccharide Library
B3
Oligosaccharide Library
B4
Bi- sialylated
Tri- sialylated Tetra- sialylated
Bi- sialylated
Tri- sialylated Tetra- sialylated

181
e)
f)
Figure 7.6 continued. Chromatograms of oligosaccharide library versus patients
on alternative therapies e) D1 and f) H1 (in red). Separation based on the charge of
oligosaccharide chains as measured using nano culons (nC). Degree of sialylation
highlighted in dashed boxes.
0
2
4
6
8
10
12
14
16
18
20
22
24
15 20 25 30 35 40 45 50 55
nC
time (min)
0
2
4
6
8
10
12
14
16
18
20
22
24
15 20 25 30 35 40 45 50 55
nC
time (min)
Oligosaccharide Library
D1
Bi- sialylated
Tri- sialylated
Tetra- sialylated
Oligosaccharide Library
H1
Bi- sialylated
Tri- sialylated Tetra- sialylated

182
7.2.2 Siailic Acid ELISA
SA residues present at the termini of glycan chains were investigated in more detail by
performing an ELISA with specific lectin conjugates allowing the detection of α2,6- and
α2,3- linked NeuAc. The kit was developed by Galab primarily to analyse the sialic
acid activity of milk and milk-derived samples but as the glycans of AGP are also
terminated in these strucutres it was decided to perform the analysis and determine if the
particular assay offered potential. Not including the ‗normal‘ heparised blood sample
control, it was only possible to anaylse three AGP samples therefore data pertaining to
the analysis was to be incomplete from the start. However, as part of a preliminary
study it was considered useful.
The ELISA only generated useable absorbance data for α2,3 linkages therefore it was
impossible to establish total SA content and compare to HPAEC analysis to determine if
results were associated. The α2,6-linked SA experiment did not provide absorbance
values that differed to that of the inhibition control or 100% signal i.e the inhibition
control was erroneous. It was deemed useful to record and discuss the results of the α2,3
data which is increasingly expressed in highly branched glycans (Bierhuizen et al.,
1988).
The use of an inhibition control allowed the application of the assay to be gauged –
sufficient glycoprotein should be used to out-compete the glycosylated plate surface
thus providing absorbance values similar to the inhibition control (i.e. when inhibition is
100%). AGP was used at a concentration of 0.5mg/mL which was 10-fold lower than
that suggested for the milk protein caseinomakropeptide (CMP) for which the assay was
developed. However, it was found that this concentration was capable of producing
inhibition relatively similar to that of the control. As the concentration of the
glycoprotein decreased, there was less inhibition hence absorbance values became
increasingly similar to the 0% inhibition control. Values were recorded on addition of
the enzyme conjugate and substrate after increasing incubation intervals to ensure data
used in determining the relative α2,3-linked SA activity of each sample of glycans was
the most efficient.
Theoretically, the technique was based on the principle that the addition of AGP caused
competition with the glycosylated plate suface for the lectin conjugate (specific to the

183
linkage type under investigation). The removal of the lectin conjugate with AGP upon
washing caused the reaction catalysed by the enzyme conjugate to be inhibited hence
the inhibition was greatest when the glycoprotein of highest concentration was added.
As the concentration decreased, more lectin was able to bind therefore the enzyme
activity was increased.
Figure 7.7 illustrates the relative signal intensity of SA recorded at 405nm over the
range of AGP concentrations tested (to 0.5mg/mL) in the α2,3 assay. It appeared that
most α2,3 linkages were present in the T and LT sample. Even at the highest
concentrations, the intensity of the HR AGP sample did not pass through 0.5 units
which represents 50% inhibition and was necessary for the calculation of the SA activty.
As shown in the bar chart of figure 7.8, there was a distinct lack of activity of the
sample SA residues to the α2,3 lectin conjugate MAL which suggested this type of
sialylation was too low to be detected thus α2,6 was perhaps more predominant
however the inability to obtain data from the ELISA prevents this being supported
experimetally. Higher concentrations of the HR AGP may be required for detection.
Conversely, there was clear activity in the T and LT samples, however only the LT
sample demonstrated levels greater than the ‗normal‘ sample. Despite these apparent
differences, the technique was only performed on few randomly selected samples
therefore whether observations made were relatvie to all others in the study population
could not be confirmed.

184
a)
Figure 7.7. Signal intensity at 405nm over a range of AGP concentrations. The
concentration of each sample at a signal intensity of 0.5 which represents 50%
inhibition, was used to calculate sialic acid content – only when a declining linear trend
was apparent. Intensities which remained above 0.5 represented sample concentrations
which did not cause sufficeint inhibition.
b)
Figure 7.8. α2,3 – linked sialic acid activity. A 2-D column graph representing the
sialic acid activity of randomly selected samples from each methadone treatment group,
calculated using the IC50 values from figure 7.7 i.e. the concentration at 50% inhibition
of lectin binding.
Normal Heparinised blood
T1 HR1 LT5
Sial
ic A
cid
act
ivit
y
AGP Sample
Sign
al in
ten
sity
Normal Heparinised blood T1 HR1 LT5

185
7.3 Discussion
The analysis of intact glycan structures expressed by glycoproteins first requires their
release from an underlying polypeptide backbone; the structure must first be denatured
(chapter 2). Denaturing agents such as SDS could not be used as they destroy glycans
(Hermentin et al., 1992). Heat denaturation improves the subsequent hydrolytic
cleavage by the endoglycosidase PNGaseF therefore it was utilised to denature AGP.
The enzyme was used because it only cleaves the bond between the Asn residue of the
denatured polypeptide backbone and the initial GlcNAc of the pentasaccharide core;
generating complete glycan chains. It ensured the release of all AGP glycans because
the Asn residues to which they were attached were in turn linked to other amino acids
(the consensus sequence) at each termini; a pre-requisite for the enzyme (Plummer et al.,
1984). Deamination of the Asn residue forms aspartic acid, leaving the glycans
unstable, subsequently becoming converted to a reduced structure. Unlike the acidic
conditions used to cleave component monosaccharides, the enzyme prevented
desialylation of the glycan branches which was crucial to the HPAEC-PAD analysis
utilised in this phase of the study; it relied on the presence of the negative charge of SA
residues as a means of separating glycans.
Figures 7.2 to 7.6 provided evidence that PNGase F was capable of cleaving glycan
chains and that HPAEC-PAD separated them into charge bands based on the negative
charge produced primarily by the SA content as labelled in the library trace (figure 7.1).
As described above, the oligosaccharide chains were separated by HPAEC based upon
their charge and size but also the constituting monosaccharides and linkages holding
them together (Hardy and Townsend, 1988). Strong alkaline conditions (pH13) were
required to induce oxyanion formation allowing improved resolution than that possible
using SA expression alone – isomeric structures can be distinguished when oxyanions
are generated.
It has been shown that reducing glycan chains before analysis by HPAEC could
improve the resolution of peaks however it required additional steps and may itself lead
to the epimerisation and degradation of the structures if they are sensitive to the alkaline
conditions utilised e.g. 0.5M Sodium borohydride (NaBH4) in 0.1M NaOH (Lee, 1996).

186
Chromatograms generated on analysis of isolated AGP samples were plotted with the
library to aid identification of the degree of sialylation; charge bands could be easily
distinguished. Although it was possible to identify general features common to the
oligosaccharide profiles generated for each AGP sample belonging to the individual
study groups, selecting one to represent their respective groups was deemed
inappropriate as variations were also clear. Instead, comparisons were made between
the general observations made in section 7.2. As discussed previously, commercial
AGP was not used to represent a ‗normal‘ trace because the isolation techniques
implemented may have caused partial desialylation, rendering the HPAEC analysis
inaccurate. The chromatogram of commercial AGP (figure 7.2a) may support this as
there were no detectable tetra-antennary peaks while the normal sample appeared to
have some small peaks. However, both were in agreement with previous studies
(Kimura et al., 2006), where the branching of AGP appeared to favour bi- and tri-
antennary structures as demonstrated by the peaks in the corresponding charge bands.
The general peak distribution was relatively consistent within the titration treatment
group, generally displaying a large proportion of bi- and tri-sialylated structures.
Preference for similar charge bands was displayed by the LT group. Chromatograms
generated for the HR group differed considerably. Additionally, the ‗normal‘ AGP
samples often displayed a peak prior to the bi-sialylated charge band which may
represent glycans with only one branch terminated in a SA residue. There are very few
reports suggesting the AGP of healthy populations would express such structures,
mainly because the absence of a SA residue causes the underlying Gal to become
exposed. This would normally act as a signal for the destruction or repair of the
structure; targeted towards lysosomes or calnexin/calreticulin cycles respectively.
If representative profiles are to be generated, further analysis must be undertaken. A
limitation of the current study was the restrictions on patient recruitment enforced by
the NHS ethics board. Preliminary investigations of a wide group of individuals have
indicated the glycosylation of AGP may be altered in individuals undergoing opioid
replacement therapy. The study would benefit from focussing interest on particular
groups to investigate this further.
In general, the glycosylation of AGP isolated from patients undergoing opioid
replacement therapy showed preference for bi- and tri-sialylated branching. Some
patients demonstrated the presence of peaks in the tetra- and mono-sialylated regions

187
but, on the whole, it was less prevalent than other types. Although AGP glycans
isolated from ‗normal‘ heparinised blood also tended to express mostly bi- and tri-
sialylated glycans, data generated during monosaccharide (chapter 6) and
oligosaccharide analysis has highlighted that the glycosylation of AGP in patients
undergoing methadone therapy appears to differ. Therefore, as all patients it was
important to determine if functional changes occurred.
The monosaccharide data (table 6.2) for the ‗normal‘ heparinised blood samples
suggested there was a low degree of branching because the level of Gal and GlcN was
low while Man was relatively constant – the number of core structures remained
common as expected because comparable levels of AGP was analysed. However, as the
Gal and GlcN levels were far lower than the commercial AGP data, it would be
expected that the chromatogram would show more peaks in the bi-sialylated charge
band. This was not the case and instead commercial AGP had more peaks in this area.
Perhaps desialylation caused during isolation of the commercial sample resulted in the
premature elution of glycans due to the reduction in negative charge - the degree of
branching suggested in the profile may be misleading, instead the commercial sample
may express higher levels of branching but without terminal SA residues. The peaks
corresponding to the glycans of commercial AGP were therefore expected to elute later
in the charge bands due to the larger structures suggested by monosaccharide analysis
however this was not the case, certainly within the tri-sialylated charge band.
Interestingly the data obtained from monosaccharide analysis of many patient samples
in chapter 6 was in agreement with the findings during glycan analysis i.e. a high
content of Gal and GlcN, the monosaccharides present in glycan branches, often
correlated with oligosaccharide profiles with peaks eluting in the tetra-sialylated charge
band. For example, patient T3 displayed significantly higher levels of GlcN and Gal
compared to the ‗normal‘ heparinised sample suggesting highly branched structures. T3
recorded the highest level of GlcN (table 6.2) and a relatively similar level of Gal
compared to other patients in the treatment group. When the glycans were subsequently
resolved using HPAEC-PAD, a higher degree of branching was evident; this patient was
the only one to show a relatively large number of peaks in the tetra-sialylated region.
Conversely, samples like LT2 which generated relatively ‗smooth‘ chromatograms
more akin to the ‗normal‘ profiles of figure 7.2b than to others of their respective group
also appeared to have low levels of Gal and GlcN; the levels did not show a significant

188
difference when compared to those for the ‗normal‘ population. It would have been
useful to repeat oligosaccharide analysis of AGP glycans for said samples to determine
whether the profiles were reproduced however limited sample availability rendered this
impossible.
It should be noted that Fuc was not detected in any patient samples and therefore it
could not have been responsible for reducing the retention time of glycans as described
by Pfeiffer et al. (1990). Such modifications have been reported in diseases such as
cancer or RA where fucosylation increased (Mackiewicz and Mackiewicz, 1995; Smith
et al., 2002). It is also known to be increased as a result of liver damage, like that which
occurs during hepatitis or due to drug taking (Anderson et al., 2002). There was no
evidence suggesting this.
Overall, HPAEC-PAD has been shown by this study and numerous others before to
represent a useful sensitive technique in the analysis of glycan structures. PAD detects
only compounds with functional groups which are oxidised at the detection voltage.
Similar to monosaccharide analysis, alterations in the structure of glycans were apparent
in comparison to a normal population.
The SA ELISA indicated that although the kit was produced to analyse the SA activity
of milk and milk-derived proteins, it could be adapted for human AGP. The
determination of SA was based upon a competitive lectin assay with the plate presenting
sialylated structures which bind specific lectin conjugates – SNA and MAL for α(2,6)
and α(2,3) respectively. The sialylated glycoprotein AGP should inhibit this binding.
Patients randomly selected from the T and LT phases of therapy were found to
demonstrate α2,3 activity however only the LT AGP glycans had higher activity
compared to the ‗normal‘ AGP. Although the level of α2,6-linked NeuAc was not
determined, the ELISA was useful as part of a preliminary study. The data may
correlate with that of HPAEC-PAD analysis of the oligosacchairdes, as the T and LT
patients expressed a high level of branching however, with the lack of information
regarding α2,6 SA activity and therefore total SA content, whether the ELISA truly
mirrored the results of HPAEC-PAD analysis could not be determined.

189
Relatively high levels of α2,3 sialylation would be expected because the linkage is
common to AGP glycans (Bierhuizen et al., 1988). Its presence generally causes later
elution of a glycan when compared to a similar structure but with α2,6 linkages because
the latter has a lower collative negative charge due to the absence of the C6 oxyanion -
this effect could not be clearly detected in the chromatograms generated. However, it
has been reported that an increased expression of α2,3-linked neuraminic acid residues
is correlated with more highly branched structures, while α2,6 is more common to bi-
antennary glycans (Bierhuizen et al., 1988). This is in agreement with the
oligosaccharide analysis by HPAEC-PAD, where the LT samples (figure 7.5)
commonly demonstrated evidence of tetra-sialylated structures.
Overall, HPAEC-PAD indicated that the glycosylation of AGP isolated from patients
undergoing various stages of opioid-replacement therapy was different to that expressed
by the AGP isolated from a ‗normal‘ heparinised blood sample. For many patients the
analysis supported, and had been supported by, data obtained during monosaccharide
compositional analysis (chapter 6).
SUMMARY STATEMENT
The glycans of AGP isolated from heparinised ‗normal‘ blood and individuals
undergoing opioid substitute therapies were shown to differ. All groups appeared to
show a preference for bi- and tri-sialylated structures however tetra-sialylated structures
were only found in AGP isolated from patients, most commonly in the LT group. The
results often provided support for the data generated during analysis of monosaccharide
composition in chapter 6. Whether these structural differences could alter the ability of
the glycoprotein to bind drugs was therefore of interest.

190
Chapter 8
Drug Binding
Results and Discussion

191
8.1 Introduction
Preceding chapters have focussed upon the structural analysis of successfully isolated
AGP from patients undergoing opioid replacement therapy. In the present chapter the
focus shifts towards a particular function performed by the glycoprotein, namely
binding to basic drugs - primarily, to methadone.
The magnitude of the role performed by AGP and other APPs in determining the level
of active drug present in vivo is often incompletely appreciated during studies into a
drug‘s effectiveness. There are no known studies which have investigated the presence
of the glycoprotein and more specifically the structure of its glycans in individuals
undergoing opioid-replacement therapy. Instead, those actually acknowledging AGP
mainly concentrated on individuals administering heroin (e.g. Rostami-Hodjegan et al.,
1999) or those prescribed methadone for pain management (e.g. Abramson, 1982;
Duché et al., 2000), however the studies did not considered altered glycosylation.
Numerous techniques have shown use in the investigation of drug binding to the APPs
like AGP. Equilibrium dialysis and ultrafiltration had been the most commonly
implemented methods during the 1980s and 1990s, enabling the straightforward
analysis of various in vitro and ex vivo systems (Oravcova et al., 1996). The former
relies upon the use of a permeable membrane (for low molecular weight structures)
which separates two compartments - one containing the protein of interest and the
second accommodating buffer. The short analysis time and availability of commercial
kits rendered ultrafiltration a useful technique in the clinical analysis of active drug
levels. Ultracentrifugation (Matsushita and Moriguchi, 2003), calorimetry (Aki and
Yamamoto, 1994), liquid chromatography (Zhang et al., 2000), capillary
electrophoresis (Jia et al., 2002) and fluorescence quenching analysis (Epps et al., 1999)
are other valuable techniques.
Increasingly implemented are forms of capillary electrophoresis (CE) - for example Jia
and colleagues (2002) used pressure-assisted capillary electrophoresis (PACE) in
conjunction with frontal analysis (FA). The percentage of protein-bound drug can be
ascertained based on the level of free drug which in turn is indicated by the frontal peak
height. Interest has also developed in chromatographic-based analysis e.g. HPLC (Hage,

192
2001) where immobilisation of the protein in columns is necessary to determine the
retention of solute on the stationary phase and ascertain the percentage of drug which
becomes bound. CE has often been reported to allow greater throughput of samples
however adsorption can occur at the capillary wall and it is generally considered less
sensitive than HPLC - especially with the progress which has been made in reducing
analysis time and the requirement of radio-labelled ligands (Oravcova et al., 1996;
Rundlett and Armstrong, 2001). Even more recent techniques were described in a paper
by Xuan and Hage (2005) where AGP was immobilised onto columns to mimic the
native form. Such techniques have increased potential in the current climate because
they are reusable unlike many of the column and membrane-based techniques; they
have improved precision but still provide information regarding equilibrium and
kinetics (Frostell-Karlsson et al., 2000). In the current study however, it was decided to
utilise intrinsic fluorescence techniques as reported by Parikh et al. (2000), although
minor adaptations were required as described in more detail in chapter 3.
The benefit of fluorescence-based studies over those above include its sensitivity,
accuracy and ability to be used without prior separation of bound and unbound fractions
(Epps et al., 1999). Although not the most direct method to analyse binding interactions,
only 30µg aliquots were required to perform triplicate analysis of AGP in the absence or
presence of each drug concentration, therefore in this study less than 200µg was needed.
Also, the methodology was preferred over dialysis techniques which risk the binding of
hydrophobic drugs to the membrane thus reducing the accuracy of the method (Parikh et
al., 2000). The quick and simple fluorescence-based technique could also offer a basis
on which to develop an assay with potential in a clinical setting. As described in section
3.4, intrinsic fluorescence studies detect the extent to which drugs bind proteins like
AGP. Trp (and to a lesser extent Tyr) residues of the polypeptide backbone fluoresce
when excited at 280nm. The residues become masked upon the binding of a drug
therefore causing a reduction in the florescence emitted i.e. it becomes ‗quenched‘.
While HSA binds acidic drugs, AGP binds those basic or neutral in character, including
methadone (Eap et al., 1990). However, as indicated in section 1.3.4.2, caution must be
applied as fluorescence resonance energy transfer (FRET) may occur in such studies,
especially if the drug under investigation is known to absorb at wavelengths used in the
analysis.
193
8.2 Results
Previously in chapter 3 it was demonstrated using theophylline that the analysis of
intrinsic fluorescence using a microtitre plate method adapted from the Parikh et al.
(2000) study was useful in the investigation of drug binding to AGP. A reduction in
fluorescence of the Trp and Tyr residues was detected as the concentration of drug –
and therefore binding – increased. The method was subsequently repeated with
methadone. Advantageously, it required only 30µg of analyte to triplicate each AGP-
drug concentration analysis. Therefore, all analyses were undertaken by excitation of
the AGP and drug reaction components at 280nm, recording the emission at 340nm –
the wavelength with which maximum fluorescence is correlated (refer to figure 3.1,
section 3.1).
Figure 8.1a indicates the reduction in fluorescence alongside increasing methadone
concentration, thus illustrating that the level of quenching was increased but that it was
not capable of completely quenching all fluorescence. Figure 8.2 illustrated the effect
the aforementioned methadone concentrations had on AGP isolated from ‗normal‘ and
patient samples from the titration (T), harm reduction (HR), long-term methadone (LT),
buprenorphine (B) and dihydrocodeine (D) treatment groups (figure 8.2a and 8.2b-f
respectively). All graphs were represented with the concentrations 50-200μM removed
to allow a clearer representation of the effect low concentrations had on fluorescence. It
was discovered that in all individuals, the level of quenching was correlated with the
concentration of methadone – quenching increased (i.e. fluorescence intensity decreased)
as the glycoprotein samples were exposed to elevated concentrations of drug.
Nonetheless, this effect on AGP isolated from the ‗normal‘ and patient blood samples
attained a plateau at very high concentrations (> ~100μM) which was unlike the
continual reduction in fluorescence detected when theophylline was used (refer to figure
3.4, section 3.3.2).
The fluorescence values recorded for AGP isolated from all available samples in the
absence of methadone, with 1.07μM and with 250µM of the drug were summarised in
Table 8.1 to highlight the similarity of samples (except D1) with ‗normal‘ AGP when
analysed alone without the introduction of drug which was difficult to detect in the
respective figures. Reporting the values after the introduction of methadone at both a

194
low and high concentration showed there were differences in binding between the
patient samples and ‗normal‘ AGP.
The rate at which intrinsic fluorescence emitted by AGP isolated from patient samples
declined was most pronounced at low concentrations, steadying after the introduction of
22μM methadone. There was therefore an indication that the binding sites available on
AGP became saturated relatively quickly. In spite of this, methadone did not bind all
AGP binding sites – the continued detection of fluorescence in the presence of drug
excess (e.g. 250μM) suggested binding sites remained available.
The extent of reduction did not differ widely between patients within each group or
between treatment groups (as illustrated in figure 8.3). Nonetheless, the emission was
generally lower upon the introduction of methadone than that of the ‗normal‘ (graphed
alongside all samples) and 0.5mg/mL commercial sample (figure 8.1) suggesting that
more binding occurred in individuals undergoing opioid-replacement therapy –
fluorescence was quenched more effectively.
Finally, analysis of AGP binding to another opioid - codeine (2.5-250μM) - was
undertaken with commercial and normal serum AGP. The drug was found to dissolve
most effectively in the solvent DMSO. Although insufficient patient AGP samples
were available to undertake further drug binding studies, those performed using
commercial AGP and a range of drug concentrations identical to that used previously
for methadone and theophylline (25-2500µM) signified that the glycoprotein was
unable to bind codeine (figure 8.4).

195
Figure 8.1. Intrinsic fluorescence at 340nm of 0.5mg/mL and 5mg/mL
commercial AGP. AGP samples, alongside increasing concentrations of methadone
(1.07-250μM), were excited at 280nm and the fluorescence emitted was recorded, the
extent of reduction indicating the degree of binding.
Concentration methadone (µM)
Flu
ore
scen
ce (
RFU
)

196
a)
b)
Figure 8.2. Intrinsic fluorescence at 340nm of AGP isolated from ‗normal‘
individuals (a) and patients undergoing the titration phase of therapy (b) in the presence
of methadone. AGP samples, alongside increasing concentrations of methadone (1.07-
250μM), were excited at 280nm and the fluorescence emitted was recorded, the extent
of reduction indicating the degree of binding.
Concentration methadone (µM)
Flu
ore
scen
ce (
RFU
) Fl
uo
resc
ence
(R
FU)
Concentration methadone (µM)
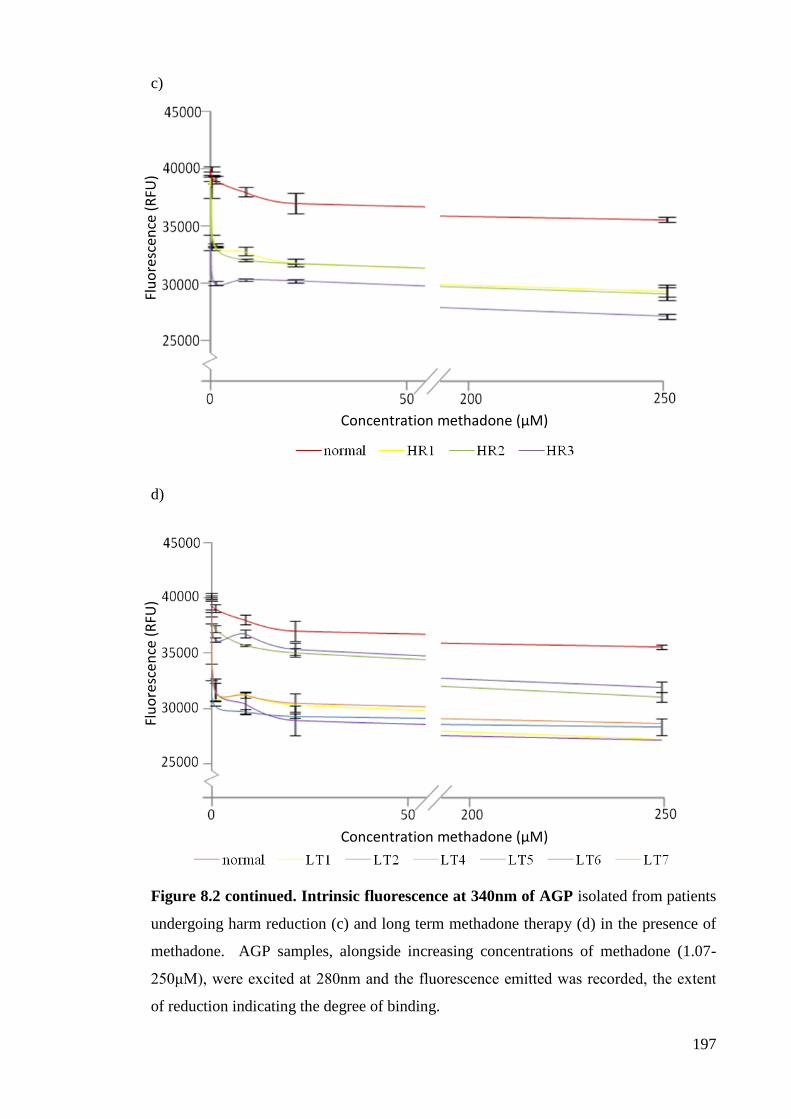
197
c)
d)
Figure 8.2 continued. Intrinsic fluorescence at 340nm of AGP isolated from patients
undergoing harm reduction (c) and long term methadone therapy (d) in the presence of
methadone. AGP samples, alongside increasing concentrations of methadone (1.07-
250μM), were excited at 280nm and the fluorescence emitted was recorded, the extent
of reduction indicating the degree of binding.
Flu
ore
scen
ce (
RFU
) Fl
uo
resc
ence
(R
FU)
Concentration methadone (µM)
Concentration methadone (µM)
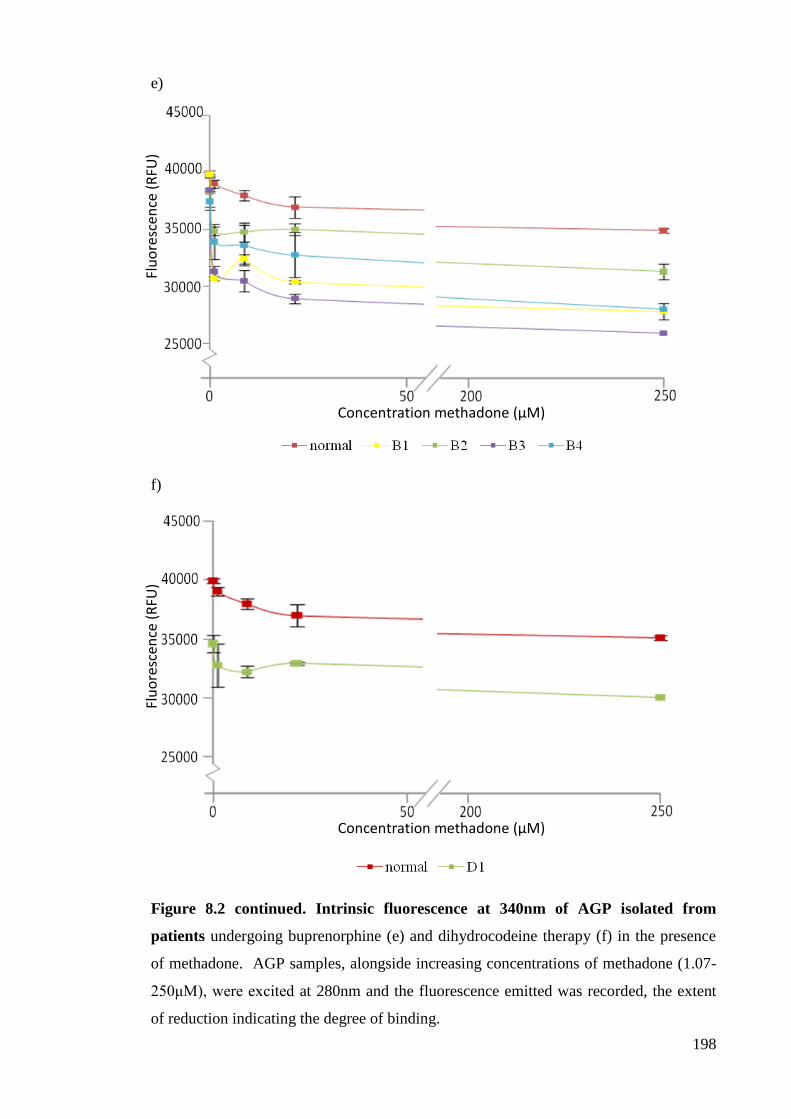
198
e)
f)
Figure 8.2 continued. Intrinsic fluorescence at 340nm of AGP isolated from
patients undergoing buprenorphine (e) and dihydrocodeine therapy (f) in the presence
of methadone. AGP samples, alongside increasing concentrations of methadone (1.07-
250μM), were excited at 280nm and the fluorescence emitted was recorded, the extent
of reduction indicating the degree of binding.
Flu
ore
scen
ce (
RFU
)
Concentration methadone (µM)
Flu
ore
scen
ce (
RFU
)
Concentration methadone (µM)

199
g)
Figure 8.3. Intrinsic fluorescence at 340nm of AGP isolated from ‘normal’
heparinised blood and opioid-replacement patients in the presence of methadone.
AGP samples, alongside increasing concentrations of methadone (1.07-250μM), were
excited at 280nm and the fluorescence emitted was recorded, the extent of reduction
indicating the degree of binding.
Flu
ore
scen
ce (
RFU
)
Concentration methadone (µM)

200
Sample Fluorescence in the
absence of methadone
(RFU)
Fluorescence in
the presence of
1.07µM
methadone
(RFU)
Fluorescence in the
presence of 250µM
methadone (RFU)
Commercial
(Sigma)
41636 38236 30620
Normal 1 39943.5 39021 35476
Normal 2 37784.5 37032 36138
T1 39859 34006 30712
T2 35992 33371 30840
T3 36715 33020 30284
T4 37571 31089 29182
T5 38882 33959 29412
HR1 39107 33280 29289
HR2 38438 33215 29025
HR3 33531 30023 27072
LT1 31770 30775 27196
LT2 33324 30252 28346
LT4 38688 37189 31008
LT5 39937 36241 31893
LT6 39691 31681 27137
LT7 38484 31538 28658
B1 39862 30718 28227
B2 38273 34872 31803
B3 38492 31337 26303
B4 37482 33940 28412
D1 34608 32789 30363
Table 8.1. Intrinsic fluorescence of AGP in absence and presence of 1.07µM
and 250µM methadone.

201
Figure 8.4. Intrinsic fluorescence at 340 nm of commercial AGP in the presence
of codeine. AGP samples, alongside increasing concentrations of codeine (2.5-250μM),
were excited at 280nm and the fluorescence emitted was recorded, the extent of
reduction indicating the degree of binding.
Flu
ore
scen
ce (
RFU
)
Concentration methadone (µM)

202
8.3 Discussion
Methadone is an opioid substitute therapy implemented globally in the treatment of
opioid dependencies and has been well documented as a favourable means of reducing
crime and the spread of infectious disease (Ward et al., 1999). There is still
disagreement over its success in terms of its ability to assist individuals in their quest to
achieve complete drug abstinence. Four years ago it was suggested that as few as 7% of
patients may actually achieve this state annually in Scotland (McKeganey, 2006).
Many more remain on methadone maintenance therapy long-term – their study did not
consider this to signify those in which the treatment was successful.
An explanation as to why the treatment has more success in certain individuals than
others is essential if the therapy is to encourage and improve abstinence rates. It is no
easy task with numerous pharmacokinetic and pharmacodynamic factors fundamental in
the determination of the drug‘s effect. Differing rates of metabolism and elimination,
which ultimately reduce the level of active drug in the blood, may be partly responsible
for the variability in treatment success. For example, individuals expressing greater
activity of cytochrome P450 enzymes (particularly CYP3A4) will possess lower levels
of free active drug.
Of interest to this study is the presence of in vivo drug-binding proteins such as AGP
which forms predominantly hydrophobic interactions with basic and neutral drugs at a
single binding site (Jia et al., 2002). AGP binds methadone with a high affinity but low
capacity at physiological pH. Investigations into the binding of imipramine to AGP by
Hervé and colleagues (1993) suggested that AGP may display variable numbers of
binding sites, primarily determined by the variants expressed. They reported that one
high affinity site and two lower affinity binding sites may exist on the ORM-2A variant
(the variant for which methadone expresses a high affinity at a single hydrophobic
binding site). The apparent correlation with the AGP variants expressed, suggests there
is likely to exhibit interindividual variation in the binding of drugs like methadone to
AGP.
As many drugs reach their target site of action via the bloodstream, the presence of such
proteins may have a significant effect on the availability of active drug; some becoming

203
bound upon contact, rendering it inactive. The subsequent alteration of equilibrium
between tissues affects other PK parameters including the volume of distribution (Vd)
and elimination etc. If binding is substantial, the level of active (unbound) drug may be
insufficient to stimulate the pharmacological effect. The concept has been widely
studied for numerous drugs (for example Friedman et al., 1985; Paterson et al., 2003;
Johnson and Smith, 2006 who studied chlorpromazine, tamoxifen and anti-tuberculosis
drugs respectively). It must also be remembered that the effectiveness of drugs which
bind to AGP and other APPs will be affected during the APR to various physiological
and pathophysiological conditions where synthesis is altered (Benedek et al., 1984) and
atypical glycans may be expressed. Increases in the methadone dose may be necessary
to allow for enhanced AGP binding during the APR which, in the case of methadone,
may prevent attainment of the MEC at the ORs causing the emergence of withdrawal
symptoms. Upon termination of the APR, swift dosage adjustments must be made
accordingly to prevent toxicity.
It was hypothesised that alterations in the level and structure of this glycoprotein, shown
to occur in chapters 5, 6 and 7, may enhance the affinity for methadone - inactivation of
the drug would be exacerbated, rendering individuals susceptible to withdrawal and
ensuing relapses. AGP isolated from all patient blood samples did appear to bind more
methadone, as shown by greater fluorescence quenching. Rostami-Hodjegan and
colleagues (1999) reported that the levels of AGP in heroin dependent individuals with
signs of opiate withdrawal were greater than in a drug free population and also showed
a higher proportion binding to the glycoprotein when analysed ex vivo. There have
however been no notable studies published which analysed the level and structure of
AGP in patients undergoing opioid-replacement therapy. Those in the initial weeks of
titration therapy represent a study population similar to that central to the study by
Rostami-Hodjegan and colleagues (1999); individuals commonly continue to co-
administer heroin at least until a maintenance dose of methadone is attained.
As documented in chapter 5, the level of AGP isolated was greater in all patients
compared to a ‗normal‘ population. Fundamentally patients expressing the greatest
levels of AGP would be expected to require the highest doses of methadone as binding
would be expected to increase. Instead, within the LT group, patients LT4 and 6
demonstrated the greatest binding but were receiving 90 and 60 mg / day respectively,
by no means the greatest doses. One explanation could be that those with apparently

204
high levels of binding but receiving comparably low doses of methadone expressed
fewer cytochrome P450 enzymes involved in its metabolism than those where binding
was relatively similar but whom required much greater doses like LT2 and LT7 (150-
200mL). The greatest reduction when comparing representative group members was
found for LT2 and B1. However, not all patients in these groups displayed such large
reductions for example, LT4, LT6, and B2.
Studies undertaken thus far have suggested that the glycosylation of AGP was altered in
all patients however it was unspecific to a particular treatment group. It was possible
that these structural changes increased the affinity for methadone – in the absence of
drug, fluorescence of Trp and Tyr residues of the polypeptide backbone was consistent
with that of a ‗normal‘ AGP sample isolated from heparinised blood which suggested
the structural alterations alone were not affecting fluorescence or location of Trp and
Tyr therefore FRET was unlikely. Also, methadone does not absorb at wavelengths
implemented in the intrinsic fluorescence studies so any reduction detected should be
indicative of the binding of the drug to AGP and the effect altered glycosylation may
have had.
Additionally, the fluorescence reduction detected in all patients may be partly due to an
increased expression of the ORM2A variant of AGP – the variant to which methadone
is thought to exhibit preference (Eap et al., 1990). As stated in the results, the reduction
in intrinsic fluorescence was most pronounced at low concentrations suggesting
relatively rapid uptake by the plasma protein with an apparent limit to the quenching
effect, indicating saturation of the available binding sites. There was very little
variation in the extent of quenching between patients. Unlike theophylline etc, the
fluorescence was far from eradicated – this would have been expected had methadone
been unspecific in its binding to the glycoprotein. Binding sites must remain available
otherwise the fluorescence would continue to be quenched, as shown for
chlorpromazine and theophylline (refer to figures 3.1b and 3.4 respectively) which bind
highly to AGP. The relative proportions of AGP variants could not be determined for
the patients due to insufficient samples but there was no reason not to conclude that the
glycosylation changes which occur to this particular variant of AGP would increase its
affinity for methadone. The culmination of increased synthesis (as shown in chapter 5)
and altered glycoform expression in vivo may cause substantial reduction in the active
drug concentration in treatment groups thus necessitating dosage adjustments.

205
Selectivity is not only seen in terms of which AGP variants methadone binds but also in
the chirality of the ligand (i.e. enantiomer) for which the glycoprotein exhibits
preference (Muller, 1988), potentially contributing to the limitation of quenching when
compared to that of theophylline and chlorpromazine. Eap and colleagues (1990) have
also documented that the enantiomers bind AGP genetic variants differently - similar to
the traits of warfarin studied by Hervé et al (1998). The (R) enantiomer of methadone
expresses affinity for AGP. However at concentrations of 250µM it is likely that there
would be enough of the (R) enantiomer to cause a more significant decrease from the
preceding 21µM which is approximately 10-fold lower. In most countries, the (R) form
of the drug is administered alongside the (S) enantiomer as a racemate which may
partially explain why doses are so much higher (mg level) that the plasma level required
to induce the pharmacological effect (ng level).
Whether the single patient receiving dihydrocodeine was representative of all
individuals receiving this treatment, was unknown. Nonetheless, it was the only sample
to have significantly different fluorescence to normal in the absence of drug suggesting
that the structure of the molecule was altered or less was analysed. Binding still
occurred because the fluorescence reduced however not to the same degree as the other
samples, again suggesting the binding site had lower affinity for the drug.
It was seen that codeine was unable to bind AGP. Although this opioid (a natural
isomer of methylated morphine) is used in pain management and not usually in opioid-
replacement therapy for drug abuse due to its short duration of action of 2.51-3.15h
(Yue et al., 1991), it was deemed of interest as it belongs to the same family and DHC
could not be sourced (essentially codeine with two additional –H atoms and no double
bond, making it more stable with greater metabolic resistance). If considering the
influence of AGP alone on the efficacy of methadone, a drug like codeine but with a
longer half-life – if capable of reproducing the same effects such as withdrawal
prevention – may be of use as an alternative treatment in those expressing high levels of
AGP glycoforms with affinity for methadone.
Finally, as reported by Parikh et al. (2000), the multi-well technique is well suited for
high-throughput screening of drug binding at the binding site close to the integral Trp
and Tyr residues. The technique could be adapted for use in a clinical setting, allowing
the clinician to perform a rapid binding assay without prior derivatisation or separation

206
of bound and unbound drug or genetic variants thus aiding in the determination of the
likely effectiveness of the drug at doses under consideration. It may also offer use as a
monitoring tool because it would be easy to detect alterations in the level of AGP.
However, the technique would ultimately require adaptations for urine analysis, is likely
to be expensive if specific structures are to be detected but also, there are likely to be
many factors influencing the bioactive concentration of methadone including the
expression of CYP450 enzymes involved in its metabolism thus further analysis needs
to be undertaken regarding the interaction of all these factors if therapies are to be
improved.
SUMMARY STATEMENT
Binding of methadone to AGP isolated from all sources was shown - using intrinsic
fluorescence measurements - to increase with its concentration; the most apparent
reduction in fluorescence was found at low concentrations of drug. The degree of
quenching was subsequently reduced at high concentrations suggesting binding sites on
AGP became saturated. There did not appear to be any clear interindividual variation in
the binding of methadone to AGP isolated from patient blood samples however the
quenching was greater than that for AGP isolated from heparinised ‗normal‘ blood.

207
Chapter 9
Conclusions

208
9.1 Conclusions
Opioid dependencies represent a worldwide problem not only in terms of the health of
an abuser but to society as a whole due to associated illegal drug-seeking activities and
unemployment. Substitute drugs are commonly implemented in programmes targeted
towards fighting these issues, aiding the achievement of abstinence through a safe and
controlled manner while attaining a more stable lifestyle for the individual. The use of
orally administered substitute therapies also minimises the spread of potentially deadly
blood borne viruses.
Although numerous therapies are available, methadone remains that most commonly
prescribed due to its low cost and long half-life. The drug prevents the onset of
withdrawal symptoms which would normally occur in the absence of the abused opioid
and, as it belongs to the same family, it has many of the same effects as heroin therefore
eliminating cravings and preventing the onset of withdrawal. It does not similarly
induce euphoria thus the ‗reward‘ associated with heroin is removed.
The success of drug therapies relies on the presence of specific concentrations of its
bioactive form (MEC) at the corresponding site of action. Numerous factors determine
whether this can be achieved, however often overlooked is the binding to plasma
proteins. Of interest to this study was AGP, a positive acute phase protein known to
bind basic drugs including methadone (Kremmer et al., 1988). During the APR the
hepatic synthesis of this glycoprotein is known to increase 2-5 fold, which is well
correlated with numerous pathological conditions including rheumatoid arthritis,
inflammation and cancer (Fournier et al., 2000). Alterations in its concentration are
therefore not specific to a particular condition, unlike the glycosylation of AGP which
may be uniquely altered. Additionally, any structural change has the potential to affect
the functions performed.
The current preliminary study aimed to investigate whether AGP has a significant role
in the determination of methadone activity. Of primary interest was whether the level
and glycoform expression of AGP isolated from patients undergoing various stages and
types of substitute therapy for opioid-dependence differed to a ‗normal‘ healthy

209
population. It was supposed that alterations may correlate to variations in the binding of
the glycoprotein to methadone. Patients were recruited at the CDPS clinic in Edinburgh,
including those undergoing titration, harm reduction, long-term methadone,
buprenorphine, dihydrocodeine and heroin replacement. It was hypothesised that AGP
isolated from patients would exhibit higher levels and structural changes causing
increased binding to methadone when compared to a ‗normal‘ AGP sample. Greater
binding would at least partially explain why high doses of the drug are required –
accounting for that which is bound and therefore inactivated.
AGP was isolated using a two-column low-pressure chromatography technique that had
been adapted from the methodology devised by Smith et al. (1994) to allow for low
sample volumes and prevent degradation of the in vivo structure. SDS-PAGE and a
Western Blot were performed and indicated that the technique generated pure AGP.
Similar to research undertaken by Rostami-Hodjegan et al. (1999), the current study
detected increased levels of AGP expressed in individuals who displayed signs of
withdrawal from heroin (represented by the titration group). Recruitment of heroin-
dependent individuals who were not receiving substitute therapy was not possible. The
levels isolated from the patients in the remaining treatment groups – excluding the
individual receiving heroin - were also greater than that isolated from the ‗normal‘
population. An explanation may be that the presence of a xenobiotic, or the increase in
DA release caused by the opioid agonist administered, deceives the body; causing
stimulation of the APR or increased synthesis of AGP to aid in removal of methadone.
The general hypothesis regarding heroin therapy is that maintaining the same drug in
therapy as that abused - albeit in a more pure form, as was the case for patient H1 - may
have prevented such a strong induction of the APR hence the low AGP level isolated
compared to the other treatment groups. However, the recruitment of a single patient
was insufficient to determine whether it represented the whole group, therefore the
accuracy of any conclusions made from the corresponding data could not be gauged.
Although it is well understood that structural changes to AGP glycosylation can
significantly affect the functions of the biomolecule, there is currently a paucity of
research data pertaining to this effect in patients undergoing opioid-replacement therapy.
It is well understood that AGP generally exhibits a degree of selectivity for the ligands

210
to which it binds and in terms of drugs, they are generally of the neutral or basic variety
(Kremer et al., 1988). If binding to methadone is altered by structural modifications to
the glycan chains present on AGP, the free active concentrations and subsequent
pharmacological effect could be changed. A reduction in efficacy would become
apparent when the affinity increases or vice versa if the affinity was reduced.
The variability in the binding of methadone to AGP may partly explain why some
individuals require more drug than others to produce the effect. That is not to forget the
roles of metabolism and elimination which display interindividual variability due to
differences in gene expression.
The analysis of glycan structure and composition initially required the most effective
means of cleaving glycans into component monosaccharides to be identified. Neutral
monosaccharides became unstable in the presence of HCl and GlcNAc was less
effectively cleaved by TFA, requiring instead a stronger acid. Combining the acids, as
performed by previous studies undertaken by the group (Smith et al., 2002; Mooney et
al., 2006), did not provide adequate hydrolysis of the monosaccharides when analysed
in this study therefore the methodology was adapted. Optimal monosaccharide cleavage
of the basic and neutral sugars was achieved by separating the use of HCl and TFA (and
incubating for 6 and 4h respectively). In order to detect the greatest levels of GlcN,
hydrolysis with HCl was followed by washes with HPLC-grade water, the treated
sample was not passed through a dowex cation-exchange column as it hindered the
elution of the GlcN residues. It was postulated that the additional negative charge
displayed by the sugar after deacetylation, increased the interactions formed with the
column. The separate use of the acids TFA and HCl ensured the levels of Gal and
GlcNAc were not compromised; these monosaccharides are correlated with glycan
branching and therefore effective cleavage was important.
The level of mannose remained constant which supported that differences detected in
the other monosaccharide levels represented alterations in the structure of the chains.
Mannose is only present in the core of complex N-linked glycans and should therefore
remain constant when the same level of AGP from each patient was analysed; AGP
expresses five complex N-linked glycans on the polypeptide backbone. Glycan
structural analysis indicated that the composition of other monosaccharides was altered
in the majority of patients. Elevations in the level of Gal and GlcNAc in the AGP of all

211
patient groups (except D1 and H1) inferred an increase in branching occurred in the
glycans of patient AGP. Such an effect had not been documented previously therefore
whether the results obtained represent other individuals undergoing similar stages and
types of substitute therapy was unknown.
There was no significant difference in the monosaccharide levels of glycans in patient
AGP with respect to the commercial equivalent. Nonetheless it was deemed more
appropriate to use the ‗normal‘ heparinised blood samples as a control because
commercially sourced AGP was isolated using a method that caused partial
desialylation. The alternative - ‗normal‘ serum - was sourced from an elderly population
of patients hence the expression of an APR was possible due to supplementary
inflammatory conditions that were perhaps un-noted or undiagnosed and could therefore
change the level and structure of AGP.
Increased branching was supported in qualitative oligosaccharide analysis where the
number of branches appeared to be higher in some AGP isolated from patients than in
the ‗normal‘ AGP glycans. A number of the glycans of patient AGP expressed tetra-
sialylated chains; this was not the case in the normal samples. The ELISA supported the
finding to a degree, indicating greater SA expression for the LT patient than in the
‗normal‘ population – the α2,3 linkage is associated with more highly branched
structures. However, the AGP isolated from patient HR1 did not provide sufficient
activity to be detected and that of T1 was lower. The level of α2,6 could not be
ascertained therefore the complete SA content was not known. The study indicated the
possibility that such analytical kits could be adapted for AGP SA analysis but many
more samples must be tested and the technique perfected.
Drug binding analysis based on the methodology developed by Parikh and colleagues
(2000) - exploiting intrinsic fluorescence on the microtitre plate scale -was shown to be
effective. In terms of patients, the binding increased in all when the concentration of
methadone was increased. The binding appeared to be enhanced when compared to a
‗normal‘ sample however there was no clear difference between groups. Additionally,
in the absence of drug, fluorescence was relatively consistent to ‗normal‘ suggesting it
was unlikely that the conformation of the binding site was altered by the presence of the
different glycan structures. However, the fluorescence upon drug administration

212
decreased more substantially than in the ‗normal‘ sample suggesting that binding was
affected by glycosylation.
A useful comparative group would be heroin dependent individuals who are not
receiving therapy; it may be possible to determine whether any effects seen in the
patients were a direct result of therapy or perhaps due to underlying stresses associated
with the illicit drug use. The apparent increase in glycan branching or length of
branches already present may increase the affinity of AGP for the drug thereby
explaining why some patients may require higher doses than others despite other
pharmacokinetic parameters remaining constant.
Currently treatment is based on a titration phase where individuals are given low doses
of drug to allow for its slow accumulation. Finally, a maintenance dose is determined.
However, with investigations like these it may be possible to determine the relative
level of glycoforms expressed by an individual‘s AGP to identify those where it is less
likely to be effective or where higher doses will be required. Also, assays may have
potential in monitoring individuals to prevent relapses. Therefore it may reduce the
high risk of overdose often seen especially in the first two weeks of therapy. However,
any clinical test based on such analysis is likely to be expensive and potentially time-
consuming unless advances are made. The need for blood samples from which to isolate
AGP would introduce difficulties; not only would it be invasive but a common
consequence of i.v heroin use is collapsed veins, complicating venipuncture. However,
this preliminary study has shown that a potential correlation exists between the structure
of AGP glycans and its ability to bind the basic drug methadone; although a larger
patient population is required to address other influential factors and determine whether
the interaction could significantly affect the efficacy of methadone in the treatment of
opioid dependencies.

213
9.2 Future work
The study presented within has highlighted the potential for the glycosylation of AGP to
be altered in patients undergoing therapy for opioid dependence which can be correlated
to an increased binding to methadone. However, the study was limited by ethical
approval as to the size of the patient cohort. It has provided a useful preliminary study
which could be expanded to determine if the accuracy of conclusions could be improved.
Also, the study could be expanded in various ways to examine other aspects of the
effect of AGP on treatment of opioid dependence.
Increase the patient population studied to determine if results from this
preliminary study are supported.
o Analyse female and male groups only to determine if the effect of gender
is significant, few females were recruited as few were undergoing
therapy.
o Isolate AGP from a population of healthy individuals age-matched to the
study sample to ensure all differences are due to the conditions of
therapy.
o Increase numbers from different therapies to determine if AGP plays a
significant role in determining the levels of drug available.
Perform other forms of analysis for example Mass Spectrometry to compare the
techniques perhaps gathering information about the peptide binding site.
Further in-depth analysis of the binding site conformation in the presence and
absence of methadone to study the binding process.
Perform more drug binding studies using the scanning fluorescence mode to
enable calculation of binding coefficients.
Drug binding studies with other treatments including dihydrocodeine alongside
AGP isolated from all groups. This will determine if those on methadone would
actually benefit from another therapy because binding is less although should
carry out studies with albumin etc to see if instead they bind to these proteins.
Isolate and separate the genetic variants of AGP and determine if binding greater
to specific variant and if related to glycosylation of that variant.
Repeat the sialic acid ELISA with AGP samples isolated from a larger group of
patients and determine the α(2,6) content.

214
Unfortunately in the current study it was not possible to recruit individuals whom had
relapsed within the preceding 24 hours as they did not re-visit the clinic the following
day. Those that did were unwilling to participate in the study. They had been
considered a potentially interesting study group to determine whether the AGP level
correlated with an increased risk of withdrawal when compared to that from individuals
maintained long-term.
Perhaps an ELISA could be developed similar to that utilised in this study to allow rapid
determination of AGP concentration and relative branching of glycans using specific
lectin conjugates, binding to multiwell plates. However, no specific glycosylation
patterns were determined for a particular treatment group thus perhaps it is most
important to perform a drug binding assay like that described to attain information
regarding how strongly the binds to the aberrant glycoprotein structures.
This study determined the quantitative and qualitative changes in the glycosylation of
AGP between normal and patient populations and their correlation with the degree of
binding to methadone. Although preliminary, results to date support the existence of a
method of drug resistance linked to plasma protein binding and also may explain the
often observed lack of response to methadone therapy. Further research may aid in the
development of improved treatment regimens to tackle the reportedly low success of
current therapies.

215
Chapter 10
Bibliography

216
Abramson, F.B. (1982) Methadone plasma protein binding: Alterations in cancer and
displacement from alpha 1-acid glycoprotein. Clinical Pharmacology and Therapeutics.
32: 652-658.
Adam, P., Sobek, O., Táborský, L., Hildebrand, T., Tutterová, O. and Žáček, P. (2003) CSF and
serum orosomucoid (α-1-acid glycoprotein) in patients with multiple sclerosis: a
comparison among particular subgroups of MS patients. Clinica Chimica Acta. 334: 107-
110.
Adamo, M., Qiu, D., Dick, Jr. L.W., Zeng, M., Lee, A-H. and Cheng, K-C. (2009) Evaluation of
oligosaccharide methods for carbohydrate analysis in a fully human monoclonal antibody
and comparison of the results to the monosaccharide composition determination by a
novel calculation. Journal of Pharmaceutical and Biomedical Analysis. 49: 181–192.
Adamson, J.W. and Eschbach, J.W. (1989) Management of the anaemia of chronic renal failure
with recombinant erythropoietin. Quarterly Journal of Medicine. 73: 1093-1101.
Aki, H. and Yamamoto, M. (1994) Thermodynamic characterization of drug binding to human
serum albumin by isothermal titration microcalorimetry. Journal of Pharmaceutical
Sciences. 83(12): 1712-1716.
Albani, J.R. (1997) Binding effect of progesterone on the dynamics of α1-acid glycoprotein.
Biochimica et Biophysica Acta. 1336: 349-359.
Albani, J.R. and Plancke, Y.D. (1999) Interaction between calcofluor white and carbohydrates
of α1-acid glycoprotein. Carbohydrate Research. 318: 194-200.
Albani, J.R., Sillen, A., Plancke, Y.D., Coddeville, B. and Engelborghs, Y. (2000) Interaction
between carbohydrate residues of a1-acid glycoprotein (orosomucoid) and saturating
concentrations of Calcofluor White. A fluorescence study. Carbohydrate Research. 327:
333-340.
Albani, J.R (2004) In: Structure and dynamics of macromolecules: absorption and fluorescence
studies, Elsevier, ISBN 0-444-51449-X
Albani, J.R. (2003) Relation between the secondary structure of carbohydrate residues of α1-
acid glycoprotein (orosomucoid) and the fluorescence of the protein. Carbohydrate
Research. 338: 1097-1101.
Anderson, N., Pollacchi, A., Hayes, P., Therapondos, G., Newsome, P., Boyter, A. and Smith, K.
(2002) A preliminary evaluation of the differences in the glycosylation of alpha-1-acid
glycoprotein between individual liver diseases. Biomedical Chromatography. 16: 365-372.
Angal, S. and Dean, P.D. (1978) The use of immobilised cibacron blue in plasma fractionation.
FEBS Letters. 96(2): 346-348.
Angst, M.S. and Clark, J.D. (2006) Opioid-induced hyperalgesia. Anaesthesiology. 104: 570-
587.
Annesley, T.M. (2003) Ion suppression in mass spectrometry. Clinical Chemistry. 49:1041–
1044.

217
Arend, W.P. (1991) Interleukin 1 receptor antagonist. A new member of the interleukin 1 family.
The Journal of Clinical Investigation. 88: 1445-1451.
Auriacombe, M., Franques, P. and Tignol, J. (2001) Deaths Attributable to Methadone vs
Buprenorphine in France. Journal of the American Medical Association. 285(1): 39-45.
Azzimonti, F., Atchley, D.H., Morrision, C.A., Dodd, S., Boulton, D.W., DeVane, C.L. and
Arnaud, P. (2003) One step purification of alpha1-acid glycoprotein from human plasma-
fractionation of its polymorphic allele products. Journal of Chromatography B. 784: 33-
38.
Bargagli, A.M., Sperati, A., Davoli, M., Forastiere, F., and Perucci, C.A. (2001) Mortality
among problem drug users in Rome: an 18-year follow-up study, 1980–97. Addiction. 96:
1455-1463.
Bause, E. (1983) Structural requirements of N-glycosylation of proteins. Biochemical Journal.
209: 331-336.
Bayard, B. and Kerckaert, J.P. (1980) Evidence for uniformity of the Carbohydrate Chains in
Individual Glycoprotein Molecular Variants. Biochemical and Biophysical Research
Communications. 95: 777-784.
Behan, J. and Smith, K.D. (in press) The analysis of glycosylation: A continued need for high
pH anion exchange chromatography. Biomedical Chromatography. (published online July
2010)
Benedek, I.H., Blouin, R.A. and McNamara, P.J. (1984) Serum protein binding and the role of
increased α-1-acid glycoprotein in moderately obese male subjects. British Journal of
Clinical Pharmacology. 18: 941-946.
Benedek, I.H., Blouin, R.A. and McNamara, P.J. (1984b) Influence of Smoking on Serum
Protein Composition and the Protein Binding of Drugs. Journal of Pharmacy and
Pharmacology. 36: 214-216.
Bennett, M. and Schmid, K. (1980) Immunosuppression by human plasma α1-acid glycoprotein:
Importance of the carbohydrate moiety. Proceedings of the National Academy of Sciences.
77: 6109-6113.
Benz, I. and Schmidt, M.A. (2002). Never say never again: protein glycosylation in pathogenic
bacteria. Molecular Microbiology. 45(2): 267-276.
Bernard, J., Opdal, M.S., Karinen, R., Morland, J. and Khiabani, H.Z. (2007). Relationship
between methadone and EDDP (2-ethylidene-1,5-dimethyl-3,3-diphenylpyrrolidine) in
urine samples from Norwegian prisons. European Journal of Clinical Pharmacology. 63:
777-782.
Bertozzi, C.R. and Kiessling, L.L. (2001). Chemical glycobiology. Science. 291(5512): 2357-
2364.

218
Bertozzi, C.R. and Rabuka, D. (2009) Structural Basis of Glycan Diversity. In Varki, A.,
Cummings, R.D., Esko, J.D., Freeze, H.H., Stanley, P., Bertozzi, C.R., Hart, G.W. and
Etzler, M.E (Eds.) Essentials of Glycobiology, 2nd
Edition. Cold Harbor Laboratory Press.
Bierhuizen, M.F., De Wit, M., Govers, C.A., Ferwerda, W., Koeleman, W., Pos. O. and Van
Dijk, W. (1998) Glycosylation of three molecular forms of human alpha 1-acid
glycoprotein having different interactions with concanavalin A. Variations in the
occurrence of di-, tri-, and tetraantennary glycans and the degree of sialylation. European
Journal of Biochemistry. 175(2): 387-394.
Biou, D., Chanton, P., Konan, D., Seta, N., N‘Guyen, H., Feger, J. and Durand, G (1989)
microheterogeneity of the carbohydrate moiety of human alpha 1-acid glycoprotein in two
benign liver diseases: Alcoholic cirrhosis and acute hepatitis. Clinica Chimica Acta.
186(1): 59-66.
Biou, D., Konan, D., Féger, J., Agneray, J., Leroy, Y., Cardon, P., Fournet, B. and Durand, G.
(1987) Alterations in the carbohydrate moiety of alpha-1-acid glycoprotein purified from
human cirrhotic ascetic fluid. Biochimica et Biophysica Acta. 913: 308-312.
Blain, P.G., Mucklow, J.C., Rawlins, M.D., Roberts, D.F., Routledge, P.A. and Shand, D.G.
(1985) Determinants of plasma α1-acid glycoprotein (AAG) concentrations in health.
British Journal of Clinical Pharmacology. 20: 500-502.
Blake, A., Bot, G., Freean, J.C. and Reisine, T. (1997) Differential Opioid Agonist Regulation
of the Mouse µ Opioid Receptor. Journal of Biological Chemistry. 272(2): 782-790.
Borg L. and Kreek M. (2003) The pharmacology of opioids. In Graham, A.W., Schultz, T.H.,
Mayo-Smith, M.F., Ries, R.K., Wilford, B.B. (Eds). Principles of Addiction Medicine,
3rd edition, American Society of Addiction Medicine. Chevy Chase, MD; 141–153.
Borgland, S.L., Connor, M., Osborne, P.B., Furness, J.B. and Christie, M.J. (2003) Opioid
Agonists Have Different Efficacy Profiles for G Protein Activation, Rapid Desensitization,
and Endocytosis of Mu-opioid Receptors. Journal of Biological Chemistry. 278(21):
18776–18784.
Boulton, D.W. and Devane, C.L. (2000) Development and Application of a Chiral High
Performance Liquid Chromatography Assay for Pharmacokinetic Studies of Methadone.
Chirality. 12: 681.
Brinkmann-van der Linden, E.C.M., de Haan, P.F., Havenaar, E.C. and van Dijk, W. (1998)
Inflammation-induced expression of sialyl Lewisx is not restricted to α1-acid glycoprotein
but also occurs to a lesser extent on α1-antichymotrypsin and haptoglobin.
Glycoconjugate Journal. 15: 177-182.
Brinkman-Van der Linden, E.C.M., Havenaar, E.C., Van Ommen, E.C.R., Van Kamp, G.J.,
Gooren, L.J.G. and van Dijk, W. (1996) Oral estrogen treatment induces a decrease in
expression of sialyl Lewis x on α1-acid glycoprotein in females and male-to-female
transsexuals. Glycobiology. 6: 407-412.

219
Byers, H.L., Tarelli, E., Homer, K.A. and Beighton, D. (1999) Sequential deglycosylaton and
utilization of the N-linked, complex-type glycans of human α1-acid glycoprotein mediates
growth of Streptococcus oralis. Glycobiology. 9(5): 469-479.
Capelhorn, J.R.M., Bell J., Kleinbaum D.G. and Gebski V.J. (1993) Methadone dose and heroin
use during maintenance treatment. Addiction. 88: 119-124.
Ceciliani, F., Giordano, A. and Spagnolo, V. (2002) The systemic reaction during inflammation:
the acute phase proteins. Protein and Peptide Letters. 9: 211-223.
Ceciliani, F. and Pocacqua, V. (2007) The acute phase protein α1-acid glycoprotein: a model for
altered glycosylation during diseases. Current Protein and Peptide. Science. 8: 91-108.
Chang, C., Chen, Y., Lee, S. (1998) Coactivator TIF1β Interacts with Transcription Factor
C/EBPβ and Glucocorticoid Receptor To Induce α1-Acid Glycoprotein Gene Expression.
Molecular and Cellular Biology. 18(10): 5880-5887.
Chen, Y. and Barkley, M.D. (1998) Toward Understanding Tryptophan Fluorescence in
Proteins. Biochemistry. 37: 9976-9982.
Chiu, K.M., Mortensen, R.F., Osmand, A.P. and Gewurz, H. (1977) Interactions of alpha1-acid
glycoprotein with the immune system. Immunology. 32: 997-1005.
Clyne, B. and Olshaker, J.S. (1999) The C-Reactive Protein. The Journal of Emergency
Medicine. 17(6): 1019–1025.
Compton, P., Charuvastra, V.C., Kintaudi, K. and Ling, W. (2000) Pain responses in
Methadone-Maintained Opioid Abusers. Journal of Pain and Symptom Management. 20:
237-245.
Compton, W.M. and Volkow, N.D. (2006) Major increases in opioid analgesic abuse in the
United States: Concerns and strategies. Drug and Alcohol Dependence. 81: 103–107.
Connock, M., Juarez-Garcia, A., Jowett, S., Frew, E., Liu, Z., Taylor, R.J., Fry-Smith, A., Day,
E., Lintzeris, N., Roberts, T., Burls, A. and Taylor, R.S. (2007) Methadone and
buprenorphine for the management of opioid dependence: a systematic review and
economic evaluation. Health Technology Assessment. 11(9): 1-171.
Costello, M., Fiedel, B.A. and Gewurz, H. (1979) Inhibition of platelet aggregation by native
and desialised alpha-1 acid glycoprotein. Nature. 281: 677-678.
Costello M.J., Gewurz, H. And Siegel, J.N. (1984) Inhibition of neutrophil activation by al-acid
glycoprotein. Clinical and Experimental Immunology. 55: 465-472.
Couldrey, C. and Green J.E. (2000) Metastases: the glycan connection. Breast Cancer Research.
2: 321-323.
Crestani, B., Rolland, C., Lardeux, B., Fournier, T., Bernuau, D., Poüs, C., Vissuzaine, C., Li,
L., Aubier, M. (1998) Inducible Expression of the α1-Acid Glycoprotein by Rat and
Human Type II Alveolar Epithelial Cells. Journal of Immunology. 160: 4596-4605.
Daemen, M.A.R.C., Heemskerk, V.H., Cornelis, V.V., Denecker, G., Wolfs, T.G.A.M.,
Vandenabeele, P. and Buurman, W.A. (2000) Functional protection by acute phase

220
proteins α1-acid glycoprotein and α1-antitrypsin against ischemia/reperfusion injury by
preventing apoptosis and inflammation. Circulation. 102: 1420-1426.
Darke, S. and Ross, J. (1997). Polydrug dependence and psychiatric comorbidity among heroin
injectors. Drug and Alcohol Dependence. 48: 135-141.
Darke, S., Ross, J., Hall, W (1996) Overdose among heroin users in Sydney, Australia: 1.
Prevelance and correlates of non-fatal overdose. Addiction. 91: 405-411.
Davies, M.J., Smith, K.D., Carruthers, R.A., Chai, W., Lawson, A.M. and Hounsell, E.F. (1993)
Use of a porous graphitised carbon column for the high-performance liquid
chromatography of oligosaccharides, alditols and glycopeptides with subsequent mass
spectrometry analysis. Journal of Chromatography. 646: 317-326.
Davis, D., Grossman, S.H., Kitchell, B.B., Shand, D.G. and Routledge, P.A. (1985) The effects
of age and smoking on the plasma protein binding of lignocaine and diazepam. British
Journal of Clinical Pharmacology. 19: 261-265.
Davoli, M., Perucci, C.A., Rapiti, E., Bargagli, A.M., D‘Ippoliti, D., Forastiere, F., Abeni, D
(1997) A Persistent Rise in Mortality among Injection Drug Users in Rome, 1980 through
1992. American Journal of Public Health. 87: 851-853.
De Graaf, T.W., Van der Stelt, M.E., Anbergen, M.G. and van Dijk, W. (1993) Inflammation-
induced expression of Sialyl Lewis X-containing glycan structures on α1-acid
glycoprotein (orosomucoid) in human sera. Journal of Experimental Medicine. 177: 657-
666.
Dell, A. and H. R. Morris (2001). Glycoprotein Structure Determination by Mass Spectrometry.
Science. 291(5512): 2351-2356.
Dennis, J.W., Granovsky, M., Warren, C.E. (1999) Glycoprotein glycosylation and cancer
progression. Biochimica et Biophsica Acta. 1473: 21-34.
Dente, L., Ciliberto, G. and Cortese, R. (1985) Structure of the human α1-acid glycoprotein
gene: sequence homology with other human acute phase protein genes. Nucleic Acids
Research. 13: 3941-3952.
Dente, L., Pizza, M.G., Metspalu, A. and Cortese, R. (1987) Structure and expression of the
genes coding for human α1-acid glycoprotein. EMBO Journal. 6: 2289-2296.
Department of Health (England) and the devolved administrations (1999) Drug Misuse and
Dependence: Guidelines on Clinical Management. London: Department of Health
(England), the Scottish Office Department of Health Welsh Office Department of Health
and Social Services, Northern Ireland.
Department of Health (England) and the devolved administrations (2007) Drug Misuse and
Dependence: UK Guidelines on Clinical Management. London: Department of Health
(England), the Scottish Government, Welsh Assembly Government and Northern Ireland
Executive.

221
Deprez, P., Gautschi, M. and Helenius, A. (2005) More Than One Glycan Is Needed for ER
Glucosidase II to Allow Entry of Glycoproteins into the Calnexin/Calreticulin Cycle.
Molecular Cell. 19: 183-195.
Dionex Corporation, (1994) Dionex Corporation, Analysis of carbohydrates by high
performance anion exchange chromatography with pulsed amperometric detection
(HPAE-PAD). Technical Note 20.
Diekstra, R.F. and Gulbinat, W. (1993) The epidemiology of suicidal behaviour: a review of
three continents. World Health Statistics Quarterly. 46(1):52-68.
Dobos, K.M., Khoo, K.H., Swiderek, K/M., Brennan, P.J., Belisle, J.T (1996) Definition of the
full extent of glycosylation of the 45-kilodalton glycoprotein of Mycobacterium
tuberculosis. Journal of Bacteriology. 178: 2498-2506.
Dole, V.P. and Nyswander, M.E. (1966) Rehabilitation of heroin addicts after blockade with
methadone. New York State Journal of Medicine. 66:2011–2017.
Dole, V.P., Nyswander, M.E. and Kreek, M.J. (1966) Opioid Blockade. Archives of Internal
Medicine. 118(4): 304-309.
Doverty, M., Somogyi, A.A., White, J.M., Bochner, F., Beare, C.H., Menelaou, a., Ling, W
(2001) Methadone maintenance patients are cross-tolerant to the antinociceptive effects
of morphine. Pain. 93: 155-163.
Drummer, O. and Odell, M. (2001) In Drummer, O.H. (Ed.) The Forensic Pharmacology Drugs
of Abuse. Hodder Arnold.
Duché, J., Urien, S., Simon, N., Malaurie, E., Monnet, I. and Barré, J. (2000) Expression of the
genetic variants of human alpha-1-acid glycoprotein in cancer. Clinical. Biochemistry. 33:
197-202.
DuPont, R.L. (1988) abuse of Benzodiazepines: The Problems and the Solutions. American
Journal of Drug and Alcohol Abuse. 14 (1): 1-69.
Durand, G. and Seta, N (2000) Protein Glycosylation and Diseases: Blood and Urinary
Oligosaccharides as Markers for Diagnosis and Therapeutic Monitoring. Clinical
Chemistry. 46(6): 795-805.
Eap, C.B. and Baumann, P. (1993) The α1-acid glycoprotein: structure and possible functions in
the acute phase response. Acute Phase Proteins: Molecular Biology, Biochemistry and
Clinical Applications, CRC Press, Chapter 6: 107-116.
Eap, C.B., Bourquin, M., Martin, J-L., Spagnoli, J., Livoti, S., Powell, K., Baumann, P. and
Déglon, J-J. (2000) Plasma concentrations of the enantiomers of methadone and
therapeutic response in methadone maintenance treatment. Drug and Alcohol Dependence.
61: 47–54.
Eap, C., Buclin, T. and Baumann, P. (2002) Interindividual Variability of the Clinical
Pharmacokinetics of Methadone: Implications for the Treatment of Opioid Dependence.
Clinical Pharmacokinetics. 41(14): 1153-1193.

222
Eap, C.B., Cuendet, C. and Baumann, P. (1988a) Orosomucoid (alpha-1 acid glycoprotein)
phenotyping by use of immobilized pH gradients with 8M urea and immunoblotting.
Human Genetics. 80(2):183-185.
Eap, C.B., Cuendet, C. and Baumann, P. (1988b) Selectivity in the binding of psychotropic
drugs to the variants of alpha-1 acid glycoprotein. Archives of Pharmacology. 337: 220-
224.
Eap, C.B., Cuendet, C. and Baumann, P. (1988c) Binding of amitriptyline to alpha 1-acid
glycoprotein and its variants. Journal of Pharmacy and Pharmacology. 40: 767-70.
Eap, C.B., Cuendet, C. and Baumann, P. (1990) Binding of d-methadone, 1-methadone, and dl-
methadone to proteins in plasma of healthy volunteers: Role of the variants of α1-acid
glycoprotein. Clinical Pharmacology. 47: 338-346.
Ebersole, J.L. and Cappelli, D. (2000) Acute-phase reactants in infections and inflammatory
diseases. Periodontology. 23: 19-49.
Elg, S.A., Mayer, AR., Carson, L.F., Twiggs, L.B., Hill, R.B. and Ramakrishnan, S. (1997) α-1
acid glycoprotein is an immunosuppressive factor found in the ascites from ovarian
carcinoma. Cancer. 80: 1448-1456.
Elliot, M.A., Elliot, H.G., Gallagher, K., McGuire, J., Field, M. and Smith, K.D. (1997)
Investigation into the Concanavalin A reactivity, fucosylation and oligosaccharide
microheterogeneity of α1-acid glycoprotein expressed in the sera of patients with
rheumatoid arthritis. Journal of Chromatography B. 688: 229-237.
Elliot, M.A., Jørgensen, H.G., Smith, K.D. (1998) Hypersialylation of α1-acid glycoprotein in
rheumatoid arthritis. Pharmacy and Pharmacology Communications. 4: 545-547.
Epps, D.E., Raub, T.J., Caiolfa, V., Chiari, A., Zamai, M (1999) Determination of the Affinity
of Drugs toward Serum albumin by Measurement of the Quenching of the Intrinsic
Tryptophan Fluorescence of the protein. Journal of Pharmacy and Pharmacology. 51(1):
41-48.
Fan, J-Q., Namiki, Y., Matsuoka, K., Lee, Y.C. (1994) Comparison of Acid Hydrolysis
Conditions for Asm-Linked Oligosacchairdes. Analytical Biochemistry. 219: 375-378.
Fainsinger, R., Schoeller, T. and Bruera, E. (1993) Methadone in the management of cancer
pain: a review. Pain. 52: 137-147.
Ferrier, R.J. and Collins, P. M. (1972) Monosaccharide Chemistry. Penguin Books Ltd, pg 235.
Fiellin, D. A., O'Connor, P. G., Chawarski, M., Pakes, J.P., Pantalon, M.V. and Schottenfeld,
R.S. (2001). Methadone Maintenance in Primary Care. Journal of the American Medical
Association. 286(14): 1724-1731.
Finnegan, L.P., Haga, T., Kaltenbach, K.A (1991) Treatment issues for opioid-dependent
women during the perinatal period. Journal of Psychoactive Drugs. 23:191- 201.
Flower, D.R., North, A.C.T. and Sansom, C.E. (2000) The lipocalin protein family: structural
and sequence overview. Biochimica et Biohysica Acta. 1482: 9-24.

223
Flower D.R (1996) The lipocalin protein family: structure and function. Biochemical Journal.
318: 1-14.
Fournier, T., Medjoubi-N, N. and Porquet, D. (2000) Alpha-1-acid glycoprotein. Biochimica et
Biophysica Acta. 1482: 157-171.
Freeze, H. H. (2001). Update and perspectives on congenital disorders of glycosylation.
Glycobiology. 11(12): 129R-143R.
French, D., Watson, J., McCahill, B., Taggart, I. and Smith, K.D. (2002) A preliminary
evaluation of the functional significance of alpha-1-acid glycoprotein glycosylation on
wound healing. Biomedical Chromatography. 16: 412-419.
Friedman, M.L., Schlueter, K.T., Kirley, T.L., Halsall, H.B. (1985). Fluorescence quenching of
human orosomucoid. Biochemical Journal. 232: 863-867.
Frostell-Karlsson, A., Remaeus,A., Roos, H., Andersson, K., Borg, P., Hamalainen, M.,
Karlsson, R. (2000) Biosensor analysis of the interaction between immobilized human
serum albumin and drug compounds for prediction of human serum albumin binding
levels, Journal of Medicinal Chemistry. 43: 1986–1992.
Gallacher, G. (2010) Alpha-1-acid glycoprotein as a biomarker for early breast cancer. PhD
thesis.
Galloway, F.R. and Bellet, N.F. (1999) Methadone conversion to EDDP during GC-MS
analysis of Urine Samples. Journal of Analytical Toxicology. 23: 615.
Garrido, M.J. and Trocóniz, I.F. (1999) Methadone: a review of its pharmacokinetic/
pharmcodynamic properties. Journal of Pharmacology and Toxicology. 42: 61-66.
Gavel, Y. and von Heijne, G. (1990) Sequence differences between glycosylated and non-
glycosylated Asn-X-Thr/Ser acceptor sites: implications for protein engineering. Protein.
Engineering. 3: 433-442.
Gelpi, E. (2003) Contributions of liquid chromatography–mass spectrometry to ‗‗highlights‘‘ of
biomedical research. Journal Chromatography A. 1000: 567-581.
Gendler, S.J., Dermer, G.B., Silverman, L.M. and Tӧkés, Z.A (1982) Synthesis of α1-
antichymotrypsin and α1-acid glycoprotein by human breast epithelial cells. Cancer
Research. 42: 4567-4573.
Gomes, M.B., Piccirillo, L.J., Nogueira, V.G., Matos, H.J. (2003). Acute-phase proteins among
patients with type 1 diabetes. Diabetes and Metabolism. 29: 405-411.
Gossop, M., Stewart, D., Treacy, S, Marsden, J (2002) A prospective study of mortality among
drug misusers during a 4-year period after seeking treatment. Addiction. 97: 39-47.
Guile. G.R., Rudd. P.M., Wing. D.R., Prime. S.B., Dwek. R.A. (1996). A Rapid High-
Resolution High-Performance Liquid Chromatographic Method for Separating Glycan
Mixtures and Analyzing Oligosaccharide Profiles. Analytical Biochemistry. 240(2): 210-
226.
224
Gupta N, Shankernarayan NP, Dharmalingam K (2010) alpha1-acid glycoprotein as a putative
biomarker for monitoring the development of the type II reactional stage of leprosy.
Journal of Medical Microbiology. 59: 400–407.
Haasen, C., Verthein, U., Degkwitz, P., Berger, J., Krausz, M., Naber, D. (2007) Heroin-
assisted treatment for opioid dependence. The British Journal of Psychiatry. 191(1): 55-
62.
Hage, D.S. (2001) Chromatographic and electrophoretic studies of protein binding to chiral
solutes. Journal of Chromatography A. 906: 459–481.
Hall, W. D. and Mattick R. P. (2007). Clinical Update: Codeine Maintenance in Opioid
Dependence. Lancet. 370(9587): 550-552.
Hallinan, R., Ray, J., Byrne, A., Agho, K., Attia, J. (2006) Therapeutic thresholds in methadone
maintenance treatment: A receiver operating characteristic analysis. Drug Alcohol and
Dependence. 81: 129-136.
Hanna, J., Foster, D.J.R., Salter, A., Somogyi, A.A., White, J.M., Bochner, F (2005) Within-
and between- subject variability in methadone pharmacokinetics and pharmacodynamics
in methadone maintenance subjects British Journal of Clinical Pharmacology. 60(4): 404-
413.
Hansen, J.E., Bøg-Hansen, T.C., Pedersen, B., Neland, K. (1989). Microheterogeneity of
orosomucoid in pathological conditions. Electrophoresis. 10(8-9):574-578.
Hansen, J.S., Larsen, V.A. and Bøg-Hansen, T.C. (1984) The microheterogeneity of α1-acid
glycoprotein in inflammatory lung disease, cancer of the lung and normal health. Clinica
Chimica Acta. 138: 41-47.
Hao, Y. and Wickerhauser, M. (1973) Development of large-scale methods IV. A simple
method for the large-scale preparation of α1-acid glycoprotein. Biochimica. et Biophysica
Acta. 322: 99-108.
Hardy, M.R. and Townsend, R.R. (1988) Separation of positional isomers of oligosaccharides
and glycopeptides by high-performance anion-exchange chromatography with pulsed
amperometric detection. Proceedings of the National Academy of Sciences of the United
States of America. 85: 3289-3293.
Hardy, M.R., Townsend, R.R. and Lee, Y.C. (1988) Monosaccharide analysis of
glycoconjugates by anion exchange chromatography with pulsed amperometric detection.
Analytical Biochemistry. 170: 54-62.
Hardy, M.R. and Townsend, R.R. (1994) High-pH anion-exchange chromatography of
glycoprotein-derived carbohydrates. Methods in Enzymology. 230: 208-225.
Harvey, D.J. (2005) Structural determination of N-linked glycans by matrix-assisted laser
desorption/ionization and electrospray ionization mass spectrometry. Proteomics. 5:
1774-1786.

225
Hashimoto, S., Asao, T., Takahashi, J., Yagihashi, Y., Nishimura, T., Saniabadi, A.R., Poland,
D.C.W., van Dijk, W., Kuwano, H., Kochibe, N. and Yazawa, S. (2004) α1-acid
glycoprotein fucosylation as a marker of carcinoma progression and prognosis. Cancer.
101: 2825-2836.
Haston, J.L., FitzGerald, O., Kane, D. and Smith, K.D. (2003) The influence of α1-acid
glycoprotein on collagenase-3 activity in early rheumatoid arthritis. Biomedical
Chromatography. 17: 361-364.
Havard, A., Teesson, M., Darke, S., Ross, J (2006) Depression among heroin users: 12-Month
outcomes from the Australian Treatment Outcome Study (ATOS). Journal of Substance
Abuse Treatment. 30: 355– 362.
Havenaar, E.C., Hoff, R.C., van den Eijnden, D.H., van Dijk, W (1998) Sialyl Lewis(x) epitopes
do not occur on acute phase proteins in mice: relationship to the absence of α3-
fucosyltransferase in the liver. Glycoconjugate Journal. 15: 389-395.
Hay, G., Gannon, M., McKeganey, N., Hutchison, S., Goldberg, D. (2005). Estimating the
National and Local Prevalence of Problem Drug Misuse in Scotland. Glasgow, Centre for
Drug Misuse Research, University of Glasgow. Scottish Centre for Infection and
Environmental Health: 1-57.
Hazai, E., Visy, J., Fitos, I., Bikádi, Z., Simonyi, M. (2006) Selective binding of coumarin
enantiomers to human a1-acid glycoprotein genetic variants. Bioorganic and Medicinal
Chemistry. 4: 1959-1965.
Hermentin, P., Witzel, R., Doenges, R., Bauer, R., Haupt, H., Patel, T., Parekh, R.B. and Brazel,
D. (1992) The mapping by high-pH anion-exchange chromatography with pulsed
amperometric detection and capillary electrophoresis of the carbohydrate moieties of
human plasma α1-acid glycoprotein. Analytical Biochemistry. 206: 419-429.
Hervé, F., Gomas, E., Duche, J-C., Tillement, J-P. (1993) Evidence for differences in the
binding of drugs to the two main genetic variants of human α1-acid glycoprotein. British
Journal of Clinical Pharmacology. 36: 241-249.
Hervé, F., Millot, M., Eap, C.B., Duché, J. and Tillement, J. (1996) Two-step chromatographic
purification of human plasma α1-acid glycoprotein. Its application to the purification of
rare phenotype samples of the protein and their study by chromatography on immobilized
metal chelate affinity adsorbent. Journal of Chromatography B. 678: 1-14.
Hervé, F., Caron, G., Duché, J., Gaillard, P., Rahman, N.A., Tsantili-Kakoulidou, A., Carrupt,
P-A., D‘Athis, P., Tillement, J-P. and Testa, B. (1998) Ligand Specificity of the Genetic
Variants of Human a1-Acid Glycoprotein: Generation of a Three-Dimensional
Quantitative Structure-Activity Relationship Model for Drug Binding to the A Variant.
Molecular Pharmacology. 54: 129-138.

226
Higai, K., Azuma, Y., Aoki, Y. and Matsumoto, K. (2003) Altered glycosylation of α1-acid
glycoprotein in patients with inflammation and diabetes mellitus. Clinica Chimica Acta.
329: 117-125.
Higai, K., Aoki, Y., Azuma, Y. and Matsumoto, K. (2005) Glycosylation of site-specific
glycans of α1-acid glycoprotein and alterations in acute and chronic inflammation.
Biochimica et Biophysica Acta. 1725: 128-135.
Hochepied, T., Berger, F.G., Baumann, H. and Libert, C. (2003) α1-acid glycoprotein: an acute
phase protein with inflammatory and immunomodulating properties. Cytokine and
Growth Factor Reviews. 14: 25-34.
Hochepied, T., Van Molle, W., Bergeri, F.G., Baumann, H. and Libert, C. (2000) Involvement
of the Acute Phase Protein α1-Acid Glycoprotein in Nonspecific Resistance to a Lethal
Gram-negative Infection. Journal of Biological Chemistry. 275(20): 14903-14909.
Holmberg, S.D. (1996) The Estimated Prevelance and Incidence of HIV in 96 Large US
Metropolitan Areas. American Journal of Public Health. 86: 642-654.
Home Office (2006) Drug use, smoking and drinking among young people in England in 2005:
headline figures. A survey carried out for the Health and Social Care Information Centre
and the Home Office by the National Centre for Social Research and the National
Foundation for Educational Research.
Hoshino, Y., Dalai, S.K., Wang., K., Pesnicak, L., Lau, T.Y., Knipe, D.M., Cohen, J.I., Straus,
S.E. (2005) Comparative Efficacy and Immunogeneicity of Replication-Defective,
Recombinant Glycoprotein, and DNA Vaccines for Herpes Simplex Virus 2 infections in
Mice and Guinea Pigs. Journal of Virology. 79(1): 410-418.
Housová, J., Wilczek H., Haluzík MM., Křemen J., Křížová J., Haluzík M (2005) Adipocyte-
Derived Hormones in Heroin Addicts: the Influence of Methadone Maintenance
Treatment. Physiological Research. 54: 73-78
Imperiali, B. and O‘Connor, S.E. (1999) Effect of N-linked glycosylation on glycopeptides and
glycoprotein structure. Curent5 Opinion in Chemical Biology. 3: 643-649.
Imre, T., Kremmer, T., Héberger, K., Molnár-Szöllösi, E., Ludányi, K., Pócsfalvi, G., Malorni,
A., Drahos, L. and Vékey, K. (2008) Mass spectrometric and linear discriminant analysis
of N-glycans of human serum alpha-1-acid glycoprotein in cancer patients and healthy
individuals. Journal of Proteomics. 71: 186-197.
Ingham, K.C. (1990) Precipitation of proteins with polyethylene glycol. Methods in Enzymology.
182: 301-306.
Israili, Z.H. and Dayton, P.G. (2001) Human alpha-1-glycoprotein and its interactions with
drugs. Drug Metabolism Reviews. 33: 161-235.
Jackson, P.R., Tucker, G.T., Woods, H.F. (1982). Altered plasma drug binding in cancer: Role
of α1-acid glycoprotein and albumin. Clinical Pharmacology and Therapeutics.
32(3):295-302.

227
Jaeken, J. and Matthijs, G. (2007) Congenital disorders of glycosylation: a rapidly expanding
disease family. Annual Review of Genomics and Human Genetics. 8: 261-278.
Jia, Z., Ramstad, T. and Zhong, M. (2002) Determination of protein–drug binding constants by
pressure-assisted capillary electrophoresis (PACE)/frontal analysis (FA) Journal of
Pharmaceutical and Biomedical Analysis. 30: 405–413.
Johnson, J.A. and Livingston, T.N. (1997). Differences between blacks and whites in plasma
protein binding of drugs. European Journal of Clinical Pharmacology. 51: 485-488.
Johnson, D.C. and LaCourse, W.R. (1992) Pulsed electrochemical detection at noble metal
electrodes in liquid chromatography. Electroanalysis. 4(4): 367-380
Johnson, D. and Smith, K.D. (2006) The efficacy of certain anti-tuberculosis drugs is affected
by binding to α-1-acid glycoprotein. Biomedical Chromatography. 20: 551-560.
Johnston, L.D., O‘Malley, P.M., Bachman, J.G., Schulenberg, J.E (2004) Monitoring the Future
National Results on Adolescent Drug Use. National Institute on Drug Abuse. NIH
Publication number 05-5726.
Jørgensen, H.G., Elliott, M.A., Allan, E.K., Carr, C.E., Holyoake, T.L., Smith, K.D. (2002)
α1-Acid glycoprotein expressed in the plasma of chronic myeloid leukemia patients does
not mediate significant in vitro resistance to STI571. Blood. 99:713-715.
Kalmovarin, N., Friedrichs, W.E., O‘Brien, H.V., Linehan, L.A., Bowman, B.H., Yang, F (1991)
Extrahepatic expression of plasma protein genes during inflammation. Inflammation. 15:
369-379.
Karch, S.B. and Stephens, B.G. (2000). Toxicology and pathology of deaths related to
methadone: retrospective review. The Western Journal of Medicine. 172:11-14.
Kim, S., Kim, S., Ha1, K-S., Leem, S-H. (2000) An improved method for quantitative sugar
analysis of glycoproteins. Experimental and Molecular Medicine. 32(3): 141-145.
Kimura, T., Shibukawa, A. and Matsuzaki, K. (2006) Biantennary Glycans as well as Genetic
Variants of α1-Acid Glycoprotein Control the Enantioselectivity and Binding Affinity of
Oxybutynin. Pharmaceutical Research. 23(5): 1038-1042.
Klee, H. (1990) A new target for behavioral research—amphetamine misuse. British Journal of
Addiction. 85: 1125-1132.
Kobata, A. (1992) Structure and functions of the sugar chains of glycoproteins. European
Journal of Biochemistry. 209(2): 483-501.
Kobata, A. (2000) A journey to the world of glycobiology. Glycoconjugate Journal. 17: 443-
464.
Koj, A. (1996) Initiation of acute phase response and synthesis of cytokines. Biochimica et
Biophysica Acta. 1317: 84-94.
Koj, A. (1998). Termination of Acute-Phase Response: Role of Some Cytokines and Anti-
Inflammatory Drugs. General Pharmacology. 31(1): 9-18.

228
Kornfeld, R. and Kornfeld, S. (1985) Assembly of Asparagine-Linked Oligosaccharides. Annual
Review Biochemistry. 54: 631-664.
Kopecký, V., Ettrich, R., Hofbauerová, K. and Baumruk, V. (2003) Structure of human α1-acid
glycoprotein and its high-affinity binding site. Biochemical and Biophysical Research
Communications. 300(1): 41-46.
Krambeer, L., Von-McKnelly, W., Gabrielli, W.F., Penick, E. (2001). Methadone Therapy for
Opioid Dependence. American Family Physician. 63(12): 2404-2410.
Krausz, M., Verthein, U., Degkwitz, P., Haasen, C., Raschke, P. (1998) Maintenance treatment
of opiate addicts in Germany with medications containing codeine - results of a follow-up
study. Addiction. 93(8): 1161- 1167.
Kreek, M. J. (1997). Opiate and Cocaine Addictions: Challenge for Pharmacotherapies.
Pharmacology Biochemistry and Behaviour. 57(3): 551-569.
Kreek, M.J. (1992). Rationale for maintenance pharmacotherapy of opiate dependence Research
Publications-Association for Research in Nervous and Mental Disease. 70:205-230.
Kremer, J.M.H., Wilting, J., Janssen, L.H.M. (1988). Drug Binding to Human Alpha-1-acid
Glycoprotein in Health and Disease. The American Society for Pharmacology and
Experimental Therapeutics. 40:1-47.
Kremmer, T., Szöllösi, E., Boldizsár, M., Vincze, B., Ludányi, K., Imre, T., Schlosser, G.,
Vékey, K (2004) Liquid chromatographic and mass spectrometric analysis of human
serum acid alpha-1-glycoprotein. Biomedical Chromatography. 18(5): 323-329.
Kremmer, T., Boldizsár, M., Kovács, J., Paulik, E., Bencsik, K., Szajáni, B (1995)
Determination and Analysis of Human Serum Alpha-1-acid Glycoprotein by Liquid
Chromatographic Methods. Journal of Liquid. Chromatography. 18: 1207-1218.
Kristensen, K., Christensen, C.B., Christrup, L.L. (1995) The mu1, mu2, delta, kappa opioid
receptor binding profiles of methadone stereoisomers and morphine. Life Sciences. 56(2):
PL 45-50.
Kuroda, Y., Matsumoto, S., Shibukawa, A., Nakagawa, T (2003) Capillary electrophoretic study
on pH dependence of enantioselective disopyramide binding to genetic variants of human
a1-acid glycoprotein. Analyst. 128: 1023-1027.
Kushner, I. and Rzewnicki, D.L. (1994) The acute phase response: general aspects. Baillière’s
Clinical Rheumatology. 8: 513-530.
Kuster, B., Wheeler S.F., Hunter A.P., Dwek R.A., Harvey D.J. (1997) Sequencing of N-Linked
Oligosaccharides Directly from Protein Gels: In-Gel Deglycosylation Followed by
Matrix-Assisted Laser Desorption/Ionization Mass Spectrometry and Normal-Phase High-
Performance Liquid Chromatography. Analytical Biochemistry. 250(1): 82-101.
Laegreid, L., Hagberg, G., Lundberg, A. (1992) The Effect of Benzodiazepines on the Fetus
and the Newborn. Neuropediatrics. 23(1): 18-23.

229
Laurent, P., Miribel, L., Bienvenu, J., Vallve, C. and Arnaud, P. (1984) A three-step purification
of human α1-acid glycoprotein. Federation of European Biochemical Societies Letters.
168: 79-83.
Leatherbarrow, R.J. and Dean, P.D.G. (1980) Studies on the mechanism of binding of serum
albumins to immobilized Cibacron Blue F3GA. Biochemical Journal. 189: 27-34.
Leavitt, S., M. Shinderman, Maxwell, S., Eap, C.B, Paris, P. (2000). When ‗enough‘ is not
enough. Mount Sinai Journal of Medicine. 67(5): 404-411.
Lechner, J. and Wieland, F. (1989) Structure and biosynthesis of prokaryotic glycoproteins.
Annual Review of Biochemistry. 58:173–194.
Lee, Y.C. (1990) High-performance anion-exchange chromatography for carbohydrate analysis.
Analytical Biochemistry. 189: 151-162.
Lee, Y.C. (1996) Carbohydrate analyses with high-performance anion-exchange
Chromatography. Journal of Chromatography A. 720: 137-149.
Li, X., Wei, B., Goodglick, L., Wen, T., Xia, L., Braun, J. (2009). Investigating Therapeutic
Approach of IBD Using Recombinant Glycoprotein Mucin2. FASEB Journal. 23: 570.1.
Liao, Y.J., Taylor, J.M., Vannice, J.L., Clawson, G.A., Smuckler, E.A. (1985). Structure of the
rat alpha 1-acid glycoprotein gene. Molecular and Cellular Biology. 5(12): 3634-3639.
Lis, H. and Sharon, N. (1993) Protein glycosylation: structural and functional aspects. European
Journal of Biochemistry. 218: 1-27.
Listinsky, J.J., Siegal, G.P., Listinsky, C.M. (1998) α-L-fucose. A potentially critical molecule
in pathologic process including neoplasia. American Journal of Clinical Pathology. 110:
425-440.
Lögdberg, L. and Wester, L. (2000) Immunocalins: a lipocalin subfamily that modulates
immune and inflammatory responses. Biochimica et Biophysica Acta. 1482: 284-297.
Loimer, N. and Schmid, R. (1992). The use of plasma levels to optimize methadone
maintenance treatment. Drug and Alcohol Dependence. 30(3):241-246.
Lynskey, M., Degenhardt, L., Hall, W. (2000) Cohort trends in youth suicide in Australia 1964–
1997. Australian and New Zealand Journal of Psychiatry. 34: 408-412.
Macdougall, I.C., Eckardt, K. (2006) Novel strategies for stimulating erythropoiesis and
potential new treatments for anaemia. Lancet. 368: 947-953.
Mackiewicz, A. and Mackiewicz, K. (1995) Glycoforms of serum α1-acid glycoprotein as
markers of inflammation and cancer. Glycoconjugate Journal. 12: 241-247.
Mackiewicz, A., Pawlowski, T., Mackiewicz-Pawlowski, A., Wiktorowicz, K. and Mackiewicz,
S. (1987) Microheterogeneity forms of alpha1-acid glycoprotein as indicators of
rheumatoid arthritis activity. Clinica Chimica Acta. 163: 185-190.
Maeder, T. (2002). Sweet Medicines. Scientific American. 287(1): 40-47.

230
Manfredi, P.L., Gonzales, G.R., Cheville, A.L., Kornick, C., Payne, R. (2001) Methadone
Analgesia in Cancer Pain Patients on Chronic Methadone Maintenance Therapy. Journal
of Pain and Symptom Management. 21(2): 169-174.
Maremmani, I., Pacini, M., Lubrano, S., Giuntoli, G. and Lovrecic, M. (2002) Harm reduction
and specific treatments for heroin addiction. Different approaches or levels of intervention?
An illness-centred perspective. Heroin Addiction & Related Clinical Problems. 4(3): 5-11.
Maremmani, I., Pacini, M. Lubrano, S.. and Lovrecic, M. (2003) When ―enough‖ is still not
―enough‖. Effectiveness of high-dose methadone in the treatment of heroin addiction.
Heroin Addiction & Related Clinical Problems. 5(1): 17-32.
Marsch, L. A. (1998). The efficacy of methadone maintenance interventions in reducing illicit
opiate use, HIV risk behaviour, and criminality: a meta-analysis. Addiction. 93(4): 515-
532.
Maruyama, T., Otagiri, M., Takadate, A. (1990). Characterization of drug binding sites on alpha
1-acid glycoprotein. Chemical and Pharmaceutical Bulletin. 38(6): 1688-1691.
Matsumoto K., Sukimoto, K., Nishi, K., Maruyama, T., Suenaga, A., Otagiri, M. (2002)
Characterization of Ligand Binding Sites on the α1-Acid Glycoprotein in Humans,
Bovines and Dogs. Drug Metabolism Pharmacokinetics. 17(4): 300-306.
Matsushita, Y. and Moriguchi, I. (2003) Measurement of protein binding by ultracentrifugation.
Chemical and Pharmaceutical Bulletin. 33: 2948-2955.
McCarthy, J.J. and Posey, B.L. (2000) Methadone Levels in Human Milk. Journal of Human
Lactation. 16(2): 115-120.
McGuire, J.M., Stewart, Y.M. and Smith, K.D. (1999) The Effect of pH on the High pH Anion-
Exchange Chromatography Elution of monosaccharides. Chromatographia. 49(11/12):
699-702.
McKeganey, N., Bloor ,M., Robertson, M., Neale, J., MacDougall, J. (2006). Abstinence and
drug abuse treatment: Results from the Drug Outcome Research in Scotland study. Drugs:
education, prevention and policy. 13(6): 537-550.
Melichar, J.K., Hume, S.P., Williams, T.M., Daglish, R.C., Taylor, L.G., Ahmad, R., Malizia,
A.L., Brooks, D.J., Myles, J.S., Lingford-Hughes, A. and Nutt, D.J (2005) Using
[11
C]Diprenorphine to Image Opioid Receptor Occupancy by Methadone in Opioid
Addiction: Clinical and Preclinical Studies. Journal of Pharmacology and Experimental.
Therapeutics. 321(1): 309-315.
Menkes, C. (1993). Effects of disease-mdifying anti-rheumatic drugs, steroids and non-steroidal
anti-inflammatory drugs on acute-phase proteins in rheumatoid arthritis. British Journal
of Rheumatology. 32:14-18.
Metzler, D.E. and Metzler, C.M. (2003) Sugars, Polysaccharides and Glycoproteins,
Biochemistry: the chemical reactions of living cells. Volume 2 (Edited by Metzler, D.E.)
Academic Press.

231
Mock, K.K., Davey, M. and Cottrell, J.S. (1991) The analysis of underivatized oligosaccharides
by matrix-assisted laser desorption mass-spectrometry. Biochemical and Biophysical
Research Communications. 177: 644–651.
Mooney, P., Hayes, P. and Smith, K. (2006) The putative use of α-1-acid glycoprotein as a non-
invasive marker of fibrosis. Biomedical Chromatography. 20: 1351-1358.
Morell, A.G., Gregoriadia, G. and Scheinberg, I.H. (1971) The Role of Sialic Acid in
Determining the Survival of Glycoproteins in the Circulation. Journal of Biological
Chemistry. 246(5):1461-1467.
Morley, J.S. and Makin, M.K. (1998) The use of methadone in cancer pain poorly responsive to
other opioids. Pain Reviews. 5: 51–58.
Morrone, G., Ciliberto , G., Oliviero, S., Arcone, R., Dente, L., Content, J., Cortese, R. (1988)
Recombinant interleukin 6 regulates the transcriptional activation of a set of human acute
phase genes. Journal of Biological Chemistry. 263: 12554-12558.
Moule, S.K., Peak, M., Thompson, S. and Turner, G.A. (1987) Studies of the sialylation and
microheterogeneity of human serum α1-acid glycoprotein in health and disease. Clinica
Chimica Acta. 166: 177-185.
Muller, W.E. (1988). In I.W. Wainer and D.E. Drayer (Eds), Drug Stereochemistry. Analytical
Methods and Pharmacology, Marcel Dekker, New York and Basel, p. 227
Neuburger, G.G. and Johnson, D.C. (1987) Pulsed amperometric detection of carbohydrates at
gold electrodes with a two-step potential waveform. Analytical Chemistry. 59(1): 150-154.
Newcombe, R. (1996). Live and let die: is methadone more likely to kill you than heroin?
Druglink. January-February issue. 9-12.
O‘Connor, S.E. and Imperiali, B. (1997) Conformational Switching by Asparagine-Linked
Glycosylation. Journal of the American Chemical Society. 119: 22295-96.
O‘Connor, P.G., Oliveto, A.H., Shi, J.M., Triffleman, E.G., Carroll, K.M., Kosten, T.R.,
Rounsaville, B.J., Pakes, J.A., Schottenfeld, R.S. (1998) A randomized trial of
buprenorphine maintenance for heroin dependence in a primary care clinic for substance
users versus a methadone clinic. American Journal of Medicine. 105(2): 100-105.
Okinaga, T., Ohashi, Y. and Hoshi, M. (1992) A novel saccharide structure, Xyl 1→3 Gal 1→
(SO3−)3, 4 Fuc→, is present in acrosome reaction-inducing substance of the starfish,
Asterias amurensis. Biochemical and Biophysical Research Communications. 186(1):
405-410.
Olsen, G. (1973). Methadone binding to human plasma proteins. Clinical Pharmacology and
Therapeutics. 14: 338-343.
Orczyk-Pawiłowicz, M., Hirnle, L. and Kątnik-Prastowska, I. (2006) Alterations of N-glycan
branching and expression of sialic acid on amniotic fluid alpha-1-acid glycoprotein
derived from second and third trimesters of normal and prolonged pregnancies. Clinica
Chimica Acta. 367: 86 – 92.

232
Oravcova, J., Sojkova, D. Lindner W. (1996) Comparison of the Hummel-Dreyer method in
high-performance liquid chromatography and capillary electrophoresis conditions for
study of the interaction of (RS)-, (R)- and (S)-carvedilol with isolated plasma proteins.
Journal of Chromatography B. 682: 349-357.
Parikh, H.H., McElwain, K., Balasubramanian, V., Leung, W., Wong, D., Morris, M.E. and
Ramanathan, M. (2000) A Rapid Spectrofluorimetric Technique for Determining Drug-
Serum Protein Binding Suitable for High-Throughput Screening. Pharmaceutical
Research. 17(5): 632-637.
Parsons, L.H., Koob, G.F. and Weiss, F. (1995) Serotonin dysfunction in the nucleus
accumbens of rats during withdrawal after unlimited access to intravenous cocaine.
Journal of Pharmacology and Experimental Therapeutics. 274: 1182-1191
Paskach, T.J., Lieker, H-P., Reilly, P.J., Thielecke, K. (1991) High-performance anion-
exchange chromatography of sugars and sugar alcohols on quaternary ammonium resins
under alkaline conditions. Carbohydrate Research. 215(1): 1-14.
Paterson, S.C., Lim, C.K., Smith, K.D. (2003). Analysis of the interaction between alpha-1-acid
glycoprotein and tamoxifen and its metabolites. Biomedical Chromatography. 17: 143-
148.
Paulson, J.C. and Colley, K.J. (1989) Glycosyltransferases: structure, localization and control of
cell type-specific glycosylation. Journal of Biological Chemistry. 264: 17615-17618.
Pawlowski, T., Mackiewicz, S.H. and Mackiewicz, A. (1989) Microheterogeneity of alpha1-
acid glycoprotein in the detection of intercurrent infection in patients with rheumatoid
arthritis. Arthritis and Rheumatism. 32: 347-351.
Peles, E., Schreiber, S., Naumovsky, Y., Adelson, M. (2007) Depression in methadone
maintenance treatment patients: Rate and risk factors. Journal of Affective Disorders. 99:
213–220.
Perkins, S.J., Kerckaert, J-P., Loucheux-lefebvre, M (1985) The shapes of biantennary and
tri/tetraantennary α1-acid glycoprotein by small angle neutron and X-ray scattering.
European Journal of Biochemistry. 147: 151-171.
Perneger, T.V., Giner, F., del Rio, M. and Mino, A. (1998) Randomised trial of heroin
maintenance programme for addicts who fail in conventional drug treatments. Biomedical
Journal. 317: 13-18.
Pfeiffer, G., Geyer
, H., Geyer, R., Kalsner, I. and Wendorf, P. (1990) Separation of glycoprotein-
N-glycans by high-pH anion-exchange chromatography. Biomedical Chromatography.
4(5): 193-199.
Pike, E., P. Kierulf, Skuterud, B., Bredesen, J.E., Lunde, P.K.M. (1983). Drug binding in sera
deficient in lipoproteins, albumin or orosomucoid. British Journal of Clinical
Pharmacology. 16: 233-239.

233
Plancke, Y., Dautrevaux, M. And Biserte, G. (1978) Human serum hemopexin : direct evidence
for change of its isoelectric point upon heme binding. A new serum protein fractionation.
Biochimie. 60: 171–175.
Plummer, T.H., Elder, J.H., Alexander, S., Phelan, A.W. and Tarentino, A.L. (1984)
Demonstration of Peptide:N-Glycosidase F Activity in Endo-β-N-acetylglucosaminidase
F Preparations. Journal of Biological Chemistry. 259(17): 10700-10704.
Pos, O., van Dijk, W., Ladiges, N., Linthorst, C., Sala, M., van Tiel, D., Boers, W. (1988)
Glycosylation of four acute-phase glycoproteins secreted by rat liver cells in vivo and in
vitro. Effects of inflammation and dexamethasone. European Journal of Cell Biology. 46:
121-128.
Pos, O., Oostendorp, R.A.J., Van der Stelt, M.E., Scheper, R.J. and van Dijk, W. (1990) Con A-
nonreactive human α1-acid glycoprotein (AGP) is more effective in modulation of
lymphocytes proliferation than Con A-reactive AGP serum variants. Inflammation. 14:
133-141.
Power, A., Mackie, M., Thompson, A., Carroll, J. (2002). Dihydrocodeine, Detoxification and
DVTs. NHS: Glasgow Prescriber.
Preston, K.L., Griffiths, R., Stitzer, M.L., Bigelow, G.E. and Liebson, I.A. (1984) Diazepam
and methadone interactions in methadone maintenance. Clinical Pharmacology and
Therapeutics. 36: 534–541.
Pruessner, J.C., Champagne, F., Meaney, M.J. and Dagher, A. (2004) Dopamine Release in
Response to a Psychological Stress in Humans and Its Relationship to Early Life Maternal
Care: A Positron Emission Tomography Study Using [11
C]Raclopride. The Journal of
Neuroscience. 24(11):2825-2831.
Rademacher, T.W., Parekh, R.B. and Dwek, R.A. (1988) Glycobiology. Annual Review of
Biochemistry. 57: 785-838.
Rehm, J., Gschwend, P., Steffen, T., Gutzwiller, F., Dobler-Mikola, A., Uchtenhagen, A. (2001).
Feasibility, safety, and efficacy of injectable heroin prescription for refractory opioid
addicts: a follow-up study. Lancet. 358(9291): 1417-1420.
Robertson, J. R., Raab, G. M., Bruce, M., McKenzie, J.S., Storkey, H.R., Salter, A. (2006).
Addressing the efficacy of dihydrocodeine versus methadone as an alternative
maintenance treatment for opiate dependence: a randomized controlled trial. Addiction.
101(12): 1752-1759.
Rocklin, R.D. and Pohl, C.A. (1983) Determination of Carbohydrates by Anion Exchange
Chromatography with Pulsed Amperometric Detection. Journal of Liquid
Chromatography and Related Technologies. 6(9): 1577-1590.
Rodriguez Rosas, M.E., Preston, K.L., Epstein, d.H., Moolchan, E.T. Wainer, I.W. (2003)
Quantitative determination of the enantiomers of methadone and its metabolite (EDDP) in

234
human saliva by enantioselective liquid chromatography with mass spectrometric
detection. Journal of Chromatography B. 796: 355-370.
Romach, M.K., Piafsky, K.M., Abel, J.G., Khouw, V., Sellers, E.M. (1981) Methadone binding
to orosomucoid (α1-acid glycoprotein): Determinant of free fraction in plasma. Clinical
Pharmacology and Therapeutics. 29: 211–217.
Rook, E.J., Hillebrand, M.J.X., Rosing, H., van Ree, J.M. and Beijnen, J.H. (2005) The
quantitative analysis of heroin, methadone and their metabolites and the simultaneous
detection of cocaine, acetylcodeine and their metabolites in human plasma by high-
performance liquid chromatography coupled with tandem mass spectrometry. Journal of
Chromatography B. 824(1-2):213-221.
Rostami-Hodjegan, A., Wolff, K., Hay, A.W., Raistrick, D., Calvert, R. and Tucker, G.T. (1999)
Population pharmacokinetics of methadone in opiate users: characterization of time-
dependent changes. British Journal of Clinical Pharmacology. 48:43-52.
Routledge, P.A. (1989). Clinical Relevance of Alpha1 Acid Glycoprotein in Health and Disease.
Progress in Clinical and Biological Research. 300: 185-198.
Rundlett, K. L. and Armstrong, D. W. (2001) Methods for the determination of binding
constants by capillary electrophoresis. Electrophoresis. 22: 1419–1427.
Rydén, I., Skude, G., Lundblad, A., Pâhlsson, P. (1997). Glycosylation of α1-acid glycoprotein
in inflammatory disease: analysis by high-pH anion-exchange chromatography and
concanavalin A crossed affinity immunoelectrophoresis. Glycoconjugate Journal. 14:481-
488.
Rydén, I., Lundblad, A. And Pâhlsson, P. (1999) Lectin ELISA for Analysis of a1-Acid
Glycoprotein Fucosylation in the Acute Phase Response. Clinical Chemistry. 45(11):
2010-2012.
Rydén, I., Pâhlsson, P., Lundblad, A. and Skogh, T. (2002) Fucosylation of a1-acid glycoprotein
(orosomucoid) compared with traditional biochemical markers of inflammation in recent
onset rheumatoid arthritis. Clinica Chimica Acta. 317: 221–229.
Sabatini, D.D., Kreibich, G., Morimoto, T., Adesnik, M. (1982) Mechansims for the
incorporation of proteins in membranes and organelles. Journal of Cellular Biology. 92:
1-22.
SACDM. (2007). Reducing harm and promoting recovery: a report on methadone treatment
misuse in Scotland. [internet]. PLACE: SACDM methadone Project Group (Published
2007). Available at: http://www.scotland.gov.uk/Publications/2007/06/22094730/0
[accessed 20 Aug 2008].
Salmon, A.Y., Goren, Z., Avissar, Y., Soreq, H. (1999) Human erythrocyte but not brain
acetylcholinesterase hydrolyses heroin to morphine. Clinical and Experimental
Pharmacology and Physiology. 26: 596-600.

235
Sasisekharan, R. and Myette, J.R. (2003). The Sweet Science of Glycobiology. The American
Scientist. 91: 432-441.
Scanlin, T.F. and Glick, M.C. (2000) Terminal glycosylation and disease: Influence on cancer
and cystic fibrosis. Glycoconjugate Journal. 17: 617-626.
Schmid, K. (1950) Preparation and properties of an acid glycoprotein prepared from human
plasma. Journal of the American Chemical Society. 72: 2861.
Schmid, K., Kaufmann, H., Isemura, S., Bauer, F., Emura, J., Motoyama, T., Ishiguro, M. and
Nanno, S. (1973) Structure of α1-acid glycoprotein. The complete amino acid sequence,
multiple amino acid substitutions and homology with the immunoglobulins. Biochemistry.
12: 2711-2724.
Schmid, K., Mao, S.K.Y., Kimura, A., Hayashi, S. and Binette, J.P. (1980) Isolation and
characterization of a serine-threonine-rich galactoglycoprotein from normal human
plasma. Journal Biological Chemistry. 255: 3221-3226.
Schumacher, M.A., Basbaum, A.I. and Way, W.L. (2009) In Katzung, B.G., Masters, S.B. and
Trevor, A.J. (Eds.) Opioid Analgesics and Antagonists. Basic and Clinical Pharmacology,
11th Edition. P 531-552.
Scimeca, M., Savage, S.R., Portenoy, R., Lowinson, J. (2000). Treatment of Pain in Methadone-
Maintained Patients. Mount Sinai Journal of Medicine. 67(5 and 6): 412-422.
Scottish Office Home and Health Department, (1994). Drugs in Scotland: meeting the
challenge. Report of Ministerial Drugs Task Force. Scottish Office Home and Health
Department. Edinburgh: Scottish Office.
Sears, P. and Wong, C.H. (1998) Enzyme action in glycoprotein synthesis. Cell and Molecular
Life Sciences. 54: 223-252.
Sees, K. L., Delucchi, K.L., Masson, C., Rosen, A., Clark, H.W., Robillard, H., Bany, P., Hall,
S.M. (2000). Methadone Maintenance vs 180-Day Psychosocially Enriched
Detoxification for Treatment of Opioid Dependence. Journal of the American Medical
Association. 283(10): 1303-1310.
Seymour, A., Black, M., Jay, J. And Oliver, J.S. (2001).The role of dihydrocodeine in causing
death among drug users in the west of Scotland. Scott Med J 46(5): 143-146.
Shine, H. J., and Mach, E. E. (1965) Ion Radicals. V. Phenothiazine, phenothiazine-5-
oxide, and phenothiazine-3 in acid solutions. J. Org. Chem. 30: 2130-2139.
Silamut, K., Molunto, P., Ho, M., Davis, T.M.E., White, N.J. (1991). Alpha 1-acid glycoprotein
(orosomucoid) and plasma protein binding of quinine in falciparum malaria. British
Journal of Clinical Pharmacology. 32: 311-315.
Sim, H-J., Jeong, J-S., Kwon, H-J., Kang, T.H., Park, H.M., Lee, Y-M., Kim, S.Y., Hong, S-P
(2009) HPLC with pulsed amperometric detection for sorbitol as a biomarker for diabetic
neuropathy. Journal of Chromatography B. 877: 1607-1611.
236
Smith, K.D., Elliot, M.A., Elliot, H.G., McLaughlin, C.M., Wightman, P. and Wood, G.C.
(1994) Heterogeneity of α1-acid glycoprotein in rheumatoid arthritis. Journal of
Chromatography B. 661: 7-14.
Smith, K.D., Hounsell, E.F., McGuire, J.M., Elliot, M.A. and Elliot, H.G. (1997) Structural
elucidation of the N-linked oligosaccharides of glycoproteins using high pH anion-
exchange chromatography. Advances in Macromolecular Carbohydrate Research. 1: 65-
91.
Smith, K.D., Pollacchi, A., Field, M. and Watson, J. (2002) The heterogeneity of the
glycosylation of alpha-1-acid glycoprotein between the sera and synovial fluid in
rheumatoid arthritis. Biomedical Chromatography. 16: 261-266.
Sousa, M.C., Ferrero-Garcia, M.A. and Parodi, A.J. (1992) Recognition of the oligosaccharide
and protein moieties of glycoproteins by the UDP-Glc:glycoprotein glucosyltransferase.
Biochemistry. 31: 97-105
Strain, E.C., Bigelow, G.E., Liebson, I.A., Stitzer, M.L. (1999) Moderate- vs High-Dose
Methadone in the Treatment of Opioid Dependence. Journal of the American Medical
Association. 28: 1000-1005.
Strang, J., Sheridan, J., Hunt, C., Kerr, B., Gerada, C., Pringle, M. (2005). The prescribing of
methadone and other opioids to addicts: national survey of GPs in England and Wales.
The British Journal of General Practice. 55: 444-451.
Stoscheck, CM. (1990) Quantitation of Protein. Methods in Enzymology. 182: 50-69.
Sullivan, L.E., Metzger, D.S., Fudala, P.J. Fiellin, D.A. (2005) Decreasing international HIV
transmission: the role of expanding access to opioid agonist therapies for injection drug
users. Addiction. 100(2) 150-158.
Szöllosi, É., Kremmer, T., Ludányi, K., Imre, T., Schlosser, G., Boldizsár., Vincze, B. and
Vékey. K. (2004) A Novel Method for the Separation and Purification of Human Serum
Acid Alpha-1-Glycoprotein. Liquid Chromatographic and Mass Spectrometric
Investigation of Tryptic Fragments. Chromatographia. 60(1): S213-S219.
Taylor, M.E. and Drickamer, K (2003) Introduction to Glycobiology. Oxford University Press
Limited.
Tilg, H., Dinarello, C.A., Mier, J.W (1993) Antiinflammatory Properties of Hepatic Acute
Phase Proteins: Preferential Induction of Interleukin 1 (IL-1) Receptor Antagonist over
IL-1β Synthesis by Human Peripheral Blood Mononuclear Cells. The Journal of
Experimental Medicine. 178: 1629-1636.
Tillement, J-P., Urien, S., Chaumet-Riffaud, P., Riant, P., Bree, F., Morin, D., Albengres, E.,
Barre, J. (1988) Blood Binding and Tissue Uptake of Drugs. Recent Advances and
Perspectives. Fundamental and Clinical Pharmacology. 2: 223-238.

237
Tomei, L., Eap, C.B., Baumann, P., Dente, L. (1989) Use of transgenic mice for the
characterization of human alpha 1-acid glycoprotein (orosomucoid) variants. Human
Genetics. 84: 89-91.
Townsend, R.R., Hardy, M.R., Hindsgaul, O. and Lee, Y.C. (1988) High-performance anion-
exchange chromatography of oligosaccharides using pellicular resins and pulsed
amperometric detection. Analytical Biochemistry. 174: 459-470.
Townsend, R.R., Hardy, M.R., Cumming, D.A., Carver, J.P. and Bendiak, B. (1989) Separation
of branched sialylated oligosaccharides using high-pH anion-exchange chromatography
with pulsed amperometric detection. Analytical Biochemistry. 182: 1-8.
Travis, J., Bowen, J., Tewksbury, D., Johnson, D. and Pannell, R. (1976) Isolation of albumin
from whole human plasma and fractionation of albumin-depleted plasma. Biochemical
Journal. 157: 301-306.
Treuheit, M.J., Costello, C.E. and Halsall, H.B. (1992) Analysis of the five glycosylation sites
of human α1-acid glycoprotein. Biochemical Journal. 283: 105-112.
Turner, G.A., Skillen, A.W., Buamah, P., Guthrie, D., Welsh, J., Harrison, J. and Kowalski, A.
(1985) Relation between raised concentrations of fucose, sialic acid and the acute phase
proteins in serum from patients with cancer: choosing suitable serum glycoprotein
markers. Journal of Clinical Pathology. 38: 588-592.
Van den Brink, W., Hendriks, V.M. and van Ree, J.M. (1999) Medical co-prescription of heroin
to chronic, treatment-resistant methadone patients in the Netherlands. Journal of Drug
Issues. 29 (3): 587–608.
Van den Heuvel, M.M., Poland, D.C.W., De Graaf, C.S., Hoefsmit, E.C.M., Postmus, P.E.,
Beelen, R.H.J. and van Dijk, W. (2000) The degree of branching of the glycans of α1-acid
glycoprotein in asthma. American Journal of Respiratory and Critical Care Medicine.
161: 1972-1978.
van der Linden, E.C.M., De Graaf, T.W., Anbergen, M.G., Dekker, R.M., van Ommen, E.C.R.,
van den Eijnden, D.H. and van Dijk, W. (1994) Preparative affinity electrophoresis of
different glycoforms of serum glycoproteins: application for the study of inflammation-
induced expression of sialyl-LewisX groups on α1-acid glycoprotein (orosomucoid).
Glycosylation and Disease. 1: 45-52.
van Dijk, W., Pos, O., van der Stelt, M.E., Moshage, H.J., Yap, S.H., Dente, L., Baumann, P.
and Eap, C.B. (1991) Inflammation-induced changes in expression and glycosylation of
genetic variants of α1-acid glycoprotein. Biochemical Journal. 276: 343-347.
van Dijk, W., Turner, G.A. and Mackiewicz, A. (1994) Changes in glycosylation of acute-phase
proteins in health and disease: occurrence, regulation and function. Glycosylation and
Disease. 1: 5-14.
Van Dijk, W., Brinkman-Van der Linden, E.C.M. and Havenaar, E.C. (1998) Glycosylation of ~
1-Acid Glycoprotein (Orosomucoid) in Health and Disease: Occurrence Regulation and
238
Possible Functional Implications. Trends in Glycoscience and Glycotechnology. 10: 235-
245.
van Halbeek, H., Dorland, L. and Vliegenthart, J.F.G. (1981) Characterization of the
microheterogeneity in glycoproteins by 500-MHz 1H-NMR Spectroscopy of
glycopeptides preparations. Journal of Biological Chemistry. 256: 5588-5590.
Varki, A. (1993) Biological roles of oligosaccharides: all of the theories are correct.
Glycobiology. 3: 97-130.
Varki, A. (1992) Diversity in the sialic acids. Glycobiology. 2: 25-40.
Varki, A., Cummings, R.D., Esko, J.D., Freeze, H.H., Stanley, P., Bertozzi, C.R., Hart, G.W.
and Etzler, M.E. (2009) Essentials of Glycobiology, 2nd
Edition. Cold Spring Harbour
Laboratory Press.
Veering, B.TH., Burm, A.G.L., Souverijn, J.H.M., Serree, J.M.P., Spierdijk, J. (1990). The
effect of age on serum concentrations of albumin and alpha 1-acid glycoprotein. British
Journal of Clinical Pharmacology. 29: 201-206.
Vetulani, J. (2001) Drug Addiction. Part I. Psychoactive Substances in the past presence. Polish
Journal of Pharmacology. 53: 303-317.
Voulgari, F., Cummins, P., Gardecki, T., Beeching, N.J., Stone, P.C.W., Stuart, J. (1982).
Serum levels of acute phase and cardiac proteins after myocardial infarction, surgery, and
infection. British Heart Journal. 48: 352-356.
Walsh, S. L. and T. Eissenberg (2003) The clinical pharmacology of buprenorphine:
extrapolating from the laboratory to the clinic. Drug and Alcohol Dependence. 70(2):
S13-S27.
Ward, J., Hall, W., Mattick, R.P. (1999). Role of maintenance treatment in opioid dependence
Lancet. 353: 221-226.
Wasan K.M and Cassidy SM (1998) Role of plasma lipoproteins in modifying the biological
activity of hydrophobic drugs. Journal of Pharmaceutical Sciences. 87 (4) 411-423.
Weimer, H.E., Mehl, J.W. and Winzler, R.J. (1950) Studies on the mucoproteins of human
plasma: isolation and characterization of a homogenous mucoprotein. Journal of
Biological chemistry. 185: 561-568.
Weiss, F., Markou, A., Lorang, M.T., Koob, G.F. (1992) Basal extracellular dopamine levels in
the nucleus accumbens are decreased during cocaine withdrawal after unlimited-access
self-administration. Brain Research. 593: 314-318.
WHO Expert Committee on Drug Dependence. Meeting (34th: 2006: Geneva, Switzerland)
WHO Expert Committee on Drug Dependence: thirty-fourth report.
Williams, J.P., Weiser, M.R., Pechet, T.T.V., Kobzik, L., Moore, F.D. and Hechtman, H.B.
(1997) α1-acid glycoprotein reduces local and remote injuries after intestinal ischemia in
the rat. American Journal of Physiology – Gastrointestinal and Liver Physiology. 273:
1031-1035.

239
Williams, D.O., Borer, J., Braunwald, E., Chesebro, J.H., Cohen, L.S., Dalen, J., Dodge, H.T.,
Francis, C.K., Knatterud, G. and Ludbrook, P. (1986) Intravenous recombinant tissue-
type plasminogen activator in patients with acute myocardial infarction: a report from the
NHLBI thrombolysis in myocardial infarction trial. Circulation. 73: 338-346.
Wilson, J. E. (1976) Applications of blue dextran and cibacron blue F3GA in purification and
structural studies of nucleotide-requiring enzymes. Biochemical and Biophysical
Research Communications. 72, 816-823.
Wolff, K., Sanderson, M., Hay, A.w.m., Raistrick, D (1991) Methadone Concentrations in
Plasma and Their Relationship to Drug Dosage. Clinical Chemistry. 37(2): 205-209
Wolff, K., Rostami-Hodjegan, A., Hay, A.W.M., Raistrick, D. and Tucker, G. (2000). P-based
pharmacokinetic approach for methadone monitoring of opiate addicts: potential clinical
utility. Addiction. 95(12): 1771-1783.
Woods, J.H and Winger, G (1997) Abuse liability of flunitrazepam. Journal of Clinical
Psychopharmacology. 17:1S-57S
World Drug Report 2010. UNODC. UNODC, World Drug Report 2010 (United Nations
Publication, Sales No.E.10.XI.13)
Wormald, M.R. and Dwek, R.A. (1999) Glycoproteins: glycan presentation and protein-fold
stability. Structure. 7: R155-R160.
Xuan, H. and Hage, D.S. (2005) Immobilization of α1-acid glycoprotein for chromatographic
studies of drug–protein binding. Analytical Biochemistry. 346(2): 300-310.
Yet, M-G. and Wold, F. (1990) The distribution of glycan structures in individual N-
glycosylation sites in animal and plant glycoproteins. Archives of Biochemistry and
iophysics. 278: 356-364.
Yue, Q.Y., Hasselström, J., Svensson, J.O. and Säwe, J. (1991) Pharmacokinetics of codeine
and its metabolites in Caucasian healthy volunteers: comparisons between extensive and
poor hydroxylators of debrisoquine. British Journal of Clinical Pharmacology. 31(6):
635-642.
Zador, D., Sunjic, S. and Darke, S. (1996) Heroin-related deaths in New South Wales, 1992:
toxicological findings and circumstances. The Medical of Journal of Australia. 164: 204-
207.
Zdebska, E. and Kościelak, J. (1999) A Single-Sample Method for Determination of
Carbohydrate and Protein Contents glycoprotein Bands by Sodium Dodecyl sulphate-
Polyacrylamide Gel Electrophoresis. Analytical Biochemistry. 275: 171-179.
Zhang, Y., Leonessa, F., Clarke, R. And Wainer, I.W. (2000) Development of an immobilized
P-glycoprotein stationary phase for on-line liquid chromatographic determination of drug-
binding affinities. Journal of Chromatography B. 739: 33–37.

240
Appendix

The analysis of glycosylation: a continuedneed for high pH anion exchangechromatographyJennifer L. Behan and Kevin D. Smith*
ABSTRACT: An appreciation of the structures of the oligosaccharide chains which become attached to biomolecules (theprocess known as glycosylation), and their relevance to the biological function of the molecule concerned, has progressedrapidly in recent years with developments in site-selective protein glycosylation, oligosaccharide synthesis and in vivo target-ing of oligosaccharides. These developments have necessitated the parallel development of effective analytical tools for thedetermination of the structures of glycosylation. The conclusion of studies in the 1980s and 1990s was that high pH anionexchange chromatography (HPAEC) was the most effective HPLC mode for the analysis of glycosylation. It allowed the frac-tionation of complex mixtures of monosaccharides or oligosaccharides, the latter in terms of charge, size, composition, ano-merity and intra-chain linkages. This review reinvestigates whether HPAEC still appears to offer the most effective means ofanalysing glycosylation. Copyright © 2010 John Wiley & Sons, Ltd.
Keywords: HPAEC; glycosylation; biomarkers
Introduction
Glycosylation is a complex, ordered and energy-consumingprocess that has become recognized as both functionally signifi-cant and responsible for presenting huge structural diversity.Intra- and intermolecular properties such as circulatory lifespan,immune modulation, solubility and conformation stability havebeen shown to be dependent upon the expression of oligosac-charides by glycoconjugates (Lis and Sharon, 1993; Varki, 1993).
Oligosaccharide chains are ordered structures comprisingvarious monosaccharides, primarily the hexoses, mannose (Man),galactose (Gal), the deoxyhexose fucose (Fuc), and the hex-osamines, glucosamine and galactosamine (formed by the addi-tion of an amino group on carbon 2 of a hexose). The hexosaminesare commonly N-acetylated to form N-acetylglucosamine(GlcNAc) and N-acetylgalactosamine (GalNAc) respectively.Finally, N-acetylneuraminic acid (NeuAc), a nine-carbon sialic acid,with a formal negative charge, is commonly the terminal compo-nent of oligosaccharide chains (Varki, 1992).
An oligosaccharide chain is synthesized by individual attach-ment of monosaccharide components in specific sequences tothe protein or lipid biomolecule initially in the endoplasmicreticulum (ER) lumen, then in the cis Golgi where the final struc-tural modifications occur (Kobata, 1992; Sasisekharan andMyette, 2003). This synthesis and modification of oligosaccharidestructures is enzymatic in origin and is regulated by glycosyl-transferases in the ER and Golgi apparatus (Rademacher et al.,1988, Lis and Sharon, 1993).
Glycoproteins are classified by the mechanism of attachmentto the protein backbone. Glycans attached to the amide nitrogenof asparagine (Asn) amino acids are termed N-linked structures.This type of glycosylation only occurs when the Asn residue ispart of a consensus sequence Asn–X–Ser/Thr where X is never
proline because it hinders the formation of the important sec-ondary structure: b turns (Avanov, 1991). O-linked glycosylationoccurs when the oligosaccharide chain is attached to the biomol-ecule through the hydroxyl group of either a serine or threonineamino acid. N-linked oligosaccharide chains all contain acommon pentasaccharide core (Man3GlcNAc2), as indicated inFig. 1. The monosaccharides attached to this can differ, causingthe generation of three main families—high mannose, complexand hybrid N-glycans (Kobata, 1992; Hashimoto et al., 2004).O-linked glycans however are not restricted by the need for thepresence of a specific core structure; instead synthesis is com-monly initiated in the Golgi by the transfer of GalNAc (catalysedby an N-acetyl galactosaminyltransferase) to a Ser or Thr residueof the peptide, followed by the action of specific transferaseswhich lead to the formation of various core structures. Theprocess does not require a preceding assembly pathway in theER, which is required during N-glycan synthesis (Hounsell et al.,1996). The mucin-type O-glycans are thought to be the largestgroup; GalNAc is the initiating sugar and there are six core oli-gosaccharide structures possible (Van den Steen et al., 1998;Sears and Wong, 1998).
One of the key sources of variability is the expression of glyco-conjugates with the same protein or lipid structure but differing
* Correspondence to: K. D. Smith, School of Life Sciences, Edinburgh NapierUniversity, 10 Colinton Road, Edinburgh EH10 5DT, UK. E-mail: [email protected]
School of Life Sciences, Edinburgh Napier University, 10 Colinton Road, Edin-burgh EH10 5DT, UK
Abbreviations used: Fuc, fucose; Gal, galactose; HPAEC, high pH anionexchange chromatography; Man, mannose.
Special Issue: Review
Received 13 July 2010, Accepted 26 July 2010 Published online in Wiley Online Library
(wileyonlinelibrary.com) DOI 10.1002/bmc.1514
Biomed. Chromatogr. 2010 Copyright © 2010 John Wiley & Sons, Ltd.

oligosaccharide components (glycoforms). Their expressionpromotes a high degree of heterogeneity which can be cell-,organ- or tissue-specific and occurs prominently in disease. This‘glycopathology’ (Kobata, 2000) is normally a result of alterationsto the transcription of genes encoding glycosyltransferases bycytokines produced during the acute phase response to injuryand infection as part of the body’s defence system. Understand-ing the potential for the expression of disease-specific glyco-forms could be important in the development of futuretreatments; perhaps offering use as biomarkers for certain patho-logical conditions.
HPLC of Glycosylated StructuresA consideration of the various HPLC stationary phases and modeof detection has been the subject of numerous reviews includingtwo excellent papers in the tenth anniversary edition of thisjournal (Davies and Hounsell, 1996; Lo-Guidice and Lhermitte,1996). A further detailed consideration is outwith the scope ofthis review and instead we intend to follow on from where thelatter articles concluded in that high pH anion exchange chroma-tography (HPAEC) appeared to provide the most optimum andeffective means of resolving and detecting monosaccharides andoligosaccharides. As shown by Lee (1990), HPAEC is able to detectsugars as low as the femtomole level and indeed pleas have beenmade for lower levels of detection (Davies and Hounsell, 1996).
Recently, a major area of glycobiological research has been inthe evaluation of biomarkers or substances that can be indicativeof a biological state. HPAEC has shown great potential in high-lighting alterations in oligosaccharide microheterogeneity whichmay offer use as prognostic and diagnostic biomarkers of disease(Anderson et al., 2002; Mooney et al., 2006).
High pH Anion Exchange Chromatography
The accurate analysis of the glycosylation pattern of glycopro-teins is essential when investigating potential disease-specificchanges and their subsequent evaluation as biomarkers ofdisease diagnosis, prognosis and progression. HPAEC is capableof providing information on both the monosaccharide and oli-gosaccharide composition of N-linked oligosaccharides at a sen-sitivity of 10–100 pmol (Hardy et al., 1988; Townsend et al., 1989;Smith et al., 1997). A major advantage of the technique is that itdoes not require prior derivitization or clean-up of carbohydratesamples in order to allow quantification (Lee, 1990).
The essence of HPAEC is a combination of a polymer-basedpellicular resin (the active component of which is a quaternaryammonium ion), equilibrated by an alkaline mobile phase withdetection by pulsed amperometry. A large number of columnsare available containing specific modifications of the stationaryphase (Table 1) in order to impart a distinctive selectivity of analy-sis. This stationary phase is a characterized by a high mechanicaland chemical stability. One of the first columns developed, theCarboPAc PA1® was a multipurpose column which could be usedfor the analysis of monosaccharides, disaccharides and specificoligosaccharides. Thereafter refinements have resulted incolumns that are more sensitive for the analysis of monosaccha-rides, disaccharides and sialic acids (CarboPAc PA10® and Carbo-PAc PA20®), oligosaccharides (CarboPAc PA100® and CarboPAcPA200®) and reduced monosaccharides and disaccharides(CarboPAc MA1®).
Given that the effectiveness of resolution and detection isdependent upon the ionization of monosaccharides either indi-vidually or as part of a larger moiety, the composition of themobile phase is critical to the sensitivity, selectivity and speed ofthe technique. Normally the mobile phase is sodium hydroxide
a)
β1,2Man α1,2
Manβ1,4GlcNAcβ1,4GlcNAcβ1Asnα1,3
β1,2Man
b) NeuAc α2,3
Gal β1,4 GalNac-Ser/Thr β1,3
Galα2,3
NeuAc
Monosaccharides attached to the outer Man residues can differ widely. All residues
may be Man (high mannose), may have a selection of
GlcNAc, Gal, Fuc etc but no Man (complex), or a mixture
of both (hybrid). Branches are usually terminated in NeuAc
O-linked do not have a common core and the chains
can also be highly substituted.
Glc may also be a component
Figure 1. Simplified glycan structures. The pentasaccharide core of N-linked glycans (a) and an exampleO-linked (b). Adapted from Hashimoto et al. (2004) and Lo-Guidice et al. (1994).
J. L. Behan and K. D. Smith
Biomed. Chromatogr. 2010View this article online at wileyonlinelibrary.com Copyright © 2010 John Wiley & Sons, Ltd.

with the exact concentration used being dependent on thenature of the molecules being analysed. The analysis of oligosac-charides and individual sialic acids, both of which interact morestrongly with the stationary phase, often requires the inclusion ofsodium acetate (or similar) which act as pushing agents to reduceretention to the column. The inclusion of barium acetate in themobile phase is suggested to remove the need for column regen-eration between runs and also eliminates carbonate formation(Cataldi et al., 1999).
In terms of detection, the use of pulsed potentials is impor-tant because it ensures that the gold electrode does not becomecoated in, and therefore fouled by, oxides. Electrocatalytic oxi-dation of weakly acidic sugars occurs when in contact with thegold electrode. These oxidized sugars coat the electrode surface,hindering detection; therefore they must be removed to ensurereproducibility. The potential is increased and a layer of goldoxide can form at the electrode surface thereby removing thesugars. Upon lowering the potential, the coating is removedbecause the oxide is reduced (LaCourse and Johnson, 1993). Thesystem consists of the application of a triple electrical pulse tothe surface of a gold electrode (Fig. 2). The first pulse, of 0.5 sduration (0.05 V) allows electrode equilibration which is fol-lowed by 0.29–0.49 s of sampling time. The second pulse, 0.51–
0.6 s (0.6 V) causes full oxidation of the species on the electrodesurface to their most highly oxidized and most soluble forms,allowing a ‘washing away’ of any contaminating species. Surfaceoxidation of the electrode is inevitable for this process, thusfrom 0.61–0.65 s a reducing potential is applied for the electrodesurface regeneration (-0.6 V). This final pulse of three immedi-ately precedes the electrode re-equilibration time of 0.0–0.29 s(0.05 V).
HPAEC of Monosaccharides andOligosaccharidesUnder alkaline conditions, the hydroxyl groups of a monosaccha-ride, either individually or as part of a sequence, are ionized toexist as negatively charged oxyanions. A monosaccharide pos-sesses several potentially ionizable hydroxyl groups with the fol-lowing descending hierarchy of acidity: 1-OH > 2-OH >> 6-OH >3-OH > 4-OH. The varying location of the OH groups results inslight differences in the pKa value (ranging from 12 to 14) ofindividual monosaccharides under these conditions. The differ-ences in ionization are unique both with respect to individualmonosaccharides and also cumulatively; a sequence of monosac-charides can be exploited chromatographically, using the anion
Table 1. Summary of column composition
Column Composition
CarboPAc PA1® 10 mm-diameter substrate (polystyrene 2% cross-linked with divinylbenzene) agglomerated with 500 nmMicroBead quaternary ammonium functionalized latex (5% cross-linked)
CarboPAc PA10® 10 mm-diameter substrate (ethylvinylbenzene 55% cross-linked with divinylbenzene) agglomerated with460 nm MicroBead™ difunctional quaternary ammonium ion (5% cross-linked)
CarboPAc PA20® 6.5 mm-diameter substrate (ethylvinylbenzene 55% cross-linked with divinylbenzene) agglomerated with130 nm MicroBead difunctional quaternary ammonium ion (5% cross-linked)
CarboPAc PA100® 8.5 mm-diameter ethylvinylbenzene/divinylbenzene substrate (55% cross-linking) agglomerated with 275 nmMicroBead™ quaternary amine functionalized latex (6% cross-linked)
CarboPAc PA200® 5.5 mm-diameter ethylvinylbenzene/divinylbenzene substrate (55% cross-linked) agglomerated with 43 nmMicroBead quaternary amine functionalized latex (6% cross-linked)
CarboPAc MA1® 7.5 mm-diameter vinylbenzyl chloride/divinylbenzene macroporous substrate fully functionalized with analkyl quaternary ammonium group (15% cross-linked)
Figure 2. Pulsed electrochemical detection.
The analysis of glycosylation
Biomed. Chromatogr. 2010 View this article online at wileyonlinelibrary.comCopyright © 2010 John Wiley & Sons, Ltd.

exchange stationary phases and the electrochemical detectorbased on pulsed potentials. The use of eluents with a pH of 12 orhigher stimulates electrocatalytic oxidation of weakly acidicsugars when in contact with the gold electrode.
MonosaccharidesFor a typical monosaccharide analysis, an alkaline environment of0.03 M sodium hydroxide causes ionization and results in the for-mation of oxyanions unique to individual monosaccharides(Fig. 3). The interaction of the charged oxyanions with the stronganion-exchange CarboPac™ column and the slight differences inrelative pKa values aids the chromatographic separation of indi-vidual monosaccharides. The general rule is ‘the lower the pKa;the longer it will be retained by the column’(Lee, 1990). Addition-ally, a monosaccharide with an anomeric OH group, which ismore acidic than other OH groups, is less well retained than thosethat do not contain anomeric OH groups, e.g. the inositols.
Typical conditions for the separation of monosaccharidesusing HPAEC would be a Dionex 600™ HPAEC system (Dionex,Camberley, UK) comprising a CarboPac PA-100 analytical 4 ¥250 mm and guard 4 ¥ 50 mm columns, a GP50 gradient pumpand ED40 electrochemical detector (Johnson and Smith, 2006).The pulsed potentials for the waveform are 0 s, 0.05 V; 0.29 s,0.05 V; 0.49 s, 0.05 V; 0.5 s, 0.05 V; 0.51 s, 0.6 V; 0.6 s, 0.6 V; 0.61 s,-0.6 V; 0.65 s, -0.6 V; and 0.66 s, 0.05 V, as shown in Fig. 2. Atypical separation of monosaccharide standards is shown inFig. 4, which was achieved using an isocratic separation of 0.03 M
sodium hydroxide.
In biomarker research, monosaccharide compositional analysishas become a key tool for the rapid elucidation of changes in themonosaccharide content of oligosaccharides or free oligosaccha-rides that are associated with a disease or pathological condition.Alterations in the oligosaccharide component of alpha-1-acidglycoprotein (AGP) occur in a number of disease conditions(Ceciliani and Pocacqua, 2007). In rheumatoid arthritis, HPAECmonosaccharide compositional analysis has been utilized todemonstrate that hyperfucosylation, hypersialylation andincreased chain branching of AGP glycans occur, differing fromearly acute stages when the content of biantennary chains isincreased (Elliott et al., 1997; Jørgensen et al., 1998). In otherstudies by the same group, the determination of an increasedfucosylation of the oligosaccharide chains in rheumatoid arthritisor burn injury either inhibited collagen fibril formation (Yuleet al., 1999) or resulted in the atypical collagen deposition asso-ciated with hypertrophic scarring (French et al., 2002). HPAECmonosaccharide compositional analysis has proved that it is pos-sible to distinguish individual liver diseases on the basis of theirAGP glycosylation, e.g. in hepatitis C the oligosaccharide chainsexpress more fucose (Fuc) residues in comparison to the otherliver diseases and also contain the rare monosaccharideN-acetylgalactosamine (GalNAc) (Anderson et al., 2002; Mooneyet al., 2006). Further work has established not only that AGP inchronic myeloid leukaemia has unique glycosylation that can becorrelated with severity and prognosis, but also that these alter-ations influence the extent that AGP is able to bind to adminis-tered drugs in the plasma and reduce their therapeutic effect(Jørgensen et al., 2002).
O
O
O
O O
CH2O -
-
-
-
-
-
O
OH
OH
HO
HO
CH2OH
Figure 3. An example of an oxyanion (mannose).
Figure 4. An example of HPAEC trace for separation of known monosaccharide stan-dards. Fuc, fucose; IS, internal standard (2-deoxy-D-galactose); GalN, galactosamine;GlcN, glucosamine. Gal, galactose; Glc, glucose; Man, mannose.
J. L. Behan and K. D. Smith
Biomed. Chromatogr. 2010View this article online at wileyonlinelibrary.com Copyright © 2010 John Wiley & Sons, Ltd.

Reduced MonosaccharidesHistorically, the application of HPAEC to glycosylation analysisfaltered when the analyte of interest either existed, or wasreleased, in a reduced form. Recently Sim et al. (2009) have pro-posed that the HPAEC determination of sorbitol could be ascreening tool to identify diabetic neuropathy. The author testedfour anion-exchange columns (CarboPac PA1, CarboPac PA20 andCarboPac MA1 all from Dionex, and a MetrocepCarb1 fromMetrohm) and concluded that the MetrocepCarb1 column wasthe most efficient for the analysis of sorbitol. They also deter-mined that the most effective PAD waveform consisted of sixpotentials.
Bardotti et al. (2000) used the CarboPac MA1 column to quan-tify ribitol in a conjugate vaccine for Haemophilus influenzae typeb (Hib-CRM; PRP oligosaccharides linked to cross reacting mate-rial of non-toxic diphtheria toxin variant) after TFA hydrolysis andsubsequent chromatographic separation. This analysis allowedaccurate monitoring of free saccharide in the formulated conju-gate both alone and when combined with other vaccines—dueto the requirement of only nanomole levels.
Sialic AcidsSialic acids are a group of sugars which terminate O-linked andN-linked complex and hybrid glycan chains, two common to suchglycans are N-acetyl- and N-glycolyl-neuraminic acid, which differonly by the presence or absence of one hydroxyl (-OH) group.These residues carry a formal negative charge which results in astrong interaction with anion-exchange resins. The subsequentremoval from the strong charge interaction with the stationaryphase requires more robust conditions; an increasing sodiumacetate linear gradient is useful (50–250 mM over 30 min in addi-tion to sodium hydroxide (100 mM). Such conditions are able toseparate N-acetyl- and N-glycolyl-neuraminic acid but not indi-vidual N- or O-acetylated variants (Smith et al., 1997).
OligosaccharidesIn this instance, the alkaline environment created during HPAECallows the efficient separation of oligosaccharide chains on thebasis of their size, formal charge, monosaccharide composition
and intra-chain linkages (Hardy and Townsend, 1988). The appli-cation of oligosaccharide chains to an anion-exchange columnresults in the negatively charged oligosaccharides bindingstrongly to the positively charged beads of the column resin.Subsequent removal from the column requires the addition of aneluent that can compete with the oligosaccharides for the posi-tively charged beads and displace them from the resin. Thestrong interaction of the negatively charged NeuAc with the qua-ternary ammonium-bonded pellicular resin used in HPAECensures that stronger elution conditions are required to displacethe charged molecules from the column (Smith et al., 1997).This is achieved through the addition of a sodium acetate gradi-ent; the greater the negative charge (greater the number ofNeuAc), the higher the sodium acetate concentration required todisplace the oligosaccharides from the column. It is possible forthe oligosaccharides to be separated at a lower pH (4.6) purely onthe basis of their NeuAc content (Townsend et al., 1988), but theadditional oxyanion charge at alkaline pH enhances resolution ofthe oligosaccharide mixture by allowing separation of the chainsbased on isomeric differences (Townsend et al., 1989).
Sialylated OligosaccharidesThe sialylated portion of the oligosaccharide allows separation ofthe chains into distinct charge bands; the greater the number ofsialic acids, the greater the overall negative charge, resulting in alonger retention time. Within these charge bands, the oligosac-charides can be separated according to size with larger structuresdemonstrating greater retention times. On this basis,bi-antennary, bi-sialylated structures will elute earlier than tri-antennary, bi-sialylated structures (Fig. 5). It is also possible forthis technique to detect and successfully separate structureswithin charge bands which differ in one linkage. NeuAc can belinked either a (2, 6) or a (2, 3) to an outer galactose (Gal) residue.The presence, or increased proportion, of a (2, 6) NeuAc-linkedchains results in a reduction in retention time (Townsend et al.,1988). It is thought that, when NeuAc is added with a (2, 6), theoxyanion effect of the 6-OH of Gal is blocked, resulting in anoverall reduction in charge and a decrease in the retention timewhen compared with a (2, 3)-linked NeuAc (Townsend et al.,1989).
Figure 5. A standard HPAEC trace of AGP.
The analysis of glycosylation
Biomed. Chromatogr. 2010 View this article online at wileyonlinelibrary.comCopyright © 2010 John Wiley & Sons, Ltd.
Within each charge band, further separation based on theneutral portion of the oligosaccharide can also be achieved. Thisis demonstrated by the greater retention time of sialylated struc-tures containing Galb (1,3) linked to GlcNAc compared with Galb(1,4)-linked (Townsend et al., 1988, 1989). It was suggested thatthis difference in retention time was due to the conformation ofthe OH groups in the Galb (1,3)-GlcNAc, allowing for greater inter-action with the column. The presence of Fuc on an oligosaccha-ride chain has also been shown to affect retention time, reducingit quite considerably. It is thought that this is due to a ‘masking’effect of the charges present on surrounding monosaccharidesand therefore a reduction in the overall charge of the oligosac-charide (Hardy and Townsend, 1988; Lee, 1990).
In general the analysis of oligosaccharides by HPAEC is verysimilar to monosaccharide analysis except with respect to themobile phase. The column is initially regenerated over two20 min cycles using 50% 1 M NaOH and 50% HPLC-grade waterand then equilibrated for 10 min using 10% NaOH–5% 1 M
NaOAc–85% HPLC-grade water (v/v). The sample then separatesduring a linear gradient over 45 min when the eluent proportionsare 10% NaOH–20% NaOAc–70% HPLC-grade water (v/v). Thecolumn is regenerated over 10 min with an eluent composition of50% NaOH–50% HPLC-grade water (v/v). The final equilibrationstep, lasting 5 min, requires 10% NaOH–5% NaOAc–85% HPLC-grade water (v/v) (Elliott et al., 1997; Smith et al., 1997).
Neutral OligosaccharidesIn 1988, Hardy and Townsend reported on the ability of HPAEC-PAD to separate neutral oligosaccharides by their molecular size,sugar composition and linkage type. Two identical pentasaccha-ride chains, differing only by one residue were resolved; one hada glucose (Glc) residue and the other an N-acetylglucosamine(GlcNAc). The Glc-containing chain eluted more slowly than itsGlcNAc-containing counterpart. They explained this by suggest-ing that the 3-OH group of GlcNAc was less acidic than the 2-OHof Glc, or perhaps the Glc group was able to interact with thestationary phase more readily than GlcNAc. When an oligosac-charide expressed more 1,6 linkages, it was suggested that itsincreased rotational freedom allowed it to interact with the pel-licular resin more strongly. It is possible using the HPAEC-PADtechnique to detect picomole levels of underivitized oligosaccha-rides. Hardy and Townsend were able to separate positional iso-meric oligosaccharides and glycopeptides, and also detectreducing and non-reducing underivitized carbohydrates in thepmol range. The use of an alkyl- or amine-bonded stationaryphase allows the separation of neutral oligosaccharides differingby one monosaccharide; however, if they differ only in the posi-tion of the linkage to a single monosaccharide, it is far harder toseparate effectively (Dua and Bush, 1984; Tomiya et al., 1987;Mellis and Baenziger, 1983; Blanken, et al., 1985).
Anumula and Taylor (1991) separated acidic (asialylated) andneutral (asialo-complex and high-mannose) oligosaccharidechains chromatographically, after cleavage from polypeptidebackbones using peptide N-glucosidase F, endo-b-N-acetylglucosaminidase F and endo-b-N-acetylglucosaminidaseH. The separation required a polymeric anion-exchange columnHPIC-AS6/CarboPac PA-1 (Dionex), protected by a CarboPAcguard column and 0.5 M NaOH and 3% acetic acid–NaOH pH 5.5as eluents, producing a varied gradient when mixed with water.The oligosaccharides were quantified—the technique sensitiveenough to detect <5 pmol—through the use of PAD.
When Fuc and GlcNAc are both present in a molecule, it is likelythat the hydrophobic methyl and acetyl groups, respectively,prevent the interaction of the oligosaccharide anion with thecolumn matrix.
Routier et al. (1998) compared the use of chromatography andlectin-based assays in the quantification of oligosaccharidesreleased from IgG which were purified from the serum of patientssuffering from rheumatoid arthritis. This was to determine thepercentage of glycoforms expressing no Gal, one Gal or two Gal.In some experiments they used reverse-phase or normal-phasecolumns for HPLC—after protease digestion and glycosamini-dase A oligosaccharide release, or hydrazinolysis treatmentby exoglycosidases and a Biogel P4 chromatography of2-aminobenzamide derivatives, or release of oligosaccharidesusing PNGaseF and Biogel P4 chromatography of 2-AB deriva-tives or HPAEC-PAD of native oligos. The change in glycosylationprofile of IgG can be useful in developing a diagnostic test for therheumatic diseases.
The ability of HPAEC to resolve neutral oligosaccharides is per-fectly demonstrated (McGuire et al., 1996) when applied to theresolution of the asialylated and agalactosylated biantennarypresent on immunoglobulin G (IgG).
McGuire et al. (1996) investigated the resolution of neutral oli-gosaccharides in IgG by analysing the effect of alterations to thesodium acetate concentration gradient; the less extreme the gra-dient, the better the resolution of the neutral oligosaccharides(Fig. 6). The most effective was an isocratic mixture of 25%A–0.5% B–4.5% C (where A denotes 1 M sodium hydroxide, B is1 M sodium acetate, and C is HPLC-grade water) for 40 min fol-lowed by regeneration by elution with 50% A–50% C, whichenabled resolution of peaks indistinguishable under more severeacetate conditions at a linear gradient, e.g. 10% A–2% B–88% C to10% A–14% B–76% C over 57 min or 10% A–5% B–85% C to 10%A–20% B–70% C over 40 min.
GlycoformsWhen glycoproteins possess identical amino acid sequence butdifferent glycan components, they are known as glycoforms. ADNA Pac™ PA-100 column has been proposed that allows theseparation of glycoforms of the same glycoprotein which, like thecolumns described for oligosaccharide and monosaccharideanalysis, is a pellicular anion-exchange column. Its ability to dis-tinguish between different levels of sialic acid expression is usefulin distinguishing sialylated glycoforms of glycoprotein and gly-copeptides (Rohrer and Avdalovic, 1996; Rohrer, 1994). Thosewith low sialylation are less well retained by the column and thuselute earlier. The study by Rohrer (1994) indicated that glyco-forms of fetuin can be separated by the structure of the sialylatedglycans attached.
It is also possible to resolve glycoforms with the same degreeof sialylation, but expressing the residues on different branches.The use of CarboPac™ PA-100 columns for the resolution of struc-tures within a group of glycoforms is dependent on the differingsialylation. It is possible to initially separate sialylated glycoformswith a DNA Pac™ PA-100 column and treat the fractions withPNGaseF to release the oligosaccharides, resolving the sialylatedstructures within the glycoform fraction (Townsend and Hardy,1991; Rohrer et al., 1993).
This technique was applied to human serum transferrin glyco-forms (Dionex application note 105) where they reported that,after digested of fractions eluted from the DNA Pac™ PA-100
J. L. Behan and K. D. Smith
Biomed. Chromatogr. 2010View this article online at wileyonlinelibrary.com Copyright © 2010 John Wiley & Sons, Ltd.

column with PNGaseF, the sialylated oligosaccharides wereresolved by degree of sialylation, as seen by the retention timesof each peak. Neuraminidase was used to remove sialic acid resi-dues from PNGaseF F digestions to show that the peaks representsialylation of glycans during HPAEC-PAD analysis. The retentiontimes of sialylated glycans were reduced.
The FutureThe development and emergence of high pH anion exchangechromatography coupled with pulsed amperometry has revolu-tionized the analysis of the glycosylated components of biomol-ecules by offering highly sensitive detection and effectiveseparation without the need for derivitization. Even at thepresent time of writing, more than 20 years after its introductionand without any major change in the mechanisms of separationor detection, the use of HPAEC is widespread and still competitivewith other techniques. A recent study (Adamo et al., 2009) con-cluded that sensitivity of HPAEC in monosaccharide and oligosac-charide compositional analysis of IgG was almost identical to, andcompared favourably with, both capillary electrophoresis–laserinduced fluorescent detection and reverse-phase HPLC coupledto electrospray mass spectrometry. The coupling of HPAEC withmass spectrometry has been accomplished and utilized in severalstudies (Okinaga et al., 1992; Barr et al., 1991); however, MS is stillusually undertaken offline due the high salt concentration of themobile phase.
To date, HPAEC still appears to be the most commonly usedand sensitive technique available in the investigation of the oli-gosaccharide chains of glycoconjugates after enzymatic orchemical release. Not only has it revolutionized the analysis ofmonosaccharides and oligosaccharides in general, but it has alsoprovided the technology required to investigate and identifyalterations in glycosylation that are diagnostically significant asbiomarkers of disease processes.
Recently, a major area of interest for researchers seeking theidentification of biomarkers for breast cancer has involved the‘mapping’ of a tissue (Dwek and Alaiya, 2003). Although the pro-teomic (mapping a tissue or cell according to the proteins it
expresses) approach to cancer biomarkers has yielded importantand fruitful results, recent research has also started to focus onpost-translational modifications of proteins, rather than proteinexpression. Given that more than half of all proteins present inserum are glycosylated and the same glycoprotein can exist as aglycoform population, there is a real requirement for an analyticaltool which is able to identify subtle but significant alterations inglycosylation consistent with the pathogenesis of a disease.HPAEC satisfies this requirement both for the analysis of glycosy-lation in general and in the investigation of disease biomarkers inparticular and the potential is still ongoing and appears positive.
ReferencesAdamo M, Qiu D, Dick Jr LW, Zeng M, Lee A-H and Cheng K-C. Evaluation
of oligosaccharide methods for carbohydrate analysis in a fullyhuman monoclonal antibody and comparison of the results to themonosaccharide composition determination by a novel calculation.Journal of Pharmaceutical and Biomedical Analysis 2009; 49: 181–192.
Anderson NE, Pollacchi A, Hayes P, Therapondos G, Newsome P, Boyter Aand Smith KD. A preliminary evaluation of the differences in the gly-cosylation of alpha-1-acid glycoprotein between individual liver dis-eases. Biomedical Chromatography 2002; 16: 365–372.
Anumula KR and Taylor PB. Rapid characterization of asparagine-linkedoligosaccharides isolated from glycoproteins using a carbohydrateanalyzer. European Journal of Biochemistry 1991; 195: 269–280.
Avanov. Conformational aspects of glycosylation. Molecular Biology 1991;25: 237–249.
Bardotti A, Ravenscroft N, Ricci S, D’Ascenzi S, Guarnieri V, Averani G andConstantino P. Quantitative determination of saccharide in Haemo-philus influenzae type b glycoconjugate vaccines, alone and in com-bination with DPT, by use of high-performance anion-exchangechromatography with pulsed amperometric detection. Vaccine 2000;18: 1982–1993.
Barr JR, Anumula KR, Vettese MB, Taylor PB and Carr SA. Structural classi-fication of carbohydrates in glycoproteins by mass spectrometry andhigh-performance anion-exchange chromatography. Analytical Bio-chemistry 1991; 192: 181.
Blanken WM, Bergh MLE, Koeppen PL and Van den Eijnden DH. High-pressure liquid chromatography of neutral oligosaccharides: effectsof structural parameters. Analytical Biochemistry 1985; 145: 322–330.
Cataldi TDR, Campa C, Angelotti M and Bufo SA. Isocratic separations ofclosely-related mono- and disaccharides by high-performance anion-exchange chromatography with pulsed amperometric detection
Figure 6. Separation of oligosaccharide chains from IgG. A, unknown; B, agalactosy-lated fucosylated biantennary; C, agalactosylated, biantennary; D, monogalactosy-lated biantennary (with bisecting GlcNAc); E, bigalactosylated biantennary (withfucose and bisecting GlcNAc); F, bigalactosylated biantennary (with bisecting GlcNAc).
The analysis of glycosylation
Biomed. Chromatogr. 2010 View this article online at wileyonlinelibrary.comCopyright © 2010 John Wiley & Sons, Ltd.

using dilute alkaline spiked with barium acetate. Journal of Chroma-tography A 1999; 855: 539–550.
Ceciliani F and Pocacqua V. The acute phase protein a1-acid glycoprotein:a model for altered glycosylation during diseases. Current Protein andPeptide Science 2007; 8: 91–108.
Davies MJ and Hounsell EF. Carbohydrate chromatography: towards yoc-tomole sensitivity. Biomedical Chromatography 1996; 10: 285–289.
Dua VK and Bush CA. Resolution of some glycopeptides of hen ovalbuminby reverse-phase high-pressure liquid chromatography. AnalyticalBiochemistry 1984; 137(1): 33–40.
Dwek MV and Alaiya A. Proteome analysis enables separate clustering ofthe normal breast, benign breast and breast cancer tissues. BritishJournal of Cancer 2003; 89: 305–307.
Elliott MA, Elliott HG, Gallagher K, McGuire J, Field M and Smith KD. Inves-tigation into the Concanavalin A reactivity, fucosylation and oligosac-charide microheterogeneity of a1-acid glycoprotein expressed in thesera of patients with rheumatoid arthritis. Journal of Chromatography:Biomedical Applications 1997; 688: 229–237.
French D, Watson J, McCahill B, Taggart IM and Smith KD. A preliminaryevaluation of the functional significance of alpha-1-acid glycoproteinglycosylation on wound healing. Biomedical Chromatography 2002;16: 412–419.
Hardy MR and Townsend RR. Separation of positional isomers of oligosac-charides and glycopeptides by high-performance anion-exchangechromatography with pulsed amperometric detection. Proceedings ofthe National Academy of Science 1988; 85: 3289–3293.
Hardy MR, Townsend RR and Lee YC. Monosaccharide analysis of glyco-conjugates by anion exchange chromatography with pulsed ampero-metric detection. Analytical Biochemistry 1988; 170: 54–62.
Hashimoto S, Asao T, Takahashi J, Yagihashi Y, Nishimura T, Saniabadi AR,Poland DCW, van Dijk W, Kuwano H, Kochibe N and Yazawa S. a1-Acidglycoprotein fucosylation as a marker of carcinoma progression andprognosis. Cancer 2004; 101: 2825–2836.
Hounsell EF, Davies MJ and Renouf D. O-linked protein glycosylationstructure and function. Glycoconj Journal 1996; 13(1): 19–26.
Johnson D and Smith KD. The efficacy of certain anti-tuberculosis drugs isaffected by binding to a-1-acid glycoprotein. Biomedical Chromatog-raphy 2006; 20, 551–60.
Jørgensen HG, Elliott MA, Watson J and Smith KD. a1-Acid glycoproteinderived from the human hepatoma cell line HepG2, and which over-expresses fucose, can function as a ligand for E-selectin. Pharmaceu-tical and Pharmacological Communications 1998; 4: 123–127.
Jørgensen HG, Elliott MA, Paterson S, Holyoake TL and Smith KD. Bindingof imatinib by a1-acid glycoprotein. Blood 2002; 100: 367–369.
Kobata A. Structures and functions of the sugar chains of glycoproteins.European Journal of Biochemistry 1992; 209(2): 483–501.
Kobata A. A journey to the world of glycobiology. Glycoconjugate Journal2000; 17: 443–464.
LaCourse WR and Johnson DC. Optimization of waveforms for pulsedamperometric detection of carbohydrates based on pulsed voltam-metry. Analytical Chemistry 1993; 65: 50–55.
Lee YC. High-performance anion-exchange chromatography for carbohy-drate analysis. Analytical Biochemistry 1990; 189: 151–162.
Lis H and Sharon N. Protein glycosylation: structural and functionalaspects. European Journal of Biochemistry 1993; 218: 1–27.
Lo-Guidice J-M and Lhermitte M. HPLC of oligosaccharides in glycobiol-ogy. Biomedical Chromatography 1996; 10: 290–296.
Lo-Guidice J-M, Wieruszeski J-M, Lemoine J, Verbert A, Roussel P andLamblin G. Sialylation and sulfation of the carbohydrate chains inrespiratory mucins from a patient with cystic fibrosis. Journal ofBiology Chemistry 1994; 269(29) 18794–18813.
McGuire JM, Douglas M and Smith KD. The resolution of the neutralN-linked oligosaccharides of IgG by high pH anion-exchange chroma-tography. Carbohydrate Research 1996; 292(4): 1–9.
Mellis SJ and Baenziger JU. Size fractionation of anionic oligosaccharidesand glycopeptides by high-performance liquid chromatography.Analytical Biochemistry 1983; 134(2): 442–449.
Mooney P, Hayes P and Smith KD. The putative use of a-1-acid glycopro-tein as a non-invasive marker of fibrosis. Biomedical Chromatography2006; 20: 1351–1358.
Okinaga T, Ohashi Y and Hoshi M. A novel saccharide structure, Xyl 1→3Gal 1→ (SO3
-)3, 4 Fuc→, is present in acrosome reaction-inducingsubstance of the starfish, Asterias amurensis. Biochemistry and Bio-physics Research Communications 1992; 186(1): 405–410.
Rademacher TW, Parekh RB and Dwek RA. Glycobiology. Annual Reviewsof Biochemistry 1988; 57: 785–838.
Rohrer J. Improved fractionation of sialylated glycopeptides by pellicularanion-exchange chromatography. Journal of Chromatography A 1994;667: 75–83.
Rohrer J and Avdalovic N. Separation of human serum transferrin iso-forms by high-performance pellicular anion-exchange chromatogra-phy. Protein Expression and Purification 1996; 7: 39–44.
Rohrer JS, Cooper GA and Townsend RR. Identification, quantification,and characterization of glycopeptides in reversed-phase HPLC sepa-rations of glycoprotein proteolytic digests. Analytical Biochemistry1993; 212: 7–16.
Routier FH, Housell EF, Rudd PM, Takahashi N, Bond A, Hay FC, Alavi A,Axford JS and Jefferis R. Quantitation of the oligosaccharides ofhuman serum IgG from patients with rheumatoid arthritis: a criticalevaluation of different methods. Journal of Immunological Methods1998; 213: 113–130.
Sasisekharan R and Myette JR. The sweet science of glycobiology. TheAmerican Scientist 2003; 91: 432–441.
Sears P and Wong C-H. Enzyme action in glycoprotein synthesis. Cellularand Molecular Life Science 1998; 54: 223–252.
Sim H-J, Jeong J-S, Kwon H-J, Kang TH, Park HM, Lee Y-M, Kim SY andHong S-P. HPLC with pulsed amperometric detection for sorbitol as abiomarker for diabetic neuropathy. Journal of Chromatography B2009; 877: 1607–1611.
Smith KD, Hounsell EF, McGuire JM, Elliott MA and Elliott HG. Structuralelucidation of the N-linked oligosaccharides of glycoproteins usinghigh pH anion-exchange chromatography. In Advances in Macromo-lecular Carbohydrate Research, Volume 1, Sturgeon RJ (ed.). Elsevier:Amsterdam, 1997.
Tomiya N, Kurono M, Ishihara H, Tejima S, Endo S, Arata Y and Takahashi N.Structural analysis of N-linked oligosaccharides by a combination ofglycopeptidase, exoglycosidases, and high-performance liquid chro-matography. Analytical Biochemistry 1987; 163(2): 489–499.
Townsend RR and Hardy MR. Analysis of glycoprotein oligosaccharidesusing high-pH anion exchange chromatography. Glycobiology 1991;1: 139–147.
Townsend RR, Hardy MR, Hindsgaul O and Lee YC. High-performanceanion-exchange chromatography of oligosaccharides using pellicularresins and pulsed amperometric detection. Analytical Biochemistry1988; 174: 459–470.
Townsend RR, Hardy MR, Cumming DA, Carver JP and Bendiak B. Separa-tion of branched sialylated oligosaccharides using high-pH anion-exchange chromatography with pulsed amperometric detection.Analytical Biochemistry 1989; 182: 1–8.
Van den Steen P, Rudd PM, Dwek RA and Openakker G. Concepts andprinciples of O-linked glycosylation. Critical Reviews in Biochemistryand Molecular Biology 1998; 33(3): 151–208.
Varki A. Diversity in the sialic acids. Glycobiology 1992; 2: 25–40.Varki A. Biological roles of oligosaccharides: all of the theories are correct.
Glycobiology 1993; 3: 97–130.Yule FSB, Watson J and Smith KD. In-vitro effects of a1-acid glycoprotein
on collagen fibril formation in rheumatoid arthritis. Pharmaceuticaland Pharmacological Communications 1999; 5: 507–510.
J. L. Behan and K. D. Smith
Biomed. Chromatogr. 2010View this article online at wileyonlinelibrary.com Copyright © 2010 John Wiley & Sons, Ltd.